 Ying Jin1*
 Guohai Situ1,2*
- 1Shanghai Institute of Optics and Fine Mechanics, Chinese Academy of Sciences, Shanghai, China
- 2Hangzhou Institute for Advanced Study, University of Chinese Academy of Sciences, Hangzhou, China
Combustion diagnostics play an essential role in energy engineering, transportation, and aerospace industries, which has great potential in combustion efficiency improvement and polluting emission control. The three-dimensional (3D) visualization of the combustion field and the measurement of key physical parameters such as temperature, species concentration, and velocity during the combustion process are important topics in the field of combustion diagnostics. Benefiting from the non-contact and non-intrusive advantages of the optical detection method as well as the advantages of the 3D full-field measurement of the measured field by computational tomography, flame chemiluminescence tomography (FCT) has the ability to realize non-intrusive and instantaneous 3D quantitative measurement and 3D full-field visualization of key physical parameters in the combustion process, which has crucial research significance in combustion diagnostics. In this study, we review the progress of FCT technique. First, we provide an extensive review of practical applications of FCT in state-of-the-art combustion diagnostics and research. Then, the basic concepts and mathematical theory of FCT are elaborated. Finally, we introduce the conventional reconstruction algorithm and proceed to more popular artificial intelligence-based algorithms.
Introduction
As a kind of complex reaction process, combustion phenomenon combines chemical, physical, and mechanical knowledge, which is accompanied by the formation of a large number of intermediate products such as OH*, CH*, and C2* radicals. It has been reported that CH*, C2*, and OH* radicals can be considered the critical parameters in the combustion process of hydrocarbon fuels as well as be intimately related to the combustion status (Gaydon and Wolfhard, 1953; Nori and Seitzman, 2008; Alviso et al., 2017; Navakas et al., 2018). As a consequence, with the aid of the detection and measurement of OH*, CH*, and C2* radicals in the combustion process, the diagnosis of combustion characteristics such as combustion components, combustion structure, temperature, velocity, pollution emissions, and the heat release rate of the combustion field can be realized, which will further facilitate the control of the combustion process and gain an in-depth understanding of the combustion reaction mechanism in the industrial fields of aerospace and energy (Kojima et al., 2005; Jeong et al., 2006; Orain and Hardalupas, 2010; Hossain and Nakamura, 2014; Sun et al., 2015; Ax and Meier, 2016).
During the combustion process, the radicals emit spectra of specific wavelengths from the excited state to the ground state, which is defined as the flame chemiluminescence spectrum (Gupta et al., 1999). For instance, the chemiluminescence spectrum measurement of high-temperature propane flame has been provided in Gupta et al. (1999). On account of the flame chemiluminescence spectrum being the inherent optical property of flame in the combustion process, the measurement of flame chemiluminescence spectrum becomes the most straightforward strategy to analyze the combustion properties (Griffiths and Barnard, 1995; Kathrotia et al., 2012). Compared to the commonly employed methods in combustion diagnostics, such as the laser induced fluorescence (LIF) technique (Daniele et al., 2013; Wellander et al., 2014; Lee et al., 2015) and the particle image velocimetry (PIV) technique (Weinkauff et al., 2013; Liu et al., 2018; Liu and Ma, 2020), flame chemiluminescence spectrum technology eliminates the demand for an external detection source and the requirement of spreading tracer particles in the tested flame. Flame chemiluminescence spectrum technology focuses on the wavelength of specific radicals; the intensity of radicals can be accessed directly after filtering and acquiring via industrial cameras or optical fiber detectors. Furthermore, in contrast with spatial single-point or planar detection methods, the chemiluminescence 3D imaging strategy shows better performance in full-field 3D quantitative visualization and detection of crucial physical parameters in a complex combustion phenomenon, not only in modern aviation, aerospace, and military fields, for instance, the 3D combustion structure detection of rocket motor exhaust flames, but also for a wide range of industrial and civil applications, such as energy engineering of an industrial power plant boiler chamber and high-temperature cutting and smelting. As a consequence, benefited by the non-contact, easy implementation, and simple arrangement of the experiment setup as well as full-field measurement ability, chemiluminescence 3D imaging tactics has attracted a lot of attention in the field of combustion diagnostics.
In a bid to achieve 3D visualization as well as measurement of the combustion field, computerized tomography (CT) technology is used and integrated with the flame chemiluminescence spectrum method, and then the flame chemiluminescence tomography (FCT) technique is developed (Sebald, 1980; Melnikova and Pickalov, 1984; Iwama et al., 1989). With the advantages of the non-contact and non-intrusiveness of the optical detection method and the ability of 3D full-field measurement of CT, FCT is capable of achieving both instantaneous 3D quantitative measurement and full-field visualization of key physical parameters in the combustion field, which has essential research significance in combustion diagnostics. Recently, with the continuous advancement in the performance of photoelectric detection equipment and the tremendous improvement of computing power, numerous scholars have carried out extensive research in the acquisition and calibration of multidirectional projection data, the establishment of projection models, and the improvement of 3D reconstruction algorithms of FCT.
In order to provide a comprehensive review of flame chemiluminescence-based tomographic imaging and technology, the remainder of this article is organized as follows: the applications of FCT in practical combustion diagnostics are given in Section 2. Section 3 focuses on background information of FCT and begins with concepts of the projection model before presenting an explanation of projection acquirement as well as multi-view calibration; Section 4 depicts the mathematical formulation of the reconstruction algorithm of tomographic inverse problem; furthermore, Section 5 concludes the review with a summary and an outlook on the potential developments of FCT in the future.
Application of FCT
FCT technique has been extensively employed in practical combustion measurement of laboratory and industry to provide key insights into flame physics. This section surveys four main aspects of application of FCT, including combustion status, geometric measurement, temperature measurement, and propagation speed measurement.
Combustion Status
The chemiluminescence intensity of excited OH*, CH*, and C2* has been reported having maxima of the flame spectra at 309, 431.5, and 516.5 nm, respectively (Gupta et al., 1999). Many scholars focus on the measurement of OH*, CH*, and C2* concentration and pay extensive attention to figure out the relationship between the measured chemiluminescence and flame combustion status with various experimental conditions, such as the equivalence ratio and fuel type in practical systems.
The relationship between the intensity ratios (C2*/CH*, C2*/OH*, and CH*/OH*) of methane/air partially premixed flame with different equivalence ratios were investigated and compared with the results of a photomultiplier tube (PMT) in the study by Y. Jeong. Abel inversion was applied here to reconstruct cylindrically symmetric flame to yield 2D “slices” (Jeong et al., 2006). Likewise, Denisova et al. (2013) attempted to reconstruct the spatial distributions of CH*, OH*, and C2* chemiluminescence of axisymmetric as well as non-axisymmetric flames to further monitor the fuel–air ratio and completeness of combustion. Similarly, Liu et al. (2020) employed intensified-CCD and the Abel inversion method to retrieve 2D radial distribution of chemiluminescence characteristics of OH* and CH* in a low swirl burner with the equivalence ratio varying from 0.8 to 1.2. Analogous work has been mentioned in D. Sellan’s research. The OH*/CH* signals of a swirl-stabilized axisymmetric flame with changing equivalence ratios were measured and reconstructed by Abel inversion (Sellan and Balusamy, 2021).
In contrast to aforementioned 2D reconstruction, taking the transmissivity of a customized double-channel band-pass filter and a color camera into account, Y. Jin et al. proposed a quantitative multispectral separation technique to realize both CH* and C2* intensities. As seen in Figure 1, the dynamic 3D chemiluminescence emission structure of CH* and C2* were reconstructed simultaneously. Afterward, quantitative analysis of CH* and C2* components was conducted in details (Jin et al., 2017).
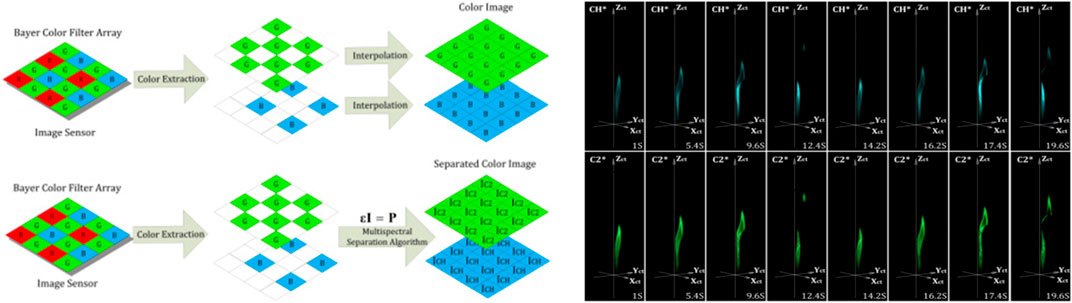
FIGURE 1. Multispectral separation algorithm and 3D radical distribution of CH* and C2*. Adapted with permission from Jin et al. (2017) © The Optical Society.
Temperature Measurement
The measurement of flame temperature plays an essential role in combustion diagnostics and is necessary to access an in-depth understanding of combustion physics. Several methods have been utilized for flame temperature measurements, such as LIF, moiré deflection, and tunable diode laser absorption spectroscopy (TDLAS) (Kaminski and Kaminski, 2014). However, limited by the complex arrangement of the aforementioned technique, they are somehow unsuitable for industrial requirement. With the increasing employment of the FCT method, it also gives a potential tactic for recovering 3D flame temperature distribution.
On the basis of two-color pyrometric techniques and optical CT theory, 3D temperature and emission distributions of propane flame were reconstructed simultaneously by M. M. Hossain. In their study, two RGB CCD cameras coupled with eight OFB were used to acquire flame images. Red and green components were extracted to further achieve temperature and emission measurements in view of the two-color method (Hossain et al., 2013). Similar methods were reported in Brisley et al. (2005). Also, double-wave spectral tomography was adopted to retrieve distribution features of the 3D temperature field. Different from the aforementioned studies, Gao et al. (2010) established an orthographic CCD array coupled with the narrowband filters (central wavelength: 696.5 and 763.5 nm) to acquire images via four views. Using 4D temperature measurements a weakly turbulent diffusion flame was studied in the same way in Yu et al. (2021). Recently, Y. Liu et al. proposed a light-field sectioning pyrometry (LFSP) method which combined light-field imaging and color ratio pyrometry (CRP) to achieve in situ temperature measurement of ethylene flame. Moreover, the spatial resolution of reconstruction was improved in lateral and depth directions based on their cage-typed light-field camera (Liu et al., 2021a; Shi et al., 2022).
Geometric Measurement
Flame geometrical characteristics give instantaneous information on the quality of the combustion process. The monitoring and measurement of flame geometric are essential for deepening the understanding and optimizing the combustion conditions. Benefiting from the rise of 3D tomography technology, FCT technique has been a promising tactic for providing 3D whole-field geometric measurement of the flame, which is generally impossible by using traditional 2D measurement methods.
Several parameters, such as orientation, volume, length, surface area, and circularity, were defined to characterize the flame geometry by H. C. Bheemul. Combined with the mesh-generating technique and the FCT method, a ‘fishnet’ was generated to cover the flame surface. The aforementioned geometric parameters were measured and analyzed based on 3D reconstruction results of the diffusion flame (Bheemul et al., 2002). By means of FCT, T. D. Upton investigated structural details of a turbulent, premixed propane/air flame. The 3D flame front and 2D contours were recovered with high resolution (Upton et al., 2011). It is worth pointing out that 3D flame topography and curvature were inspected in detail by L. Ma. The projections of premixed turbulent Bunsen flame were captured from six perspectives at a rate of 5 kHz. Probability density function (PDF) of flame topography was derived from a series of 3D reconstruction results, and the calculation of flame curvature was achieved in Ma et al. (2016). Recently, R. Dong focused on the relationship between flame edge deformations and oscillations. The 3D instantaneous flame edge structures with fine-scale corrugations were retrieved using the FCT tactic, which enabled the observation of small vortices’ evolution (Dong et al., 2021a). An analogous strategy was employed in 4D fire events imaging for temporal evolution of flame (Windle et al., 2021).
Flame Propagation Speed Measurement
Flame propagation speed plays a crucial role in combustion diagnostics owing to the straightforward reflection of flame stabilization. Generally, flame propagation speed refers to the moving speed of the flame surface in the combustion process, which is also called the absolute flame velocity in some cases. In contrast to the commonly used tactic for velocity measurement, such as PIV and PLIF methods, the FCT technique shows privileged advantages in the measurement of flame propagation speed, owing to the successful application in geometric measurement.
The flame propagation and local burning velocity of a propane/air turbulent flame were investigated in Ishino et al. (2009). A set of flame images were acquired from 40 views with a short time interval to reveal the 3D distributions of the turbulent flame and to further calculate the local burning velocity. On the basis of geometric measurement of two non-axisymmetric premixed flames, Wiseman et al. (2017) depicted the surface speed measurement algorithm and especially focused on the influence of the number of perspective. Considering the frequently used surface fitting and normal vectors methods being not suitable for turbulent flame of laboratory, Y. Chi proposed two novel methods to deal with this problem. Numerical and experimental validations on the turbulent jet flame were conducted. Meanwhile, the relationship between the flame curvature and the propagation speed was analyzed (Chi et al., 2021). Recently, Liu et al. (2021b) concentrated on the influence of the external direct current electric field on the propagation speed of swirl flames. With the help of FCT strategy, the velocity vectors and magnitude contours at various horizontal cross sections were accessed.
Background Information
In this section, some background information about FCT are presented, including a brief demonstration of the acquirement of projections, an introduction to the multi-camera calibration method, and several kinds of projection models often employed for FCT research.
Acquirement of Projections
In FCT practical measurement, the acquirement of projections of the test field is the fundamental for further tomography reconstruction. According to the different combustion state of the test field, the achievement of projections acquisition in practical experiment can be divided into two categories: single directional arrangement and multidirectional arrangement.
A single directional arrangement can be utilized to reveal an axisymmetric flame. Based on the assumption of rotational symmetry of the laboratory-scale flame in their study, Brisley et al. (2004) developed a single monochromatic CCD camera instrumentation system to complete the 3D temperature measurement of a gaseous flame. Similarly, in order to investigate the partial premixing effects of a laminar CH4–air flames with different equivalence ratios, an intensified charge-coupled device (ICCD) system was presented by Jeong et al. (2006) to detect OH*, CH*, and C2* radicals and tomographic reconstruction. Furthermore, the single directional acquirement assembly could be capitalized on stable flame tomographic measurement, which can be achieved by rotating the test flame. Hertz and Faris (1988) proposed a simple experiment setup and sequentially recorded the projections of a steady-state Bunsen flame by rotating for recovering CH* emission distribution. Although the single-direction projection acquisition system has a simple structure as well as low cost, it is only applicable for test flame with good axial symmetry or stable-state combustion measurement, which is not suitable for instantaneous non-axisymmetric and unstable flame tomographic experiments.
Benefited by the rapid development of optical sensing and computing power, simultaneous multidirectional projection acquirement can be realized. H. C. Bheemul and coworkers built a detection system with three monochromatic CCD cameras to visualize and quantitatively demonstrate the gaseous flames. In their study, three CCD enclosed the burner with equidistance and an equal angle and obtained the 2D projections of the flame simultaneously from three different views (Bheemul et al., 2002). Moreover, a 10 direction Kepler telescopes tomographic system was reported by Anikin et al. (2010) to measure the OH∗-chemiluminescence distribution of diffusion as well as premixed flames, respectively. L. Ma et al. reported a five CMOS camera arrangement to record CH* chemiluminescence simultaneously and further retrieved the instantaneous structures of McKenna burner and jet flame volumetrically (Cai et al., 2013a; Li and Ma, 2014; Li and Ma, 2015). A 24-view acquirement setup was proposed by Mohri et al. (2017) to investigate the strengths of the FCT technique in a real highly turbulent swirl flame measurement. It is worth noting that a semicircular shape of cameras equipped with forty small high-performance lenses was designed by Ishino et al. (2005); Ishino and Ohiwa (2005); Ishino et al. (2007); and Ishino et al. (2009). On the basis of their famous forty-lens equipment, further expansion has been applied to achieve a 158-lens FCT system, which was awarded the Guinness world record in 2009 (Ishino et al., 2011).
Additionally, multidirectional capture could be accessed by the combination of a camera and a mirror. GilabertLuYan et al. (2007) established a special imaging system incorporating three identical RGB cameras and an optical transmission unit and captured flame projections concurrently from six perspectives. Similarly, combined with a mirror array, Upton et al. (2011) presented a six camera optical system to collect a turbulent premixed flame projection data from 12 views for 3D reconstruction. Floyd and Kempf (2011) demonstrated an instantaneous computed tomography of the chemiluminescence (CTC) experimental setup, which comprises five cameras and mirrors providing two perspectives for each camera. As demonstrated in Figure 2C, Wei presented a high-speed FCT system which included three customized mirror–prism–camera blocks to capture multiple projections of an unconfined turbulent swirl flame from distinct views (Yu et al., 2018a; Ruan et al., 2019).
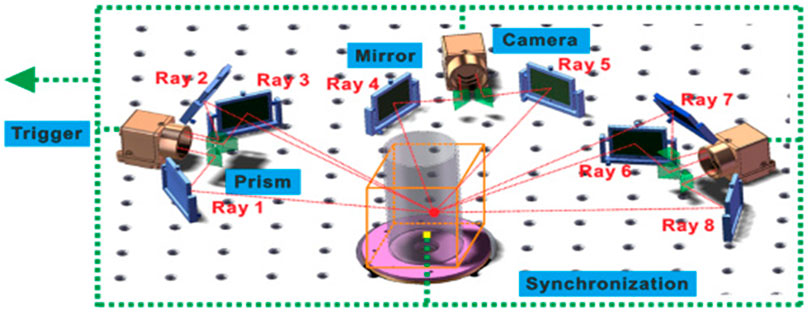
FIGURE 2. Multidirectional system with mirror–prism–camera blocks. Adapted with permission from Yu et al. (2018a) © The Optical Society.
With the expeditious development of optical fiber technology as well as the advantage of an excellent optical waveguide property, devices based on the optical fiber and industrial cameras have also become a way of multidirectional projection acquisition for FCT. Considering the complex arrangement of multi-camera system, G. Lu et al. designed an imaging fiber-based FCT system coupled with two cameras to acquire flame projections simultaneously from eight fiber bundles around the burner (Hossain et al., 2011; Moinul Hossain et al., 2012). Wan et al. (2009; Wan et al. (2013) established an optical fiber bundle tomography (OFBT) system consisting of four telecentric lens and a number of fiber bundle units. Similarly, W. Cai et al. developed a variety of endoscopy-based multidirectional FCT projection acquisition systems (Yu et al., 2018b; Liu et al., 2019a; Liu et al., 2019b; Yu et al., 2019a; Yu et al., 2019b). As indicated in Figure 3A, two synchronized cameras equipped with customized fiber bundles were utilized to obtain the Bunsen flame projections from eight views simultaneously. In order to maximize the differences between flame projections, eight input fiber bundles were arranged in nearly an equiangular manner in a circular shape (Yu et al., 2018b). A nine inputs optical fiber bundle-based experimental setup was proposed by Q. Lei et al. to transmit the CH* chemiluminescence signals of the swirl flame in the gas turbine to one high-speed camera (Dong et al., 2021b; Rising et al., 2021). Recently, considering the drawbacks of FBT of low SNR imaging and signal diminishment with various equivalence ratios, C. Rising et al. proposed a filter-intensified FBE approach to capture the CH* radical and obtained more precise reconstruction results (Ishino and Ohiwa, 2005).
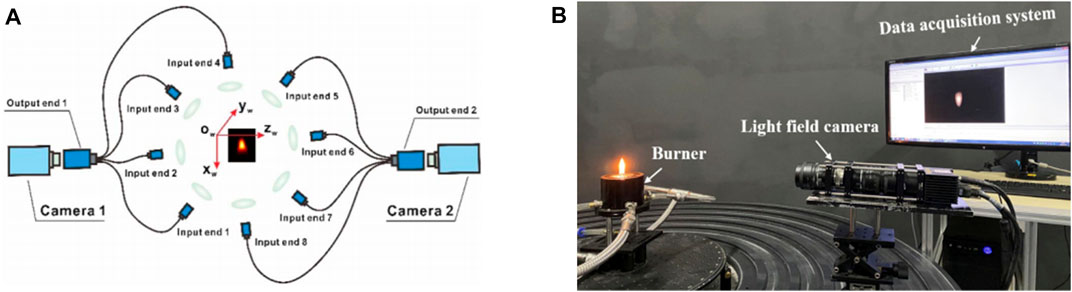
FIGURE 3. (A) Schematic of the endoscopic multidirectional FCT system. Adapted with permission from Yu et al. (2018b) © The Optical Society. (B) Experimental setup of the light-field imaging system. Adapted with permission from Qi et al. (2021a) © The Optical Society.
Recently, taking into account the complexity of installing and operating multidirectional FCT system, as shown in Figures 3B,C. Xu et al. designed a cage-typed light-field camera (LFC) system and conducted a series of studies on 3D reconstruction of flame temperature distribution under different combustion operating conditions, including the improvement of spatial resolution as well as the reduction of sampling redundancy (Liu et al., 2017a; Zhao et al., 2018; Liu et al., 2021a; Qi et al., 2021a). Likewise, a light-field camera was used in H. Qi’s study. Based on their light-field convolution imaging model, multidimensional radiation information of the flame was collected by LFC, and 3D temperature distribution was further retrieved (Qi et al., 2021b; Niu et al., 2021; Shi et al., 2022).
Calibration of Multi-Camera
The measurement of the spatial positions of multiple acquirement directions and the internal parameters of camera play a critical role in FCT research. View registration is able to unify the placement and orientation of each camera into the same world coordinate system, which have a significant effect on following reconstruction quality.
The spatial location of multiple cameras was generally roughly determined by a very simple angle determination device in previous research. An illuminated alignment tool was utilized in T. D. Upton’s study to determine the angular viewing directions, image orientation, and image magnification of a 12 view FCT system. The numbers near the bottom of the tool was separated azimuthally by π/12 radians to indicate the orientation of different projections (Upton et al., 2011). Similarity, J. Floyd et al. employed a cylindrical calibration object to locate the view angles by the scale affixed around the circumference (Moinul Hossain et al., 2012). Additionally, the rectangular object in target contributed to locate the object domain center in each perspective. However, the aforementioned calibration methods can only roughly determine the spatial location of the camera. For the sake of improving the spatial resolution and reconstruction precision of FCT technology, there is an urgent need to develop a more flexible and accurate multi-camera calibration technology.
In the field of computer vision, a large number of studies have been reported on the camera calibration of internal and external parameters (Remondino and Fraser, 2006; Zhang, 2000; Zhang, 1999; Hwang et al., 2013; Huang et al., 2019a). Generally, the commonly used camera calibration method is mainly based on the pinhole camera model, and the spatial position as well as internal parameters of the camera is determined by 2D checkerboard. First, the world coordinate system is established. As a consequence, the position of the corner points of checkerboard in the world coordinate system can be determined. Next, the images of checkerboard are captured via camera from various views. On the basis of the image processing algorithm, the identification and location confirmation of the corner points in the camera image coordinate system are completed. Finally, the internal and external parameters of the camera are derived from the world coordinates and image coordinates of the corner points. Worth and Dawson (2012) utilized a custom-made calibration plate to accomplish the view registration in OH* chemiluminescence measurement of two interacting turbulent flames. Plate images were recorded at translation positions corresponding to the measurement volume. World and image coordinates for each camera were established and related via a third-order polynomial calibration function. L. Ma et al. adapted 2D check board and an open source camera calibration tool of MATLAB to complete the view registration of the multiple fiber-based endoscopes tomography system (Worth and Dawson, 2012; Kang et al., 2014). Likewise, in order to figure out the geometrical relationship between the reconstruction domain and flame projections, 2D check board was applied in W. Cai’s research and placed in the burner’s position to conduct the view registration process (Liu et al., 2019a; Yu et al., 2017). Furthermore, J. Wang et al. proposed a 3D pattern with dot arrays for the camera calibration of the multidirectional FCT system. As illustrated in Figure 4, three specified points on the surface were used to indicate the focus level of cameras (Wang et al., 2015; Wang et al., 2016a). Nonetheless, the accuracy of this approach is limited by the manufacturing precision of calibration object. Recently, without the special calibration object, Cai et al. (2020) developed a convenient multi-view registration method that capitalized on a synergistic combination of rotating calibration plate and multi-view stereo vision.

FIGURE 4. 3D view registration object.
Additionally, a number of combustion phenomena of practical environment happen in a confined space, which means the light refractions fostered by the imaging through optical walls will seriously influence the imaging process, and further result in the degradation of calibration precision. As a consequence, the developed view registration method based on an open space will be not applicable for the confined-space problems. In view of this question, Falkhytten (2018) presented a polynomial camera calibration model to address view registration in the FCT system for annular combustion chambers. However, the polynomial calibration model does not indicate a clear physical meaning. Meanwhile, higher-order polynomial functions are often required to ensure higher calibration accuracy, which inevitably introduces a large number of fitting parameters and computational consumption in the computational model. On the basis of the calibration model that takes into account the refraction effect of cylindrical glass (Paolillo and Astarita, 2019), H. Liu et al. proposed a refined model combined with the pinhole camera model with Snell’s laws in a swirl flame measurement confined within a 20 mm thick glass. In their strategy, the reverse ray-tracing approach was utilized to incorporate the effects of light refraction (Liu et al., 2019c). As indicated in Figure 5, inspired by the study of Liu, a new algorithm was built by Ling et al. (2020) to figure out the ray tracing of the reconstructed domain through the optical cylinder to overcome the time consumption of multiple iterations.
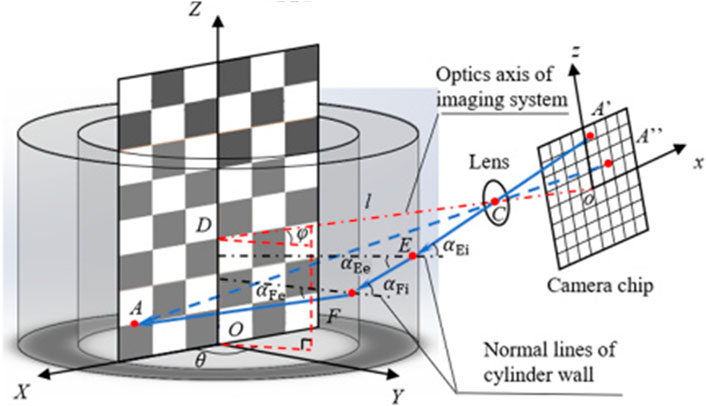
FIGURE 5. Reversed ray-tracing model with the optical cylinder. Adapted with permission from Ling et al. (2020) © The Optical Society.
Projection Model of FCT
In order to describe the relationship between the reconstructed domain and the corresponding image, a large and growing body of literature has investigated the establishment of the projection model of FCT. Generally, the reconstructed domain is discretized into several voxels with equal size, and different projection models depict various calculation methods of the weight factor, which refer to the contribution by each voxel to the pixels of the image plane.
To date, the parallel projection model is one of methods adopted in FCT research. Based on the parallel projection model, the light intensity value of pixels on the camera image plane can be considered as a linear integration of the light intensity along the parallel projection direction, as shown in Figure 6A (Floyd, 2009). In this context, the weight factor represents the intersection length of the light line and the pixel. However, considering the discrete measurement of each perspective has an associated bin width, and strip integrals are a more appropriate way to calculate the weight factor. Taking into account the limitation of computing resources, the original calculation of the weight factor based on strip integration adopted a binary approximation tactic, which means when the center of a pixel was within the boundary of the strip, a unity value was given to the weight factor; otherwise, the weight factor was set as zero. However, this assumption leads to salt and pepper noise in the reconstruction result. As indicated in Figure 6B, with the development of computer technology as well as the increase of computing power, the calculation of the weight factor becomes available by dealing with the exact intersection area (2D) or volume (3D) of the projection beam and pixels (Floyd, 2009). In 1990, Deutsch (1990) of Placer Dome Inc. designed the FORTRAN program to achieve the calculation process. In the light of the aforementioned theory and two-color pyrometric techniques, Hossain et al. (2013) investigated the 3D temperature and emissivity distribution of the laboratory-scale gas-fired flame.
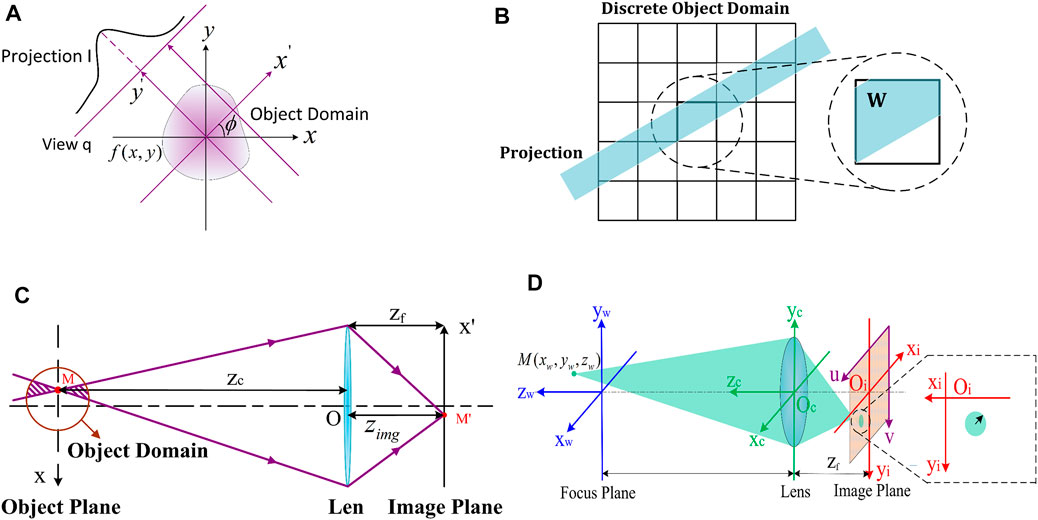
FIGURE 6. (A) Schematic of projection based on line integrals. (B) Example of the calculation of weight factor by the exact intersection area. (C) Diagram of the conic projection model. (D) Light propagation of a single voxel to the image plane.
However, the most widely used projection acquisition devices in FCT are industrial cameras, and the impact of the perspective effect of camera lens on the imaging process becomes particularly important and non-negligible, especially when the depth-of-field of the camera is small or the reconstruction domain is large. In this case, the description of the imaging process based on the parallel projection model is not suitable. An alternative projection model was presented in light of a weighted double cone, derived from geometric optics to provide a complimentary modification, which is able to use non-parallel projections to account for perspective effects. Figure 6C briefly demonstrates the light propagation of a point source in the reconstructed domain through the lens to the image plane (Floyd, 2009). It is noticeable that the light intensity of point p on the image plane can be obtained by summing the intensity in two conical regions before and after point v on the object plane, instead of the simple approximation of the linear integration of the light intensity along the projection ray (Floyd, 2009; Anikin et al., 2010). Walsh et al. (2000) paid special attention to analyze the influence of a perspective effect of the camera lens on the reconstruction results of an axisymmetric diffusion flame measurement. However, Walsh’s study predominantly focused on considering the reconstruction field with axisymmetric distribution and within the depth-of-field of the camera; as a consequence, the weight factor of all voxels located within the cone region was uniformly simplified to 1. In essence, for the voxel located outside the depth-of-field of the camera, it cannot be clearly imaged on the image plane, and in this regard, the weight factor of this voxel can no longer be treated as 1.
In view of the perspective imaging effect, J. Floyd et al. established a 3D projection model considering the depth-of-field effect of lens, which involved the blurring effect of the reconstructed domain outside the depth-of-field range of lens in the imaging process. The weight factor in this projection model can be obtained as follows: first, the cone area of the 3D reconstructed domain corresponding to the pixel on the image plane is determined according to the ray-tracing method; secondly, the position on the image plane of each spatially discrete voxel within the cone area is analyzed; and finally, the weight factor of a voxel to the pixel on image plane is procured via estimating the intersection area of the imaging blur circle with the pixel. Their model was validated in the measurements of a methane–oxygen matrix burner as well as a turbulent opposed jet flame. Furthermore, the instantaneous flame-surface density, wrinkling factor, flame normal direction, and heat release were figured out (Floyd et al., 2009; Floyd and Kempf, 2011; Floyd et al., 20112011). As illustrated in Figure 6D, on the basis of Floyd’s study, Wang et al. (2015) developed a 3D projection model including light collection effect of lens. Additionally, the relationship between the camera pixel and the blur circle was analyzed in detail to provide a more complete calculation of the weight factor, as can be seen in Figure 7A. However, it is inevitable that some image spots appear within a pixel while some out of the corresponding circle in the practical imaging process. As a result, the ignored weight factors in such circumstances always cause information missing, which influence the quality of further reconstructions. For the sake of overcoming the drawback of the simplified calculation model, Jin et al. (2016a) presented the equal area and the sub-pixel calculation model of weight factor, respectively, as demonstrated in Figure 7B. Moreover, K. Wang et al. further investigated the performance of clear-imaging, out-of-focus imaging, and deconvolution models, as indicated in Figure 7C. Considering the bokeh effect, the deconvolution model provided the best precision with low computational time (Wang et al., 2017). However, the aforementioned models are on the basis of the uniform distribution of voxel, which further leads to the large gradient between neighboring voxels and certain discretization errors. In light of the finite element and interpolation operation, Liu et al. (2021c) estimated the distribution within each voxel to defeat uniform voxel problem.
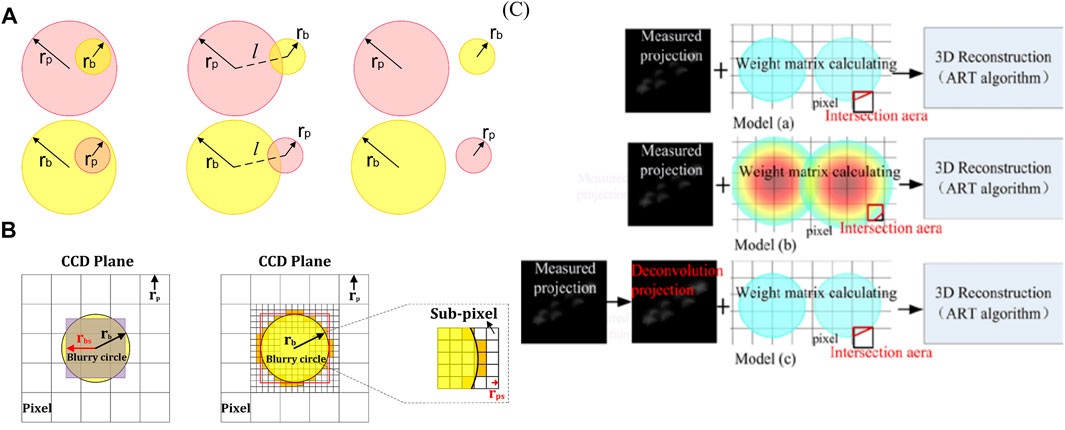
FIGURE 7. (A) Diagram of the relationship between camera pixel and the blur circle. (B) Demonstration of the equal area and the sub-pixel calculation model of weight factor. (C) Schematic diagram of clear imaging, out-of-focus imaging, and deconvolution imaging projection models. Adapted with permission from Wang et al. (2017) © The Optical Society.
Likewise, the point spread function (PSF) was utilized in W. Cai’s study to represent the projection formed by a point-source located at the reconstruction domain, which was only related to the location angle and position of the acquisition device rather than the intensity distribution of the reconstruction domain. Meanwhile, the projections that the camera acquired in the image plane were composed of the summation of all voxels in the reconstruction domain with the interplay of respective PSF (Cai et al., 2013b). A large number of statistical calculations were carried out that capitalized on the Monte Carlo statistical method, and finally the weight factor of one voxel was figured out (Cai et al., 2013a; Li and Ma, 2014). However, the tremendous demand of computing power and relatively low computational efficiency inevitably become the drawback of the Monte Carlo statistical method. In contrast to Cai’s method, M. Wan et al. applied the low-discrepancy sequence of the Monte Carlo method instead of the pseudorandom sequence to achieve the Meker burner flame measurement with higher reconstruction accuracy (Wan et al., 2015). Furthermore, by combining the ray-tracing technique and the Monte Carlo method, Wan and Zhuang (2018) took the inhomogeneous distribution of captured radiance on the image plane into account and analyzed the performance numerically.
Reconstruction Algorithm
Apart from the projections acquirement and imaging model establishment, another research focus is the reconstruction algorithm of FCT. As a branch of optical tomography, the reconstruction algorithm of FCT is also derived from the algorithm study of X-ray CT (Beister et al., 2012). On the other hand, due to the different experimental conditions of practical combustion diagnostics and limitation of optical access, the reconstruction of FCT belongs to incomplete data reconstruction problem. Numerous scholars have conducted extensive research in reconstruction algorithm of FCT. This section reviews the mainly employed reconstruction algorithm: analytical and iterative types. Finally, the emerging artificial intelligence-based reconstruction algorithm of FCT is depicted as well.
Analytical Reconstruction Algorithm
Analytical reconstruction algorithm is separated into Abel Inverse Transform, Radon Inverse Transform and Filtered Back Projection (FBP) method. Abel Inverse Transform is commonly utilized to tackle axisymmetric reconstruction fields. For instance, Y. K. Jeong et al. investigated the combustion structure of axisymmetric methane flame relied on Abel Inverse Transform (Jeong et al., 2006). The traditional 2D Radon Inverse Transform is usually divided into three steps: partial differentiation, Hilbert Transform and inverse projection. On the basis of Radon Inverse Transform, S. Cha and C. M. Vest reconstructed the asymmetric refractive index fields (Vest, 1974; Cha and Vest, 1979). Meanwhile, it was proven that the reconstruction process of Abel Inverse Transform and Radon Inverse Transform are equivalent on the condition of axisymmetric field.
In contrast to the Radon Inverse Transform, the FBP method is more representative of analytical reconstruction algorithm. The FBP method introduces Fourier Transform in Radon Inverse Transform to reduce this blurring in the reconstruction by filtering each perspective before the back projection step. Eq. 1 describes how a point
The analytical reconstruction algorithm generally requires numerous low noise views for successful reconstruction. In consequence, it is utilized extensively in applications where static subjects and good access are available, which means many measurements can be taken and is generally less favored in the incomplete data reconstruction problem. In contrast, the iterative class reconstruction algorithm is more robust to the effect of noise in the reconstructed data and is therefore more favored by scholars in the field of CT reconstruction. In contrast, the iterative reconstruction algorithm is more robust to the effect of noise in data and is therefore more commonly utilized in FCT reconstruction.
Iterative Reconstruction Algorithm
The fundamental of iterative reconstruction algorithm is discrete reconstruction domain F as well as the projection data I. According to the weight matrix W, the connection between the reconstruction domain and projection data could be established in Eq. 2. F is divided into N discrete voxels in the reconstruction domain. The voxel indices are represented by the single index i, j is defined as the index of projection direction of
In accordance with the solution method of the system of equations, iterative reconstruction algorithms are divided into direct algebraic and algebraic iterative methods. Meanwhile, the direct algebraic methods consist of inverse and decomposition methods. The inverse method refers to reconstructing the field by computing the inverse of the weight matrix (Hartley, 1994), while the decomposition method decomposes the weight matrix into several specific matrices and recovers the reconstruction field in view of the properties of these specific matrices, such as singular value decomposition (SVD) (Selivanov and Lecomte, 2001) and QR decomposition (Iborra et al., 2015). Considering that the dimension of the weight matrix W is determined by both the number of voxels in the reconstruction domain and the number of projection data, which is too large to apply direct algebraic methods, it is more practical to use an algebraic iterative method to find an approximate solution for system of equations.
The most widely used iterative algorithm is called the algebraic reconstruction technique (ART). The original ART algorithms were proposed by Gordon and Herman (1971), and it was found to be a special case of the well-known Kaczmarz algorithm of integral equation (Guenther et al., 1974). In concept of ART, Ij is treated as a hyperplane in the solution space of the system of equations. Therefore, the number of projections determines the number of hyperplanes. If the system of linear equations is noiseless and compatible, the unique solution could be accessed when all hyperplanes intersect at a point. As seen in Figure 8A, the three projection rays, L1, L2, and L3, represent three equations. The intersection point of three rays is the solution of the system of equations. An arbitrary initial value
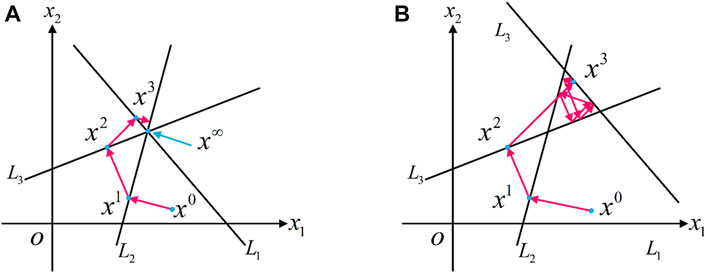
FIGURE 8. (A) Diagram of compatible equations. (B) Diagram of incompatible equations.
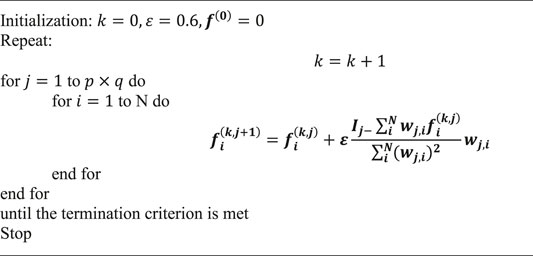
Figure 9 indicates the working principle of the ART algorithm on a simple 2 × 2 tomographic problem with four perspectives. FCT problem is demonstrated in upper left panel, where the numbers represent the measured projections and the values of object domain are calculated according to the measured projections. In step 1, the initialization of object domain is completed and the values are designed as 0; next, the differences between the initial and measured projections are defined as e and calculated for each view; in step 3, e is distributed evenly along the perspective to update the value of object domain; the calculation and distribution of e are repeated in step 4 and step 5 until the termination criterion is met. Generally, the update of object domain can stop when the difference e is smaller than the designed error, while the ART algorithm can be considered as convergence.
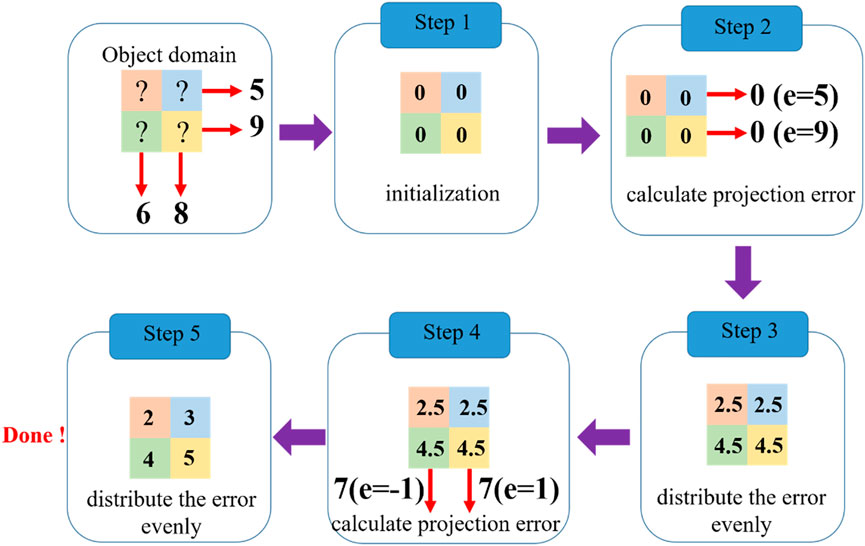
FIGURE 9. Working principle of the ART algorithm on a simple 2 × 2 tomographic problem.
The iteration process of ART is shown in Eq. 4.
where
Furthermore, the pseudo-code for the ART algorithm is provided to illustrate the work process.
As a variation of ART, multiplicative algebraic reconstruction technique (MART) not only changes the correction method of the initial value, which means the iterative results can be updated multiplicatively during the iteration process, but also maximizes the entropy of reconstruction domain. It is worth noting that the entropy mentioned here is in the context of information theory not thermodynamic entropy (Floyd, 2009). MART shows better performance on improving iteration speed. Especially for reconstruction fields with high gradient, MART is capable of giving superior reconstruction quality (Verhoeven, 1993). Eq. 5 shows the expression of MART given by Verhoeven (1993), as follows:
It is worth mentioning that the multiplicative correction of MART causes the values of the voxels with zero in the reconstructed domain to remain unchanged. Therefore, the widely used initial estimate of zero in ART is not appropriate and the mean value of projections is suggested to be more suitable for MART (Floyd, 2009).
Additionally, another kind of ART algorithm called simultaneous algebraic reconstruction technique (SART) is proposed by A. H. Aderson. Compared with standard ART algorithm, SART tackles all the error from a single projection simultaneously, instead of view-by-view. This operation averagely reduces the error oscillation when two adjacent projections consecutive correct the same pixel and shows better noise immunity (Andersen and Kak, 1984). As seen in Eq. 6, SART can be achieved by correcting standard ART of one view
The ART algorithm has been extensively used in reconstruction problem of FCT. Numerous scholars (L. Ma, Y. Ishino, G. Lu, M. M. Hossain, W. Cai, to name a few) have conducted comprehensive research in the feasibility and reliability of ART via numerical simulation as well as practical experiments (Wang et al., 2016b; Lei, 2016; Ma et al., 2016). For instance, T. Yu investigated multiple kinds of series expansion reconstruction algorithm on the basis of previous study of ART (Liu et al., 2017b). S. M. Wiseman and J. Zhuan employed MART as well as SART separately to inspect the 3D combustion structure (Wiseman et al., 2017; Wan and Zhuang, 2018).
Although the ART algorithm has become the conventional method for FCT reconstruction, but the limited optical accessibility of practical applications results in the inversion problem of FCT is ill-posed mathematically. As a consequence, the inevitable line artifacts introduced by ART will certainly affect the further reconstruction quality. It is worth mention that novel reconstruction algorithms have been developed in terms of the utilization of the additional information on the reconstruction field, which can be treated as the a priori information incorporating into the iteration algorithm to mitigate the ill-posed problem (Ma and Cai, 2008). For instance, profited by Tikhonov’s regularization, Zhou et al. measured the 3D temperature distribution of a large-scale furnace numerically and experimentally (Zhou et al., 2005). Similarly, Daun et al. applied Tikhonov’s regularization to reconstruct the axisymmetric flame properties (Daun et al., 2006). Häber et al. retrieved the tomographic multispecies visualization of laminar and turbulent methane/air diffusion flames based on a kind of variation Tikhonov’s regularization (Häber et al., 2020a; Häber et al., 2020b). As another type of priori information of temperature field, Total Variance (TV) indicates the sparseness of field (Cai et al., 2013b; Yu and Cai, 2017; Dai et al., 2018). Compared with Tikhonov’s regularization, TV regularization shows better performance in preserving sharp discontinuities between distinct regions of reconstruction domain, which is capable for providing representative features of combustion such as the flame front (Rudin et al., 1992; Strong and Chan, 2003). TV regularization was utilized for practical FCT applications and its ability of significantly reducing the typical line artifacts was proved numerically and experimentally (Jin et al., 2021). Furthermore, the regularization minimizing p-norm (0 < p < 1) was applied to enhance the spatial resolution in photoacoustic (PA) tomography (Okawa et al., 2020). A weighted Schatten p-norm minimization was proposed by Xu et al. for reconstruction issue of sparse-view cone beam computed tomography (CBCT) (Xu et al., 2020a). A compression sensing-based algorithm was employed by G. -J. Yoon et al. to achieve simplification of amount of data in reconstruction process. On the condition of limit-view, they proved the feasibility of this method experimentally (Yoon et al., 2019). Analogous method was mentioned and validated in single-pixel laminar flames reconstruction (Zhang et al., 2019). Moreover, Bayesian optimization is also proficient in integrating the measurement data with prior information by a statistically robust method (Jin et al., 2021). In light of Bayesian framework, S. Grauer et al. recovered the instantaneous refractive index distribution of a turbulent flame (Grauer et al., 2018).
In addition, A. Unterberger et al. developed an evolutionary reconstruction technique (ERT), which integrated a genetic algorithm (GA) with a ray-tracing software. Evaluations were carried on the reconstruction results of three different kinds of flames, and the reconstruction ability of ERT was proved to be consonant with ART (Unterberger et al., 2019). Besides, several types of reconstruction algorithm have also been reported in CT problem, for instance, Landweber algorithm (Rossberg and Funke, 2010), maximum entropy algorithm (Denisova, 2004), maximum likelihood estimation algorithm (Busa et al., 2014) and maximum expectation algorithm (Dey and King, 2009), to name a few. Meanwhile, some research focused on the comparisons of various algorithms have been reported, such as (Yu and Cai, 2017) and (Shui et al., 2021).
Although iterative reconstruction algorithms (such as ART) are extensively used in FCT problem, it is still important to note that the major drawback of iteration algorithm is semi-convergence, which means the true solution may be figured out at an early stage while diverges away as the iteration steps increase. As a consequence, the iteration number and termination criterion play essential part in FCT. However, the iteration number as well as termination criterion of iterative reconstruction algorithms are usually determined by experience, which will influence the accuracy of reconstruction results evidently. Moreover, on account of the time consuming and high data throughput of conventional iteration methods, it causes the FCT technique hard to be utilized for online combustion monitor and diagnostics in practical environment. As a result, the 3D reconstructions in FCT are generally conducted off-line.
Artificial Intelligence-Based Reconstruction Algorithm
In the last few years, with the rapid development of the artificial intelligence-based technique, deep learning method has aroused extensive attention in academia and industry, which leads to excellent performance on sorts of problems, such as image classification (Colburn et al., 2019), object detection (Ren et al., 2017), face recognition (Yu and Tao, 2019) and natural language processing (Agrawal et al., 2019), to name a few. Especially in the field of computational optical imaging, the artificial intelligence-based technique has been effectively applied in ghost imaging (Lyu et al., 2017), digital holography (Ren et al., 2018; Wang et al., 2018) and phase retrieve (Wu et al., 2018). Meanwhile, a variety of neural network frameworks have developed, for example, LeNet-5 (LeCun et al., 1998), AlexNet (Krizhevsky et al., 2017), VGG (Simonyan and Zisserman, 2014) and GoogLeNet (Szegedy et al., 2015). In addition, deep learning methods are induced to handle CT reconstruction in medical field (Wang, 2016). A new noise reduction method and residual encoder-decoder convolutional neural network were presented by Wang et al. to tackle low-dose CT imaging problem with high computed speed (Chen et al., 2017). Besides, DD-Net (Zhang et al., 2018), Generative Adversarial Network (GAN) (Yang et al., 2018), wavelet-based network (Kang et al., 20182018) and 3D U-Net (Kim et al., 2020) were proved to realize noise immunity and edge enhancement in medical reconstruction problems.
The superiority of artificial intelligence-based algorithm in medical CT problem has attracted the attention of scholars related to FCT field, which make it becomes a promising tactic to deal with the time consuming limitation of prevailing iteration method. Artificial intelligence-based reconstruction method can be considered as a “black-box”. Taking one of the popular deep neural networks as example, the architecture of convolutional neural network (CNN) usually contains an input layer, multiple hidden layers as well as an output layer. As illustrated in Figure 10 the hidden layer generally includes the convolutional layer, batch normalization (BN) layer, activation layer, pooling layer and fully connected layer. The FCT reconstruction procedures via artificial intelligence-based tactic are composed of training stage and testing stage. In training stage, the projections as well as the distributions of reconstruction field which refer to the corresponding ground-truth constitute the data pairs and are fed into CNN model together. The training stage contains forward propagation process and back propagation process. During the forward propagation process, the salient features of input projections are extracted by convolution operations as well as down sampled via pooling operations to generate the feature column vector, which is multiplied by the coefficient and added with the biases to obtain the output results. The error between the output and ground-truth are calculated by loss function during back propagation process. Based on the gradient descent method, the parameters of neural network are adjusted gradually. Once the training stage is completed, the projections of test data are feeding into the system and the reconstruction results can be predicted rapidly.
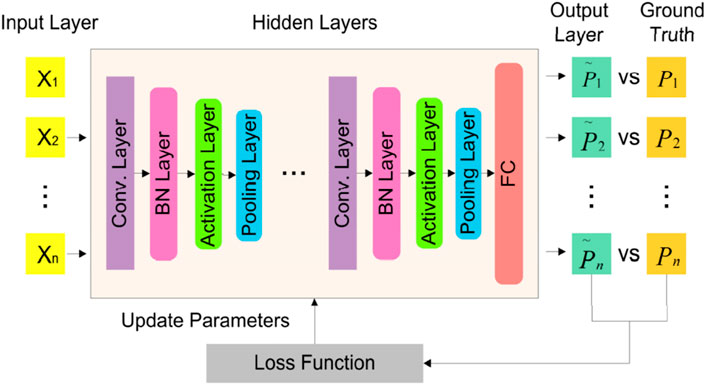
FIGURE 10. Demonstration of convolutional natural networks (CNN). Adapted with permission from Jin et al. (2017) © The Optical Society.
As depicted in Figure 11A, the extreme learning machine (ELM) is adopted by T. Yu et al. to extract useful information from the previous reconstructions of 3,600 training samples. 50 samples were generated as the test data to validate the feasibility and high computing speed of ELM-based reconstruction algorithm via phantom study (Yu et al., 2018c). For the sake of investigating the performance of deep learning method in practical flame measurement, a rapid FCT reconstruction system based on convolutional neural networks (CNN) model was established in Y. Jin et al. shown in Figure 11B. The reconstruction capability of the proposed model was qualitatively and quantitatively verified by numerical simulation as well as experimental measurement with various field distributions. Additionally, the determination of the architecture of CNN framework was analyzed in detail. Compared with ART, MART, and TV method, their CNN model provides prominent advantage in term of computational efficiency (Jin et al., 2019). It is worth mentioning that the output data as well as input data are the horizontal slice of the 3D field and the corresponding projections, which mean the 3D reconstruction result were derived from the overlay method. Afterward, as illustrated in Figure 11C, J. Huang et al. investigated the capability of two kinds of CNN framework with distinct connections between layers for volumetric tomography of turbulent flames. The proof-of-concept and a series of comparative experiments were conducted to prove the noise immunity of proposed method with different classes of noise (Huang et al., 2020). Compared to the reconstruction network in (Jin et al., 2019), the CNN framework of Huang’s research achieve the 3D reconstruction of FCT directly, which further decrease the time consuming of recovering.
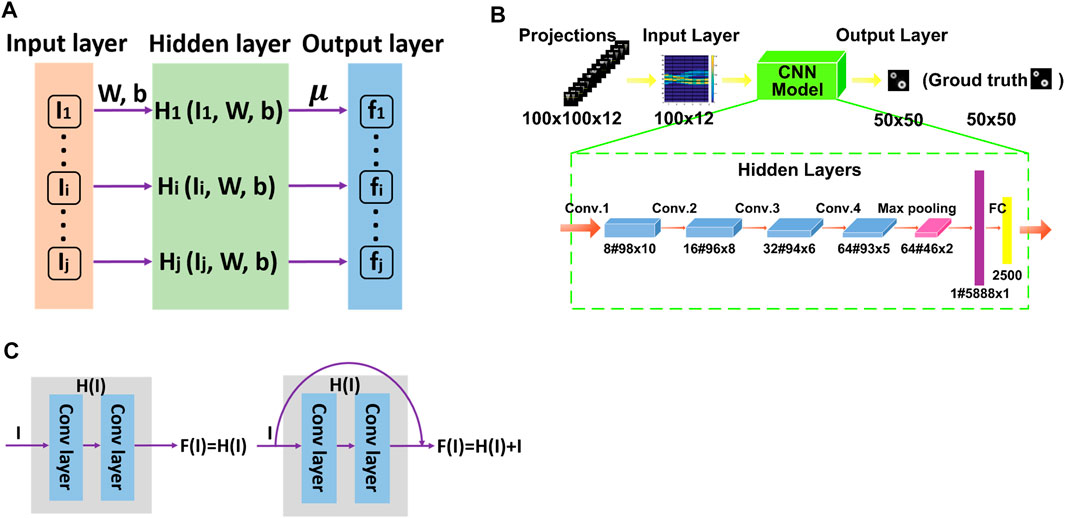
FIGURE 11. (A) ELM-based neural network for CT inversion. (B) Diagram of CNN architecture for FCT. Adapted with permission from Jin et al. (2019) © The Optical Society. (C) Two parts of VT-Net in Huang’s study.
Furthermore, in order to handle sparse view tomography problem, a 4D tomographic reconstruction framework, called TomoFluid, was presented by G. Zhang. A morphing-based view interpolation method of projection was considered as a novel regularization to equalize the missing projections neighboring perspectives. Meanwhile, the re-projection consistency constraint was employed as the optimization term to improve reconstruction quality (Zang et al., 2020). Although the practicability of TomoFluid was validated in their study, a thorough physical interpretation of the proposed view interpolation method still needs to investigate in further. Deep learning strategy has been proved to improve reconstruction spatial resolution in FCT. In general, it is a contradictory demand of the size of the reconstruction domain and spatial resolution. W. Xu reported a data-driven 3D super-resolution approach in light of the GAN framework and the architecture of 3D-SR-GAN, which is composed of a generator and a discriminator network to figure out the topographic information. Based on the given low-resolution counterpart, the high-resolution 3D structure of turbulent flame can be recovered by two times via proposed method (Xu et al., 2020b). Deep learning-based algorithm can be adopted not only to handle 3D reconstruction, but also to enable monitoring and prediction the combustion states. A combination of convolutional auto-encoder, principal component analysis, and the hidden Markov model was developed to generate an unsupervised classification framework by T. Qiu. By means of the projections collected from the furnace flame, the identification of combustion condition changing as the coal feed rate falls was achieved via their model (Qiu et al., 2019). J. Huang developed a hybrid CNN–long short-term memory (LSTM) network, which combined the FCT technique with DL algorithms, to predict the evolution of 3D flame structures on the basis of its history 2D projections via the data-driven approach. The CNN part was trained to extract flame features from projections, while the LSTM part was trained to model the temporal sequence in view of features (Huang et al., 2019b). The successful application of CNN-LSTM model is in light of the similarity of the training dataset and the testing dataset. As a consequence, the enhancement of generalization of the proposed model will be a tough challenge.
Artificial intelligence-based reconstruction algorithm has become another kind of critical algorithms of FCT. Although it shows significant superiority in terms of computational efficiency, the physical explanation of how deep learning methods work is still being explored. For the commonly used a data-driven approach of deep learning methods, a large number of pre-acquired data pairs are not only directly related to the quality of the reconstruction results, but also affects the generalization ability of reconstruction algorithm. As a result, it is not an appropriate tactic for practical reconstruction situation without sufficient ground-truth (e.g., real distribution of practical flame). Furthermore, the increase in reconstruction scene complexity as well as the number of data samples acquired makes deep learning methods suffer from the bottleneck of computing power.
Summary and Outlook
To summarize, this study has reviewed the application demonstrations of FCT for practical 3D tomography experiments, and the definition, imaging acquirement and calibration, projection models, and reconstruction algorithms. The tomographic chemiluminescence spectroscopy method is complementary to point or planer detection tactics and has been successfully illustrated in laboratory as well as industrial scenarios. Recent progress is going to extend the applicability of FCT to more complicated combustion environment, such as deflagration phenomenon monitoring, and, consequently, there still remain several issues to be addressed. One of the toughest challenge is that due to the presence of large amounts of combustion particle (e.g., soot), the frequently employed linear imaging models that ignore the effects of scattering and absorption of particle would be not appropriate to indicate the imaging process of FCT. As a consequence, a non-linear imaging model considers the scattering, and absorption is required for accurate 3D reconstruction in practical combustion diagnostics. Meanwhile, the severe vibration of combustion phenomenon becomes a risk to the stability of the system and the accuracy of the camera calibration. Additionally, although artificial intelligence-based reconstruction algorithm shows significant superiority in terms of computational efficiency, its data-driven method cannot be ideally adopted to practical situation without sufficient ground-truth (e.g. real distribution of practical flame), further resulting in limited generalization ability. A more systematic and theoretical analysis is required for designing a new paradigm by combining the physical imaging model of FCT and the neural model to overcome the limitations of the sample number and generalization issue. Transfer learning would enable a potential way for combining physical priors with sample data. Furthermore, with the increasing complexity of reconstruction scene and the bottleneck of computing power, the lightweight of the reconstruction algorithm framework (e.g., the decrease of neural model parameter number) is also imminent for in-line combustion monitoring and measurements. Finally, combined with other optical detection tactics, for instance, PIV and moiré deflection, FCT can potentially achieve simultaneous multidimensional information reconstruction of physical fields, such as spatiality, temporality, and hyper spectrum and provide the temperature, components, and velocity distribution of the combustion field. In brief, FCT technology faces challenges in building accurate imaging models, developing fast as well as lightweight reconstruction algorithms and accommodating multidimensional parameter experimental measurements. The FCT technique holds a significant promise for future; we hope that this review will serve as a reference for the development directions of FCT in the field. Last but not least, the theory of FCT is a kind of mathematical approach for 3D imaging, which can potentially be applied to other tomographic areas, such as electrical capacitance tomography, interferometric tomography, and medical tomography.
Author Contributions
All authors listed have made a substantial, direct, and intellectual contribution to the work and approved it for publication.
Funding
The authors gratefully acknowledge financial support from the National Natural Science Foundation of China (61991452); Key Research Program of Frontier Sciences of the Chinese Academy of Sciences (QYZDB-SSW-JSC002); and Chinesisch-Deutsche Zentrum für Wissenschaftsförderung (GZ1391).
Conflict of Interest
The authors declare that the research was conducted in the absence of any commercial or financial relationships that could be construed as a potential conflict of interest.
Publisher’s Note
All claims expressed in this article are solely those of the authors and do not necessarily represent those of their affiliated organizations, or those of the publisher, the editors, and the reviewers. Any product that may be evaluated in this article, or claim that may be made by its manufacturer, is not guaranteed or endorsed by the publisher.
References
Agrawal, A., Jain, A., and Kumar, B. S. (2019). Deep Learning Based Classification for Assessment of Emotion Recognition in Speech [Conference Presentation]. Jaipur-India: SUSCOM, Amity University Rajasthan. February https://papers.ssrn.com/sol3/papers.cfm?abstract_id=3356238.
Alviso, D., Mendieta, M., Molina, J., and Rolón, J. C. (2017). Flame Imaging Reconstruction Method Using High Resolution Spectral Data of OH *, CH * and C 2 * Radicals. Int. J. Therm. Sci. 121, 228–236. doi:10.1016/j.ijthermalsci.2017.07.019
Andersen, A. H., and Kak, A. C. (1984). Simultaneous Algebraic Reconstruction Technique (SART): a Superior Implementation of the ART Algorithm. Ultrason. Imaging 6 (1), 81–94. doi:10.1016/0161-7346(84)90008-710.1177/016173468400600107
Anikin, N., Suntz, R., and Bockhorn, H. (2010). Tomographic Reconstruction of the OH*-chemiluminescence Distribution in Premixed and Diffusion Flames. Appl. Phys. B 100 (3), 675–694. doi:10.1007/s00340-010-4051-5
Ax, H., and Meier, W. (2016). Experimental Investigation of the Response of Laminar Premixed Flames to Equivalence Ratio Oscillations. Combustion and Flame 167, 172–183. doi:10.1016/j.combustflame.2016.02.014
Beister, M., Kolditz, D., and Kalender, W. A. (2012). Iterative Reconstruction Methods in X-ray CT. Physica Med. 28 (2), 94–108. doi:10.1016/j.ejmp.2012.01.003
Bheemul, H. C., Lu, G., and Yan, Y. (2002). Three-Dimensional Visualization and Quantitative Characterization of Gaseous Flames. Meas. Sci. Technol. 13 (10), 1643–1650. doi:10.1088/0957-0233/13/10/318
Bracewell, R. N., and Riddle, A. C. (1967). Inversion of Fan-Beam Scans in Radio Astronomy. ApJ 150, 427. doi:10.1086/149346
Brisley, P. M., Lu, G., Yan, Y., and Cornwell, S. (2004). Three Dimensional Temperature Measurement of Combustion Flames Using a Single Monochromatic CCD Camera. [Conference presentation].I2MTC 2004, Como, Italy. https://ieeexplore.ieee.org/xpl/conhome/9320/proceeding.
Brisley, P. M., Lu, G., Yan, Y., and Cornwell, S. (2005). Three-Dimensional Temperature Measurement of Combustion Flames Using a Single Monochromatic CCD Camera. IEEE Trans. Instrum. Meas. 54 (4), 1417–1421. doi:10.1109/TIM.2005.851074
Busa, K. M., McDaniel, J. C., Brown, M. S., and Diskin, G. S. (2014). “Implementation of Maximum-Likelihood Expectation-Maximization Algorithm for Tomographic Reconstruction of TDLAT Measurements,” in [Conference Presentation]. 52nd Aerospace Sciences Meeting. Maryland: National Harbor. https://arc.aiaa.org/doi/book/10.2514/masm14.
Cai, H., Song, Y., Shi, Y., Cao, Z., Guo, Z., Li, Z., et al. (2020). Flexible Multicamera Calibration Method with a Rotating Calibration Plate. Opt. Express 28 (21), 31397–31413. doi:10.1364/OE.402761
Cai, W., Li, X., Li, F., and Ma, L. (2013). Numerical and Experimental Validation of a Three-Dimensional Combustion Diagnostic Based on Tomographic Chemiluminescence. Opt. Express 21 (6), 7050–7064. doi:10.1364/OE.21.007050
Cai, W., Li, X., and Ma, L. (2013). Practical Aspects of Implementing Three-Dimensional Tomography Inversion for Volumetric Flame Imaging. Appl. Opt. 52 (33), 8106–8116. doi:10.1364/AO.52.008106
Cha, S., and Vest, C. M. (1979). Interferometry and Reconstruction of Strongly Refracting Asymmetric-Refractive-Index Fields. Opt. Lett. 4 (10), 311–313. doi:10.1364/OL.4.000311
Chen, H., Zhang, Y., Kalra, M. K., Lin, F., Chen, Y., Liao, P., et al. (2017). Low-Dose CT with a Residual Encoder-Decoder Convolutional Neural Network. IEEE Trans. Med. Imaging 36 (12), 2524–2535. doi:10.1109/TMI.2017.2715284
Chi, Y., Lei, Q., Song, E., Fan, W., and Sha, Y. (2021). Development and Validation of Evaluation Methods for 3D Flame Propagation Speed of Turbulent Non-premixed Edge Flames via Tomographic Chemiluminescence. Flow Turbulence Combust 108, 539–557. doi:10.1007/s10494-021-00285-8
Colburn, S., Chu, Y., Shilzerman, E., and Majumdar, A. (2019). Optical Frontend for a Convolutional Neural Network. Appl. Opt. 58 (12), 3179–3186. doi:10.1364/AO.58.003179
Dai, J., Yu, T., Xu, L., and Cai, W. (2018). On the Regularization for Nonlinear Tomographic Absorption Spectroscopy. J. Quantitative Spectrosc. Radiative Transfer 206, 233–241. doi:10.1016/j.jqsrt.2017.11.016
Daniele, S., Mantzaras, J., Jansohn, P., Denisov, A., and Boulouchos, K. (2013). Flame Front/Turbulence Interaction for Syngas Fuels in the Thin Reaction Zones Regime: Turbulent and Stretched Laminar Flame Speeds at Elevated Pressures and Temperatures. J. Fluid Mech. 724, 36–68. doi:10.1017/jfm.2013.141
Daun, K. J., Thomson, K. A., Liu, F., and Smallwood, G. J. (2006). Deconvolution of Axisymmetric Flame Properties Using Tikhonov Regularization. Appl. Opt. 45 (19), 4638–4646. doi:10.1364/AO.45.004638
Denisova, N. (2004). A Maximuma Posteriorireconstruction Method for Plasma Tomography. Plasma Sourc. Sci. Technol. 13 (3), 531–536. doi:10.1088/0963-0252/13/3/020
Denisova, N., Tretyakov, P., and Tupikin, A. (2013). Emission Tomography in Flame Diagnostics. Combustion and Flame 160 (3), 577–588. doi:10.1016/j.combustflame.2012.11.005
Deutsch, C. (1990). A FORTRAN 77 Subroutine for Determining the Fractional Area of Rectangular Grid Blocks within a Polygon. Comput. Geosciences 16 (3), 379–384. doi:10.1016/0098-3004(90)90071-Z
Dey, J., and King, M. A. (2009). “Theoretical and Numerical Study of MLEM and OSEM Reconstruction Algorithms for Motion Correction in Emission Tomography [Conference Presentation],” in IEEE Nuclear Science Symposium Conference Record, Dresden, Germany. https://ieeexplore.ieee.org/xpl/tocresult.jsp?isnumber=5280479.
Dong, R., Lei, Q., Chi, Y., Song, E., and Fan, W. (2021). Analysis of Global and Local Hydrodynamic Instabilities on a High-Speed Jet Diffusion Flame via Time-Resolved 3D Measurements. Flow Turbulence Combust 107, 759–780. doi:10.1007/s10494-021-00251-4
Dong, R., Lei, Q., Zhang, Q., and Fan, W. (2021). Dynamics of Ignition Kernel in a Liquid-Fueled Gas Turbine Model Combustor Studied via Time-Resolved 3D Measurements. Combustion and Flame 232, 111566. doi:10.1016/j.combustflame.2021.111566
Falkhytten, T. (2018). Computed Tomography of Chemiluminescence in Interacting Reacting Flows. [Master's thesis]. [Trondheim]: NTNU.
Faris, G. W., and Byer, R. L. (1988). Three-Dimensional Beam-Deflection Optical Tomography of a Supersonic Jet. Appl. Opt. 27 (24), 5202–5212. doi:10.1364/AO.27.005202
Floyd, J. (2009). Computed Tomography of Chemiluminescence: A 3D Time Resolved Sensor for Turbulent Combustion. [London]: Imperial College London. [PHD dissertation].
Floyd, J., Geipel, P., and Kempf, A. M. (20112011). Computed Tomography of Chemiluminescence (CTC): Instantaneous 3D Measurements and Phantom Studies of a Turbulent Opposed Jet Flame. Combustion and Flame 158 (8), 376–391. doi:10.1016/j.combustflame.2010.09.006
Floyd, J., Heyes, A. L., and Kempf, A. M. (2009). Computed Tomography of Chemiluminescence (CTC): Instantaneous Measurements of a Matrix Burner [Conference Presentation]. Vienna, Austria. ECM 2009. https://www.communicationmonitor.eu/2009/06/01/ecm-european-communication-monitor-2009-measurement-evaluation-strategy-trends-social-media-social-networks/.
Floyd, J., and Kempf, A. M. (2011). Computed Tomography of Chemiluminescence (CTC): High Resolution and Instantaneous 3-D Measurements of a Matrix Burner. Proc. Combustion Inst. 33 (1), 751–758. doi:10.1016/j.proci.2010.06.015
Gao, Y., Yu, Q., Jiang, W., and Wan, X. (2010). Reconstruction of Three-Dimensional Arc-Plasma Temperature Fields by Orthographic and Double-Wave Spectral Tomography. Opt. Laser Tech. 42 (1), 61–69. doi:10.1016/j.optlastec.2009.04.020
Gaydon, A. G., and Wolfhard, H. G. (1953). Flames. Their Structure, Radiation, and Temperature. London: Chapman & Hall.
GilabertLuYan, G. G. Y., Lu, G., and Yan, Y. (2007). Three-Dimensional Tomographic Reconstruction of the Luminosity Distribution of a Combustion Flame. IEEE Trans. Instrum. Meas. 56 (4), 1300–1306. doi:10.1109/TIM.2007.900161
Gordon, R., and Herman, G. T. (1971). Reconstruction of Pictures from Their Projections. Commun. ACM 14 (12), 759–768. doi:10.1145/362919.362925
Grauer, S. J., Unterberger, A., Rittler, A., Daun, K. J., Kempf, A. M., and Mohri, K. (2018). Instantaneous 3D Flame Imaging by Background-Oriented Schlieren Tomography. Combustion and Flame 196, 284–299. doi:10.1016/j.combustflame.2018.06.022
Guenther, R. B., Kerber, C. W., Killian, E. K., Smith, K. T., and Wagner, S. L. (1974). Reconstruction of Objects from Radiographs and the Location of Brain Tumors. Proc. Natl. Acad. Sci. 71 (12), 4884–4886. doi:10.1073/pnas.71.12.4884
Gupta, A. K., Bolz, S., and Hasegawa, T. (1999). Effect of Air Preheat Temperature and Oxygen Concentration on Flame Structure and Emission. J. Energ. Resour-asme. 121, 209–216. doi:10.1115/1.2795984
Häber, T., Bockhorn, H., and Suntz, R. (2020). Two-Dimensional Tomographic Simultaneous Multi-Species Visualization-Part I: Experimental Methodology and Application to Laminar and Turbulent Flames. Energies 13 (9), 2335. doi:10.3390/en13092335
Häber, T., Suntz, R., and Bockhorn, H. (2020). Two-Dimensional Tomographic Simultaneous Multispecies Visualization-Part II: Reconstruction Accuracy. Energies 13 (9), 2368. doi:10.3390/en13092368
Hartley, R. I. (1994). An Algorithm for Self Calibration from Several Views [Conference Presentation]. Seattle, WA, United States: CVPR. https://dblp.org/db/conf/cvpr/cvpr1994.html.
Herman, G. T., Lent, A., and Lutz, P. H. (1978). Relaxation Methods for Image Reconstruction. Commun. ACM 21 (2), 152–158. doi:10.1145/359340.359351
Hertz, H. M., and Faris, G. W. (1988). Emission Tomography of Flame Radicals. Opt. Lett. 13 (5), 351–353. doi:10.1364/OL.13.000351
Hossain, A., and Nakamura, Y. (2014). A Numerical Study on the Ability to Predict the Heat Release Rate Using CH* Chemiluminescence in Non-sooting Counterflow Diffusion Flames. Combustion and Flame 161 (1), 162–172. doi:10.1016/j.combustflame.2013.08.021
Hossain, M. M., Lu, G., Sun, D., and Yan, Y. (2013). Three-Dimensional Reconstruction of Flame Temperature and Emissivity Distribution Using Optical Tomographic and Two-Colour Pyrometric Techniques. Meas. Sci. Technol. 24 (7), 074010. doi:10.1088/0957-0233/24/7/074010
Hossain, M. M., Lu, G., and Yan, Y. (2011). Three-Dimensional Reconstruction of Combustion Flame through Optical Fibre Sensing and CCD Imaging [Conference Presentation]. I2MTC 2011. Hangzhou, China. http://imtc2011.ieee-ims.org/.
Huang, J., Liu, H., and Cai, W. (2019). Online In Situ Prediction of 3-D Flame Evolution from its History 2-D Projections via Deep Learning. J. Fluid Mech. 875. doi:10.1017/jfm.2019.545
Huang, J., Liu, H., Wang, Q., and Cai, W. (2020). Limited-Projection Volumetric Tomography for Time-Resolved Turbulent Combustion Diagnostics via Deep Learning. Aerospace Sci. Tech. 106, 106123. doi:10.1016/j.ast.2020.106123
Huang, L., Da, F., and Gai, S. (2019). Research on Multi-Camera Calibration and Point Cloud Correction Method Based on Three-Dimensional Calibration Object. Opt. Lasers Eng. 115, 32–41. doi:10.1016/j.optlaseng.2018.11.005
Hwang, C. H., Wang, W. C., and Chen, Y. H. (2013). Camera Calibration and 3D Surface Reconstruction for Multi-Camera Semi-circular DIC System [Conference Presentation]. icOPEN2013, Singapore, Singapore. http://www.icopen.com.sg/.
Iborra, A., Rodriguez-Alvarez, M. J., Soriano, A., Sanchez, F., Bellido, P., Conde, P., et al. (2015). Noise Analysis in Computed Tomography (CT) Image Reconstruction Using QR-Decomposition Algorithm. IEEE Trans. Nucl. Sci. 62 (3), 869–875. doi:10.1109/TNS.2015.2422213
Ishino, Y., Hirano, T., Hirano, M., and Ohiwa, N. (2007). Non-scanning 3D-CT Visualizations of Premixed Flames with a 40-Lens Camera. [Conference presentation]. PSFVIP6, Hawaii, United States https://www.researchgate.net/publication/313707915_Non-scanning_3d-ct_visualizations_of_premixed_flames_with_a_40-lens_camera.
Ishino, Y., Inagawa, O., and Nakamura, T. (2005). Instantaneous Volume Imaging of Fuel Combustion Rate Distribution of a Turbulent Propane-Air Fuel-Rich Premixed Flame by Three-Dimensional Scanless Computerized Tomographic Reconstruction Method with a Multi-Lens-Camera. Conference presentation].TSFP4, Williamsburg, United States. http://www.tsfp-conference.org/proceedings/26-proceedings-of-tsfp-4-2005-williamsburg.html.
Ishino, Y., and Ohiwa, N. (2005). Three-Dimensional Computerized Tomographic Reconstruction of Instantaneous Distribution of Chemiluminescence of a Turbulent Premixed Flame. JSME International Journal. Ser. B, Fluids Thermal Engineering 48 (1), 34–40. doi:10.1299/jsmeb.48.34
Ishino, Y., Saiki, Y., Tomida, Y., and Okita, Y. (2011). 3D Visualization of Unsteady Flames by the Combined Technique of Multi-Directional Simultaneous Photography and 3D-Computed Tomography. Kashika Joho Gakkaishi 31 (120), 9. doi:10.3154/jvs.31.9
Ishino, Y., Takeuchi, K., Shiga, S., and Ohiwa, N. (2009). Measurement of Instantaneous 3D-Distribution of Local Burning Velocity on a Turbulent Premixed Flame by Non-scanning 3D-CT Reconstruction [Conference Presentation]. Birmingham, UK. ECM 2009. https://www.sciencedirect.com/journal/applied-thermal-engineering/vol/25/issue/16.
Iwama, N., Yoshida, H., Takimoto, H., Shen, Y., Takamura, S., and Tsukishima, T. (1989). Phillips-tikhonov Regularization of Plasma Image Reconstruction with the Generalized Cross Validation. Appl. Phys. Lett. 54 (6), 502–504. doi:10.1063/1.100912
Jeong, Y. K., Jeon, C. H., and Chang, Y. J. (2006). Evaluation of the Equivalence Ratio of the Reacting Mixture Using Intensity Ratio of Chemiluminescence in Laminar Partially Premixed CH4-Air Flames. Exp. Therm. Fluid Sci. 30 (7), 663–673. doi:10.1016/j.expthermflusci.2006.01.005
Jin, Y., Guo, Z., Song, Y., Li, Z., He, A., and Situ, G. (2021). Sparse Regularization-Based Reconstruction for 3D Flame Chemiluminescence Tomography. Appl. Opt. 60 (3), 513–525. doi:10.1364/AO.412637
Jin, Y., Song, Y., Qu, X., Li, Z., Ji, Y., and He, A. (2016). Hybrid Algorithm for Three-Dimensional Flame Chemiluminescence Tomography Based on Imaging Overexposure Compensation. Appl. Opt. 55 (22), 5917–5923. doi:10.1364/AO.55.005917
Jin, Y., Song, Y., Qu, X., Li, Z., Ji, Y., and He, A. (2017). Three-Dimensional Dynamic Measurements of CH* and C2* Concentrations in Flame Using Simultaneous Chemiluminescence Tomography. Opt. Express 25 (5), 4640–4654. doi:10.1364/OE.25.004640
Jin, Y., Song, Y., Wang, W., Ji, Y., Li, Z., and He, A. (2016). An Improved Calculation Model of Weight Coefficient for Three-Dimensional Flame Chemiluminescence Tomography Based on Lens Imaging Theory [Conference Presentation]. Beijing, China. OTA 2016. https://www.spiedigitallibrary.org/conference-proceedings-of-spie/10155.toc.
Jin, Y., Zhang, W., Song, Y., Qu, X., Li, Z., Ji, Y., et al. (2019). Three-Dimensional Rapid Flame Chemiluminescence Tomography via Deep Learning. Opt. Express 27 (19), 27308–27334. doi:10.1364/OE.27.027308
Kaminski, C. F., and Kaminski, C. F. (2014). A Tomographic Technique for the Simultaneous Imaging of Temperature, Chemical Species, and Pressure in Reactive Flows Using Absorption Spectroscopy with Frequency-Agile Lasers. Appl. Phys. Lett. 104 (3), 034101. doi:10.1063/1.4862754
Kang, E., Chang, W., Yoo, J., and Ye, J. C. (2018). Deep Convolutional Framelet Denosing for Low-Dose CT via Wavelet Residual Network. IEEE Trans. Med. Imaging 37 (6), 1358–1369. doi:10.1109/TMI.2018.2823756
Kang, M., Wu, Y., and Ma, L. (2014). Fiber-Based Endoscopes for 3D Combustion Measurements: View Registration and Spatial Resolution. Combustion and Flame 161 (12), 3063–3072. doi:10.1016/j.combustflame.2014.06.002
Kathrotia, T., Riedel, U., Seipel, A., Moshammer, K., and Brockhinke, A. (2012). Experimental and Numerical Study of Chemiluminescent Species in Low-Pressure Flames. Appl. Phys. B 107 (3), 571–584. doi:10.1007/s00340-012-5002-0
Kim, T., Lee, K., Ham, S., Park, B., Lee, S., Hong, D., et al. (2020). Active Learning for Accuracy Enhancement of Semantic Segmentation with CNN-Corrected Label Curations: Evaluation on Kidney Segmentation in Abdominal CT. Sci. Rep. 10 (1), 1–7. doi:10.1038/s41598-019-57242-9
Kojima, J., Ikeda, Y., and Nakajima, T. (2005). Basic Aspects of OH(A), CH(A), and C2(d) Chemiluminescence in the Reaction Zone of Laminar Methane-Air Premixed Flames. Combustion and Flame 140 (1-2), 34–45. doi:10.1016/j.combustflame.2004.10.002
Krizhevsky, A., Sutskever, I., and Hinton, G. E. (2017). ImageNet Classification with Deep Convolutional Neural Networks. Commun. ACM 60 (6), 84–90. doi:10.1145/3065386
LeCun, Y., Bottou, L., Bengio, Y., and Haffner, P. (1998). Gradient-Based Learning Applied to Document Recognition. Proc. IEEE 86 (11), 2278–2324. doi:10.1109/5.726791
Lee, M. C., Yoon, J., Joo, S., Kim, J., Hwang, J., and Yoon, Y. (2015). Investigation into the Cause of High Multi-Mode Combustion Instability of H2/CO/CH4 Syngas in a Partially Premixed Gas Turbine Model Combustor. Proc. Combustion Inst. 35 (3), 3263–3271. doi:10.1016/j.proci.2014.07.013
Lei, Q. (2016). Development and Validation of Reconstruction Algorithms for 3D Tomography Diagnostics. Virginia Polytechnic Institute and State University. [Doctoral dissertation]. [Virginia (Blacksburg)].
Li, X., and Ma, L. (2015). Capabilities and Limitations of 3D Flame Measurements Based on Computed Tomography of Chemiluminescence. Combustion and Flame 162 (3), 642–651. doi:10.1016/j.combustflame.2014.08.020
Li, X., and Ma, L. (2014). Volumetric Imaging of Turbulent Reactive Flows at kHz Based on Computed Tomography. Opt. Express 22 (4), 4768–4778. doi:10.1364/OE.22.004768
Ling, C., Chen, H., and Wu, Y. (2020). Development and Validation of a Reconstruction Approach for Three-Dimensional Confined-Space Tomography Problems. Appl. Opt. 59 (34), 10786–10800. doi:10.1364/AO.404458
Liu, H., Paolillo, G., Astarita, T., Shui, C., and Cai, W. (2019). Computed Tomography of Chemiluminescence for the Measurements of Flames Confined within a Cylindrical Glass. Opt. Lett. 44 (19), 4793–4796. doi:10.1364/OL.44.004793
Liu, H., Sun, B., and Cai, W. (2019). kHz-Rate Volumetric Flame Imaging Using a Single Camera. Opt. Commun. 437, 33–43. doi:10.1016/j.optcom.2018.12.036
Liu, H., Wang, Q., Peng, F., Qin, Z., and Cai, W. (2021). Flame Emission Tomography Based on Finite Element Basis and Adjustable Mask. Opt. Express 29 (25), 40841–40853. doi:10.1364/OE.443643
Liu, H., Yang, Z., and Cai, W. (2021). Application of Three-Dimensional Diagnostics on the Direct-Current Electric-Field Assisted Combustion. Aerospace Sci. Tech. 112, 106657. doi:10.1007/s10494-021-00294-710.1016/j.ast.2021.106657
Liu, H., Yu, T., Zhang, M., and Cai, W. (2017). Demonstration of 3D Computed Tomography of Chemiluminescence with a Restricted Field of View. Appl. Opt. 56 (25), 7107–7115. doi:10.1364/AO.56.007107
Liu, H., Zhao, J., Shui, C., and Cai, W. (2019). Reconstruction and Analysis of Non-premixed Turbulent Swirl Flames Based on kHz-Rate Multi-Angular Endoscopic Volumetric Tomography. Aerospace Sci. Tech. 91, 422–433. doi:10.1016/j.ast.2019.05.025
Liu, N., and Ma, L. (2020). Regularized Tomographic PIV for Incompressible Flows Based on Conservation of Mass. Appl. Opt. 59 (6), 1667–1677. doi:10.1364/AO.380720
Liu, N., Wu, Y., and Ma, L. (2018). Quantification of Tomographic PIV Uncertainty Using Controlled Experimental Measurements. Appl. Opt. 57 (3), 420–427. doi:10.1364/AO.57.000420
Liu, Y., Hossain, M., Sun, J., Xu, C., Zhang, B., and Wang, S. (2017). Design a Cage-Typed Light Field Camera System for Flame MeasurementIEEE SENSORS 2017. Glasgow, Scotland, United Kingdom. [Conference Presentation]. https://ieee-sensors.org/event/ieee-sensors-2017/.
Liu, Y., Tan, J., Wan, M., and Yao, X. (2020). OH* and CH* Chemiluminescence Characteristics in Low Swirl Methane-Air Flames. AIP Adv. 10 (5), 055318. doi:10.1063/5.0002660
Liu, Y., Zhu, M., Wang, T., Lei, G., Hossain, M. M., Zhang, B., et al. (2021). Spatial Resolution of Light Field Sectioning Pyrometry for Flame Temperature Measurement. Opt. Lasers Eng. 140, 106545. doi:10.1016/j.optlaseng.2021.106545
Lyu, M., Wang, W., Wang, H., Wang, H., Li, G., Chen, N., et al. (2017). Deep-Learning-Based Ghost Imaging. Sci. Rep. 7 (1), 1–6. doi:10.1038/s41598-017-18171-7
Ma, L., and Cai, W. (2008). Determination of the Optimal Regularization Parameters in Hyperspectral Tomography. Appl. Opt. 47 (23), 4186–4192. doi:10.1364/AO.47.004186
Ma, L., Wu, Y., Lei, Q., Xu, W., and Carter, C. D. (2016). 3D Flame Topography and Curvature Measurements at 5 kHz on a Premixed Turbulent Bunsen Flame. Combustion and Flame 166, 66–75. doi:10.1016/j.combustflame.2015.12.031
Melnikova, T. S., and Pickalov, V. V. (1984). Tomographic Measurements of Temperature Fields in Non-stationary Arc Plasma. Beitr. Plasmaphys. 24 (5), 431–445. doi:10.1002/ctpp.19840240502
Mohri, K., Görs, S., Schöler, J., Rittler, A., Dreier, T., Schulz, C., et al. (2017). Instantaneous 3D Imaging of Highly Turbulent Flames Using Computed Tomography of Chemiluminescence. Appl. Opt. 56 (26), 7385–7395. doi:10.1364/AO.56.007385
Moinul Hossain, M. M., Lu, G., and Yan, Y. (2012). Optical Fiber Imaging Based Tomographic Reconstruction of Burner Flames. IEEE Trans. Instrum. Meas. 61 (5), 1417–1425. doi:10.1109/TIM.2012.2186477
Navakas, R., Saliamonas, A., Striūgas, N., Džiugys, A., Paulauskas, R., and Zakarauskas, K. (2018). Effect of Producer Gas Addition and Air Excess Ratio on Natural Gas Flame Luminescence. Fuel 217, 478–489. doi:10.1016/j.fuel.2017.12.094
Niu, Z., Qi, H., Shi, J., Zhang, J., and Ren, Y. (2021). Temperature Field Reconstruction of 3D Luminous Flames Based on Light Field Tomography Theory. Sci. China Technol. Sci. 64, 223–236. doi:10.1007/s11431-019-1573-y
Nori, V., and Seitzman, J. (2008). “Evaluation of Chemiluminescence as A Combustion Diagnostic under Varying Operating Conditions [Conference Presentation],” in 46th AIAA Aerospace Sciences Meeting and Exhibit (Reno, Nevada, United States. https://arc.aiaa.org/doi/book/10.2514/MASM08#pane-d5521a22-9898-435a-9faa-de90b3bee0b01.
Okawa, S., Hirasawa, T., Kushibiki, T., Fujita, M., and Ishihara, M. (2020). Photoacoustic Tomography Reconstructing Absorption Coefficient and Effect of Regularization Minimizing P-Norm [Conference Presentation]. Photons Plus Ultrasound: Imaging and Sensing 2020. San Francisco, California, USA. https://spie.org/Publications/Proceedings/Volume/11240?SSO=1.
Orain, M., and Hardalupas, Y. (2010). Effect of Fuel Type on Equivalence Ratio Measurements Using Chemiluminescence in Premixed Flames. Comptes Rendus Mécanique 338 (5), 241–254. doi:10.1016/j.crme.2010.05.002
Paolillo, G., and Astarita, T. (2019). A Novel Camera Model for Calibrating Optical Systems Including Cylindrical Windows [Conference Presentation]AIAA Scitech 2019 Forum. San Diego, California, United States. https://arc.aiaa.org/doi/pdf/10.2514/6.2019-0273.
Qi, H., Shi, J.-W., Su, Y.-X., Gao, B.-H., and Ren, Y.-T. (2021). Soot Temperature Measurement within 3D Flame by Light-Field Imaging Based on Wave Optics Theory. Opt. Lasers Eng. 138, 106419. doi:10.1016/j.optlaseng.2020.106419
Qi, Q., Hossain, M. M., Li, J.-J., Zhang, B., Li, J., and Xu, C.-L. (2021). Approach to Reduce Light Field Sampling Redundancy for Flame Temperature Reconstruction. Opt. Express 29 (9), 13094–13114. doi:10.1364/OE.424112
Qiu, T., Liu, M., Zhou, G., Wang, L., and Gao, K. (2019). An Unsupervised Classification Method for Flame Image of Pulverized Coal Combustion Based on Convolutional Auto-Encoder and Hidden Markov Model. Energies 12 (13), 2585. doi:10.3390/en12132585
Ramachandran, G. N., and Lakshminarayanan, A. V. (1971). Three-Dimensional Reconstruction from Radiographs and Electron Micrographs: Application of Convolutions Instead of Fourier Transforms. Pnas 68 (9), 2236–2240. doi:10.1073/pnas.68.9.2236
Remondino, F., and Fraser, C. (2006). “Digital Camera Calibration Methods: Considerations and Comparisons,” in International Archives of the Photogrammetry [Conference presentation], Dresden, Germany (ISRPS). https://www.isprs.org/proceedings/XXXVI/part5/.
Ren, S., He, K., Girshick, R., and Sun, J. (2017). Faster R-Cnn: Towards Real-Time Object Detection with Region Proposal Networks. IEEE Trans. Pattern Anal. Mach. Intell. 39 (6), 1137–1149. doi:10.1109/TPAMI.2016.2577031
Ren, Z., Xu, Z., and Lam, E. Y. (2018). Learning-Based Nonparametric Autofocusing for Digital Holography. Optica 5 (4), 337–344. doi:10.1364/OPTICA.5.000337
Rising, C., Reyes, J., Knaus, D., Micka, D., Davis, B., Belovich, V., et al. (2021). Single-Sensor Filter-Intensified Fiber Optic 4D Tomographic CH* Chemiluminesence Flame Measurements. Appl. Opt. 60 (22), 6337–6341. doi:10.1364/AO.425887
Rossberg, A., and Funke, H. (2010). Determining the Radial Pair Distribution Function from X-ray Absorption Spectra by Use of the Landweber Iteration Method. J. Synchrotron Radiat. 17 (2), 280–288. doi:10.1107/S0909049509052200
Ruan, C., Yu, T., Chen, F., Wang, S., Cai, W., and Lu, X. (2019). Experimental Characterization of the Spatiotemporal Dynamics of a Turbulent Flame in a Gas Turbine Model Combustor Using Computed Tomography of Chemiluminescence. Energy 170, 744–751. doi:10.1016/j.energy.2018.12.215
Rudin, L. I., Osher, S., and Fatemi, E. (1992). Nonlinear Total Variation Based Noise Removal Algorithms. Physica. D. 60 (1-4), 259–268. doi:10.1016/0167-2789(92)90242-F
Sebald, N. (1980). Measurement of the Temperature and Flow Fields of the Magnetically Stabilized Cross-Flow N2 Arc. Appl. Phys. 21 (3), 221–236. doi:10.1007/BF00886172
Selivanov, V. V., and Lecomte, R. (2001). Fast PET Image Reconstruction Based on SVD Decomposition of the System Matrix. IEEE Trans. Nucl. Sci. 48 (3), 761–767. doi:10.1109/23.940160
Sellan, D., and Balusamy, S. (2021). Experimental Study of Swirl-Stabilized Turbulent Premixed and Stratified LPG/air Flames Using Optical Diagnostics. Exp. Therm. Fluid Sci. 121, 110281. doi:10.1016/j.expthermflusci.2020.110281
Shepp, L. A., and Logan, B. F. (1974). The Fourier Reconstruction of a Head Section. IEEE Trans. Nucl. Sci. 21 (3), 21–43. doi:10.1109/TNS.1974.6499235
Shi, J., Qi, H., Yu, Z., An, X., Ren, Y., and Tan, H. (2022). Three-Dimensional Temperature Reconstruction of Diffusion Flame from the Light-Field Convolution Imaging by the Focused Plenoptic Camera. Sci. China Technol. Sci. 65, 302–323. doi:10.1007/s11431-020-1761-2
Shui, C., Liu, H., and Cai, W. (2021). Benchmark Evaluation of Tomographic Algorithms for Simultaneous Reconstruction of Temperature and Volume Fraction Fields of Soot and Metal-Oxide Nanoparticles in Non-uniform Flames. Sci. China Technol. Sci. 64 (2), 237–250. doi:10.1007/s11431-019-1507-6
Simonyan, K., and Zisserman, A. (2014). Very Deep Convolutional Networks for Large-Scale Image Recognition. arXiv preprint arXiv:1409.1556.
Song, Y., Wang, J., Jin, Y., Guo, Z., Ji, Y., He, A., et al. (2016). Implementation of Multidirectional Moiré Computerized Tomography: Multidirectional Affine Calibration. J. Opt. Soc. Am. A. 33 (12), 2385–2395. doi:10.1364/JOSAA.33.002385
Strong, D., and Chan, T. (2003). Edge-Preserving and Scale-dependent Properties of Total Variation Regularization. Inverse Probl. 19 (6), S165–S187. doi:10.1088/0266-5611/19/6/059
Sun, D., Lu, G., Zhou, H., Yan, Y., and Liu, S. (2015). Quantitative Assessment of Flame Stability through Image Processing and Spectral Analysis. IEEE Trans. Instrum. Meas. 64 (12), 3323–3333. doi:10.1109/TIM.2015.2444262
Szegedy, C., Wei Liu, W., Yangqing Jia, Y., Sermanet, P., Reed, S., Anguelov, D., et al. (2015). Going Deeper with Convolutions. IEEE. C. S.. doi:10.1109/CVPR.2015.7298594
Unterberger, A., Kempf, A., and Mohri, K. (2019). 3D Evolutionary Reconstruction of Scalar Fields in the Gas-phase. Energies 12 (11), 2075. doi:10.3390/en12112075
Upton, T. D., Verhoeven, D. D., and Hudgins, D. E. (2011). High-Resolution Computed Tomography of a Turbulent Reacting Flow. Exp. Fluids 50 (1), 125–134. doi:10.1007/s00348-010-0900-6
Verhoeven, D. (1993). Limited-Data Computed Tomography Algorithms for the Physical Sciences. Appl. Opt. 32 (20), 3736–3754. doi:10.1364/AO.32.003736
Vest, C. M. (1974). Formation of Images from Projections: Radon and Abel Transforms*. J. Opt. Soc. Am. 64 (9), 1215–1218. doi:10.1364/JOSA.64.001215
Walsh, K. T., Fielding, J., and Long, M. B. (2000). Effect of Light-Collection Geometry on Reconstruction Errors in Abel Inversions. Opt. Lett. 25 (7), 457–459. doi:10.1364/OL.25.000457
Wan, M., Xie, H., Zhuang, J., and Xu, K. (2015). Three-Dimensional Reconstruction Method for Flame Chemiluminescence Distribution with Complicated Structure. Appl. Opt. 54 (31), 9071–9081. doi:10.1364/AO.54.009071
Wan, M., and Zhuang, J. (2018). Projection Model for Flame Chemiluminescence Tomography Based on Lens Imaging. Opt. Eng. 57 (4), 1. doi:10.1117/1.OE.57.4.043106
Wan, X., Xiong, W., Zhang, Z., and Chang, F. (2009). An Online Emission Spectral Tomography System with Digital Signal Processor. Opt. Express 17 (7), 5279–5286. doi:10.1364/OE.17.005279
Wan, X., Zhang, Z., and Chen, Q. (2013). Three-Dimensional Radiation Thermometer Combining Near-Infrared Passband Thermometry with Optical Fiber Bundle Tomography. Epl 103 (7), 50005. doi:10.1209/0295-5075/103/50005
Wang, G. (2016). A Perspective on Deep Imaging. IEEE. Access. 4, 8914–8924. doi:10.1109/ACCESS.2016.2624938
Wang, H., Lyu, M., and Situ, G. (2018). eHoloNet: a Learning-Based End-To-End Approach for In-Line Digital Holographic Reconstruction. Opt. Express 26 (18), 22603–22614. doi:10.1364/OE.26.022603
Wang, J., Song, Y., Li, Z.-h., Kempf, A., and He, A.-z. (2015). Multi-Directional 3D Flame Chemiluminescence Tomography Based on Lens Imaging. Opt. Lett. 40 (7), 1231–1234. doi:10.1364/OL.40.001231
Wang, J., Zhang, W., Zhang, Y., and Yu, X. (2016). Camera Calibration for Multidirectional Flame Chemiluminescence Tomography. Opt. Eng. 56 (4), 041307. doi:10.1117/1.OE.56.4.041307
Wang, K., Li, F., Zeng, H., and Yu, X. (2017). Three-Dimensional Flame Measurements with Large Field Angle. Opt. Express 25 (18), 21008–21018. doi:10.1364/OE.25.021008
Wang, K., Li, F., Zeng, H., Zhang, S., and Yu, X. (2016). Computed Tomography Measurement of 3D Combustion Chemiluminescence Using Single Camera [Conference Presentation]. Beijing, China. OTA 2016. https://www.spiedigitallibrary.org/conference-proceedings-of-spie/10155.toc.
Weinkauff, J., Michaelis, D., Dreizler, A., and Böhm, B. (2013). Tomographic PIV Measurements in a Turbulent Lifted Jet Flame. Exp. Fluids 54 (12), 1624–1628. doi:10.1007/s00348-013-1624-1
Wellander, R., Richter, M., and Aldén, M. (2014). Time-resolved (kHz) 3D Imaging of OH PLIF in a Flame. Exp. Fluids 55 (6), 1764. doi:10.1007/s00348-014-1764-y
Windle, C. I., Anderson, J., Boyd, J., Homan, B., Korivi, V., and Ma, L. (2021). In Situ Imaging of 4D Fire Events in a Ground Vehicle Testbed Using Customized Fiber-Based Endoscopes. Combustion and Flame 224, 225–232. doi:10.1016/j.combustflame.2020.11.022
Wiseman, S. M., Brear, M. J., Gordon, R. L., and Marusic, I. (2017). Measurements from Flame Chemiluminescence Tomography of Forced Laminar Premixed Propane Flames. Combustion and Flame 183, 1–14. doi:10.1016/j.combustflame.2017.05.003
Worth, N. A., and Dawson, J. R. (2012). Tomographic Reconstruction of OH* Chemiluminescence in Two Interacting Turbulent Flames. Meas. Sci. Technol. 24 (2), 024013. doi:10.1088/0957-0233/24/2/024013
Wu, Y., Rivenson, Y., Zhang, Y., Wei, Z., Günaydin, H., Lin, X., et al. (2018). Extended Depth-Of-Field in Holographic Imaging Using Deep-Learning-Based Autofocusing and Phase Recovery. Optica 5 (6), 704–710. doi:10.1364/OPTICA.5.000704
Xu, C., Yang, B., Guo, F., Zheng, W., and Poignet, P. (2020). Sparse-View CBCT Reconstruction via Weighted Schatten P-Norm Minimization. Opt. Express 28 (24), 35469–35482. doi:10.1364/OE.404471
Xu, W., Luo, W., Wang, Y., and You, Y. (2020). Data-Driven Three-Dimensional Super-resolution Imaging of a Turbulent Jet Flame Using a Generative Adversarial Network. Appl. Opt. 59 (19), 5729–5736. doi:10.1364/AO.392803
Yang, Q., Yan, P., Zhang, Y., Yu, H., Shi, Y., Mou, X., et al. (2018). Low-dose CT Image Denoising Using a Generative Adversarial Network with Wasserstein Distance and Perceptual Loss. IEEE Trans. Med. Imaging 37 (6), 1348–1357. doi:10.1109/TMI.2018.2827462
Yoon, G.-J., Cho, H., Won, Y.-Y., and Yoon, S. M. (2019). Three-Dimensional Density Estimation of Flame Captured from Multiple Cameras. IEEE. Access 7, 8876–8884. doi:10.1109/ACCESS.2018.2890717
Yu, B., and Tao, D. (2019). Anchor Cascade for Efficient Face Detection. IEEE Trans. Image Process. 28 (5), 2490–2501. doi:10.1109/TIP.2018.2886790
Yu, T., Bauer, F. J., Huber, F. J., Will, S., and Cai, W. (2021). 4D Temperature Measurements Using Tomographic Two-Color Pyrometry. Opt. Express 29 (4), 5304–5315. doi:10.1364/OE.412821
Yu, T., and Cai, W. (2017). Benchmark Evaluation of Inversion Algorithms for Tomographic Absorption Spectroscopy. Appl. Opt. 56 (8), 2183–2194. doi:10.1364/AO.56.002183
Yu, T., Cai, W., and Liu, Y. (2018). Rapid Tomographic Reconstruction Based on Machine Learning for Time-Resolved Combustion Diagnostics. Rev. Scientific Instr. 89 (4), 043101. doi:10.1063/1.5016403
Yu, T., Li, Z., Ruan, C., Chen, F., Lu, X., and Cai, W. (2019). Development of an Absorption-Corrected Method for 3D Computed Tomography of Chemiluminescence. Meas. Sci. Technol. 30 (4), 045403. doi:10.1088/1361-6501/ab01c1
Yu, T., Liu, H., and Cai, W. (2017). On the Quantification of Spatial Resolution for Three-Dimensional Computed Tomography of Chemiluminescence. Opt. Express 25 (20), 24093–24108. doi:10.1364/OE.25.024093
Yu, T., Liu, H., Zhang, J., Cai, W., and Qi, F. (2018). Toward Real-Time Volumetric Tomography for Combustion Diagnostics via Dimension Reduction. Opt. Lett. 43 (5), 1107–1110. doi:10.1364/OL.43.001107
Yu, T., Ruan, C., Chen, F., Wang, Q., Cai, W., and Lu, X. (2019). Measurement of the 3D Rayleigh Index Field via Time-Resolved CH* Computed Tomography. Aerospace Sci. Tech. 95, 105487. doi:10.1016/j.ast.2019.105487
Yu, T., Ruan, C., Liu, H., Cai, W., and Lu, X. (2018). Time-resolved Measurements of a Swirl Flame at 4 kHz via Computed Tomography of Chemiluminescence. Appl. Opt. 57 (21), 5962–5969. doi:10.1364/AO.57.005962
Zang, G., Idoughi, R., Wang, C., Bennett, A., Du, J., Skeen, S., et al. (2020). TomoFluid: Reconstructing Dynamic Fluid from Sparse View Videos. Seattle, WA, USA: CVPR 2020. https://cvpr2020.thecvf.com/.
Zhang, J., Wang, Q., Dai, J., and Cai, W. (2019). Demonstration of a Cost-Effective Single-Pixel UV Camera for Flame Chemiluminescence Imaging. Appl. Opt. 58 (19), 5248–5256. doi:10.1364/AO.58.005248
Zhang, Z. (2000). A Flexible New Technique for Camera Calibration. IEEE Trans. Pattern Anal. Machine Intell. 22 (11), 1330–1334. doi:10.1109/34.888718
Zhang, Z. (1999). Flexible Camera Calibration by Viewing a Plane from Unknown Orientations [Conference Presentation]. Fort Collins, CO, United States: IEEE CS 1999. https://ieeexplore.ieee.org/xpl/conhome/6370/proceeding.
Zhang, Z., Liang, X., Dong, X., Xie, Y., and Cao, G. (2018). A Sparse-View CT Reconstruction Method Based on Combination of DenseNet and Deconvolution. IEEE Trans. Med. Imaging 37 (6), 1407–1417. doi:10.1109/TMI.2018.2823338
Zhao, W., Zhang, B., Xu, C., Duan, L., and Wang, S. (2018). Optical Sectioning Tomographic Reconstruction of Three-Dimensional Flame Temperature Distribution Using Single Light Field Camera. IEEE Sensors J. 18 (2), 528–539. doi:10.1109/JSEN.2017.2772899
Keywords: 3D optical computerized tomography, spectroscopy measurement, flame chemiluminescence, reconstruction algorithm, projection model, deep learning, combustion diagnostics
Citation: Jin Y and Situ G (2022) A Survey for 3D Flame Chemiluminescence Tomography: Theory, Algorithms, and Applications. Front. Photonics 3:845971. doi: 10.3389/fphot.2022.845971
Received: 30 December 2021; Accepted: 02 March 2022;
Published: 29 March 2022.
Edited by:
Peter Wai Ming Tsang, City University of Hong Kong, Hong Kong SAR, ChinaReviewed by:
Wen Chen, Hong Kong Polytechnic University, Hong Kong SAR, ChinaJianglei Di, Guangdong University of Technology, China
Hongbo Zhang, Virginia Military Institute, United States
Copyright © 2022 Jin and Situ. This is an open-access article distributed under the terms of the Creative Commons Attribution License (CC BY). The use, distribution or reproduction in other forums is permitted, provided the original author(s) and the copyright owner(s) are credited and that the original publication in this journal is cited, in accordance with accepted academic practice. No use, distribution or reproduction is permitted which does not comply with these terms.
*Correspondence: Ying Jin, eWluZ2ppbkBzaW9tLmFjLmNu; Guohai Situ, Z2hzaXR1QHNpb20uYWMuY24=