 Junfeng Xie
 Wei Li
 Hairu You2
94% of researchers rate our articles as excellent or good
Learn more about the work of our research integrity team to safeguard the quality of each article we publish.
Find out more
ORIGINAL RESEARCH article
Front. Pharmacol., 01 April 2025
Sec. Experimental Pharmacology and Drug Discovery
Volume 16 - 2025 | https://doi.org/10.3389/fphar.2025.1584625
This article is part of the Research TopicIntelligent Computing for Integrating Multi-Omics Data in Disease Diagnosis and Drug DevelopmentView all 5 articles
Introduction: Epilepsy, a complex neurological disorder characterised by recurrent seizures and significant genetic heterogeneity, presents considerable challenges form accurate diagnosis and drug target identification. While traditional genomewide association studies (GWAS) and sequencing technologies have advanced our understanding of epilepsy-related gene targets, they often struggle to identify novel and rare variants crucial for precise diagnosis and targeted drug development. The increasing availability of large-scale genomic data, coupled with the power of deep learning, offers a promising avenue for progress.
Method: In this work, we introduce GraphTransNet, a novel hybrid neural network model designed for predicting epilepsy-associated gene targets, with direct implications for improved disease diagnosis and therapeutic target identification. GraphTransNet leverages protein language models (specifically ESM) to generate numerical embeddings from gene sequences. These embeddings are then processed by a novel architecture integrating transformer and convolutional neural network (CNN)components to predict epilepsy-related gene targets.
Results: Our results demonstrate that GraphTransNet achieves high accuracy in identifying epilepsy targets, outperforming existing predictive tools in terms of both recall and precision metrics for reliable disease diagnosis and effective drug target identification. Rigorous comparisons with established machine learning methods and other deep learning architectures further underscore the efficacy of GraphTransNet.
Discussion: This approach represents a valuable computational tool for advancing epilepsy genetics research, with the potential to contribute to more accurate diagnostic strategies and the discovery of novel drug targets for improved treatment outcomes.
Disease diagnosis prediction and drug target identification are fundamental challenges in modern medicine. Computational approaches have emerged as powerful tools, offering novel perspectives and solutions in these areas. Epilepsy, a chronic and highly heterogeneous neurological disorder, affects approximately 50 million people worldwide, ranking among the most prevalent neurological conditions. Characterized by recurrent, unprovoked seizures stemming from abnormal electrical brain activity, epilepsy significantly impacts patients’ lives (Fisher et al., 2014; Thurman et al., 2011). Despite medical progress, around 30% of epilepsy patients suffer from drug-resistant epilepsy (DRE), which not only deteriorates their quality of life but also heightens the risk of severe complications like sudden unexpected death in epilepsy (SUDEP) (Holger, 2020; Devinsky et al., 2016). In this context, computational methods hold great potential for understanding the genetic basis of epilepsy, which is crucial for identifying new therapeutic targets, especially for DRE patients.
The genetic landscape of epilepsy is incredibly intricate, involving diverse genetic variations such as single nucleotide polymorphisms (SNPs), copy number variations (CNVs), and rare de novo mutations (Ellis et al., 2020). Over 500 genes have been associated with epilepsy, covering ion channels, neurotransmitter receptors, and synaptic proteins, all vital for maintaining neuronal excitability and synaptic transmission Scheffer and Berkovic (1997); Myers and Mefford (2015); Liang et al. (2025). Computational techniques could potentially untangle this complexity. However, the genetic architecture of epilepsy remains incompletely understood, with many cases lacking a genetic explanation. For example, generalized epilepsy often has polygenic origins, while rare monogenic forms like Dravet syndrome and Lennox-Gastaut syndrome are linked to mutations in specific genes such as SCN1A and GABRG2. These genetic patterns pose challenges that computational methods are uniquely positioned to address, as they can analyze large datasets and identify hidden relationships among genes (Ji et al., 2020b; 2025).
The advent of next-generation sequencing (NGS) technologies, including whole-exome sequencing (WES) and whole-genome sequencing (WGS), has transformed epilepsy research (Daniel et al., 2024; DC et al., 2013; Consortium et al., 2013). These methods have allowed the identification of rare mutations and genetic risk factors previously undetected by traditional techniques. Transcriptomic studies and epigenomic profiling have also shed light on how regulatory elements, non-coding RNAs, and chromatin modifications contribute to epilepsy pathogenesis. However, the vast amount of data generated by NGS presents significant analytical hurdles. Computational approaches are essential for managing and interpreting this data. In particular, distinguishing pathogenic variants from benign ones is a complex task. Conventional alignment-based methods often face limitations in identifying novel or divergent genetic variants due to their reliance on reference databases (Wang et al., 2023; Wei et al., 2024), highlighting the need for advanced computational algorithms to uncover new epilepsy-associated genes.
Emerging computational approaches, especially machine learning and deep learning, offer promising solutions to these challenges (Kenji, 2016). Deep learning models, particularly genomic language models trained on large scale sequencing data, are designed to extract complex patterns and relationships from genetic information (Ji et al., 2020a; 2024). These models utilize the contextual information within nucleotide sequences to capture subtle genetic signals related to diseases. For example, they can analyze the sequence data to predict the likelihood of a gene being associated with epilepsy. However, their accuracy is currently constrained by limited training data, a significant obstacle, especially for rare and heterogeneous disorders like epilepsy. This limitation underscores the need for innovative computational strategies to enhance the performance of these models in disease diagnosis prediction and drug target identification.
To overcome these limitations and improve disease diagnosis prediction and drug target identification in the context of epilepsy, we propose EffuTCN, a novel framework. EffuTCN combines pre-trained protein language models with Transformer (Ashish et al., 2017) and CNN-based neural networks (Lecun et al., 1998). By leveraging this combination, EffuTCN aims to enhance the prediction of epilepsy-related targets, which is crucial for both diagnosing the disease at a genetic level and identifying potential drug targets. The flowchart of EffuTCN is presented in Figure 1. EffuTCN uses the gene sequence data as inputs to the protein language model ESM (Lin et al., 2023) to obtain corresponding numerical features. These features are then fed into a neural network model for epilepsy gene prediction. This innovative approach not only addresses the drawbacks of traditional methods, but also provides a new avenue for a more in-depth understanding of the genetic structure of epilepsy, ultimately contributing to more effective prediction of disease diagnosis and drug target identification.
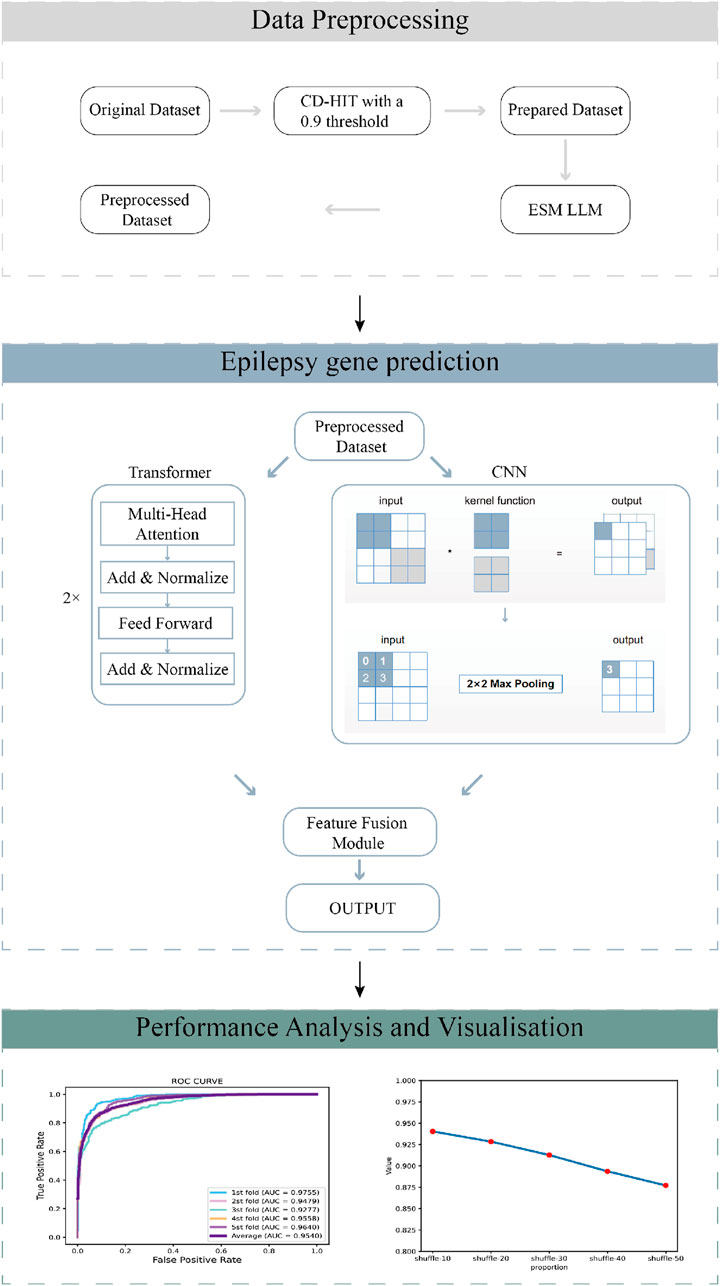
Figure 1. The workflow of the GraphTransNet method, which has three main steps: (1) Data preprocessing filters sequences with over 90% similarity using a 0.9 CD-HIT threshold, then extracts numerical features using the ESM protein language model. (2) Epilepsy gene prediction uses Transformer and CNN networks for feature extraction, combines the features, and performs binary classification. (3) Performance analysis and visualization evaluate and display the predictive performance of GraphTransNet.
We used multiple metrics to evaluate the prediction performance of GraphTransNet for epilepsy genes, specifically, in addition to accuracy (ACC), precision (Prec), recall (Rec), f1 score (F1), Matthews correlation coefficient (MCC), AUPR (area under the precision-recall curve) and AUC (area under the ROC curve, which is plotted by the false-positive rate (FPR) and true-positive rate (TPR)). They are calculated using the following Equations 1-6:
Where TP denotes the number of actual labels that are positive and predicted to be positive as well, FP denotes the number of actual labels that are negative and predicted to be positive, and the same for TN and FN.
Several databases provide information on epilepsy-related genes, forming the foundation for building a prediction model. We collected epilepsy-related genes from recent databases and research papers and retrieved their sequences from the UniProt database, resulting in a total of 6,452 sequences. Detailed information about these databases is presented in Table 1.
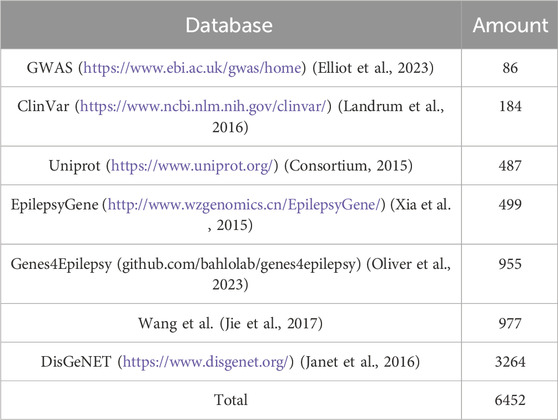
Table 1. The detailed information for the positive benchmark dataset about epilepsy-associated genes.
It is important to note that the extracted sequences included duplicates and sequences with high similarity. To address this, we applied CD-HIT with a 0.9 threshold to remove sequences with more than 90% identity to others. Additionally, we reviewed and corrected any erroneous amino acid representations in the sequences.
For negative samples, we randomly selected an equal number of protein sequences from the UniProt (Consortium, 2015) database, ensuring that none overlapped with the positive sample dataset. This step balanced the dataset with an equal number of positive and negative samples. After obtaining equal numbers of positive and negative sample sequences, we processed these sample sequences through ESM (Lin et al., 2023) to obtain the digital features of each sample.
To assess the robustness of the prediction model, we conducted five-fold cross-validation. Specifically, in each fold, 20% of the initial dataset was randomly selected as the validation set, while the remaining 80% was used as the training set to develop the model. This process was repeated five times to ensure comprehensive evaluation.
Transformer is a deep learning model architecture introduced by Vaswani et al. (2017), widely applied in natural language processing (NLP) and other fields (Ashish et al., 2017). Its core innovation is the self-attention mechanism, which captures long-range dependencies in sequence data, addressing the vanishing gradient problem encountered by traditional recurrent neural networks (RNNs) in long sequences (Rumelhart et al., 1986). The Transformer employs multi-head attention to perform parallel computation, significantly improving training efficiency. It does not rely on sequential processing, instead preserving order information through positional encoding, offering strong parallelization capabilities and scalability. This architecture has become the foundation of many modern NLP models, and has also achieved success in image processing and other domains.
Convolutional Neural Networks (CNNs) are a class of deep learning models designed to process data with a grid-like structure, such as images (Lecun et al., 1998). CNNs are composed of multiple layers, including convolutional layers, pooling layers, and fully connected layers. The convolutional layers apply filters (or kernels) to the input data, allowing the network to automatically learn spatial hierarchies of features, such as edges, textures, and shapes. Pooling layers downsample the data, reducing its dimensionality and computational complexity while retaining important features. CNNs have been particularly successful in computer vision tasks, such as image classification, object detection, and segmentation, due to their ability to learn complex patterns and generalize well to unseen data.
In GraphTransNet, we used both Transformer and CNN to predict whether a gene was related to epilepsy. Specifically, we used their numerical features as input to the Transformer encoder and the CNN, respectively. Finally, the features obtained from both were fused through the self-attention fusion module, followed by a binary classification task.
Assuming the input is
Where
Attention weights are then calculated using scaled dot product attention. For each head i, the dot product of the query and key is first calculated, then scaled and the softmax function is applied as follows:
the formula for
where
Then use the attention weight matrix
Subsequently, we concat the output of all the headers according to the last dimension, the formula is as follows:
Finally, a linear transformation matrix
For the calculation of the CNN part, we convert the input
where
The convolution operation is followed by the addition of a maximum pooling layer with the following equation:
where
Subsequently, for the feature fusion module, we assume that the features obtained after Transformer and CNN processing are
Among them,
After the above processing, the attention weight
Next, concatenate them to get the fused features, namely, the following formula:
Finally, the binary classification task is performed through the fully connected layer.
In this section, we used five-fold cross validation to divide the data into five parts, where

Table 2. The average performance of GraphTransNet obtained through five-fold cross-validation.
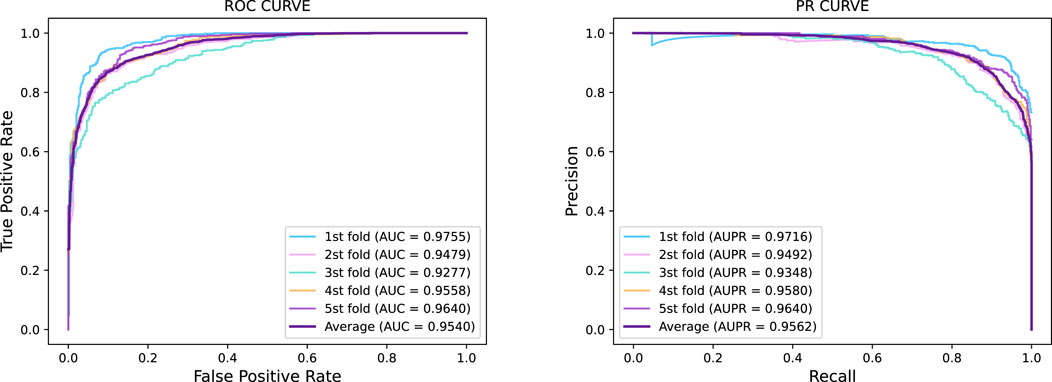
Figure 2. Five-fold cross-validation ROC curve and PR curve of GraphTransNet predicting epilepsy genes.
In this section, we will compare the performance of GraphTransNet using the feature fusion module with that without the module. The model without the feature fusion module directly concatenates the features extracted by Transformer and CNN and then performs the binary classification task. The results are shown in Table 3. We can observe that the GraphTransNet with the feature fusion module has at least one percent improvement in all metrics.
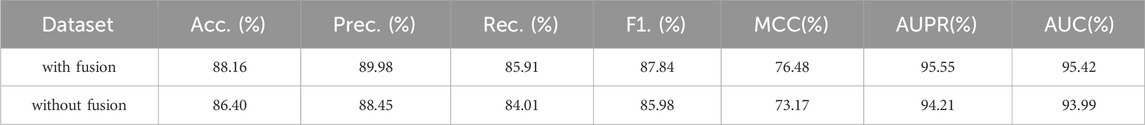
Table 3. Epilepsy gene prediction results under five-fold cross validation using GraphTransNet with and without the feature fusion module.
In this part, we will investigate the improvement of the GraphTransNet performance by the Transformer module, specifically, we will set up another set of models with only CNN module for the task of binary classification of epilepsy genes. In order to ensure the only variable, we compare it with GraphTransNet without feature fusion module. The results are shown in Table 4. We can observe that almost all of them achieve at least a two percent improvement in performance, except for the recall metric, which also demonstrate the importance of the Transformer module in the GraphTransNet model.
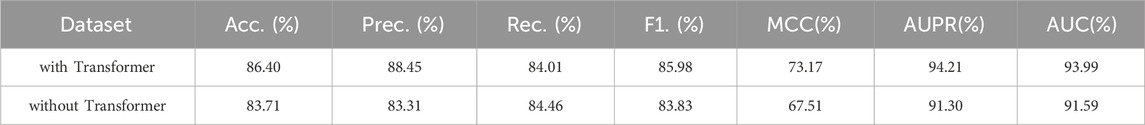
Table 4. Epilepsy gene prediction results under five-fold cross validation using GraphTransNet with and without the Transformer module.
In this section, we will investigate the improvement in GraphTransNet performance brought by the CNN module. Specifically, we will set up another model with only the Transformer module for the binary classification task of epilepsy-related genes. As in the previous experiment, we compare with the model that directly concatenates the features extracted by Transformer and CNN. The results are shown in Table 5. It can be observed that there is at least one percent performance improvement in almost all metrics.
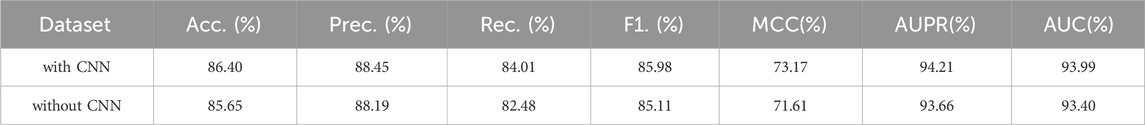
Table 5. Epilepsy gene prediction results under five-fold cross validation using GraphTransNet with and without the CNN module.
In this section, we further investigate whether the number of encoder layers in the transformer module affects the prediction performance of epilepsy genes. Specifically, we vary the number of encoder layers in the transformer module in GraphTransNet in the expectation of finding an optimal number of encoder layers. The results are shown in Table 6. We can observe that when the number of encoder layers is 3, the performance is optimal across almost all metrics. However, as the number of encoder layers increases further, the performance gradually declines.
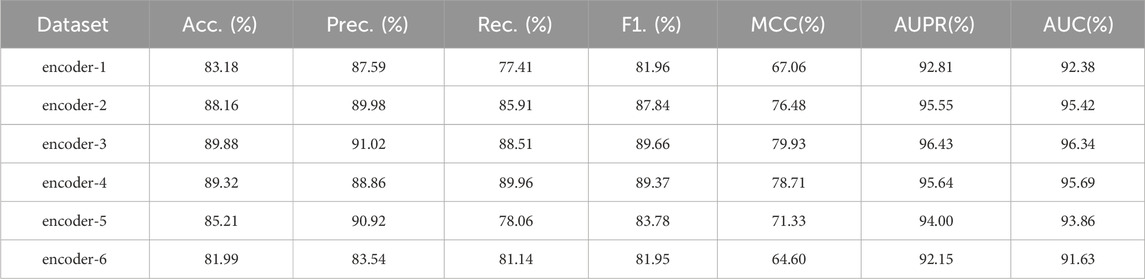
Table 6. Epilepsy gene prediction results of GraphTransNet with different encoder layers under five-fold cross-validation. “encoder-n” means that there are n encoder layers.
In this section, we investigated the prediction performance of GraphTransNet for epilepsy genes with incomplete sequences. Specifically, we intercepted the first 500 amino acids of the sequence corresponding to each gene to explore the prediction performance of GraphTransNet for incomplete sequences. The results are shown in Table 7. In addition, we plotted the ROC and PR curves under five-fold cross validation, as shown in Figure 3. We can observe that the performance degradation on almost all metrics is less than one percent (compare with Table 2). Furthermore, as shown in Figure 3, both AUC and AUPR exceed 0.93 across five-fold cross-validation, demonstrating the stability of GraphTransNet in predicting epilepsy genes with incomplete sequences.

Table 7. Epilepsy gene prediction results of GraphTransNet for incomplete sequences under 5-fold cross validation.
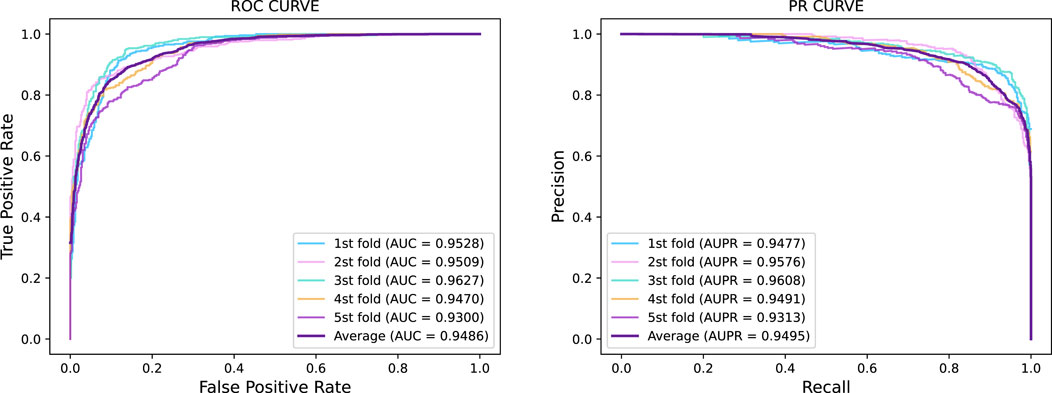
Figure 3. Five-fold cross-validation ROC curve and PR curve of GraphTransNet predicting epilepsy genes with incomplete sequences.
In this section, we introduced noise into the sequences to explore its impact on the performance of GraphTransNet. Specifically, we randomly selected certain continuous segments from the complete sequences and shuffled the selected segments to simulate noise. We conducted a total of five experiments, where we randomly selected and shuffled segments accounting for 10%–50% of the length of the complete sequences. Each experiment was performed using five-fold cross-validation, and the average AUC and AUPR obtained from the five-fold cross-validation were visualized, as shown in Figure 4. We can observe that as the shuffle ratio increases, both AUC and AUPR decrease. However, when the shuffle ratio reaches 50%, both AUC and AUPR remain above 0.85. Additionally, to demonstrate the stability of GraphTransNet in terms of performance at different shuffle ratios, we plotted the ROC and PRC curves from five-fold cross-validation for each shuffle ratio. As shown in Figures 5, 6. As observed, when the shuffle ratio is below 50%, the AUC and AUPR for each validation are consistently above 0.85. Even with a shuffle ratio of 50%, both AUC and AUPR remain above 0.8 in every validation.
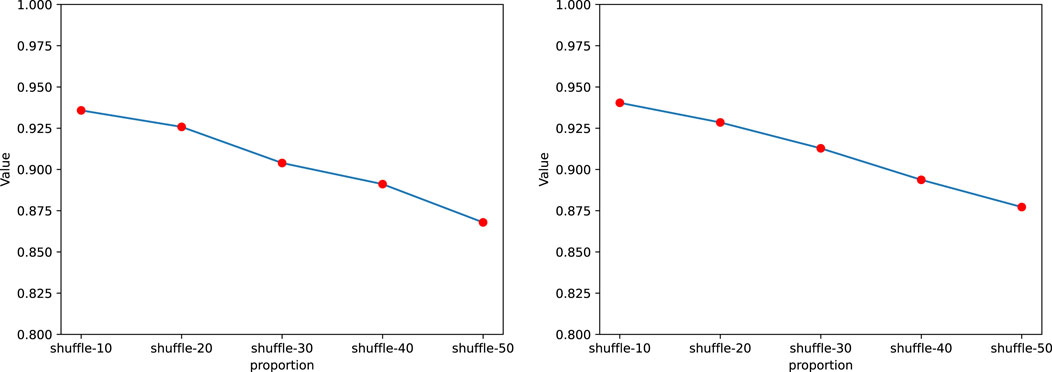
Figure 4. The average AUC and AUPR of GraphTransNet in predicting epilepsy genes under different shuffle ratios.
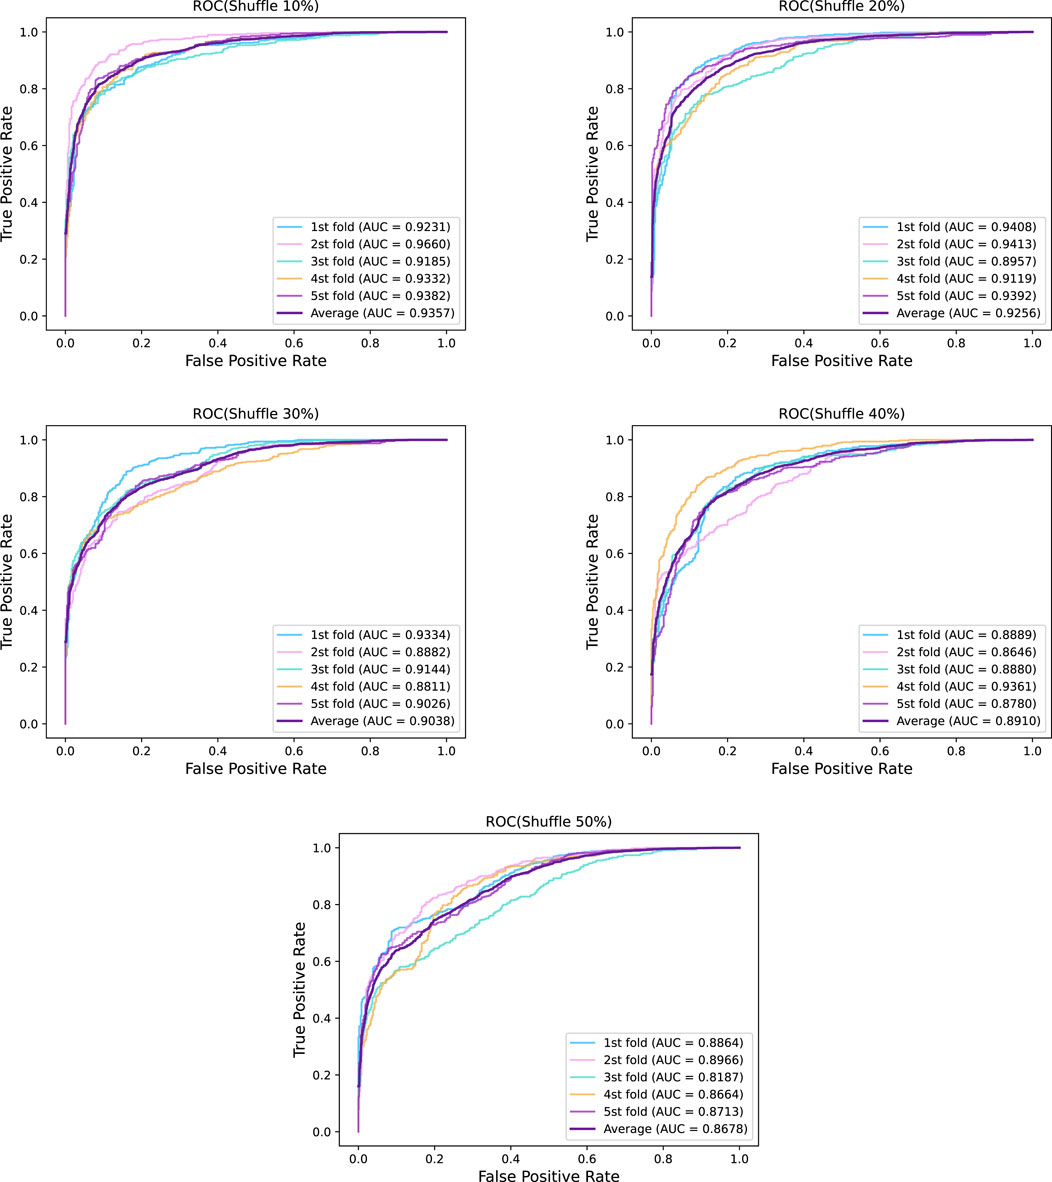
Figure 5. ROC of five-fold cross validation of GraphTransNet at different shuffle ratios.
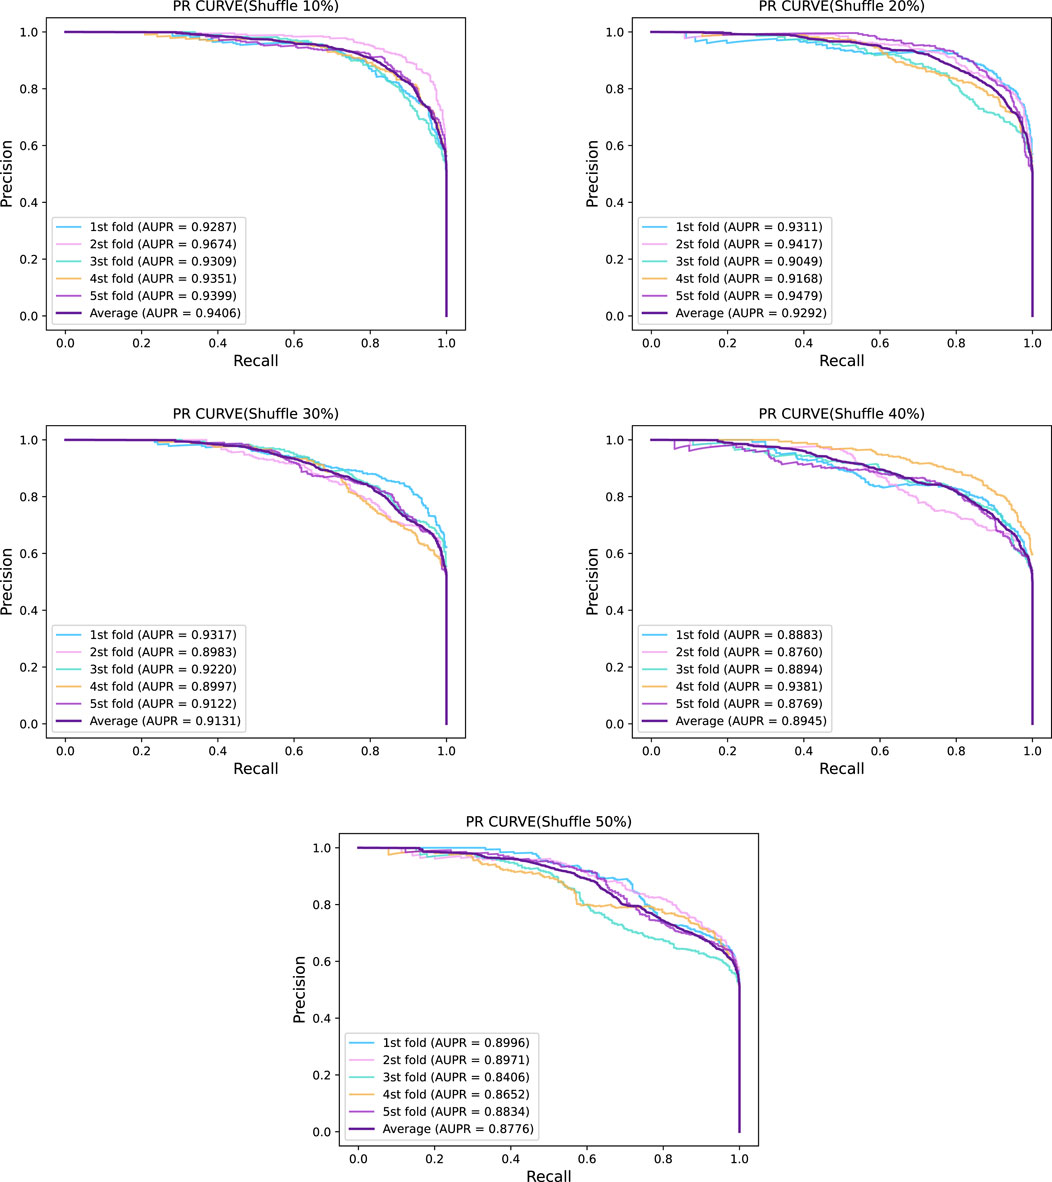
Figure 6. PR Curves of five-fold cross validation of GraphTransNet at different shuffle ratios.
In this study, we introduced GraphTransNet, a deep learning framework specifically designed to predict epilepsy-related Protein-Protein Interactions (PPIs)—a critical advancement for uncovering disease mechanisms and accelerating therapeutic discovery. By integrating structural insights from protein language models with a hybrid Transformer-CNN architecture, our model addresses the unique challenges of mapping dynamic PPIs underlying epileptogenesis. GraphTransNet’s ability to simultaneously resolve local interaction interfaces (e.g., ion channel binding motifs) and global PPI network dependencies (e.g., synaptic complex formations) represents a paradigm shift in computational epilepsy research.
Through rigorous five-fold cross-validation and comprehensive benchmarking, we demonstrated GraphTransNet’s superior performance in PPI prediction accuracy, particularly for noisy biological datasets where traditional methods falter. The model’s robustness stems from its dual capability: the Transformer component identifies long-range structural determinants of PPIs, while CNNs decode evolutionarily conserved interaction patterns within protein sequences. Our ablation studies confirmed that both architectural elements synergistically enhance PPI prediction fidelity, disproving trivial feature reliance and validating the design’s biological relevance.
Beyond technical innovation, GraphTransNet offers transformative practical value. Its computational efficiency enables large-scale PPI network mapping across diverse hardware environments, democratizing access for both research and clinical applications. This capability is particularly crucial for epilepsy, where pathogenic PPIs often involve rare variants in multi-protein complexes like GABA receptors or potassium channel clusters. By systematically prioritizing therapeutically actionable PPIs, our framework bridges the gap between genomic findings and mechanistic insights—a persistent bottleneck in precision neurology.
The clinical implications are profound: GraphTransNet’s PPI-centric predictions provide a roadmap for repurposing existing drugs (e.g., those targeting NMDA receptor interactions) and developing novel biologics to disrupt seizure-driving PPIs. Furthermore, its ability to interpret variant-induced PPI perturbations enhances diagnostic precision for drug-resistant epilepsy cases. As the first model explicitly optimized for epilepsy-specific PPIs, GraphTransNet establishes a new standard for computational target discovery, with potential extensions to other neurological disorders governed by dysregulated interaction networks.
The original contributions presented in the study are included in the article/supplementary material, further inquiries can be directed to the corresponding author.
JX: Methodology, Validation, Writing–original draft, Writing–review and editing. WL: Writing–original draft, Writing–review and editing. HY: Writing–original draft, Writing–review and editing, Methodology, Validation, Visualization. DZ: Conceptualization, Data curation, Writing–original draft, Writing–review and editing.
The author(s) declare that no financial support was received for the research and/or publication of this article.
The authors declare that the research was conducted in the absence of any commercial or financial relationships that could be construed as a potential conflict of interest.
The author(s) declare that no Gen AI was used in the creation of this manuscript.
All claims expressed in this article are solely those of the authors and do not necessarily represent those of their affiliated organizations, or those of the publisher, the editors and the reviewers. Any product that may be evaluated in this article, or claim that may be made by its manufacturer, is not guaranteed or endorsed by the publisher.
Ashish, V., Noam, S., Niki, P., Jakob, U., Llion, J. N., et al. (2017). “Attention is all you need,” in Proceedings of the 31st international conference on neural information processing systems (New York: Curran Associates Inc.), 6000–6010.
Consortium, E. (2013). De novo mutations in epileptic encephalopathies. Nature 501, 217–221. doi:10.1038/nature12439
Consortium, U. (2015). Uniprot: a hub for protein information. Nucleic acids Res. 43, D204–D212. doi:10.1093/nar/gku989
Daniel, C., Derryl, M., Laith, H. A., Rose-Mary, B., Makram, O., and Obeid, M. (2024). High diagnostic yield and clinical utility of next-generation sequencing in children with epilepsy and neurodevelopmental delays: a retrospective study. Int. J. Mol. Sci. 25, 9645. doi:10.3390/ijms25179645
Dc, K., Km, S., De, L., Rk, W., and Er, M. (2013). The next-generation sequencing revolution and its impact on genomics. Cell. 155, 27–38. doi:10.1016/j.cell.2013.09.006
Devinsky, O., Hesdorffer, D. C., Thurman, D. J., Lhatoo, S., and Richerson, G. (2016). Sudden unexpected death in epilepsy: epidemiology, mechanisms, and prevention. Lancet Neurol. 15, 1075–1088. doi:10.1016/S1474-4422(16)30158-2
Elliot, S., Abayomi, M., Ala, A., Annalisa, B., Maria, C., Laurent, G., et al. (2023). The nhgri-ebi gwas catalog: knowledgebase and deposition resource. Nucleic acids Res. 51, D977–D985. doi:10.1093/nar/gkac1010
Ellis, C. A., Petrovski, S., and Berkovic, S. F. (2020). Epilepsy genetics: clinical impacts and biological insights. Lancet Neurology 19, 93–100. doi:10.1016/S1474-4422(19)30269-8
Fisher, R. S., Acevedo, C., Arzimanoglou, A., Bogacz, A., Cross, J. H., Elger, C. E., et al. (2014). Ilae official report: a practical clinical definition of epilepsy. Epilepsia 55, 475–482. doi:10.1111/epi.12550
Holger, L. (2020). Drug-resistant epilepsy — time to target mechanisms. Nat. Rev. Neurol. 16, 595–596. doi:10.1038/s41582-020-00419-y
Janet, P., Àlex, B., Núria, Q.-R., Alba, G.-S., Jordi, D.-P., Emilio, C., et al. (2016). Disgenet: a comprehensive platform integrating information on human disease-associated genes and variants. Nucleic acids Res. 45, D833–D839. doi:10.1093/nar/gkw943
Ji, B., Wang, X., Wang, X., Xu, L., and Peng, S. (2025). sicca: deciphering the dominant cell communication assembly of downstream functional events from single-cell rna-seq data. Briefings Bioinforma. 26, bbae663. doi:10.1093/bib/bbae663
Ji, B., Zou, H., Xu, L., Xie, X., and Peng, S. (2024). Muscle: multi-view and multi-scale attentional feature fusion for microrna–disease associations prediction. Briefings Bioinforma. 25, bbae167. doi:10.1093/bib/bbae167
Ji, B.-Y., You, Z.-H., Cheng, L., Zhou, J.-R., Alghazzawi, D., and Li, L.-P. (2020a). Predicting mina-disease association from heterogeneous information network with grarep embedding model. Sci. Rep. 10, 6658. doi:10.1038/s41598-020-63735-9
Ji, B.-Y., You, Z.-H., Jiang, H.-J., Guo, Z.-H., and Zheng, K. (2020b). Prediction of drug-target interactions from multi-molecular network based on line network representation method. J. Transl. Med. 18, 347–411. doi:10.1186/s12967-020-02490-x
Jie, W., Zhi-Jian, L., Liu, L., Hai-Qing, X., Yi-Wu, S., Yong-Hong, Y., et al. (2017). Epilepsy-associated genes. Seizure 44, 11–20. doi:10.1016/j.seizure.2016.11.030
Kenji, K. (2016). “Deep learning without poor local minima,” in Advances in neural information processing systems. Editors D. Lee, M. Sugiyama, U. Luxburg, I. Guyon, and R. Garnett (Curran Associates, Inc).
Landrum, M. J., Lee, J. M., Mark, B., Garth, B., Chen, C., Shanmuga, C., et al. (2016). Colinear: public archive of interpretations of clinically relevant variants. Nucleic acids Res. 44, D862–D868. doi:10.1093/nar/gkv1222
Lecun, Y., Bottou, L., Bengio, T., and Haffner, L. (1998). Gradient-based learning applied to document recognition. Proc. IEEE 86, 2278–2324. doi:10.1109/5.726791
Liang, S.-Z., Wang, L., You, Z.-H., Yu, C.-Q., Wei, M.-M., Wei, Y., et al. (2025). Predicting circrna–disease associations through multisource domain-aware embeddings and feature projection networks. J. Chem. Inf. Model. 65, 1666–1676. doi:10.1021/acs.jcim.4c02250
Lin, Z., Akin, H., Rao, R., Hie, B., Zhu, Z., Lu, W., et al. (2023). Evolutionary-scale prediction of atomic-level protein structure with a language model. Science 379, 1123–1130. doi:10.1126/science.ade2574
Myers, C. T., and Mefford, H. C. (2015). Advancing epilepsy genetics in the genomic era. Genome Med. 7, 91. doi:10.1186/s13073-015-0214-7
Oliver, K. L., Scheffer, I. E., Bennett, M. F., Grinton, B. E., Bahlo, M., and Berkovic, S. F. (2023). Genes4epilepsy: an epilepsy gene resource. Epilepsia 64, 1368, 1375. doi:10.1111/epi.17547
Rumelhart, D. E., Hinton, G. E., and Williams, R. J. (1986). Learning representations by back-propagating errors. Nature 323, 533–536. doi:10.1038/323533a0
Scheffer, I. E., and Berkovic, S. F. (1997). Generalized epilepsy with febrile seizures plus. a genetic disorder with heterogeneous clinical phenotypes. Brain a J. neurology 120, 479–490. doi:10.1093/brain/120.3.479
Thurman, D. J., Beghi, E., Begley, C. E., Berg, A. T., Buchhalter, J. R., Ding, D., et al. (2011). Standards for epidemiologic studies and surveillance of epilepsy. Epilepsia 52, 2–26. doi:10.1111/j.1528-1167.2011.03121.x
Wang, L., Wong, L., You, Z.-H., and Huang, D.-S. (2023). Amdecda: attention mechanism combined with data ensemble strategy for predicting circrna-disease association. IEEE Trans. Big Data 10, 320–329. doi:10.1109/tbdata.2023.3334673
Wei, M., Wang, L., Li, Y., Li, Z., Zhao, B., Su, X., et al. (2024). Biokg-cmi: a multi-source feature fusion model based on biological knowledge graph for predicting circrna-mirna interactions. Sci. China Inf. Sci. 67, 189104. doi:10.1007/s11432-024-4098-3
Keywords: epilepsy-associated interactions, epilepsy diseases, transformer, protein language model, deep learning
Citation: Xie J, Li W, You H and Zhang D (2025) GraphTransNet: predicting epilepsy-related genes using a graph-augmented protein language model. Front. Pharmacol. 16:1584625. doi: 10.3389/fphar.2025.1584625
Received: 27 February 2025; Accepted: 19 March 2025;
Published: 01 April 2025.
Edited by:
Lei Wang, Chinese Academy of Sciences (CAS), ChinaReviewed by:
Zhen-Hao Guo, University of Chinese Academy of Sciences, ChinaCopyright © 2025 Xie, Li, You and Zhang. This is an open-access article distributed under the terms of the Creative Commons Attribution License (CC BY). The use, distribution or reproduction in other forums is permitted, provided the original author(s) and the copyright owner(s) are credited and that the original publication in this journal is cited, in accordance with accepted academic practice. No use, distribution or reproduction is permitted which does not comply with these terms.
*Correspondence: Wei Li, cmpfd2xpQGhudS5lZHUuY24=
Disclaimer: All claims expressed in this article are solely those of the authors and do not necessarily represent those of their affiliated organizations, or those of the publisher, the editors and the reviewers. Any product that may be evaluated in this article or claim that may be made by its manufacturer is not guaranteed or endorsed by the publisher.
Research integrity at Frontiers
Learn more about the work of our research integrity team to safeguard the quality of each article we publish.