 Clare R. Harwood1,2
 David A. Sykes1,2,3*
 Theo Redfern-Nichols4
 Owen Underwood3Colin Nicholson1,2Armin N. Khoshgrudi1,2Eline J. Koers1,2
 Graham Ladds2,4
 Stephen J. Briddon1,2*
 Dmitry B. Veprintsev1,2,3*
- 1Division of Physiology, Pharmacology and Neuroscience, School of Life Sciences, University of Nottingham, Nottingham, United Kingdom
- 2Centre of Membrane Proteins and Receptors (COMPARE), University of Birmingham and University of Nottingham, Nottingham, United Kingdom
- 3Z7 Biotech Ltd., Nottingham, United Kingdom
- 4Department of Pharmacology, University of Cambridge, Cambridge, United Kingdom
Introduction: The β2-adrenoceptor (β2AR) is a class A G protein-coupled receptor (GPCR). It is therapeutically relevant in asthma and chronic obstructive pulmonary disease (COPD), where β2AR agonists relieve bronchoconstriction. The β2AR is a prototypical GPCR for structural and biophysical studies. However, the molecular basis of agonist efficacy at the β2AR is not understood. We hypothesised that the kinetics of GPCR–G protein interactions could play a role in determining ligand efficacy. By studying a range of agonists with varying efficacy, we examined the relationship between ligand-induced mini-Gs binding to the β2AR and ligand efficacy, along with the ability of individual ligands to activate the G protein in cells.
Methods: We used NanoBRET technology to measure ligand-induced binding of purified Venus-mini-Gs to β2AR-nLuc in membrane preparations under both equilibrium and kinetic conditions. In addition, we examined the ability of these β2AR agonists to activate the heterotrimeric Gs protein, measured using the Gs-CASE protein biosensor in living cells. This assay detects a reduction in NanoBRET between the nano-luciferase (nLuc) donor on the Gα subunit and Venus acceptor on the Gγ upon Gs protein activation.
Results: The 12 β2AR agonists under study revealed a broad range of ligand potency and efficacy values in the cellular Gs-CASE assays. Kinetic characterisation of mini-Gs binding to the agonist β2AR complex revealed a strong correlation between ligand efficacy values (Emax) and mini-Gs affinity (Kd) and its association rate (kon). In contrast, there was no correlation between ligand efficacy and reported ligand dissociation rates (or residence times).
Conclusion: The association rate (kon) of the G protein to the agonist β2AR complex is directly correlated with ligand efficacy. These data support a model in which higher-efficacy agonists induce the β2AR to adopt a conformation that is more likely to recruit G protein. Conversely, these data did not support the role of agonist binding kinetics in determining the molecular basis of efficacy.
Introduction
G protein-coupled receptors (GPCRs) are the largest family of membrane proteins in the human genome and are responsible for modulating a broad range of hormonal, neurological, and immune responses. GPCR-directed therapeutics currently target over 100 diverse receptors and represent 34% of all US Food and Drug Administration (FDA)-approved drugs, making them the most widely targeted receptors (Hauser et al., 2017). Despite their therapeutic importance, the molecular basis of ligand efficacy—the ability of a drug to affect GPCR signal transduction—is not fully understood. It is hoped that a deeper understanding of the molecular basis of efficacy will aid in more rational drug design.
The process of GPCR activation involves agonist binding, a ligand-induced conformational change in the receptor and the subsequent recruitment and activation of a G protein. Several studies have implicated ligand residence time in the molecular basis of efficacy at GPCRs. For example, a positive correlation has been observed between the efficacy of seven agonists at the muscarinic M3 receptor and 10 agonists at the adenosine A2A receptor (A2AR) with their ligand residence time (Sykes et al., 2009b; Guo et al., 2012). Conversely, no correlation between efficacy and residency time was found for ligands at the adenosine A1 receptor (Louvel et al., 2014).
Biophysical studies have shown that agonists shift the receptor conformational landscape in favour of a unique active conformation, compared to the unliganded state (Deupi and Kobilka, 2010; Mary et al., 2012; Nygaard et al., 2013), but how conformational differences in a population translate to greater or lesser signalling responses remains to be fully elucidated. Structural studies have found little differences in GPCR conformations adopted by ligand-bound GPCR–G-protein complexes (Masureel et al., 2018; Zhang et al., 2020). However, using nuclear magnetic resonance (NMR), Liu et al. (2012) showed efficacy-dependent differences in the conformational state of β2AR bound to different agonists prior to G protein binding. Similar results have been observed for the β1AR (Grahl et al., 2020; Jones et al., 2024) and A2AR (Ye et al., 2016). Alternatively, some studies (Nikolaev et al., 2006; Gregorio et al., 2017) show correlations between ligand efficacy and the rate of GPCR and G protein activation, suggesting a key role for G protein binding kinetics in dictating pharmacological efficacy.
Consequentially, we aimed to delineate the roles of ligand binding and receptor–G protein binding kinetics in agonist efficacy. We focused on the β2-adrenoceptor (β2AR), a prototypical class A GPCR, which is one of the most structurally, functionally, and therapeutically well-characterised GPCRs. The β2AR is also an essential target in the treatment of asthma and COPD, and as a result, a wide range of clinically used agonists of varying efficacies have been developed to target the β2AR, which could be utilised in this study.
G proteins are heterotrimeric, consisting of α, β, and γ subunits The Gα subunit comprises of a helical and GTPase domain. Full-length heterotrimeric G proteins are dynamic complexes that are difficult to isolate. To overcome this, we chose to utilise mini-G proteins (Carpenter and Tate, 2016) as tools to study the dynamics of β2AR activation. The mini-Gs protein is the isolated GTPase domain of the Gα subunit, which has been engineered with several thermostabilising mutations that make it a rigid protein, locked in its active state, as shown in the agonist-bound A2AR-mini-Gs structure (Carpenter et al., 2016; Carpenter and Tate, 2017). These mini-G proteins have also been converted into convenient probes that report the active state of a GPCR (Wan et al., 2018).
We investigated the binding kinetics and affinity of fluorescently labelled (Venus-fused) mini-Gs proteins for the β2AR in complex with a set of agonists of varying efficacy, from partial to full agonists. In addition, we correlated ligand binding affinities, residence times, and efficacy at the level of heterotrimeric Gs protein activation for these agonists.
Materials, instruments and software
Materials
The T-REx™-293 Cell Line was obtained from Invitrogen (CA, United States). T75 and T175 mammalian cell culture flasks were purchased from Fisher Scientific (Loughborough, United Kingdom). All cell culture reagents, including Hank’s balanced salt solution (HBSS), phosphate-buffered saline (PBS), and foetal calf serum (FCS), were purchased from Sigma Aldrich (Gillingham, United Kingdom), except for blasticidin, which was obtained from Gibco™ (MA, United States), and Zeocin™. Polyethylenimine (PEI) (25 kDa) was obtained from Polysciences Inc. (PA, United States), and the culture plates were obtained from Greiner Bio-One (code 655098 Kremsmünster, Austria).
HisTrap FF crude 5-mL columns were obtained from GE Healthcare (IL, United States). Vivaspin protein concentrators were obtained from Sartorius (Göttingen, Germany). Slide-A-Lyzer Dialysis Cassettes, NuPAGE LDS Sample Buffer, NuPAGE 4%–12% Bis-Tris 15 × 1.0 mm well gels, NuPAGE MOPS SDS Running Buffer, PageRuler Prestained Protein Ladder, were all obtained from Thermo Fisher (MA, United States).
Salmeterol was obtained from Tocris (Bristol, U.K). Formoterol hemifumarate was obtained from APExBIO (TX, United States), and BI-167-107 was obtained from Boehringer Ingelheim (Ingelheim, Germany). Compound 26 was a gift from Novartis. (±)-Epinephrine hydrochloride, noradrenaline, salbutamol hemisulfate, and isoprenaline hydrochloride were purchased from Sigma-Aldrich (Gillingham, United Kingdom). Dobutamine hydrochloride was obtained from Merck Life Sciences, UK. Isoxsuprine hydrochloride, ritodrine hydrochloride, and tulobuterol were obtained from CliniSciences Limited. Nano-Glo luciferase substrate was obtained from Promega (WI, United States). All other chemicals were purchased from Sigma-Aldrich (Gillingham, United Kingdom).
Instruments and software
BMG PHERAstar FSX plate reader (BMG Labtech, Offenburg, Germany), fitted with BRET1 plus optic module (ex. 475/30 nm, em. 535/30 nm) and MARS software, was purchased from BMG Labtech (Offenburg, Germany). GraphPad Prism 9 was purchased from GraphPad Software (San Diego, United States). Microsoft Excel™ XP was purchased from Microsoft (Washington, United States).
Methods
Molecular biology
The construct pcDNA4TO-TwinStrep (TS)-SNAP-β2AR was generated through the amplification of the SNAP and β2AR sequences from the pSNAPf-ADRB2 plasmid (NEB) and inserted into pcDNA4TO-TS using Gibson assembly (Heydenreich et al., 2017). pcDNA4TO-TS-SNAP-β2AR-nLuc was generated by Dr. Brad Hoare through the amplification of pcDNA4TO-TS-SNAP-β2AR and nanoLuc, with the insertion of nanoLuc into pcDNA4TO-TS-SNAP-β2AR via Gibson assembly. Both constructs used a signal peptide based on the 5HT3A receptor to increase protein folding and expression. The CASE Gs (or Gs-CASE) protein constructs were designed and optimised by the Schulte Lab (Schihada et al., 2021) and were obtained from Addgene. Mammalian Venus-fused mini-Gs constructs were a kind gift from Nevin Lambert (Wan et al., 2018). For the bacterial expression of Venus-mini-Gs and mini-Gs, protein encoding DNA sequences were amplified from the corresponding mammalian constructs and inserted into the pJ411 vector containing MKK-HIS10-TEV N-terminal tag (Sun et al., 2015) via Gibson assembly, yielding the constructs MKK-HIS10-TEV-mini-Gs and MKK-HIS10-TEV-Venus-mini-Gs.
Transfection and mammalian cell culture
pcDNA4TO-TS-SNAP-β2AR or pcDNA4TO-TS-SNAP-β2AR-nLuc was stably transfected into T-REx™-293 cells (Invitrogen) using PEI. A stable mixed population was selected by resistance to 5 μg/mL blasticidin and 20 μg/mL zeocin. Stable cell lines were maintained in high-glucose DMEM (Sigma D6429) with 10% FBS, 5 μg/μL blasticidin, and 20 μg/μL zeocin at 37°C in a humidified atmosphere of 5% CO2. When ∼70% confluent, TS-SNAP-β2AR or TS-SNAP-β2AR-nLuc expression was induced with 1 μg/mL tetracycline. Cells were left to express for 50 h before harvesting for assays. The T-REx™-293 pcDNA4TO-TS-SNAP-β2AR-CASE Gs stable cell line was generated by stably transfecting the CASE Gs constructs into the T-REx™-293 pcDNA4TO-TS-SNAP-β2AR using PEI. A mixed population stable cell line was generated by selection with 500 μg/mL G418, and then a single colony population was generated via FACS.
Membrane preparations of TS-SNAP-β2AR-nLuc
For membrane preparation, all steps were conducted at 4°C to avoid tissue degradation. Cell pellets were thawed and re-suspended using ice-cold buffer containing 10 mM HEPES and 10 mM EDTA (pH 7.4). The suspension was homogenised using an electrical homogeniser (ULTRA-TURRAX, IKA-Werke GmbH, Germany) and subsequently centrifuged at 1,200 × g for 5 min. The pellet obtained, containing cell nucleus and other heavy organelles, was discarded, and the supernatant was centrifuged for 30 min at 48,000 × g at 4°C (Beckman Avanti J-251 Ultra-centrifuge; Beckman Coulter). The supernatant was discarded, and the pellet was re-suspended in the same buffer (10 mM HEPES and 10 mM EDTA; pH 7.4) and centrifuged again for 30 min as described above. Finally, the supernatant was discarded, and the pellet was re-suspended in ice-cold 10 mM HEPES and 0.1 mM EDTA (pH 7.4). Protein concentration determination was carried out using the bicinchoninic acid assay kit (Sigma-Aldrich) with BSA as the standard. The final membrane suspension was aliquoted and maintained at −80°C until required for the assays.
Solubilisation of the TS-SNAP-β2AR or TS-SNAP-β2AR-nLuc
TS-SNAP-β2AR or TS-SNAP-β2AR-nLuc was solubilised from stably transfected T-RExTM-293 cell membranes, as described previously (Harwood et al., 2024). Solubilisation was carried out using 1% DDM (w/v) in 20 mM HEPES, 5% (v/v) glycerol, and 150 mM NaCl, pH 8, at 4°C for 2–3 h. Samples were clarified by ultracentrifugation at 4°C for 1 h at 100,000 × g.
Production of mini-Gs
His-TEV-Venus-mini-Gs and His-TEV-mini-Gs were expressed in NiCo21(DE3) E. coli, cultured in Terrific Broth (Gibco). 1L cultures were induced with 1 mM isopropyl β-D-1-thiogalactopyranoside (IPTG) at OD = 0.6 and incubated for a further 20 h at 20°C and 225 RPM. Pellets from 1L cultures were thawed on ice, and re-suspended in 50 mL lysis buffer (20 mM HEPES, pH 7.5, 500 mM NaCl, 40 mM imidazole, 10% glycerol, 8 mM β-mercaptoethanol (BME), 1 μM guanosine diphosphate (GDP), complete protease inhibitors (Roche), DNase I, and lysozyme) using a Dounce homogeniser. Lysis occurred on ice via sonication, using a Vibra-Cell probe sonicator with 5 × 10-s pulses, 30 s apart. The lysate was loaded onto the HisTrap FF crude 5-mL column, using ÄKTA™ start protein purification system at a flow rate of 5 mL/min. The system and column had been equilibrated with 10 column volumes (CV) of buffer A (20 mM HEPES, 500 mM NaCl, 40 mM imidazole, 10% glycerol, 8 mM BME, and 1 μM GDP). Unbound protein was washed out with 10 CV of buffer A. Bound protein was then eluted over an 8 CV gradient of 0% to 100% buffer B at a flow rate of 5 mL/min (Buffer B = 20 mM HEPES, 500 mM NaCl, 400 mM imidazole, 10% glycerol, 8 mM BME, and 1 μM GDP). The presence of His-TEV-Venus-mini-Gs and His-TEV-mini-Gs was confirmed by SDS-PAGE analysis and InstantBlue staining for protein. Pooled elution fractions were then concentrated using 10,000 or 30,000 molecular weight cutoff (MWCO) Vivaspin protein concentrators by centrifugation at 3000 × g and 4°C for 15-min intervals over 2–3 h. Protein was exchanged into assay buffer using Slide-A-Lyzer 10,000 or 30,000 MWCO dialysis cassettes for untagged and Venus-tagged mini-Gs protein samples, respectively. Dialysis occurred overnight at 4°C under constant stirring. The assay buffer consisted of 20 mM HEPES, 150 mM NaCl, 10% glycerol, 8 mM BME, and 1 μM GDP. The purified mini-Gs protein was flash-frozen using liquid nitrogen and stored at −80°C.
Membrane-based TS-SNAP-β2AR-Venus-mini-Gs NanoBRET binding assays
The assay buffer, consisting of HBSS (Sigma H8264) containing 10 mM HEPES, 0.1% BSA, and 0.1% ascorbic acid, pH 7.4, was used in all NanoBRET assays. For recruitment assays, varying concentrations of β2AR agonists were used to recruit Venus-mini-Gs to the TS-SNAP-β2AR. Assays were run in 50 μL volumes in white 384-well OptiPlate (Revvity). Receptor, ligand, 0.3 μM mini-Gs proteins, and 10 μM furimazine were added to the plate and incubated for 60 min at room temperature before reading on PHERAstar FSX using the BRET1 module. For kinetic assays, in which the affinity of Venus-mini-Gs for the agonist-bound TS-SNAP-β2AR-nLuc receptors was measured over time, assays were run in 50 μL volumes in white 384-well OptiPlate. Varying concentrations (10–300 nM) of Venus-mini-Gs were added to assay plates. TS-SNAP-β2AR membranes were pre-incubated with saturating concentrations (100x EC50) of selected β2AR agonists and furimazine for 15 min prior to addition to the plate. TS-SNAP-β2AR membranes were added to the plate offline and mixed with the Venus-mini-Gs on a plate shaker (MixMate, Eppendorf) at 600 RPM for 10 s. The mixture was then immediately read on PHERAstar FSX as described above, with readings taken over a period of 240 min.
Gs-CASE activation assays
For Gs-CASE activation assays, a single population of T-REx™-293 stably expressing pcDNA4TO-TS-SNAP-β2AR and CASE Gs was plated at 50,000 cells/well in 96-well plates, in a volume of 100 μL, and induced for 48 h with 1 μg/mL tetracycline at 37°C and 5% CO2. Plates were washed once with 100 μL/well assay buffer (HBSS containing 10 mM HEPES, 0.1% BSA, and 0.1% ascorbic acid) prior to the addition of 90 μL/well of assay buffer containing 10 μM furimazine, diluted in assay buffer, to achieve a final concentration of 8 μM. The plates were incubated at 37°C and 5% CO2 for 20 min. A white back seal was placed on the underside of the plate, and luminescence was read on a PHERAstar FSX using the BRET1 module for 3 min to establish a baseline BRET signal. The plate reader was then paused, and 10 μL of ×10 ligand dilutions were added accordingly. Readings were taken over a period of 30 min.
Mathematical modelling
The previously described ordinary differential model (ODE) of the cubic ternary complex model (Weiss et al., 1996), with additional reactions to simulate the G protein activation cycle, was used (Woodroffe et al., 2009; Bridge et al., 2018). The model, encoded in COPASI (Hoops et al., 2006), includes ligand binding, receptor activation, G protein binding, and the G protein cycle, whereby the model output is activated G protein GαGTP and receptor occupancy (Bridge et al., 2018). Prior to the addition of the ligand, we first compute the system for 106 s. To enable the simulation of the data, the cooperativity factor β (see Supplementary Figure 7; Supplementary Table 3) was varied, and simulations were performed. Steady state was reached after 5 min, and outputs are shown after 10 min.
Data analysis
All non-linear regression and statistical analyses were performed using GraphPad Prism 9. Multiple replicates were combined, such as TR-FRET equilibrium binding curves and mini-Gs equilibrium recruitment curves, as shown in Supplementary Material. Data points for each replicate were normalised to the maximum value obtained for each ligand in each experiment. Competition ligand-binding data were fitted to a one-site model (Equation 1).
where Y is the binding of tracer, x = Log [ligand], IC50 is the concentration of the competing ligand that displaces 50% of radioligand-specific binding.
CASE Gs activation data from individual experiments were fitted to sigmoidal (variable slope) curves using a “four-parameter logistic equation” (Equation 2):
where Bottom is the plateaus of the agonist concentration response curve and Top is the basal response (fixed to 1). LogEC50 is the concentration of the agonist that produces a half-maximal effect, and the Hillslope is the unitless slope factor or Hillslope, which was fixed to −1.
Mini-Gs association data were fitted to a global fitting model (Equation 3) using GraphPad Prism 9.2 to simultaneously calculate kon and koff using the following equations, where kobs equals the observed rate of association and L is the concentration of mini-Gs.
Saturation binding curves for Venus-mini-Gs binding to the agonist TS-SNAP-β2AR-nLuc were fitted to a one-site specific binding model according to Equation 4. The final Kd values were taken as an average of Kd values from individual specific curve fits.
where Y is the specific binding, Kd is the equilibrium dissociation constant of the labelled ligand (in this case, Venus-mini-Gs), and x represents [Venus-mini-Gs] in nM.
Statistical analysis
Pearson’s correlation coefficient was used to investigate correlations between mini-Gs recruitment, CASE-Gs activation, mini-Gs binding Kd, kon and koff values, and literature pKi/d. Deming regression was applied to determine the line of best fit while accounting for errors in observations on both the x- and y-axes. All statistical analyses were performed in GraphPad Prism 9, and p < 0.05 was considered statistically significant.
Results
Characterisation of β2AR agonist efficacy for Gs activation
To produce a suitable dataset for analysis, we chose 12 β2AR agonists anticipated to have a diverse range of efficacies, affinities, and ligand binding kinetics. We first characterised the efficacy of these compounds in activating the heterotrimeric Gs protein using a NanoBRET-based biosensor (Schihada et al., 2021; Harwood et al., 2024). In this assay format, Gs protein activation results in a decrease in the NanoBRET signal as the nLuc-labelled α-subunit of the Gs protein dissociates from the Venus-labelled γ-subunit. These experiments are summarised in Figures 1A–C and Table 1.
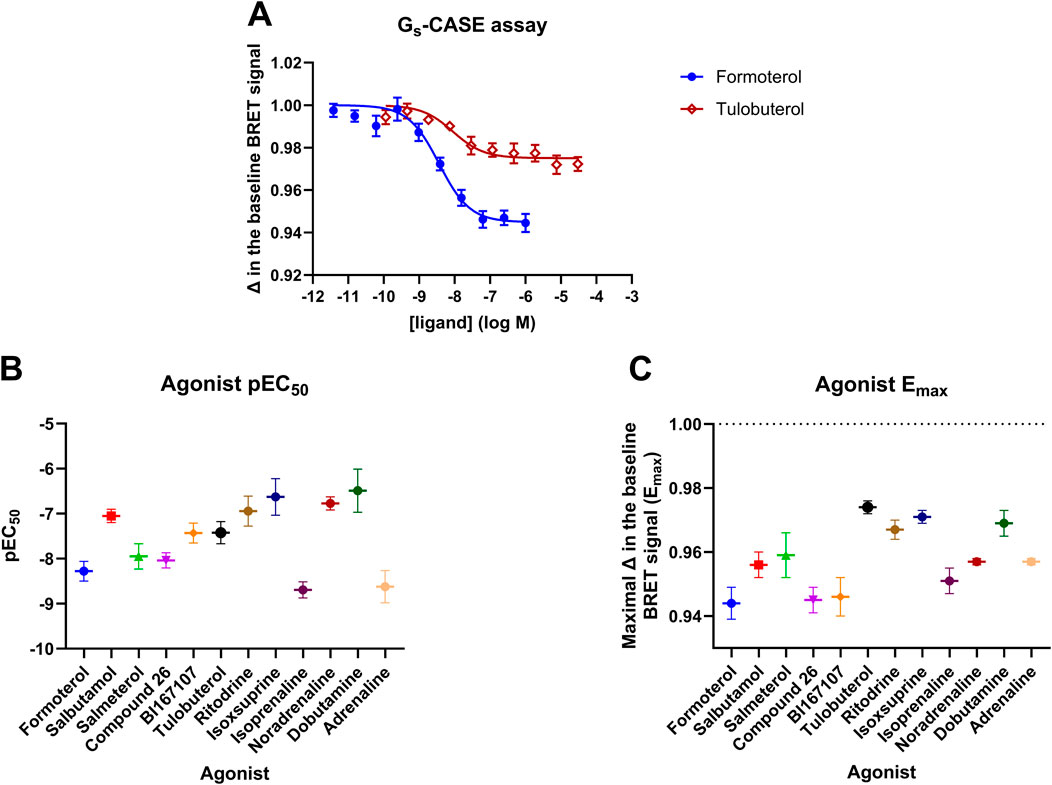
Figure 1. T-RExTM-293-SNAP-β2AR Gs-CASE activation assay. (A) Concentration-response curves are shown for the full agonist formoterol and the partial agonist tulobuterol. The Gs-CASE baseline BRET signal was set to 1 for normalisation purposes. The response to each agonist is expressed as a fractional change relative to the basal response. Response data are representative of three or more experiments. (B) Gs-CASE pEC50 and (C) Emax values are shown for the 12 agonists. Data are presented as the mean ± SEM of three or more experiments.
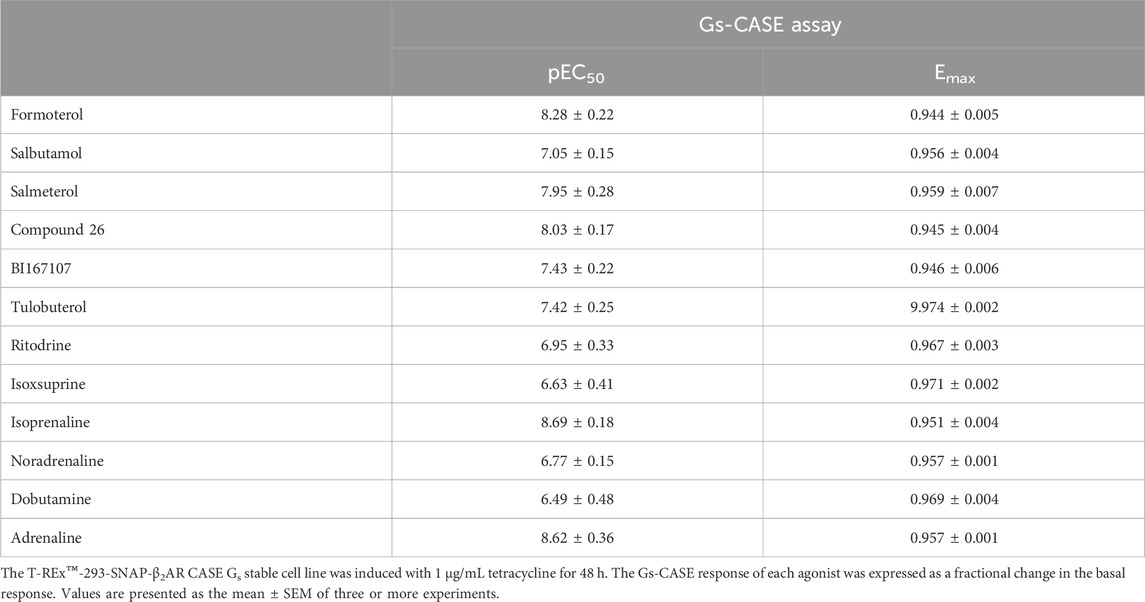
Table 1. Summary of efficacy and potency values obtained for β2AR agonists in the Gs-CASE activation assay.
The Gs-CASE assay functions as a non-amplified system, showing very distinct differences in measurable efficacy between full and partial agonists. The concentration-response curves for formoterol (full) and tulobuterol (partial agonist) are shown in Figure 1A. A broad range of potencies was observed for the 12 tested ligands, with pEC50 values ranging from 6.49 ± 0.48 for dobutamine to 8.69 ± 0.18 for isoprenaline (see Figure 1B; Table 1). Figure 1C shows a range of efficacy values for each agonist, represented by Emax (maximal decrease in basal BRET) values, with the lowest efficacy agonists being tulobuterol and isoxsuprine and the highest being formoterol and Compound 26.
Validation of mini-Gs proteins as tools for probing Gs protein binding
In order to investigate the mechanism underlying the differences in efficacy, we expressed and purified fluorescently labelled mini-Gs proteins from E. coli (Supplementary Figure 1); our aim was to probe the affinity and binding kinetics of Venus-mini-Gs protein for the agonist-bound β2AR–nLuc complex using NanoBRET. Figure 2A shows that all 12 agonists recruited Venus-mini-Gs protein to β2AR-nLuc in HEK cell membranes in a concentration-dependent manner, with varying Emax and pEC5o values (Table 2). Moreover, Figure 2B reveals a strong correlation (R2 = 0.80, p = 0.0001) between Emax values for mini-Gs recruitment and Emax values for Gs-CASE activation, further validating these assays as effective tools for investigating β2AR–Gs interactions.
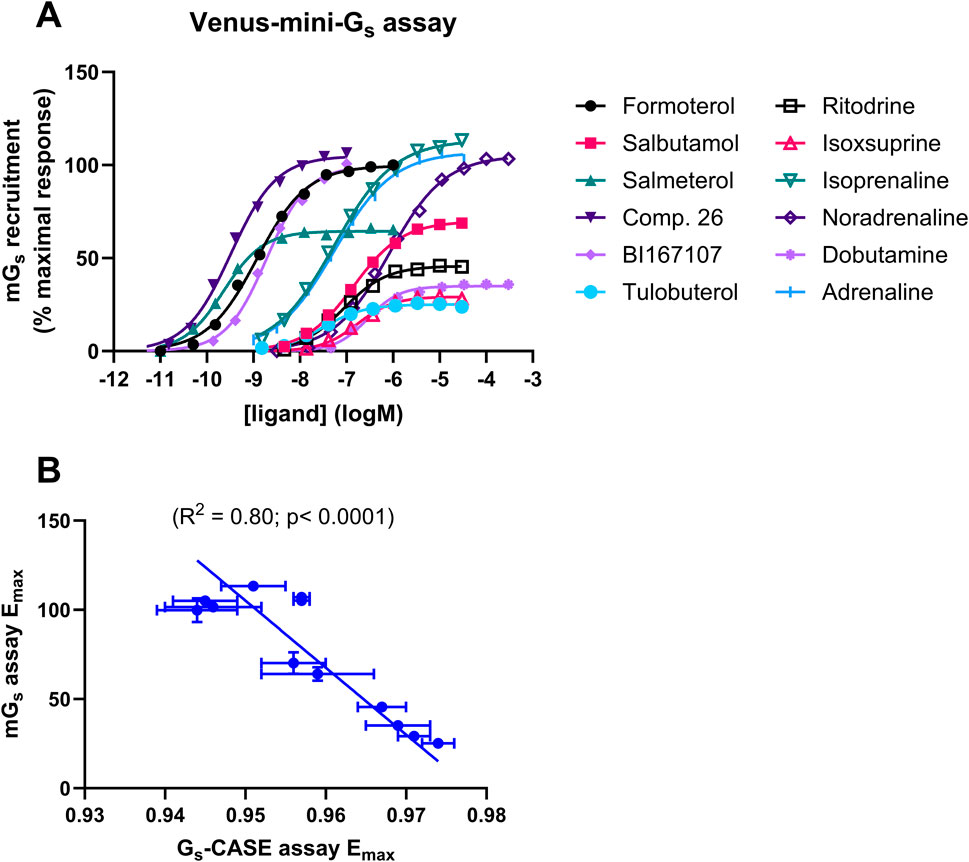
Figure 2. β2AR ligand efficacy determined in the Venus-mini-Gs recruitment assay. (A) Ligand-induced increases in BRET, following the recruitment of Venus-labelled mini-Gs to β2AR-nLuc. The Venus-mini-Gs ligand-response amplitude of each agonist was compared to the maximal response of formoterol (1 μM). (B) Correlation of the Gs-CASE assay-response amplitude, expressed as the maximal Δ (Emax) in the baseline BRET signal, with Emax measured in the mini-Gs recruitment assay. Data are presented as the mean ± SEM of three experiments.
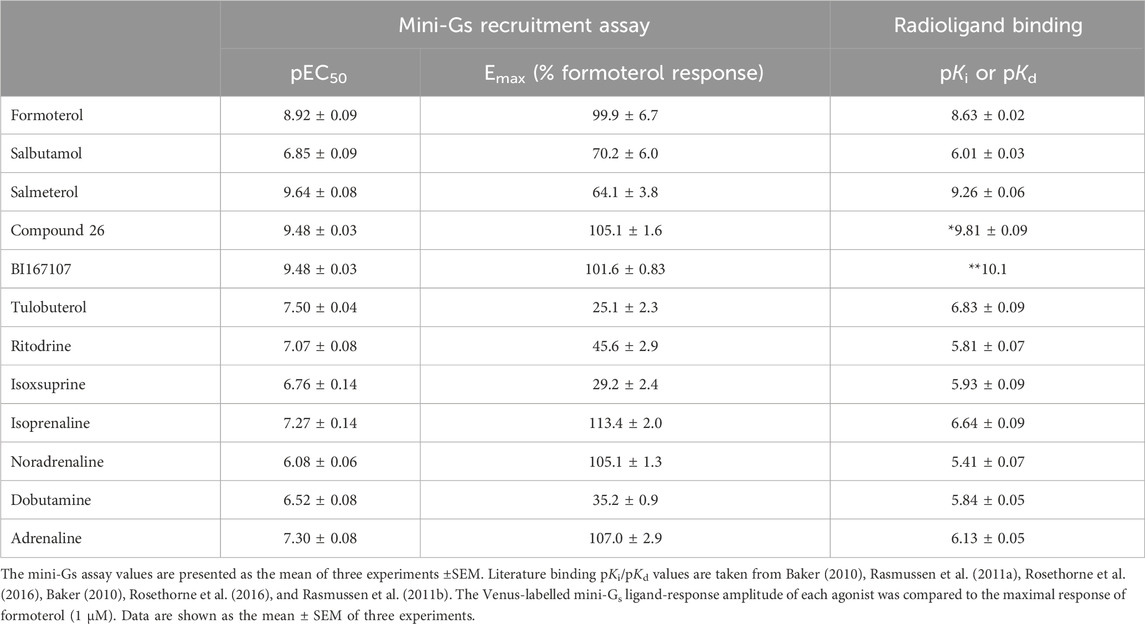
Table 2. Summary of mini-Gs assay potency (pEC50) and efficacy (Emax) values and literature pKi values for the 12 agonists of varied efficacy under study.
Investigating the kinetics of mini-Gs protein binding to the β2AR in complex with agonists of varying efficacies
We established a kinetic NanoBRET binding assay to measure Venus-mini-Gs protein recruitment to β2AR-nLuc in membrane preparations. To achieve this, we pre-incubated receptor-containing membranes with a saturating concentration (×100 EC50) of each β2AR agonist, as characterised above. The pre-incubated membranes were then added to a plate containing various concentrations of Venus-mini-Gs protein, and we measured the association between these two proteins using NanoBRET (Figure 3; Table 3). Both association and dissociation rates (kon and koff) of Venus-mini-Gs for agonist β2AR-nLuc could be obtained by analysing the observed association kinetics (Table 3). These studies showed that the full agonists, isoprenaline (kon = 3.00 ± 0.1 × 10⁵ M−1 min−1) and adrenaline (kon = 3.06 ± 0.15 × 10⁵ M−1 min−1), induce faster recruitment of the mini-Gs protein than the partial agonists, ritodrine (kon = 6.13 ± 0.75 × 10⁴ M−1 min−1) and isoxsuprine (kon = 4.97 ± 0.29 × 10⁴ M−1 min−1). koff values were similar for all ligands, with all values within the range of 0.0070–0.0113 min−1. We also conducted these mini-Gs kinetics studies on β2AR-nLuc extracted into DDM detergent micelles, using 6 of the 12 ligands (Supplementary Figure 2; Supplementary Table 1) and observed similar results.
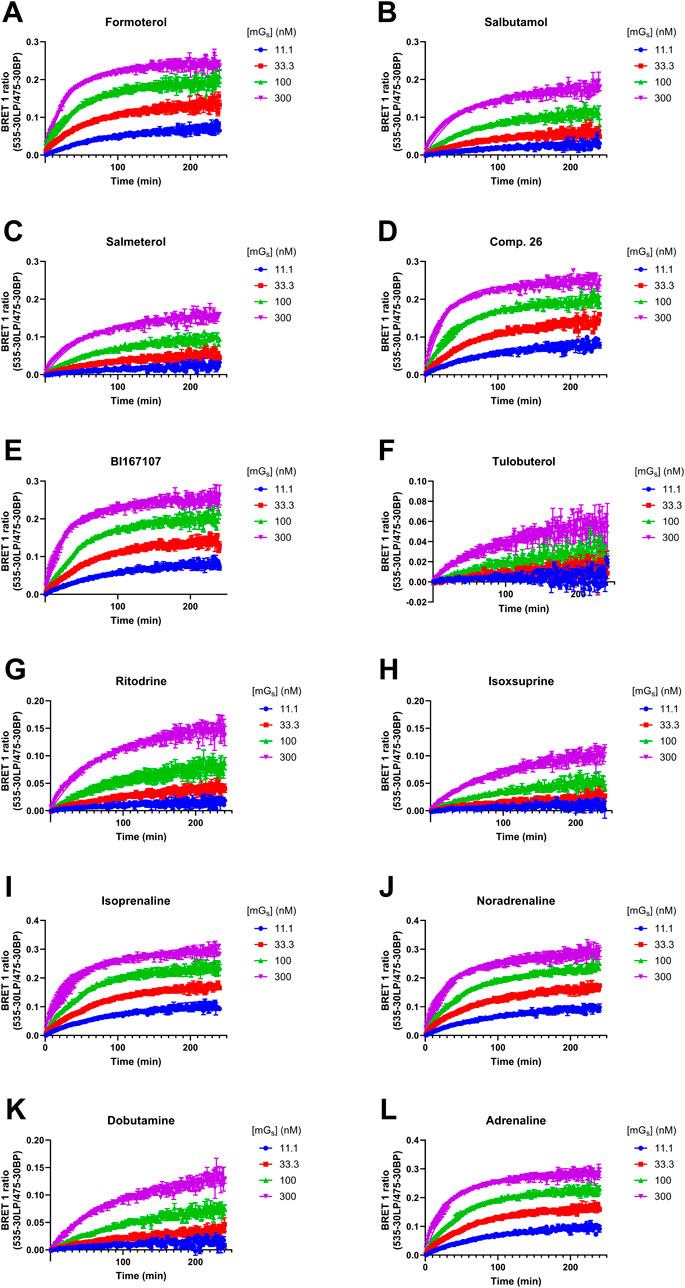
Figure 3. Kinetics of the association of Venus-mini-Gs to the agonist β2AR–nLuc complex, as measured using nanoBRET. Recruitment of the mini-Gs protein by (A) formoterol, (B) salbutamol, (C) salmeterol, (D) Compound 26, (E) BI167107, (F) tulobuterol, (G) ritodrine, (H) isoxsuprine, (I) isoprenaline, (J) noradrenaline, (K) dobutamine, and (L) adrenaline. Data are presented as the mean ± SEM of three experiments.
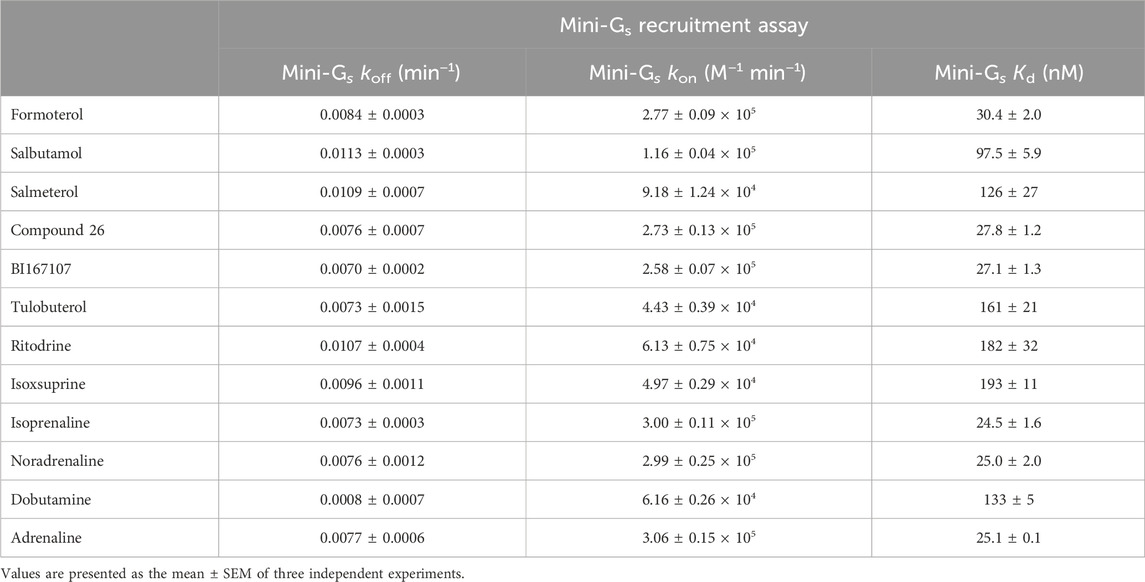
Table 3. Summary of mean koff, kon, and Kd values for purified Venus-mini-Gs recruitment to TS-SNAP-β2AR-nLuc by various β2AR agonists; NanoBRET between TS-SNAP-β2AR-nLuc and Venus-mini-Gs read on PHERAstar FSX, at room temperature, using the BRET1 module.
To probe the binding affinity of the Venus mini-Gs protein to the agonist β2AR–nLuc complex, we added ligands in excess (×100 reported pEC50 determined in the mini-Gs recruitment assay, see above) and incubated with the membrane fraction expressing β2AR-nLuc for 15 min prior to the addition of Venus-labelled mini-Gs (Figure 4). The resulting affinity (pKd) values are summarised in Table 3, which ranged from 24 nM for the full agonist isoprenaline to 193 nM for the partial agonist isoxsuprine. These data also showed a difference in the maximum amount of mini-Gs protein (Emax) recruited over the limited concentration range studied (300–10 nM), with full agonists exhibiting higher recruitment compared to partial agonists.
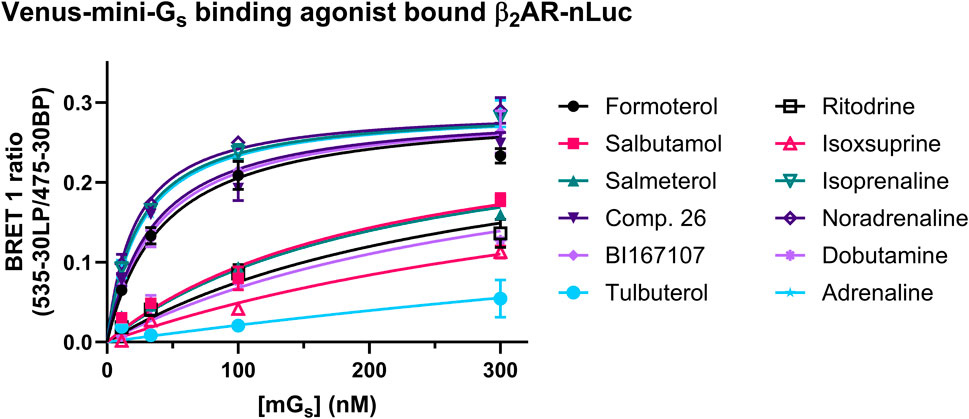
Figure 4. Equilibrium binding of Venus-mini-Gs bound to β2AR-nLuc at saturating concentrations of each agonist, as reflected by an increase in the BRET signal. The full agonist β2AR complexes recruit Venus-mini-Gs with higher affinity compared to partial agonist β2AR mG complexes. Data shown are presented as the mean ± SEM of three experiments.
Affinity and the rate of association of Venus-mini-Gs protein for β2AR-nLuc correlated with agonist efficacy
Finally, we performed Pearson’s correlation analysis between both the association rates (kon) and dissociation rates (koff) and the affinity (pKd) values for Venus-mini-Gs binding agonist β2AR–nLuc complexes vs. agonist efficacy, comparing both Gs-CASE and mini-Gs assay Emax values (Figure 5). This analysis showed a strong correlation between ligand efficacy (Emax) measured in both assay formats and mini-Gs association rates (kon) (R2 = 0.78, p < 0.0001 and R2= 0.99, p < 0.0001 respectively; see Figures 5A, D) and between ligand efficacy (Emax) and mini-Gs affinity (pKd) (R2 0.70, p = 0.0007 and R2 = 0.93, p < 0.0001, respectively; see Figures 5C, F). This suggests that the differences in agonist efficacy can be explained by agonist β2AR complexes’ ability to recruit the Gs protein. No correlation was observed between ligand efficacy (Emax) measured in either assay formats and mini-Gs dissociation rates (koff) (R2 = 0.06, p = 0.45 and R2 = 0.16, p = 0.20, respectively; see Figures 5B, E).
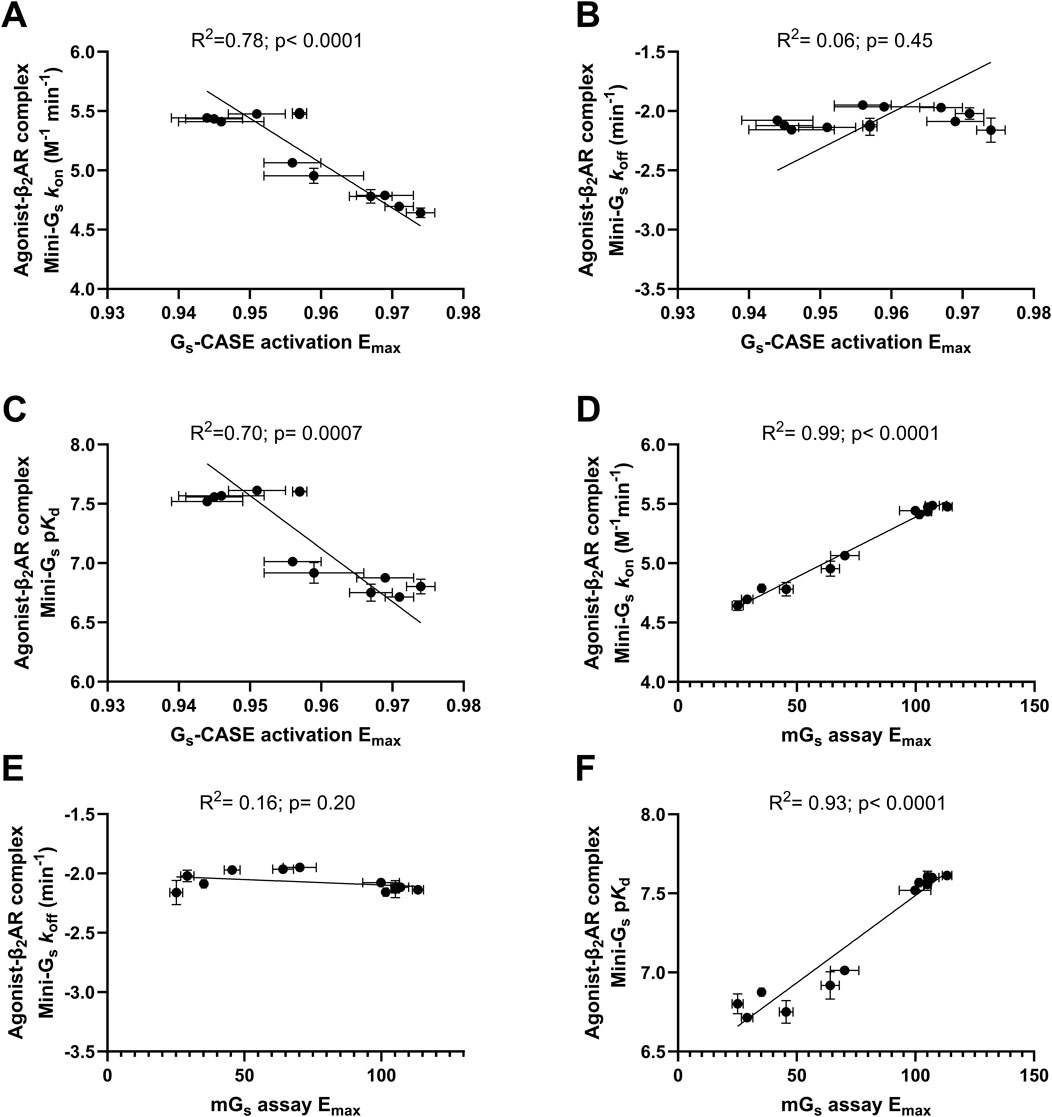
Figure 5. Correlation plots of Gs-CASE activation Emax with (A) agonist β2AR complex Venus-mini-Gs association rate (kon), (B) β2AR complex Venus-mini-Gs affinity (pKd), and (C) β2AR complex Venus-mini-Gs dissociation rate (koff). The GS-CASE response to each agonist is expressed as a fractional change relative to the basal response. Correlation plots of mini-Gs assay Emax with (D) agonist β2AR complex Venus-mini-Gs association rate (kon), (E) β2AR complex Venus-mini-Gs affinity (pKd), and (F) β2AR complex Venus-mini-Gs dissociation rate (koff). The Venus-labelled mini-Gs ligand-response amplitude of each agonist in the mini-Gs assay was compared to the maximal response of formoterol (1 μM). Deming regression was applied to determine the line of best fit. Data are shown as the mean ± SEM of three experiments.
We also performed this same correlation analysis between these mini-Gs kinetics values obtained in detergent micelles and Gs efficacy data obtained in the Gs-CASE assay and found a similar trend (Supplementary Figure 4).
Efficacy of β2AR agonists does not correlate with ligand binding kinetics
Previous studies have suggested that for some GPCRs, there is a relationship between ligand efficacy and the dissociation rates of ligand binding (Sykes et al., 2009a; Guo et al., 2016). To investigate the correlations between ligand residence time and efficacy, we analyzed existing kinetic data. This analysis revealed a broad range of measured koff values, with adrenaline exhibiting the fastest dissociation rate and Compound 26 showing the slowest.
The relationships between agonist efficacy, as determined by Emax values obtained from the Gs-CASE and mini-Gs recruitment assays, and literature ligand binding association (kon) and dissociation rates (koff) were determined using Pearson’s correlation analysis (see Figure 6). This analysis showed no statistically significant correlation between ligand koff values and the efficacy values determined for 6 of the 12 β2AR agonists. Moreover, we also conducted kinetic TR-FRET-based ligand binding studies on 6 of the 12 β2AR agonists in detergent micelles (Supplementary Figure 5) and found no statistically significant correlation (R2 = 0.26, p = 0.29) between relative ligand residence times (IC50 1 min/IC50 equilibrium) and their efficacy (Supplementary Figure 6; Supplementary Table 2).
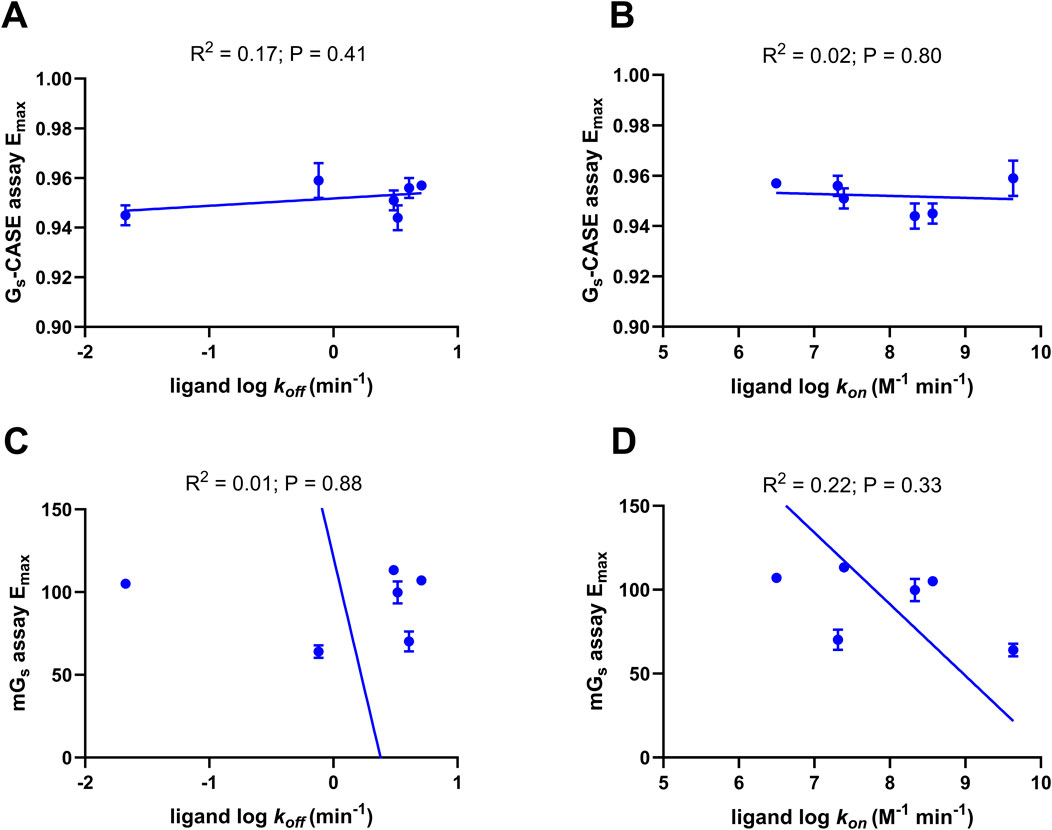
Figure 6. Correlation plots of ligand efficacy with ligand binding parameters. Plot of (A) ligand dissociation rates (koff) with Gs-CASE activation Emax and (B) ligand association rate (kon) with Gs-CASE activation Emax. The Gs-CASE assay response amplitude is expressed as the maximal Δ (Emax) in the baseline BRET signal, which was set to 1.0. Plot of (C) ligand dissociation rates (koff) with mini-Gs assay Emax and (D) ligand association rate (kon) with mini-Gs assay Emax. The Venus-labelled mini-Gs ligand-response amplitude of each agonist in the mini-Gs assay was compared to the maximal response of formoterol (1 μM). Deming regression was applied to determine the line of best fit. Data are shown as the mean ± SEM of three experiments. Ligand association and dissociation rates were taken from Sykes et al., 2014, Sykes et al., 2012 and Rosethorne et al., 2016.
Discussion
In this study, we aimed to investigate the molecular basis for ligand efficacy. The first hypothesis was that the ligand binding kinetics, or ligand residence time, may influence efficacy. The second hypothesis was that the kinetics of G protein recruitment to the receptor–agonist complex may be correlated to ligand efficacy.
We found no correlations between the ligand binding kinetics and its efficacy. Whilst some studies suggested a role for ligand dissociation kinetics (Guo et al., 2012; Sykes et al., 2009) for adenosine A2A and muscarinic M3 receptors, our data are congruent with the previously reported observation that it was not the case for β2AR (Sykes and Charlton, 2012).
Alternatively, we observed a linear correlation between ligand-induced differences in mini-Gs protein binding kinetics (kon) and affinity (pKd) for the agonist-bound β2AR and agonist efficacy, the ability of a ligand to activate the heterotrimeric Gs protein. In contrast, our data showed minimal difference in the dissociation rate (koff) or corresponding residence time (1/koff) of the Venus-mini-Gs when binding to different agonist-β2AR complexes. Since the affinity of mini-Gs is a ratio of kon and koff and mini-Gs koff appears relatively constant, it is expected that mini-Gs kon and its affinity correlate.
Our hypothesis is that agonist binding to the β2AR increases the propensity for G protein recruitment, which underlies the molecular basis of ligand efficacy at the β2AR (Figure 7A). To support our hypothesis, we applied a previously validated mathematical model of the cubic ternary complex model (BioModels ID:2306220001) to investigate the effect of increasing the forward rate of G protein binding to the activated receptor, on both G protein activation and agonist–receptor occupancy at the β2AR (Figures 7B, C). As indicated, increasing the on-rate for G protein recruitment increases the efficacy and potency of G protein activation by the ligand, without changing agonist–receptor occupancy (Figure 7B). This, therefore, supports our hypothesis that an increase in G protein recruitment propensity underlies the molecular basis of ligand efficacy at the β2AR.
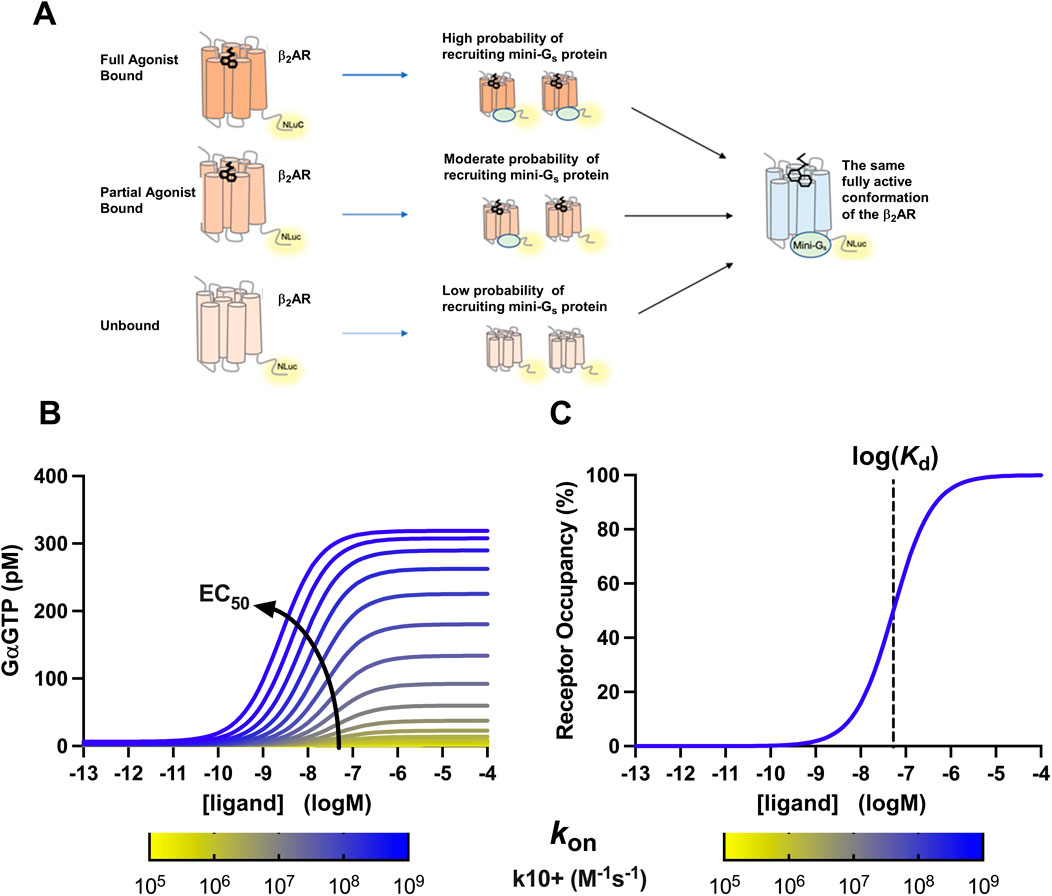
Figure 7. Conformational model of efficacy proposed by this study: (A) agonists of higher efficacy induce a conformation of β2AR that is more likely to recruit a mini-Gs protein, but once bound, there is no difference in the β2AR conformation within the agonist β2AR-mini–Gs complex. (B) Use of the cubic ternary complex model to investigate the effect of increasing the rate of G protein recruitment on the potency of the agonist–receptor complex to activate the G protein. Arrow indicates increases in apparent ligand EC50 values for the formation of GαGTP. (C) Use of the cubic ternary complex model to investigate the effect of increasing the rate of G protein recruitment on agonist affinity for the GPCR. Dotted line indicates log (Kd) of ligand-receptor occupancy. As shown in the figure, the association rate of Gα to the receptor does not affect ligand binding affinity; hence, the yellow and blue curves lie directly on top of each other.
These differences in the rate of mini-Gs recruitment and the resulting differences in mini-Gs affinity suggest that subtle differences in agonist β2AR complex conformations result in differences in agonist efficacy due of differences in the ability of these conformations to affect the recruitment of Venus-mini-Gs. As the dissociation rates of the mini-Gs protein are very similar for all ligands, the structure of the GPCR–G protein complex is likely similar for all ligands. This hypothesis aligns with recent observations made by NMR (Jones et al., 2024), where the full agonist isoprenaline induced a different conformational state of the β1 adrenergic receptor (β1AR) compared to the partial agonists xamoterol and salbutamol. However, the conformations were similar in the case of the ternary complex with mini-Gs. The authors also reported faster recruitment kinetics for the full agonist isoprenaline, a result that aligns well with our own observations for a wide range of partial and full agonists, as presented in this study.
Moreover, this conformational model (see Figure 7) is supported by data from hydrogen/deuterium exchange mass spectrometry (HDMS) and hydroxy radical foot printing mass spectrometry (HDX) (Du et al., 2019), where the conformational changes involved in β2AR–Gs protein complex formation were investigated. Du et al. showed that the conformation of the initial β2AR–Gs structure differs from that of the fully formed nucleotide free β2AR–Gs complex. Furthermore, NMR studies (Nygaard et al., 2013; Manglik et al., 2015) show that the agonist BI-167-107 alone is not sufficient to fully stabilise the β2AR in the active state and that nanobody 80 is required to fully stabilise the active state. These data support our findings that the conformation of the agonist β2AR complex differs from that of the agonist β2AR–mini-Gs complex. Moreover, Liu et al. (2012) investigated the conformational states of β2AR bound to agonists of a range of efficacies and showed efficacy-dependent differences in the agonist β2AR conformational state. Structural studies of the agonist-bound β2AR or other class A GPCRs have only been possible in the presence of a G protein mimetics (Rasmussen et al., 2011b) and show only very small conformational differences that do not seem to explain differences in efficacy (Katritch et al., 2009). This further supports our finding that there was no difference in the agonist β2AR–mini-Gs complex conformation.
We performed the majority of this study in membranes as we believe this environment is the most physiologically relevant for performing a kinetic analysis of ligand-induced mini-Gs binding. We also reproduced most of the experiments with receptor isolated in DDM detergent micelles (Supplementary Figures 2–6); this approach gives us confidence that our conclusions are relevant purely at the biophysical level, independent of the regulatory elements of the cell, while also establishing a baseline for future biophysical studies. However, the full applicability of our findings to the native cell environment remains to be fully elucidated. Interestingly, Sungkaworn et al. (2017) investigated the association rate (kon) and dissociation rate (koff) of GαI binding to the α2AR receptor in CHO cells in response to a range of agonists using single molecule microscopy. They showed that efficacy is at least partially correlated with kon but not koff of the GαI protein. Taken together with the evidence from the current study, this suggests that the conformational model of efficacy proposed may extend to the cellular environment. Future work will investigate whether this model of efficacy proposed is relevant to the β2AR in its native cellular environment and whether this model can be generalized as a mechanism for agonist efficacy at other GPCRs.
Conclusion
In summary, these findings suggest that differences in initial agonist-GPCR conformations, where full agonists stabilise a state that readily recruits G protein, could be central to understanding the molecular basis of efficacy for the 12 β2AR agonists studied. In contrast, we found no evidence linking ligand or G protein binding dissociation kinetics to the molecular basis of ligand efficacy at the β2AR. We propose a conformational model of efficacy, in which agonists with higher efficacy stabilise a conformation of β2AR that is more likely to recruit the G protein. The results from mini-G protein association experiments with ligand prebound to the receptor provide a convenient and direct measurement of ligand efficacy. Further studies incorporating a broader range of agonists with varying efficacies, along with measurements across different receptor types, would help determine whether this mechanism is a general feature of GPCR efficacy.
Data availability statement
The raw data supporting the conclusions of this article will be made available by the authors, without undue reservation.
Ethics statement
Ethical approval was not required for the studies on humans in accordance with the local legislation and institutional requirements because only commercially available established cell lines were used. Ethical approval was not required for the studies on animals in accordance with the local legislation and institutional requirements because only commercially available established cell lines were used.
Author contributions
CH. DS: formal analysis and writing–review and editing. TR-N: investigation, methodology, resources, writing–original draft, and writing–review and editing. OU, CN, AK, EK, and GL: conceptualization, supervision, writing–original draft, and writing–review and editing. SB: conceptualization, funding acquisition, supervision, writing–original draft, and writing–review and editing. DV: conceptualization, funding acquisition, resources, supervision, writing–original draft, and writing–review and editing.
Funding
The author(s) declare that financial support was received for the research and/or publication of this article. CH was funded by a Medical Research Council (MRC) IMPACT PhD studentship. TR-N was funded by a UK Biotechnology and Biological Sciences Research Council iCase studentship (BB/V509334/1) co-funded with AstraZeneca. AK is funded by the BBSRC Doctorate Training Program at the University of Nottingham. GL is a Royal Society Industry Fellow (NF\R2\212001). EK, CN, DS and DV gratefully acknowledge funding by the Medical Research Council [grant number MR/Y003667/1] and Biotechnology and Biological Sciences Research Council [BB/Y51407X/1] and [BB/Z514500/1].
Acknowledgments
The authors would like to thank Dr. Bradley Hoare and Dr. Franziska M. Heydenreich for, respectively, generating the pcDNA4TO-TS-SNAP-β2AR-nLuc and pcDNA4TO-TS-SNAP-β2AR and Nevin Lambert for sharing the templates for Venus-mG plasmids used in this study.
Conflict of interest
DS and DV are founding directors of Z7 Biotech Ltd., an early-stage drug discovery company. OU is an employee of Z7 Biotech Ltd.
The remaining authors declare that the research was conducted in the absence of any commercial or financial relationships that could be construed as a potential conflict of interest.
Publisher’s note
All claims expressed in this article are solely those of the authors and do not necessarily represent those of their affiliated organizations, or those of the publisher, the editors and the reviewers. Any product that may be evaluated in this article, or claim that may be made by its manufacturer, is not guaranteed or endorsed by the publisher.
Supplementary material
The Supplementary Material for this article can be found online at: https://www.frontiersin.org/articles/10.3389/fphar.2025.1367991/full#supplementary-material
References
Baker, J. G. (2010). The selectivity of beta-adrenoceptor agonists at human beta1-beta2- and beta3-adrenoceptors. Br. J. Pharmacol. 160 (5), 1048–1061. doi:10.1111/j.1476-5381.2010.00754.x
Bridge, L. J., Mead, J., Frattini, E., Winfield, I., and Ladds, G. (2018). Modelling and simulation of biased agonism dynamics at a G protein-coupled receptor. J. Theor. Biol. 442, 44–65. doi:10.1016/j.jtbi.2018.01.010
Carpenter, B., Nehme, R., Warne, T., Leslie, A. G., and Tate, C. G. (2016). Structure of the adenosine A(2A) receptor bound to an engineered G protein. Nature 536 (7614), 104–107. doi:10.1038/nature18966
Carpenter, B., and Tate, C. G. (2016). Engineering a minimal G protein to facilitate crystallisation of G protein-coupled receptors in their active conformation. Protein Eng. Des. Sel. 29 (12), 583–594. doi:10.1093/protein/gzw049
Carpenter, B., and Tate, C. G. (2017). Expression, purification and crystallisation of the adenosine A(2A) receptor bound to an engineered mini G protein. Bio Protoc. 7 (8), e2234. doi:10.21769/BioProtoc.2234
Deupi, X., and Kobilka, B. K. (2010). Energy landscapes as a tool to integrate GPCR structure, dynamics, and function. Physiol. (Bethesda) 25 (5), 293–303. doi:10.1152/physiol.00002.2010
Du, Y., Duc, N. M., Rasmussen, S. G. F., Hilger, D., Kubiak, X., Wang, L., et al. (2019). Assembly of a GPCR-G protein complex. Cell 177 (5), 1232–1242. doi:10.1016/j.cell.2019.04.022
Grahl, A., Abiko, L. A., Isogai, S., Sharpe, T., and Grzesiek, S. (2020). A high-resolution description of β1-adrenergic receptor functional dynamics and allosteric coupling from backbone NMR. Nat. Commun. 11 (1), 2216. doi:10.1038/s41467-020-15864-y
Gregorio, G. G., Masureel, M., Hilger, D., Terry, D. S., Juette, M., Zhao, H., et al. (2017). Single-molecule analysis of ligand efficacy in β2AR-G-protein activation. Nature 547 (7661), 68–73. doi:10.1038/nature22354
Guo, D., Heitman, L. H., and Ap, I. J. (2016). The added value of assessing ligand-receptor binding kinetics in drug discovery. ACS Med. Chem. Lett. 7 (9), 819–821. doi:10.1021/acsmedchemlett.6b00273
Guo, D., Mulder-Krieger, T., Ijzerman, A. P., and Heitman, L. H. (2012). Functional efficacy of adenosine A₂A receptor agonists is positively correlated to their receptor residence time. Br. J. Pharmacol. 166 (6), 1846–1859. doi:10.1111/j.1476-5381.2012.01897.x
Harwood, C. R., Sykes, D. A., Redfern-Nichols, T., Ladds, G., Briddon, S. J., and Veprintsev, D. B. (2024). Agonist efficacy at the β2AR is driven by agonist-induced differences in receptor affinity for the Gs protein, not ligand binding kinetics. bioRxiv 2024. 2001.2005.574357. doi:10.1101/2024.01.05.574357
Hauser, A. S., Attwood, M. M., Rask-Andersen, M., Schioth, H. B., and Gloriam, D. E. (2017). Trends in GPCR drug discovery: new agents, targets and indications. Nat. Rev. Drug Discov. 16 (12), 829–842. doi:10.1038/nrd.2017.178
Heydenreich, F. M., Miljus, T., Jaussi, R., Benoit, R., Milic, D., and Veprintsev, D. B. (2017). High-throughput mutagenesis using a two-fragment PCR approach. Sci. Rep. 7 (1), 6787. doi:10.1038/s41598-017-07010-4
Hoops, S., Sahle, S., Gauges, R., Lee, C., Pahle, J., Simus, N., et al. (2006). COPASI--a COmplex PAthway SImulator. Bioinformatics 22 (24), 3067–3074. doi:10.1093/bioinformatics/btl485
Jones, A. J. Y., Harman, T. H., Harris, M., Lewis, O. E., Ladds, G., and Nietlispach, D. (2024). Binding kinetics drive G protein subtype selectivity at the β1-adrenergic receptor. Nat. Commun. 15 (1), 1334. doi:10.1038/s41467-024-45680-7
Katritch, V., Reynolds, K. A., Cherezov, V., Hanson, M. A., Roth, C. B., Yeager, M., et al. (2009). Analysis of full and partial agonists binding to beta2-adrenergic receptor suggests a role of transmembrane helix V in agonist-specific conformational changes. J. Mol. Recognit. 22 (4), 307–318. doi:10.1002/jmr.949
Liu, J. J., Horst, R., Katritch, V., Stevens, R. C., and Wuthrich, K. (2012). Biased signaling pathways in β2-adrenergic receptor characterized by 19F-NMR. Science 335 (6072), 1106–1110. doi:10.1126/science.1215802
Louvel, J., Guo, D., Agliardi, M., Mocking, T. A. M., Kars, R., Pham, T. P., et al. (2014). Agonists for the adenosine A1 receptor with tunable residence time. A case for nonribose 4-Amino-6-aryl-5-cyano-2-thiopyrimidines. J. Med. Chem. 57 (8), 3213–3222. doi:10.1021/jm401643m
Manglik, A., Kim, T. H., Masureel, M., Altenbach, C., Yang, Z., Hilger, D., et al. (2015). Structural insights into the dynamic process of β2-adrenergic receptor signaling. Cell 161, 1101–1111. doi:10.1016/j.cell.2015.04.043
Mary, S., Damian, M., Louet, M., Floquet, N., Fehrentz, J. A., Marie, J., et al. (2012). Ligands and signaling proteins govern the conformational landscape explored by a G protein-coupled receptor. Proc. Natl. Acad. Sci. U. S. A. 109, 8304–8309. doi:10.1073/pnas.1119881109
Masureel, M., Zou, Y., Picard, L.-P., van der Westhuizen, E., Mahoney, J. P., Rodrigues, J. P. G. L. M., et al. (2018). Structural insights into binding specificity, efficacy and bias of a β2AR partial agonist. Nat. Chem. Biol. 14 (11), 1059–1066. doi:10.1038/s41589-018-0145-x
Nikolaev, V. O., Hoffmann, C., Bünemann, M., Lohse, M. J., and Vilardaga, J.-P. (2006). Molecular basis of partial agonism at the neurotransmitter alpha2A-adrenergic receptor and Gi-protein heterotrimer. J. Biol. Chem. 281 (34), 24506–24511. doi:10.1074/jbc.M603266200
Nygaard, R., Zou, Y., Dror, R. O., Mildorf, T. J., Arlow, D. H., Manglik, A., et al. (2013). The dynamic process of β(2)-adrenergic receptor activation. Cell 152 (3), 532–542. doi:10.1016/j.cell.2013.01.008
Rasmussen, S. G., Choi, H. J., Fung, J. J., Pardon, E., Casarosa, P., Chae, P. S., et al. (2011a). Structure of a nanobody-stabilized active state of the β(2) adrenoceptor. Nature 469 (7329), 175–180. doi:10.1038/nature09648
Rasmussen, S. G., DeVree, B. T., Zou, Y., Kruse, A. C., Chung, K. Y., Kobilka, T. S., et al. (2011b). Crystal structure of the β2 adrenergic receptor-Gs protein complex. Nature 477 (7366), 549–555. doi:10.1038/nature10361
Rosethorne, E. M., Bradley, M. E., Gherbi, K., Sykes, D. A., Sattikar, A., Wright, J. D., et al. (2016). Long receptor residence time of C26 contributes to super agonist activity at the human β2 adrenoceptor. Mol. Pharmacol. 89 (4), 467–475. doi:10.1124/mol.115.101253
Schihada, H., Shekhani, R., and Schulte, G. (2021). Quantitative assessment of constitutive G protein–coupled receptor activity with BRET-based G protein biosensors. Sci. Signal. 14 (699), eabf1653. doi:10.1126/scisignal.abf1653
Sun, D., Flock, T., Deupi, X., Maeda, S., Matkovic, M., Mendieta, S., et al. (2015). Probing Gαi1 protein activation at single-amino acid resolution. Nat. Struct. Mol. Biol. 22 (9), 686–694. doi:10.1038/nsmb.3070
Sungkaworn, T., Jobin, M.-L., Burnecki, K., Weron, A., Lohse, M. J., and Calebiro, D. (2017). Single-molecule imaging reveals receptor–G protein interactions at cell surface hot spots. Nature 550 (7677), 543–547. doi:10.1038/nature24264
Sykes, D. A., and Charlton, S. J. (2012). Slow receptor dissociation is not a key factor in the duration of action of inhaled long-acting β2-adrenoceptor agonists. Br. J. Pharmacol. 165 (8), 2672–2683. doi:10.1111/j.1476-5381.2011.01639.x
Sykes, D. A., Dowling, M. R., and Charlton, S. J. (2009a). Exploring the mechanism of agonist efficacy: a relationship between efficacy and agonist dissociation rate at the muscarinic M3 receptor. Mol. Pharmacol. 76 (3), 543–551. doi:10.1124/mol.108.054452
Sykes, D. A., Dowling, M. R., and Charlton, S. J. (2009b). Exploring the mechanism of agonist efficacy: a relationship between efficacy and agonist dissociation rate at the muscarinic M3 receptor. Mol. Pharmacol. 76 (3), 543–551. doi:10.1124/mol.108.054452
Sykes, D. A., Parry, C., Reilly, J., Wright, P., Fairhurst, R. A., and Charlton, S. J. (2014). Observed drug-receptor association rates are governed by membrane affinity: the importance of establishing “micro-pharmacokinetic/pharmacodynamic relationships” at the β2-adrenoceptor. Mol. Pharmacol. 85 (4), 608–617. doi:10.1124/mol.113.090209
Wan, Q., Okashah, N., Inoue, A., Nehmé, R., Carpenter, B., Tate, C. G., et al. (2018). Mini G protein probes for active G protein–coupled receptors (GPCRs) in live cells. J. Biol. Chem. 293 (19), 7466–7473. doi:10.1074/jbc.RA118.001975
Weiss, J. M., Morgan, P. H., Lutz, M. W., and Kenakin, T. P. (1996). The cubic ternary complex receptor-occupancy model. III. resurrecting efficacy. J. Theor. Biol. 181 (4), 381–397. doi:10.1006/jtbi.1996.0139
Woodroffe, P. J., Bridge, L. J., King, J. R., and Hill, S. J. (2009). Modelling the activation of G-protein coupled receptors by a single drug. Math. Biosci. 219 (1), 32–55. doi:10.1016/j.mbs.2009.02.003
Ye, L., Van Eps, N., Zimmer, M., Ernst, O. P., and Prosser, R. S. (2016). Activation of the A2A adenosine G-protein-coupled receptor by conformational selection. Nature 533 (7602), 265–268. doi:10.1038/nature17668
Keywords: G protein-coupled receptor, β2-adrenoceptor, efficacy, kinetics, association rate kon, dissociation rate koff
Citation: Harwood CR, Sykes DA, Redfern-Nichols T, Underwood O, Nicholson C, Khoshgrudi AN, Koers EJ, Ladds G, Briddon SJ and Veprintsev DB (2025) Agonist efficacy at the β2AR is driven by the faster association rate of the Gs protein. Front. Pharmacol. 16:1367991. doi: 10.3389/fphar.2025.1367991
Received: 09 January 2024; Accepted: 24 February 2025;
Published: 27 March 2025.
Edited by:
Ravinder Abrol, California State University, Northridge, United StatesReviewed by:
Vsevolod V. Gurevich, Vanderbilt University, United StatesEmma T. van der Westhuizen, University of Melbourne, Australia
Copyright © 2025 Harwood, Sykes, Redfern-Nichols, Underwood, Nicholson, Khoshgrudi, Koers, Ladds, Briddon and Veprintsev. This is an open-access article distributed under the terms of the Creative Commons Attribution License (CC BY). The use, distribution or reproduction in other forums is permitted, provided the original author(s) and the copyright owner(s) are credited and that the original publication in this journal is cited, in accordance with accepted academic practice. No use, distribution or reproduction is permitted which does not comply with these terms.
*Correspondence: David A. Sykes, ZGF2aWQuc3lrZXNAbm90dGluZ2hhbS5hYy51aw==; Stephen J. Briddon, c3RlcGhlbi5icmlkZG9uQG5vdHRpbmdoYW0uYWMudWs=; Dmitry B. Veprintsev, ZG1pdHJ5LnZlcHJpbnRzZXZAbm90dGluZ2hhbS5hYy51aw==