 Xiaoqian Guo1,2†
 Chi Zhang1,2†Yingyu Li1,2,3Wen Wen1,2,4Yinghui He1Feng Tang1Chunming Chen1Chao Hu1
 Linqi OuYang1
 Wenlong Liu2,5Zhenhua Zhu1*
 Hongyu Liu1*
- 1The First Hospital of Hunan University of Chinese Medicine, Changsha, China
- 2Hunan Key Laboratory of Druggability and Preparation Modification of Traditional Chinese Medicine, Changsha, China
- 3Hunan Industry and Commerce Career Academy, Hengyang, China
- 4Changsha Hospital of Traditional Chinese Medicine, Changsha, China
- 5College of Pharmacy, Hunan University of Chinese Medicine, Changsha, China
Background: Xueshuantong injection (Lyophilized) (XSTI) is widely used to treat cardiovascular and cerebrovascular diseases. However, anaphylactoid reactions (ARs) are frequently reported as one of its side effects, and the mechanisms of ARs and their relationship with the different immune status are still not well understood.
Purpose: This article aims to examine the sensitizing effect of XSTI, explore the impact of normal and immunocompromised states on ARs, and analyze AR-related metabolic pathways by metabolomics.
Methods: An immunocompromised mouse model was established through intraperitoneal injection of cyclophosphamide (CTX). Normal and immunocompromised mice were then treated with normal saline (NS), histamine (HIS), and XSTI, respectively. Behavioral responses, auricle blue staining, and Evans blue (EB) exudation were used as indices to evaluate the sensitization of XSTI on both normal and immunocompromised mice. Subsequently, ARs models with different immune statuses were established, and validated by measuring four serum indicators using enzyme-linked immunosorbent assay (ELISA). Finally, LC-MS metabolomics analysis was performed on mouse serum to evaluate the metabolic pathways.
Results: The intensity of ARs induced by XSTI in mice was found to increase with the administered dose, with normal mice exhibiting higher AR intensities compared to immunocompromised mice. Metabolomic analysis revealed significant metabolic changes in XSTI-treated mice. The metabolic pathways predicted from these different metabolites include biotin metabolism, histidine metabolism, glycerolipid metabolism, bile secretion, arachidonic acid metabolism, sphingolipid metabolism, niacin and nicotinamide metabolism, tryptophan metabolism, steroid biosynthesis, and arginine and proline metabolism.
Conclusion: Research indicated that the sensitization of XSTI is dose-dependent, and mice with weakened immune functions exhibit lower sensitivity. Through metabolomics research, the differential metabolites in mice were analyzed, and the metabolic pathways inducing ARs were predicted. This study offers guidance on safe medication from the perspective of organism susceptibility and lays a foundation for research on the potential mechanisms of ARs.
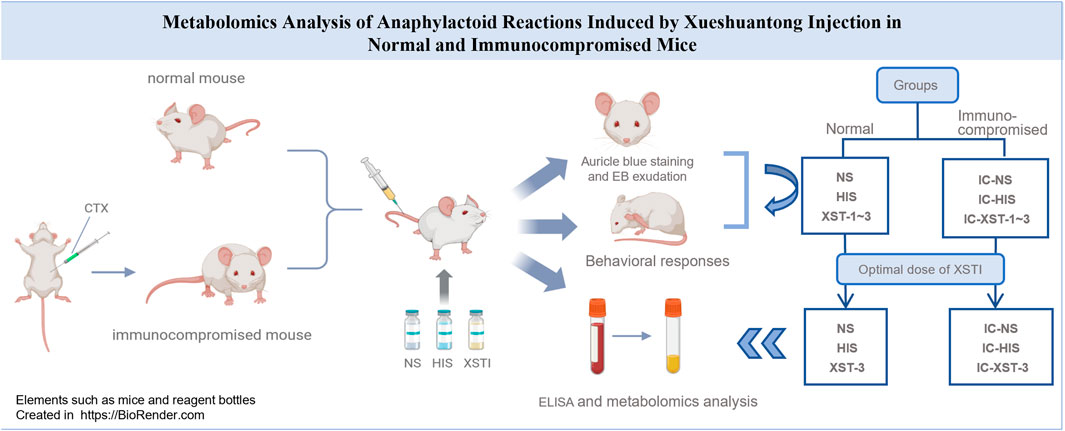
GRAPHICAL ABSTRACT |
1 Introduction
Anaphylactoid reactions (ARs) are the most common adverse reactions of traditional Chinese medicine injections (TCMIs), accounting for 77% of total adverse reactions (ADRs) (Yang, Y. et al., 2019). The symptoms associated with ARs are akin to those observed in classic anaphylaxis reactions, including skin rashes, itching, redness, palpitations, and shortness of breath (Chen, M. et al., 2017). However, the difference lies in that ARs do not depend on IgE-mediated immune activation and occur after the first administration of the drug (Fan, X. et al., 2018; Cianferoni, 2021). It is currently hypothesized that the mechanism of ARs involves direct or indirect action of drug components on mast cell (MC) and basophilic granulocytes, leading to the release of active mediators, possibly through activation of the complement system and other pathways (Li, L. et al., 2012; Yang, Y. et al., 2019). Further research is needed to elucidate the specific mechanisms involved. Currently, research on ARs primarily focuses on animal experiments in normal physiological states, aiming to identify sensitizing substances and conduct mechanism studies. There is limited research involving animals in different physiological states (Xie, J. et al., 2019; Xiao et al., 2020).
Metabolomics, as a systematic approach, has emerged as a crucial tool for elucidating the pharmacodynamic mechanisms of TCMIs. It allows for the characterization of the overall metabolic status of the organism and can be utilized to enhance the study of TCMI-induced ARs in different physiological states of the organism (Wei et al., 2011; Ma and Qi, 2021). By employing metabolomics, potential biomarkers can be identified, and their mechanisms can be systematically revealed, contributing to a deeper understanding of TCMI-induced ARs.
Xueshuantong injection (XSTI) (lyophilized) is an injectable solution containing Panax notoginseng saponins as its main active components, which are extracted from the Araliaceae plant Panax notoginseng (Burk.) F. H. Chen, and primarily consist of notoginsenoside R1, along with ginsenoside Rd, Rg1, and Rb1. Studies have demonstrated that XSTI possesses anti-myocardial infarction, anti-thrombosis, anti-cerebral ischemia, anti-oxidation, and improving microcirculatory disorders, making it widely used in the treatment of cardiovascular and cerebrovascular diseases (Li C. et al., 2018; Wang et al., 2022). However, the increasing reports of ADRs about XSTI, primarily ARs, have limited its clinical application (Zhou et al., 2014; Shen and Zhou, 2015).
In this research, we selected hyper-aphylactic ICR mice as model animals and manipulated their immune status. Based on this manipulation, XSTI was utilized as the model drug to establish a model of anaphylactoid reaction in mice with varying immune statuses. We aim to compare the susceptibility and intensity of drug-induced ARs in organisms under normal and immunocompromised states, to explore the impact of different immune states on ARs.
2 Materials and methods
2.1 Reagents and materials
Xueshuantong injection (lyophilized) was purchased from Guangxi Wuzhou Pharmaceutical (Group) Co., Ltd. (Guangxi, China) (Batch number: 20100113). This product primarily contains five compounds extracted from the Panax notoginseng (Burk.) F. H. Chen [Araliaceae; Notoginseng Radix et Rhizoma]: notoginsenoside R1 (9.5%–15.0%), ginsenoside Rg1 (37.0%–56.0%), ginsenoside Re (5.0%–8.0%), ginsenoside Rb1 (21.0%–32.0%), and ginsenoside Rd (greater than 0.45%). The certificate of analysis of XSTI is shown in Supplementary. Panax notoginseng (Burk.) F.H. Chen, a species in the genus Panax (Family Araliaceae), has its taxonomic classification confirmed by the MPNS (http://mpns.kew.org/mpns-portal/). Mouse ELISA Kit was purchased from Shanghai Fusheng Industry Co., Ltd. (Shanghai, China). Normal saline (NS) was purchased from Hunan Kelun Pharmaceutical Co., Ltd. (Yueyang, Hunan, China) (Batch number: G21050509). Histamine (HIS) was purchased from Shanghai McLean Biochemistry Science and Technology Co. (Shanghai, China) (Batch number: C12812525). Evans Blue was purchased from Shanghai McLean Biochemical Science and Technology Co., Ltd. (Shanghai, China) (Batch number: C1069175). Formamide was purchased from Shanghai McLean Biochemical Science and Technology Co., Ltd. (Shanghai, China) (Batch number: C13106895). Andosan (cyclophosphamide) was purchased from Baxter Oncology GmbH. (Germany) (Lot number: H20160467).
2.2 Drug preparation
According to the human dosing guidelines of XSTI (maximum daily dose of 5 mg/kg for a 60 kg adult), the standard dosage for mice was determined using a body surface area conversion method. The low, medium, and high dose groups for XSTI were then established at 2-fold, 4-fold, and 8-fold of the standard dose. NS was used as the solvent to prepare 0.25 g/kg HIS solution, 0.08 g/kg cyclophosphamide (CTX) solution, and XSTI at three concentration levels (0.044 g/kg, 0.088 g/kg, 0.176 g/kg). Additionally, NS, HIS, and XSTI were prepared as injections containing 0.8% Evans Blue (EB).
2.3 Animals
SPF male ICR mice (25–30 g) were obtained from Slake Jingda Experimental Animal Co., Ltd. (Hunan, China). The mice were kept under controlled conditions, with temperatures maintained at 20°C–26°C and humidity levels at 40%–70%, within the barrier facility of the Experimental Animal Center at Hunan University of Chinese Medicine (Changsha, China) and acclimatized for 3–5 days. Experimental procedures received approval from the Institutional Animal Ethics Committee (License number: SYXK 2019–0009; animal ethics number: LLBH-202111030001) and were carried out in compliance with the established institutional animal care guidelines and protocols.
2.4 Establishment and validation of immunocompromised mouse model
The immunocompromised mouse model was established by intraperitoneal injection of CTX. ICR mice were randomly assigned to six groups (n = 8): three control groups (Con-1, Con-2, Con-3), with no treatment, and three experimental groups (Model-1, Model-2, Model-3) receiving intraperitoneal injections of CTX (0.08 g/kg) for three consecutive days, followed by a five-day adaptive feeding period. The experimental groups were designed to evaluate different aspects of immune function: nonspecific immunity (Model-1), humoral immunity (Model-2), and cellular immunity (Model-3). The body weight growth ratio of each mouse was calculated using the formula: (final body weight - initial body weight)/initial body weight.
2.4.1 Carbon clearance
The carbon clearance index (K) and the phagocytic index (α) were used to assess macrophage function, thereby reflecting the strength of nonspecific immune capabilities (Wang et al., 2011; Li Q. et al., 2018). In the Model-1 group experiment, 25% India ink was injected intravenously at a dosage of 0.01 mL/g. Blood samples were drawn from the inner canthal venous plexus at 2 min and 10 min post-injection. The optical density (OD) value was measured at 630 nm using ELISA to calculate the carbon clearance index and the phagocytic index. Finally, the mice were euthanized by cervical dislocation, and their livers, spleens, and thymuses were collected and weighed. The calculation formula is as follows:
α: phagocytosis index, K: carbon profile index, A1: OD value (2 min), A2: OD value (10 min), t1: 2 min, t2: 10 min.
2.4.2 Spleen and thymus indices
The spleens and thymuses, key immune organs, were used to evaluate the immune function of the mice (Wang Y. et al., 2016). The spleen and thymus indices were calculated using the formulas: Spleen index = spleen weight (mg)/body weight (g), and Thymus index = thymus weight (mg)/body weight (g).
2.4.3 Serum hemolysin
Serum hemolysin levels were used to evaluate alterations in the humoral immunity of mice (Zhao et al., 2014; Li Q. et al., 2018). On the first day of modeling, mice in the Model-2 and Con-2 groups received an intraperitoneal injection of 0.2 mL of a 5% chicken red blood cell suspension. 30 min later, the Model-2 group received an intraperitoneal injection of CTX. The day after modeling, blood was collected from the ocular veins of mice in both groups. The collected blood was centrifuged at 3,000 rpm for 10 min, and the supernatant serum was diluted 1:100 with NS. 1 mL of diluted serum was combined with 0.5 mL of 5% chicken red blood cell suspension and 0.5 mL of 10% guinea pig serum (complement). The mixture was incubated at 37°C for 30 min, then cooled to 0°C to stop the reaction. After a second centrifugation at 3,000 rpm for 10 min, 200 µL of the supernatant was transferred to a 96-well plate. The OD value at 570 nm was measured using ELISA to determine serum hemolysin levels.
2.4.4 Delayed-type hypersensitivity
Delayed-type hypersensitivity (DTH), a T cell-mediated immune response, serves as a measure of cellular immune function in mice (Makare et al., 2001; Wang et al., 2017). On the third day of modeling, the abdominal area of the Model-3 group, approximately 3 cm × 3 cm in size, was depilated and uniformly applied with 50 µL of a 1-fluoro-2,4-dinitrobenzene (DNFB) solution daily for 2 days. On the fourth day, 20 µL of DNFB solution was applied to the right ear of mice in both the Model-3 and Con-3 groups to elicit DTH. 24 h later, the mice were euthanized, and their ears were collected. Ear punches with an 8 mm diameter were excised and weighed. The degree of swelling in the mice’s ears (swelling degree = right ear mass - left ear mass) was used to assess the intensity of DTH.
2.5 ARs in mice with different immune states
Normal mice were randomly divided into five groups (n = 8). Group 1 (NS) was the control group and received NS. Group 2 (HIS), the positive control group, received HIS solution (0.25 g/kg). Groups 3 to 5 (XST-1, XST-2, XST-3) received low, medium, and high doses of XSTI (0.044 g/kg, 0.088 g/kg, 0.176 g/kg), respectively. Immunocompromised mice were also divided into five groups: IC-NS, IC-HIS, IC-XST-1, IC-XST-2, and IC-XST-3. Each group was injected with the respective drug (containing 0.8% Evans Blue) via the tail vein.
After administration, the symptoms of the mice were observed within 30 min. Based on the criteria for evaluating AR symptoms (Tables 1, 2) (Xie, J. et al., 2019), the intensity of the ARs in mice was assessed. Afterward, the mice were euthanized, and their ears were collected.
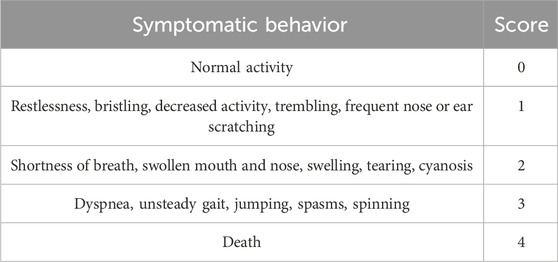
Table 1. Scoring criteria of ARs symptoms.
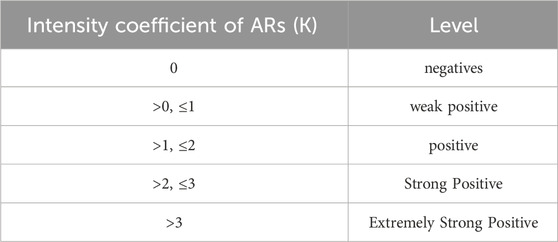
Table 2. Intensity levels of ARs.
The staining area was scored as per Table 3. Chop the auricle into pieces, soak in 2 mL of formamide, and store in the dark at room temperature for 48 h. In formamide as a solvent, EB was prepared into a working solution of 10 μg/mL and subsequently diluted to concentrations of 0.5, 0.25, 0.2, 0.1, 0.05, 0.025, 0.005, and 0 mg/L. The OD values at 630 nm were measured by ELISA to establish a standard curve. Extracts from the incubated ears were centrifuged at 3,000 rpm for 15 min, and the supernatant was collected to measure the OD value at 610 nm.
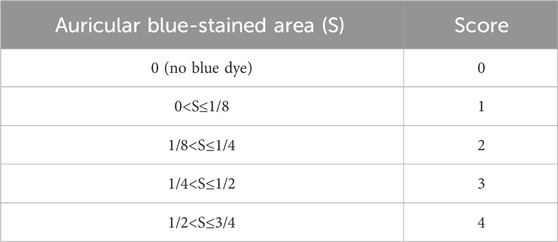
Table 3. Auricle blue staining scoring criteria.
2.6 Establishment and validation of ARs model
The ARs model was established using the optimal sensitizing dose of XSTI. Mice were randomly divided into two main groups: normal and immunocompromised. The normal group was subdivided into three subgroups: blank control (NS), positive control (HIS), and XSTI treatment (XST-3). Similarly, the immunocompromised group, induced by CTX, was divided into the corresponding subgroups: IC-NS, IC-HIS, and IC-XST-3. In total, six groups of twelve mice were established. To explore the relationship between AR intensity and response time, the groups were further subdivided based on blood collection times: 10 min and 30 min post-administration. Blood samples were collected from the ocular veins at these intervals, centrifuged at 3,000 rpm for 15 min, followed by a secondary centrifugation at 12,000 rpm for 10 min, and then cryopreserved at −80°C. Samples were analyzed using ELISA and metabolomics techniques. ELISA was used to measure serum levels of tryptase (TPS), β-hexosaminidase (β-Hex), immunoglobulin E (IgE), and HIS to validate the model. The ARs intensity at various drug dosages and time points was assessed by analyzing the serum concentrations of TPS, β-Hex, IgE, and HIS, following the ELISA kit instructions.
2.7 LC-MS sample preparation
Each serum sample (100 µL) was mixed with a fourfold volume of a methanol/acetonitrile (1:1, v/v) mixture, vortexed for 30 s, and then sonicated in an ice-water bath for 10 min. Subsequently, the samples were left to stand for 1 h at −40°C, followed by centrifugation at 12,000 rpm for 15 min at 4°C. Quality control (QC) samples were prepared in equal amounts using the same method.
2.8 LC-MS analysis parameters
Separation was performed using the Vanquish Ultra High-Performance Liquid Chromatograph (UPLC) (Thermo Fisher Scientific, United States) paired with a Waters ACQUITY UPLC BEH Amide column (2.1 mm × 100 mm, 1.7 µm) (Wang J. et al., 2016). The sample tray was kept at 4°C with an injection volume set to 2 µL. Mobile phase A comprised 0.1% ammonium acetate (25 mmol/L) and ammonia (25 mmol/L) in water, while mobile phase B was acetonitrile. Data acquisition for primary and secondary mass spectrometry was controlled using Xcalibur software on Thermo Q Exactive HFX mass spectrometer (Thermo Fisher Scientific, United States). The settings were: sheath gas flow rate at 30 Arb, auxiliary gas flow rate at 25 Arb, capillary temperature at 350°C, full MS resolution at 120,000, MS/MS resolution at 7,500, and spray voltage at 3,600 V in positive mode or −3600 V in negative mode.
2.9 Metabolomics data processing and analysis
The raw data were initially converted to mzXML format using ProteoWizard software. Peak identification, extraction, alignment, and integration were subsequently carried out with a custom-written R package with XCMS as the core (Dunn et al., 2011). Processed data were annotated by matching against a self-built secondary mass spectrometry database in BiotreeDB (version 2.1), with the cutoff value for algorithm scoring set at 0.3. Deviant values were filtered to remove noise from individual peaks based on the coefficient of variation (CV). Missing values were addressed by filtering individual peaks, retaining only those with no more than 50% missing values in any single group or across all groups. Missing peak area data were imputed using half the minimum observed value. Finally, data normalization was conducted using internal standards (Kuroishi, 2015).
Data were log-transformed and centered using SIMCA software before automated modeling analysis (Rodriguez-Melendez and Zempleni, 2003). The first principal component identified was then analyzed using the OPLS-DA method. Model validity was assessed by combining univariate and multivariate statistical analyses with a 7-fold cross-validation, and further validated using permutation tests. Differential metabolites were identified based on a Variable Importance in the Projection (VIP) greater than 1 for the first principal component of OPLS-DA, and the Student’s t-test p-value less than 0.05.
2.10 Statistical analysis
Statistical analysis of various indices in mice was conducted using GraphPad Prism 8.0, with results expressed as mean ± standard deviation. For non-normally distributed data, Tamhane’s one-way ANOVA in SPSS21 was applied for comparisons. A p-value of less than 0.05 was deemed statistically significant.
3 Results
3.1 Validation of immunocompromised models
Among multiple test indicators (Figure 1), the weight gain rate of the modeled mice was slower compared to normal mice. The spleen and thymus indices decreased significantly (p < 0.05 and p < 0.01, respectively), indicating notable suppression of immune function. Both the phagocytic index α and the clearance index K were reduced (p < 0.05 and p < 0.01, respectively), suggesting a substantial weakening of non-specific immune function. The serum hemolysin content also decreased (p < 0.01), reflecting a significant decline in humoral immune function. Furthermore, the degree of ear swelling increased (p < 0.01), indicating an enhanced DTH reaction and a pronounced reduction in cellular immune function. Consequently, we successfully established an immunocompromised mouse model.
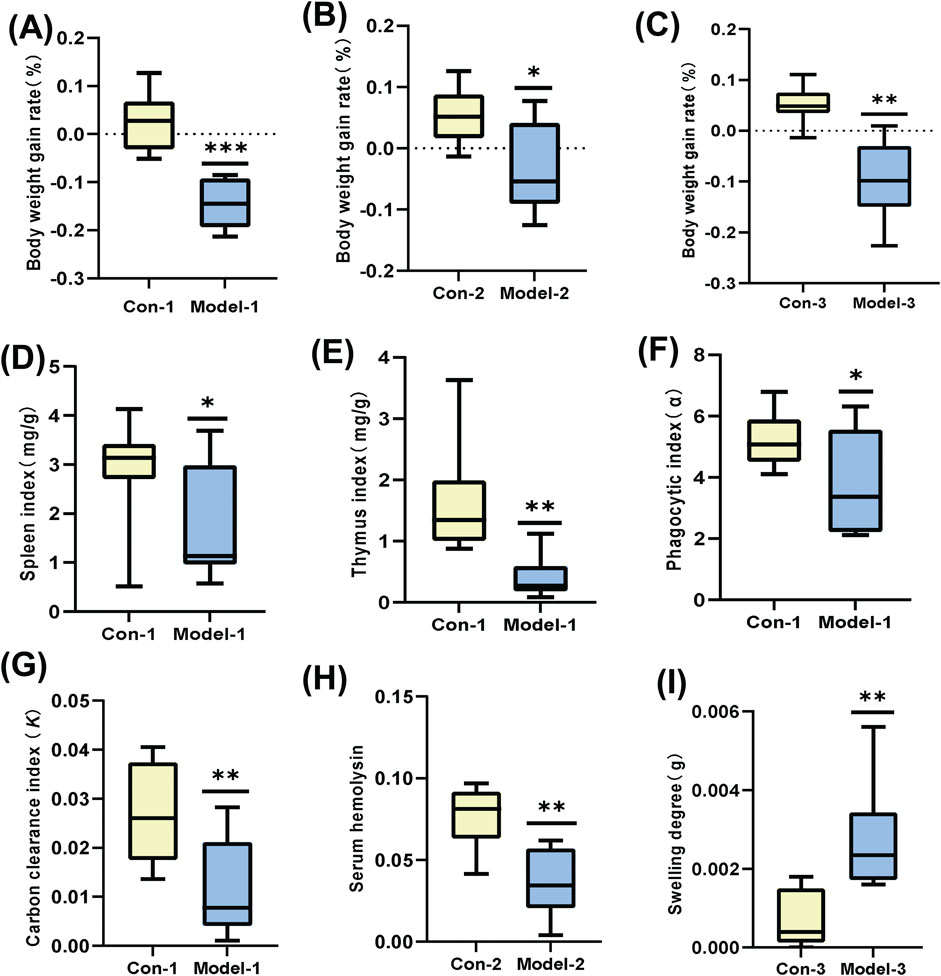
Figure 1. (A–C): Growth rate of body weight. (D, E): Mouse spleen index and thymus index. (F, G): Mouse phagocytic index (α) and carbon clearance index (K). (H): Mouse serum hemolysin levels. (I): Mouse-ear swelling degree. (*p < 0.05, **p < 0.01).
3.2 ARs in mice with varying immune states
3.2.1 Behavioral analysis
Firstly, the behavior of mice post-medication was observed, and the ARs strength coefficient K for each group was calculated (Figure 2). Significant differences were found between the HIS, XST-1, XST-2, XST-3 groups and the NS group (p < 0.01). Likewise, the IC-HIS (p < 0.01), IC-XST-2 (p < 0.05), and IC-XST-3 (p < 0.01) groups showed significant differences compared to the IC-NS group. The K value reflects the AR intensity level in mice (Table 2), with negative responses in NS treatment groups, strong positive in HIS treatment groups, weak positive in the XST-1, IC-XST-1, and IC-XST-2 groups, and positive in the XST-2, XST-3, and IC-XST-3 groups.
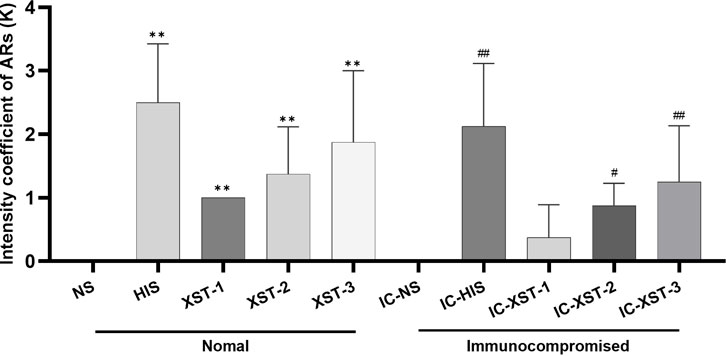
Figure 2. Intensity coefficient of ARs (K).
3.2.2 Auricular blue staining and EB exudation
Auricular blue staining and EB exudation assay to detect increased vascular permeability in mouse ears caused by ARs. In normal mice, the auricular blue staining area expanded with increasing XSTI dosage (Figures 3, 4). The EB exudation concentration was determined using the EB standard curve (Figure 5). Compared to the NS group, the HIS, XST-2, and XST-3 groups exhibited significantly higher concentrations (p < 0.01). Similarly, the IC-HIS, IC-XST-2, and IC-XST-3 groups showed increased concentrations compared to the IC-NS group (p < 0.05). In comparison of auricular blue staining area in mice with different immune statuses under the same drug, XST-1 group was lower than IC-XST-1 group (p < 0.01), and XST-3 group was higher than IC-XST-3 group (p < 0.01); EB extravasation was compared, XST-1 group was lower than IC-XST-1 group (p < 0.01), and XST-3 group was higher than IC-XST-3 group (p < 0.05).

Figure 3. Auricle Blue staining.
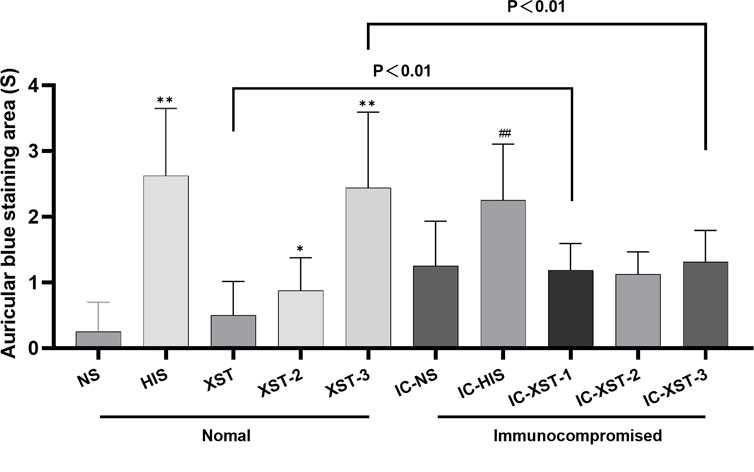
Figure 4. Auricular Blue staining area (S). (Compared with NS group, **p < 0.01, *p < 0.05. Compared with IC-NS group, ##p < 0.01).
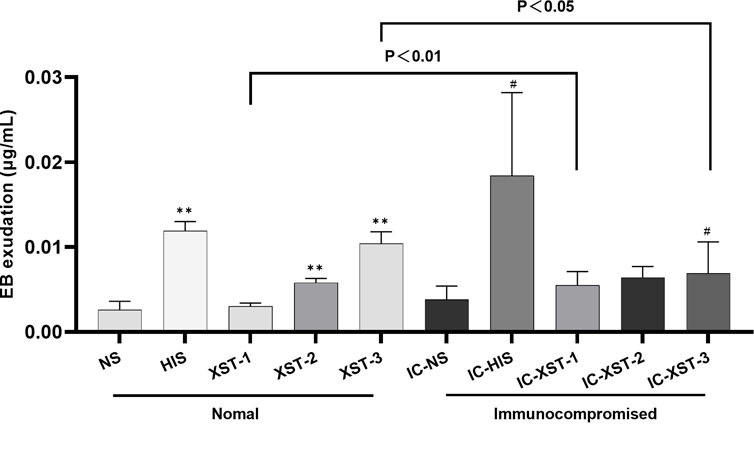
Figure 5. EB exudation. (Compared with NS group, **p < 0.01. Compared with IC-NS group, #p < 0.05).
3.2.3 Optimal sensitizing dose of XSTI
The optimal XSTI dosage was determined by assessing its sensitization in normal mice, using the ARs strength coefficient (K), auricular blue staining area, and EB exudation as key indicators. The results showed that sensitization increased with higher XSTI doses, with the maximum dose (0.176 g/kg) identified as optimal for establishing the ARs model.
3.3 ARs model validation
The serum indicators were analyzed using ELISA (Figure 6). In normal mice groups, 10 min post-administration, TPS, β-Hex, and IgE concentrations in the HIS and XST groups were significantly higher than those in the NS group (p < 0.01). After 30 min, the β-Hex concentration in the XST group remained elevated (p < 0.05). In immunocompromised mice, 10 min post-administration, TPS and β-Hex concentrations in the IC-HIS and IC-XST-3 groups were significantly higher than those in the IC-NS group (p < 0.01). After 30 min, the TPS concentration in the IC-HIS group remained elevated (p < 0.05). Comparing the normal and immunocompromised groups, the β-Hex concentration of the XST group was lower than in the IC-XST-3 group at 10 min (p < 0.01), and the HIS concentration in the XST group was lower than in the IC-XST-3 group at 30 min (p < 0.01).
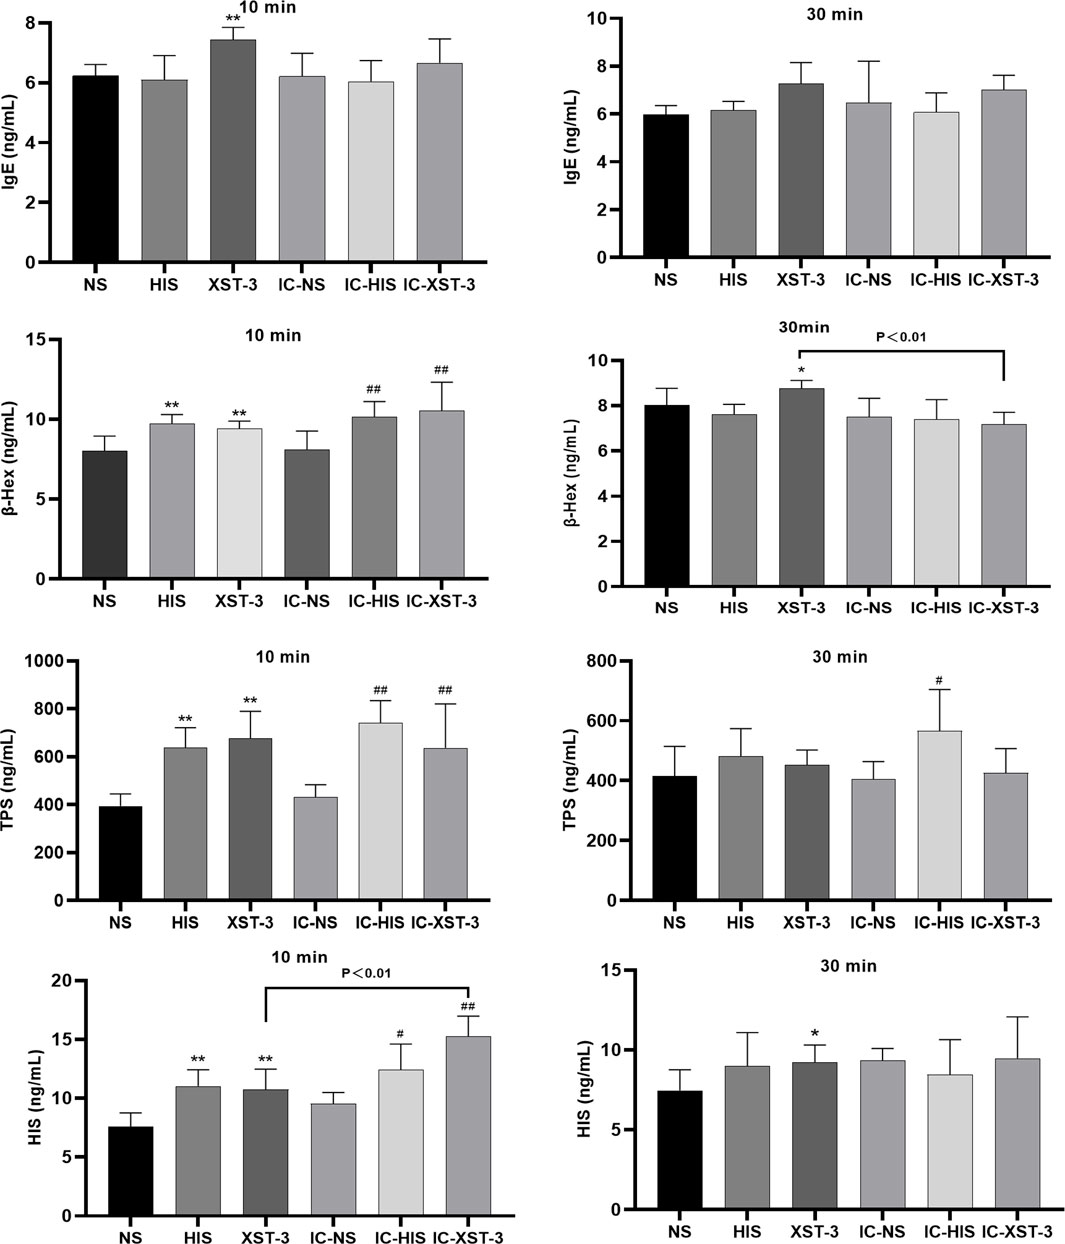
Figure 6. Concentrations of IgE, β-Hex, TPS, and HIS in the serum at 10 min and 30 min respectively. (*p < 0.05, **p < 0.01 compared to the NS group; #p < 0.05, ##p < 0.01 compared to the IC-NS group).
The increase in these indicator concentrations confirms the successful establishment of the ARs model.
3.4 LC-MS stability analysis
The response peak of the QC sample internal standard was analyzed first (Figure 7). Results indicated that the retention time and response intensity of the QC sample are highly stable. No significant peaks of the internal standard were detected in the blank sample, demonstrating stable instrument data collection and effective control of material residues and cross-contamination between samples. Subsequently, a correlation analysis of the QC samples was conducted (Figure 8), revealing a correlation coefficient close to 1, which indicates a high degree of correlation. This suggests that the experimental data quality is reliable. Overall, the robustness of the LC-MS method was confirmed.
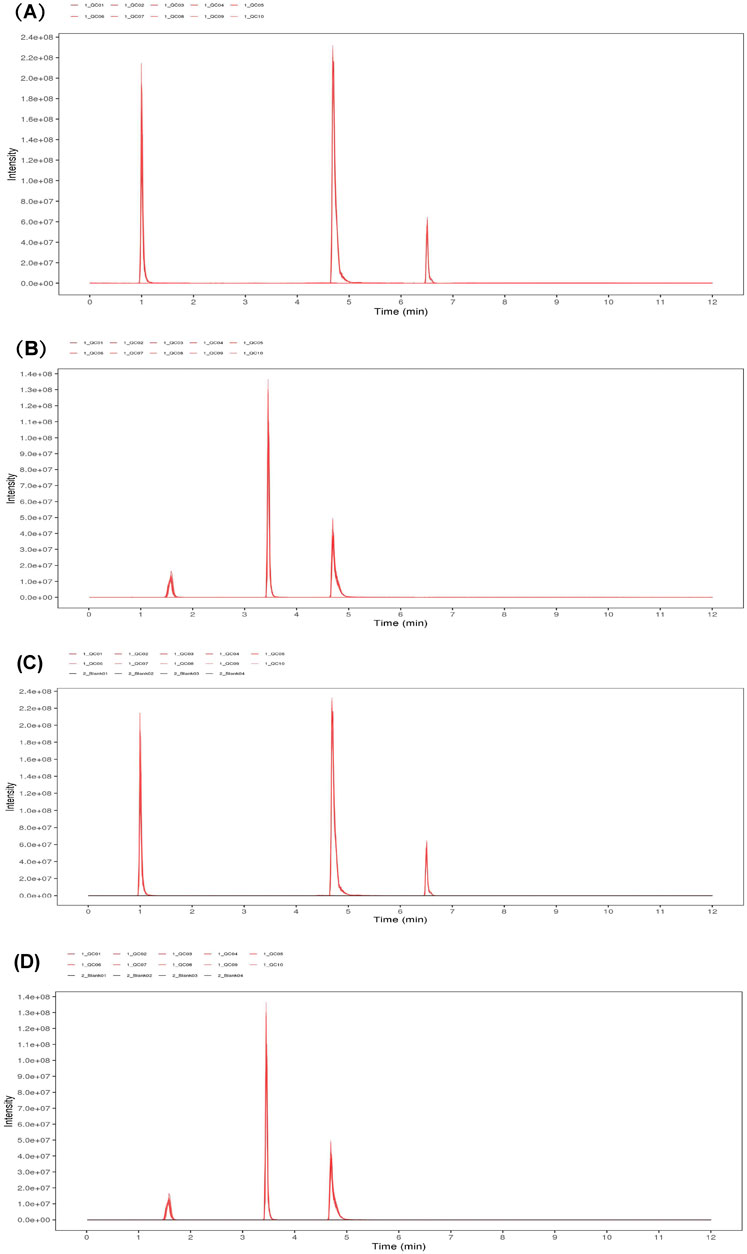
Figure 7. EIC plots of internal standard positive (A) and negative (B) ions in QC samples. EIC plots of positive (C) and negative (D) ions of internal standards in QC samples.
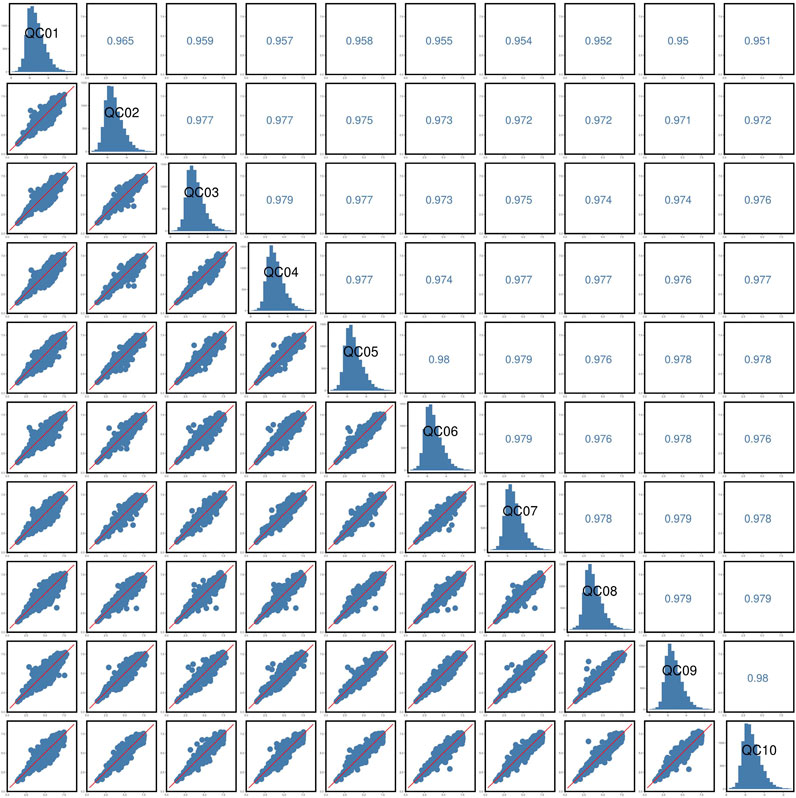
Figure 8. QC samples correlation analysis.
3.5 PCA analysis
PCA is an unsupervised data analysis technique (Gao et al., 2024) used here to assess intergroup differences. In the diagram (Figure 9), the horizontal and vertical axes represent the scores of the first two principal components. Each scatter point denotes a sample, with points of the same color representing samples from the same group. The proximity of sample points suggests similarity in metabolite types and contents, while greater distances between points indicate larger differences in metabolic profiles. The drug treatment groups predominantly fall within the 95% confidence interval and are distinguishable from the non-drug group.
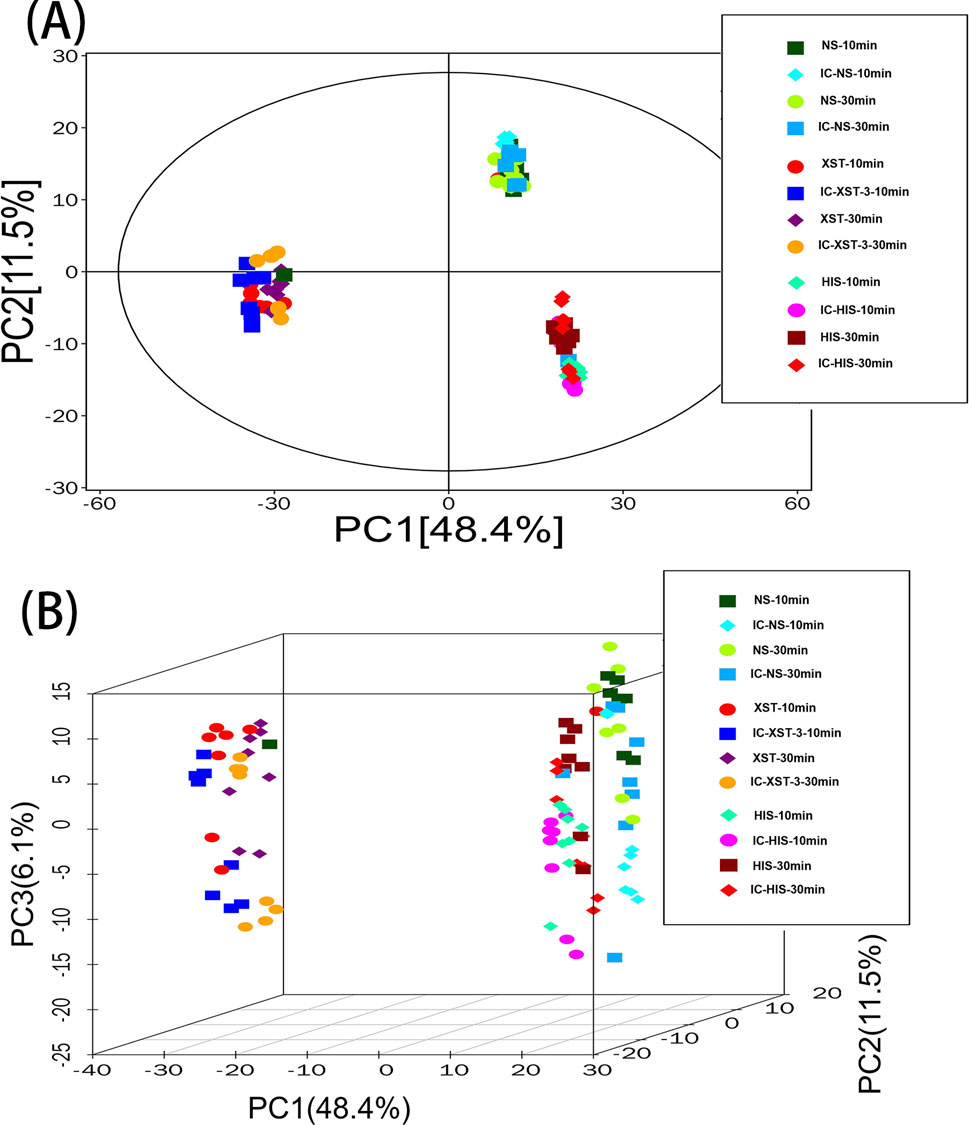
Figure 9. PCA score plot of total sample. (A): 2D plot. (B): 3D plot.
3.6 OPLS-DA analysis
OPLS-DA is a supervised classification model. First, we validated the model’s effectiveness using 7-fold cross-validation, followed by a permutation test for further assessment. R2Y represents the model’s explanatory ability, while Q2 indicates its predictive power. The closer these values are to 1, the better the model’s fit. As shown in figure (Figure 10), the R2Y for each group exceeds 0.9, Q2 exceeds 0.4, and the Q2 intercept on the ordinate is below 0, indicating that the model is not overfitted and the groups are completely separable.
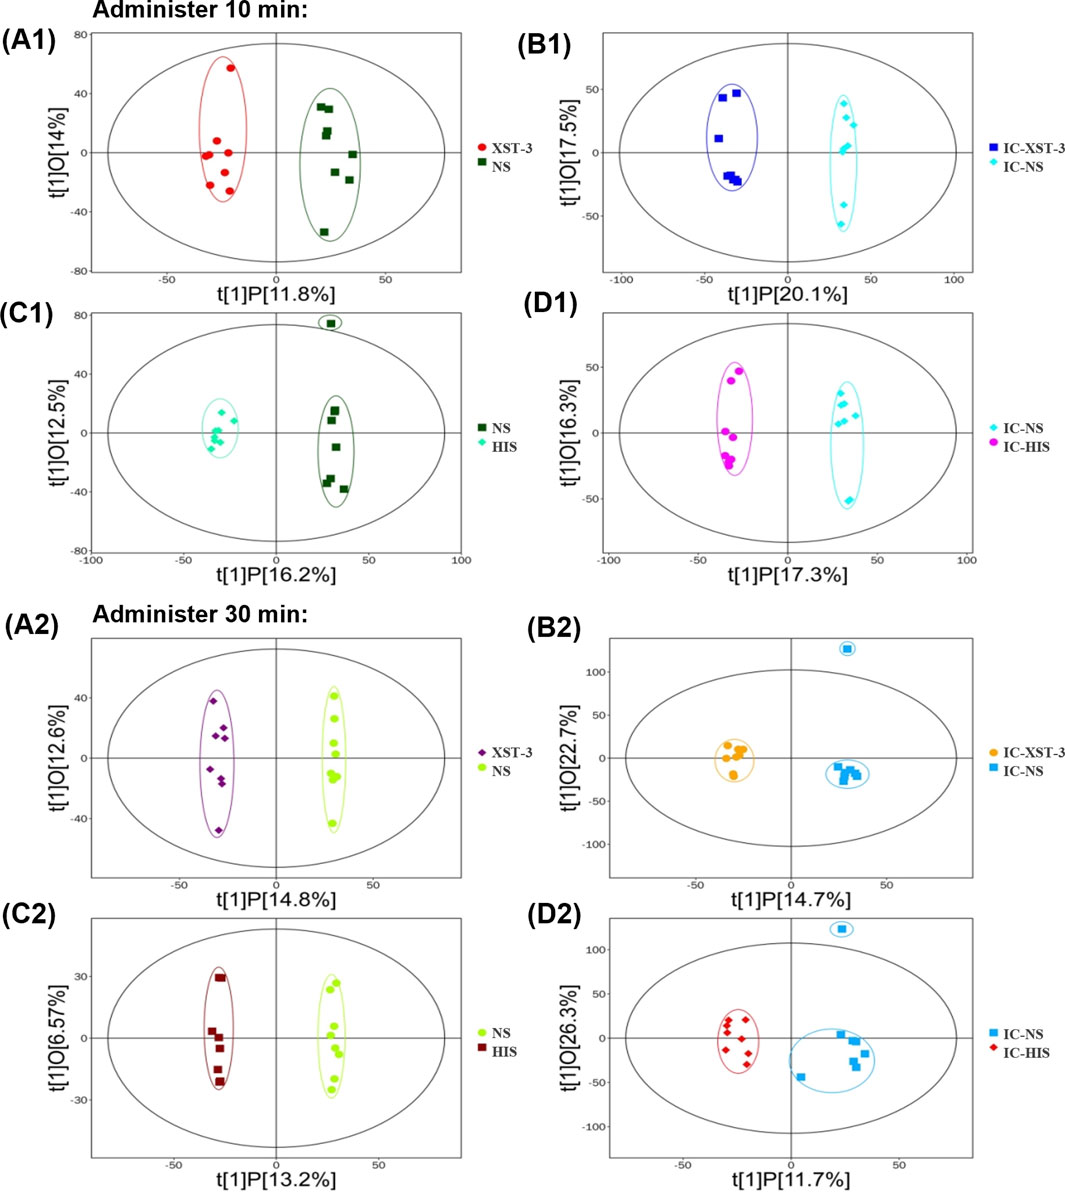
Figure 10. OPLS-DA score plot. (A1, A2): Comparison of XST-3 group and NS group. (B1, B2): Comparison of IC-XST-3 group and IC-NS group. (C1, C2): Comparison of NS group and HIS group. (D1, D2): Comparison of IC-NS group and IC-HIS group.
3.7 Identification of differential metabolites
Potential differential metabolites (p < 0.05, VIP >1) were identified through multivariate statistical analysis using databases such as HMDB and KEGG. Endogenous differential metabolites were further validated by assessing their pathway impacts and consulting the relevant literature. As a result, 10 differential metabolites were identified in the XST group (Table 4) and IC-XST-3 group (Table 5) respectively, while 21 and 20 differential metabolites were found in the HIS group (Table 6) and IC-HIS group (Table 7), respectively.
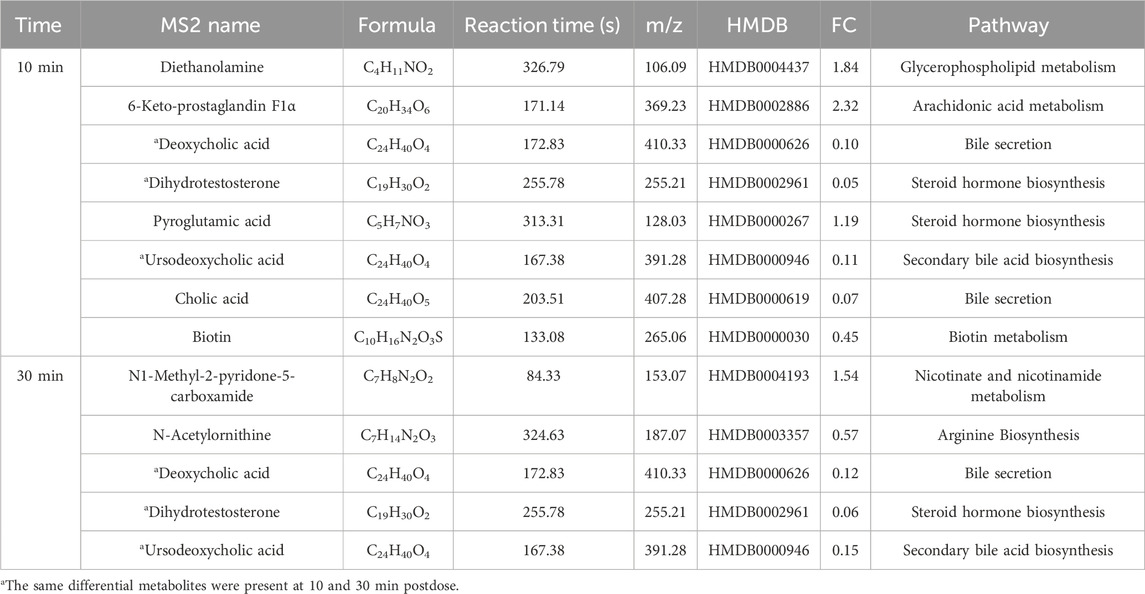
Table 4. Differential metabolites in XST-3 group.
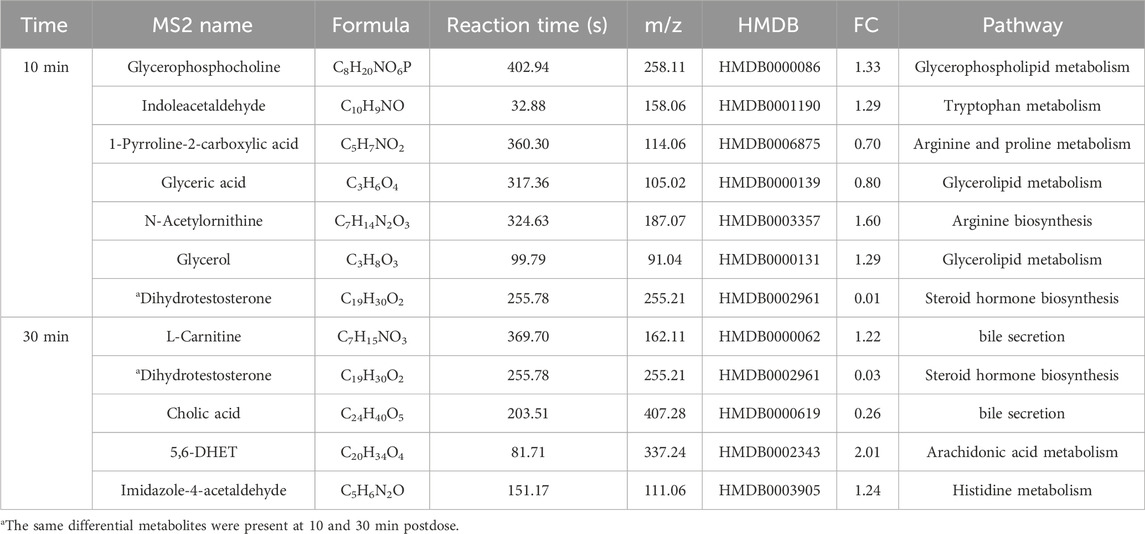
Table 5. Differential metabolites in IC-XST-3 group.
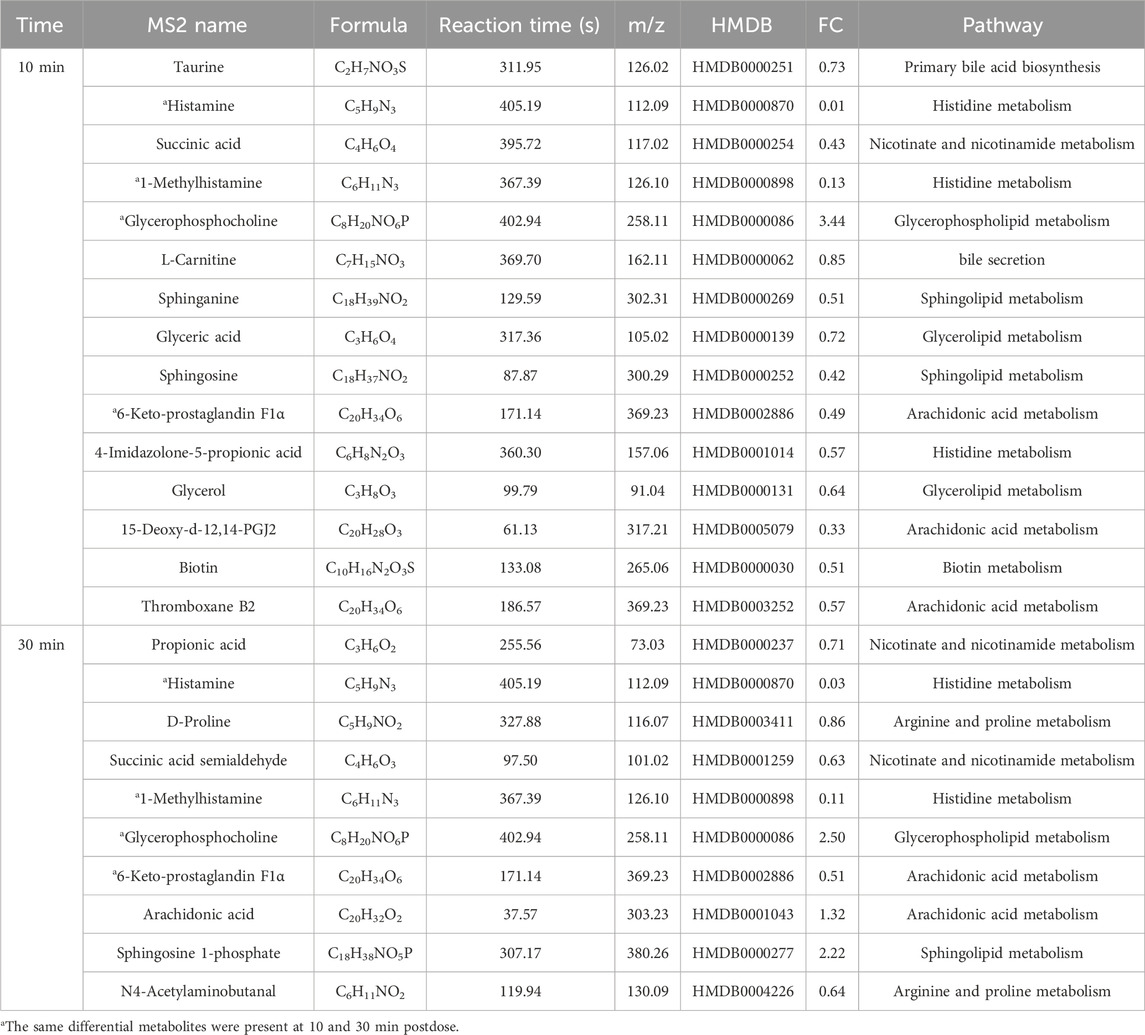
Table 6. Differential metabolites in HIS group.
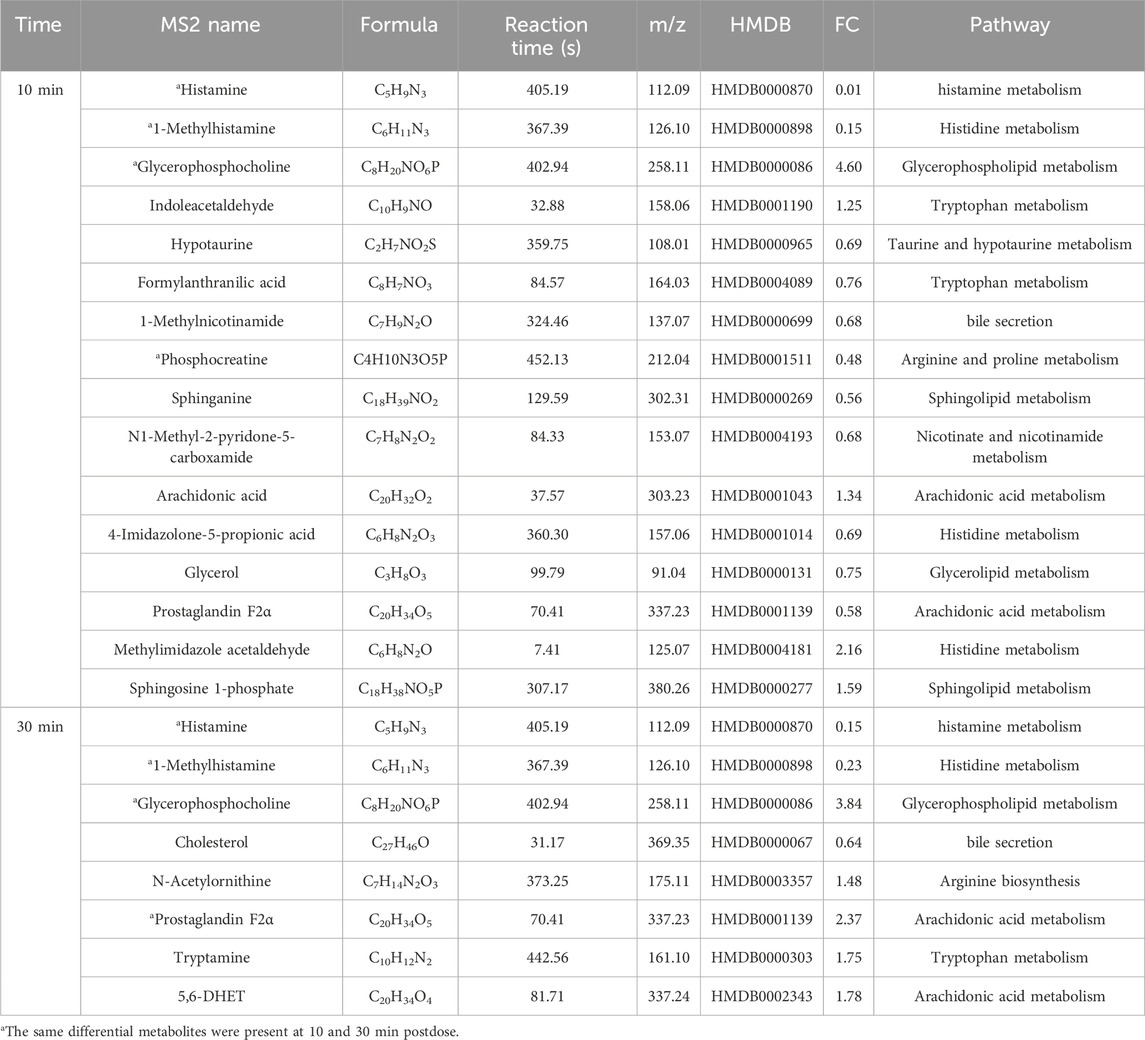
Table 7. Differential metabolites in IC-HIS group.
3.8 Metabolite pathway analysis
Metabolic pathway maps for each group (Figure 11) were generated using the MetaboAnalyst analysis platform (http://new.metaboanalyst.ca/ModuleView.xhtml). In these maps, a higher p-value indicates greater relevance of the metabolic pathways to the drug effects. Analysis revealed that the XST-3 group’s pathways involve glycerophospholipid, arachidonic acid, bile secretion, and biotin metabolism. For the IC-XST-3 group, the pathways include glycerophospholipid, tryptophan, and glyceride metabolism. The HIS group’s pathways encompass histamine, arachidonic acid, and sphingolipid metabolism. The metabolic pathways for the IC-HIS group include histamine, glycerophospholipid, and tryptophan metabolism. In addition, the key metabolic pathways for the XSTI treatment groups were illustrated in detail (Figures 12, 13). In this map, circular nodes represent metabolites, with red indicating significantly upregulated metabolites and blue indicating significantly downregulated metabolites. Rectangular boxes represent genes (proteins) involved in the pathway, and lines indicate the direction of metabolic reactions.
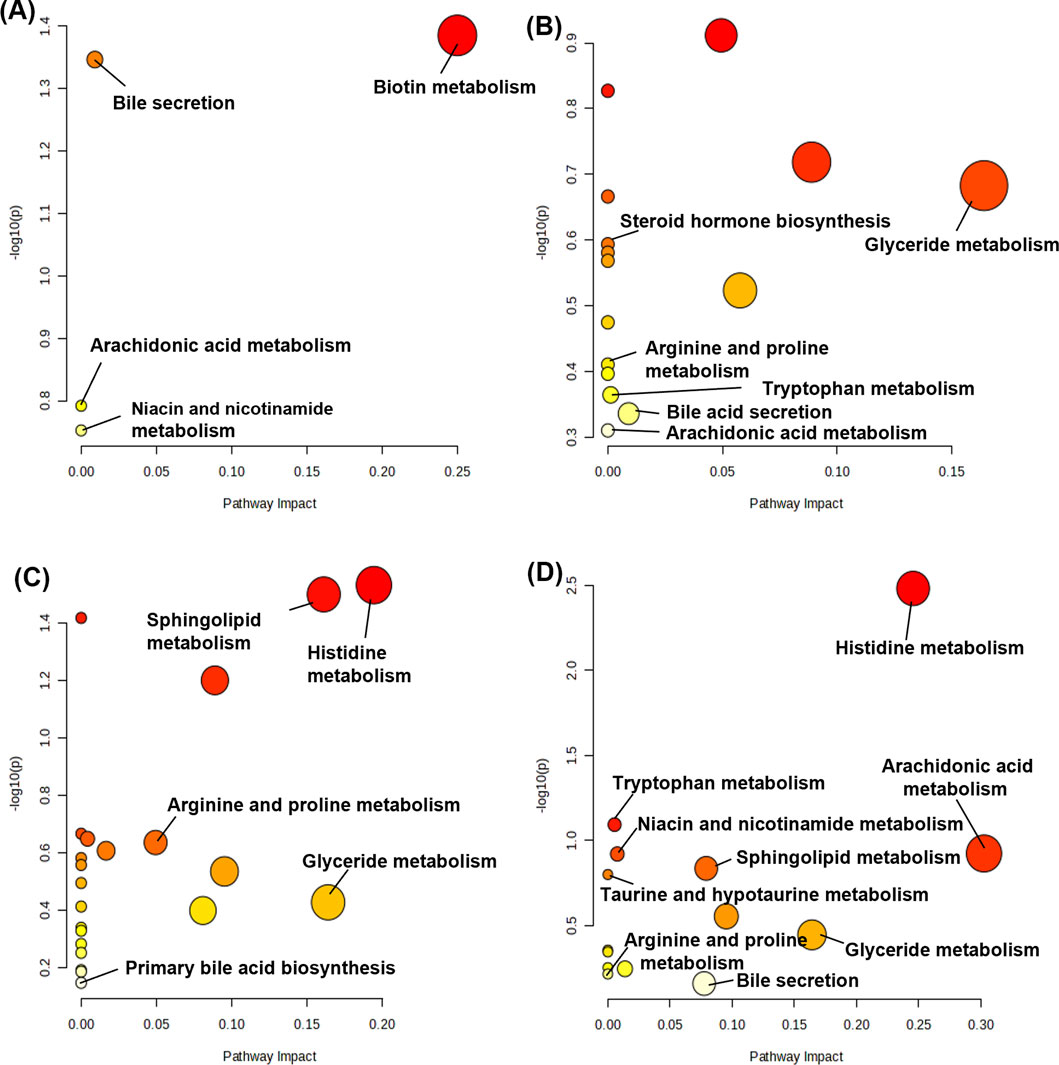
Figure 11. Metabolic pathway map. (A): XST-3 group-related pathways. (B): HIS group-related pathways. (C): IC-XST-3 group-related pathways. (D): IC-HIS group-related pathways.
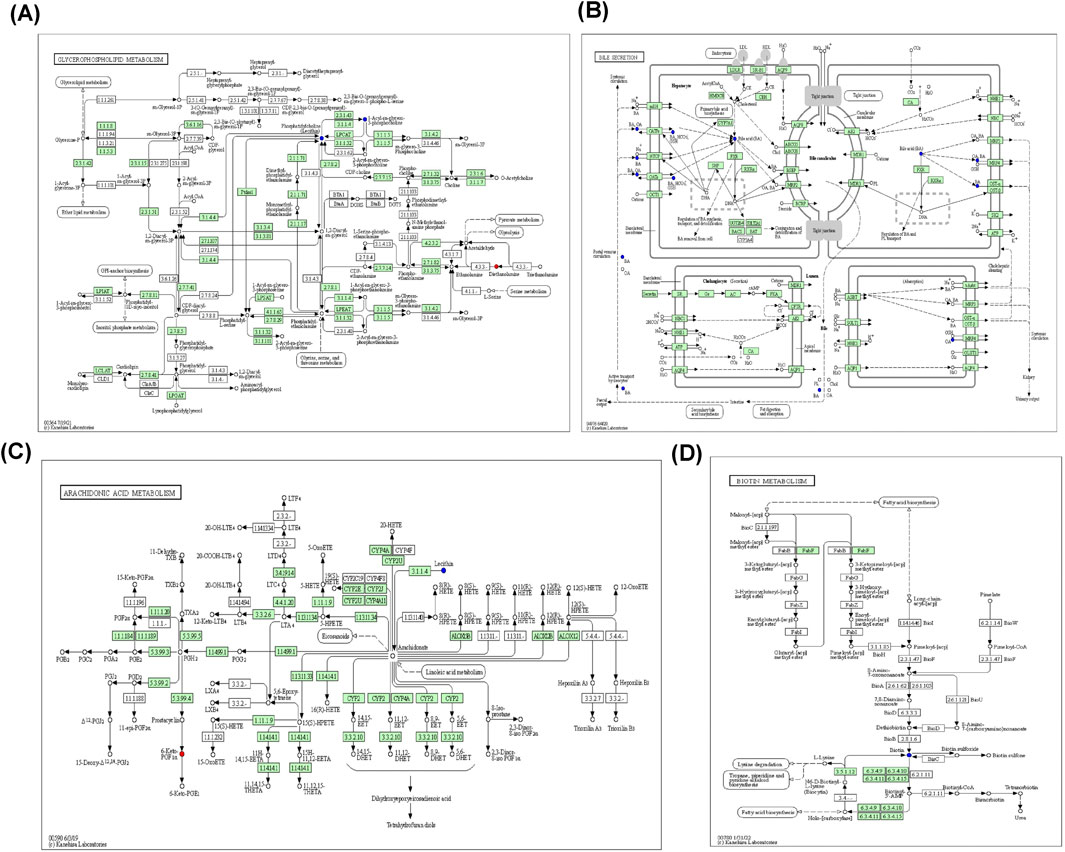
Figure 12. XST-3 key metabolic pathways. (A): Glycerophospholipid metabolism. (B): Bile secretion. (C): Arachidonic acid metabolism. (D): Biotin metabolism.
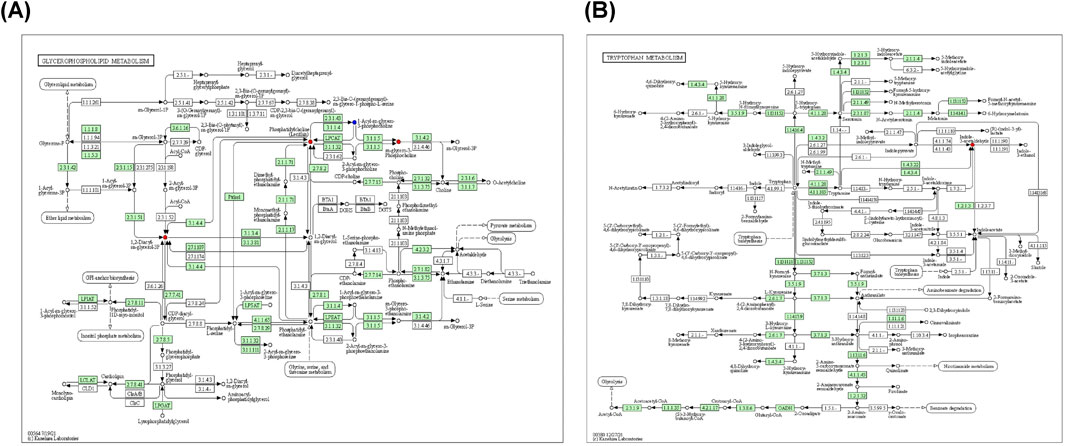
Figure 13. IC-XST-3 key metabolic pathways. (A): Glycerophospholipid and glyceride metabolism. (B): tryptophan metabolism.
4 Discussion
TCMI exhibits a rapid onset of action and high bioavailability compared to other dosage forms (Guo, X. et al., 2012). However, adverse reactions induced by TCMI, particularly ARs, have hindered its clinical application (Li, L. et al., 2012).
While prior research has focused primarily on drug-related factors, the disease-syndrome-based toxicology concept proposed by Xiao (Bai et al., 2017) underscores the importance of considering individual specificity, such as immune and metabolic abnormalities, in adverse reaction studies (Ulrich, 2007). Individual specificity, encompassing immune and metabolic abnormalities, is a key factor in drug-specific injury. Skin and liver are common targets of drug-specific injury, leading to clinical manifestations such as liver damage and various allergic diseases (Mosedale and Watkins, 2020). Studies have indicated that specific individuals are more susceptible to allergic diseases (Verma et al., 2018), underscoring the role of individual constitutions in the occurrence of such conditions.
In this experiment, we investigated the differences in ARs induced by XSTI in two different body states: normal and immunocompromised. Auricular blue staining and EB exudation experiments demonstrated reduced sensitivity to high doses of XSTI in immunocompromised mice. Notably, at low doses, immunocompromised mice exhibited larger auricular blue staining areas and increased EB exudation compared to normal mice, contrasting with results at the high doses. Since the behavioral results indicated that ARs induced by XSTI at low doses were negative, this opposite result may stem from metabolic changes in immunosuppressive mice. For instance, N1-methyl-2-pyridone-5-carboxamide, a final metabolite of niacin known to enhance endothelial function, vascular inflammatory responses, and angiogenesis (Pang et al., 2016), was downregulated in immunocompromised mice and upregulated in normal mice. This suggests that metabolic alterations may affect vascular permeability in immunocompromised mice, contributing to the opposite results observed at low doses.
In the ELISA experiment, TPS, β-Hex, and HIS, inflammatory mediators released through mast cell degranulation (Roy et al., 2021), were used to evaluate the occurrence of ARs, while IgE was employed to evaluate the association between XSTI and type I hypersensitivity. Surprisingly, IgE levels in the XST-3 group were significantly elevated compared to the NS group (p < 0.01), suggesting that XSTI may mediate allergic reactions through the IgE pathway. However, the reactions were observed to occur within 30 min of the first dose, confirming that ARs remain the primary response.
We hypothesized metabolic pathways of ARs through differential metabolites. The rapid onset of ARs may be linked to biotin metabolism, observed within 30 min after administration. Dihydrotestosterone, a metabolite that appeared exclusively in XSTI-treated groups and exhibited a decreasing trend, warrants further investigation as a potential biomarker for ARs. Additionally, studying other metabolites and related enzymes may provide valuable insights and serve as a foundation for future research on ARs induced by XSTI. Furthermore, the variations in metabolic pathways between normal and immunocompromised mice indicate that the body’s immune status can influence the sensitizing effect of TCMI, thereby revealing the immune specificity of ARs.
4.1 Biotin metabolism
Biotin regulates immune and inflammatory functions by modulating lymphocytes and transcription factors, with its deficiency being linked to skin inflammation and immune dysfunction (Seki, 2006; Kuroishi, 2015). In this study, biotin metabolism was observed in the normal groups. In the XST-3 and HIS groups, biotin levels were downregulated at 10 min and recovered by 30 min, suggesting that XSTI and HIS may trigger inflammatory responses by suppressing biotin metabolism. Notably, the timing of biotin metabolism aligns with the rapid onset of ARs, further supporting its involvement in ARs regulation.
4.2 Bile secretion and primary and secondary bile acid biosynthesis
Bile acids play a pivotal role in regulating inflammation by inhibiting the Nlrp3 inflammasome (Guo et al., 2016) and activating the farnesoid X and G protein-coupled bile acid receptors, which are associated with the regulation of monocyte and macrophage functions (Fiorucci et al., 2020). In the XST-3 group, deoxycholic acid, cholic acid, and ursodeoxycholic acid were downregulated. In the IC-XST-3 group, cholic acid showed a downward trend, while L-carnitine exhibited an upward trend. The HIS group displayed downregulation of taurine and L-carnitine. In the IC-HIS group, 1-methylnicotinamide and cholesterol were downregulated. Cholesterol serves as the primary precursor for bile acid synthesis, while taurine enhances bile acid solubility through conjugation. Cholic acid, deoxycholic acid, and ursodeoxycholic acid are major components of primary and secondary bile acids (Di Ciaula et al., 2017). The marked downregulation of these metabolites indicates that XSTI and HIS suppress the bile acid synthesis pathway, leading to ARs.
4.3 Arachidonic acid metabolism
Arachidonic acid (AA), a key component of cell membrane lipids, is primarily metabolized by cyclooxygenase (COX), lipoxygenase, and cytochrome P450 (CYP450) enzymes. Its metabolites, including prostaglandins, thromboxanes, leukotrienes, and hydroxyeicosatetraenoic acids, trigger various inflammatory responses (Wang et al., 2019).
In our study, 6-keto-PGF1α was upregulated in the XST-3 group, and 5,6-dihydroxyeicosatrienoic acid (5,6-DHET) was upregulated in the IC-XST-3 group. In the HIS group, 6-keto-PGFα, 15-deoxy-d-12,14-PGJ2, and thromboxane B2 were downregulated, while arachidonic acid was upregulated. In the IC-HIS group, arachidonic acid and 5,6-DHET were upregulated, and prostaglandin F2α was downregulated at 10 min and upregulated at 30 min. In the XSTI treatment groups, 6-keto-PGF1α and 5,6-DHET were significantly upregulated. These are degradation products of AA metabolized through the COX pathway into PGI2 and EET, respectively, which can dilate blood vessels and reduce platelet aggregation (Levi-Rosenzvig et al., 2017). This hypothesized that XSTI induces ARs by upregulating the COX metabolic pathway of AA. In the HIS treatment groups, most AA metabolites were downregulated, while AA levels increased, suggesting that HIS inhibits AA metabolism, leading to AA accumulation.
4.4 Niacin and nicotinamide metabolism
Niacin, a precursor of nicotinamide adenine dinucleotide (NAD+) and nicotinamide adenine dinucleotide phosphate (NADP+) (Gasperi et al., 2019), can inhibit vascular inflammation (Kamanna and Kashyap, 2008) and alleviate systemic inflammatory responses by reducing inflammatory factors produced by monocytes and macrophages (Siavashani et al., 2020). Excessive niacin, however, may lead to skin vasodilation and flushing (Javaid and Mudavath, 2024).
In this study, N1-methyl-2-pyridone-5-carboxamide (2PY) was upregulated in the XST-3 group, while succinate, propionate, and succinate semialdehyde were downregulated in the HIS group, and 2PY was downregulated in the IC-HIS group. Succinate is an intermediate of the Krebs cycle, which is linked to metabolic regulation and inflammation and requires NAD⁺/NADP⁺ as essential cofactors for its proper functioning (Tang et al., 2022). In the HIS-treated groups, the terminal niacin metabolite 2PY and succinate-related metabolites were downregulated, suggesting that HIS inhibits niacin metabolism, thereby promoting inflammation. This inhibition likely reduces NAD⁺/NADP⁺ synthesis, impairing the Krebs cycle. Conversely, 2PY was upregulated in the XST-3 group, indicating that XSTI may regulate ARs by enhancing nicotinamide metabolism.
4.5 Tryptophan metabolism
Tryptophan can be converted into niacin, and its metabolism primarily occurs via the kynurenine, serotonin, and indole pathways, playing roles in regulating inflammation, metabolism, immune responses, and neural functions (Xue et al., 2023). In the IC-XST-3 group, indole acetaldehyde was upregulated. In the IC-HIS group, indole acetaldehyde and tryptamine were upregulated, while formyl anthranilic acid was downregulated. Differential metabolites were observed exclusively in the immunocompromised groups, primarily involving the indole metabolic pathway. In this pathway, tryptophan is converted into tryptamine and indole derivatives under the influence of gut microbiota (Xue et al., 2023). Indole derivatives contribute to maintaining immune system homeostasis and activate the aryl hydrocarbon receptor, which regulates immune cells and gut barrier integrity (Li, 2023). It is hypothesized that XSTI and HIS modulate inflammatory responses in immunocompromised mice through the regulation of tryptophan metabolism.
4.6 Steroid hormone biosynthesis
Steroid hormones, including sex hormones and adrenal cortical hormones, exert immunosuppressive and anti-inflammatory effects in the body (Wang, C. et al., 2015). In the XST-3 group, pyroglutamic acid was upregulated, while dihydrotestosterone (DHT) was downregulated. Similarly, DHT was downregulated in the IC-XST-3 group. DHT exerts multiple inhibitory effects on innate and adaptive immune responses, with its deficiency associated with enhanced expression of inflammatory factors (Ikuta et al., 2022). The downregulation of DHT in the XSTI-treated groups suggests that XSTI may promote inflammation by suppressing DHT levels and inducing ARs. Moreover, DHT could serve as a potential biomarker for XSTI-induced ARs.
4.7 Lipid metabolism
Lipid metabolism involves glycerolipid, glycerophospholipid, and sphingolipid pathways, which work synergistically to maintain cellular functions by supporting membrane structure and signal transduction (Ristovski et al., 2021). In the XST-3 group, diethanolamine levels were upregulated. Glycerophosphocholine and glycerol were upregulated in the IC-XST-3 group, while glyceric acid was downregulated. The HIS group showed upregulation of glycerophosphatidic acid choline and sphingosine 1-phosphate (S1P), alongside downregulation of sphingosine, glyceric acid, and glycerol. In the IC-HIS group, glycerophosphocholine and S1P were upregulated, whereas sphingosine and glycerol were downregulated. Glycerophospholipids activate calcium signaling and PKC signaling through hydrolysis by PLC, which induces MC degranulation (Yang, Y. et al., 2019). S1P is a bioactive intermediate in sphingolipid metabolism, activates the RhoA/ROCK pathway, regulates the actin cytoskeleton, increases vascular permeability, and triggers inflammatory responses (Piao et al., 2024). These findings suggest that XSTI primarily regulates glycerophospholipid metabolism, while HIS impacts both glycerophospholipid and sphingolipid metabolism, acting on MC to induce degranulation and triggering ARs.
4.8 Arginine and proline metabolism
Arginine metabolism is crucial for immune cell responses, with its metabolites playing key roles in T cell activation and the regulation of both innate and adaptive immunity (Li, S. et al., 2022). Proline is vital for protein synthesis, wound healing, antioxidant defense, and immune function (Wu et al., 2011). Arginine and proline interconvert via ornithine as an intermediate to sustain physiological metabolic functions (Wang et al., 2024).
N-acetylornithine was downregulated in the XST-3 group. In the IC-XST-3 group, 1-pyrroline-2-carboxylic acid showed a downward trend, while N-acetylornithine was upregulated. D-proline and N4-acetamide butyraldehyde were downregulated in the HIS group. In normal groups, the downregulation of metabolites suggests that the drugs may weaken T cell and macrophage functions and disrupt the immune balance by inhibiting arginine and proline metabolism. Conversely, the upregulation of N-acetylornithine in the IC-XST-3 group reflected the body’s attempt to restore immune function through compensatory metabolic adjustments.
5 Conclusion
In this study, we used XSTI as a model drug to explore the relationship between AR intensity, TCMIs, and immune status. The results demonstrated that XSTI induces ARs in a dose-dependent manner and that the body’s immune status affects the severity of ARs, with reduced intensity under the immunosuppressive state. Metabolomic analysis revealed that XSTI modulates ARs by influencing several metabolic pathways involved in the regulation of cellular membrane phospholipids, MC functionality, and inflammatory responses. The differential metabolite dihydrotestosterone, which appeared only in the XSTI-treated group, has the potential to serve as a biomarker for the onset of XSTI-induced ARs. In immunocompromised mice, the attenuation of ARs may be due to the inhibition of inflammatory cytokine release via tryptophan metabolism. Differences in metabolic pathways related to varying immune statuses likely contribute to the decreased AR intensity observed in immunocompromised mice. However, certain limitations exist in this study. The investigation focused on the effects of immunosuppression on ARs, leaving immune stress unaddressed. Further research on ARs under immune stress conditions is required to comprehensively elucidate the relationship between ARs and the body’s immune status. Although metabolomics analysis identified metabolic pathways involved in XSTI-induced ARs, these pathways were not validated. Future studies should incorporate experimental validation to uncover the mechanisms of these pathways and clarify their connection to immune status and ARs.
Data availability statement
The raw data supporting the conclusions of this article will be made available by the authors, without undue reservation.
Ethics statement
The animal study was approved by The Ethics Committee of Hunan University of Chinese Medicine. The study was conducted in accordance with the local legislation and institutional requirements.
Author contributions
XG: Data curation, Investigation, Methodology, Writing–original draft. CZ: Data curation, Investigation, Methodology, Writing–original draft. YL: Writing–review and editing. WW: Writing–review and editing. YH: Resources, Supervision, Writing–review and editing. FT: Resources, Supervision, Writing–review and editing. CC: Resources, Supervision, Writing–review and editing. CH: Software, Validation, Writing–review and editing. LO: Software, Validation, Writing–review and editing. WL: Visualization, Writing–review and editing. ZZ: Conceptualization, Funding acquisition, Writing–review and editing. HL: Conceptualization, Funding acquisition, Writing–review and editing.
Funding
The author(s) declare that financial support was received for the research, authorship, and/or publication of this article. This study was supported by National Natural Science Foundation of China (82174069, 82474180, 81874344), Natural Science Foundation of Hunan Province (2020JJ4486, 2023JJ60474), Department of Science and Technology of Hunan Province (2020SK3037), R&D Plan in Key Areas of Hunan Province (2023SK2046), Hunan Provincial Health High-level Talent Major Scientific Research Project (R2023139), Hunan Innovative Province Construction Project (2024RC8110), Natural Science Foundation of Changsha Municipality (kq2208148, kq2208191), and Provincial and school-level innovation projects (2023CX105).
Conflict of interest
The authors declare that the research was conducted in the absence of any commercial or financial relationships that could be construed as a potential conflict of interest.
Generative AI statement
The author(s) declare that no Generative AI was used in the creation of this manuscript.
Publisher’s note
All claims expressed in this article are solely those of the authors and do not necessarily represent those of their affiliated organizations, or those of the publisher, the editors and the reviewers. Any product that may be evaluated in this article, or claim that may be made by its manufacturer, is not guaranteed or endorsed by the publisher.
References
Bai, Z., Meng, Y., He, L., Tang, J., Wang, J., and Xiao, X. (2017). Immune idiosyncratic liver injury induced by traditional non-toxic traditional Chinese medicine and a hypothesis of its mechanism. China J. Chin. Materia Medica 52, 1105–1109. doi:10.11669/cpj.2017.13.001
Chen, M., Li, W., Wang, X., Huang, Z., Geng, X., and Li, B. (2017). Progress in research of the mechanism and preclinical evaluation of drug pseudoallergy. Chin. J. New Drugs 26, 51–59.
Cianferoni, A. (2021). Non-IgE-mediated anaphylaxis. J. Allergy Clin. Immunol. 147, 1123–1131. doi:10.1016/j.jaci.2021.02.012
Di Ciaula, A., Garruti, G., Lunardi Baccetto, R., Molina-Molina, E., Bonfrate, L., Wang, D. Q.-H., et al. (2017). Bile acid physiology. Ann. Hepatol. 16, s4–s14. doi:10.5604/01.3001.0010.5493
Dunn, W. B., Broadhurst, D., Begley, P., Zelena, E., Francis-McIntyre, S., Anderson, N., et al. (2011). Procedures for large-scale metabolic profiling of serum and plasma using gas chromatography and liquid chromatography coupled to mass spectrometry. Nat. Protoc. 6, 1060–1083. doi:10.1038/nprot.2011.335
Fan, X., Lin, L., Wei, J., and Jin, H. (2018). Research on Anaphylactoid reactions to traditional Chinese medicine injections: new Perspectives. J. Toxicol. 32, 327–331. doi:10.16421/j.cnki.1002-3127.2018.04.015
Fiorucci, S., Baldoni, M., Ricci, P., Zampella, A., Distrutti, E., and Biagioli, M. (2020). Bile acid-activated receptors and the regulation of macrophages function in metabolic disorders. Curr. Opin. Pharmacol. 53, 45–54. doi:10.1016/j.coph.2020.04.008
Gao, W., Tian, M., Li, M., Gao, S., Wei, X., Gao, C., et al. (2024). Study on the potential mechanism of Qingxin Lianzi Yin Decoction on renoprotection in db/db mice via network pharmacology and metabolomics. Phytomedicine 126, 155222. doi:10.1016/j.phymed.2023.155222
Gasperi, V., Sibilano, M., Savini, I., and Catani, M. V. (2019). Niacin in the central nervous system: an update of biological aspects and clinical applications. Int. J. Mol. Sci. 20, 974. doi:10.3390/ijms20040974
Guo, C., Xie, S., Chi, Z., Zhang, J., Liu, Y., Zhang, L., et al. (2016). Bile acids control inflammation and metabolic disorder through inhibition of NLRP3 inflammasome. Immunity 45, 802–816. doi:10.1016/j.immuni.2016.09.008
Guo, X., Zhang, N., and Li, L. (2012). Cause analysis on adverse reaction of Chinese materia medica injection and countermeasures. Drug Eval. Res. 35, 216–219.
Ikuta, K., Ejima, A., Abe, S., and Shimba, A. (2022). Control of immunity and allergy by steroid hormones. Allergol. Int. 71, 432–436. doi:10.1016/j.alit.2022.07.006
Javaid, A., and Mudavath, S. L. (2024). Niacin-induced flushing: mechanism, pathophysiology, and future perspectives. Archives Biochem. Biophysics 761, 110163. doi:10.1016/j.abb.2024.110163
Kamanna, V. S., and Kashyap, M. L. (2008). Mechanism of action of niacin. Am. J. Cardiol. 101, 20B-26B–26B. doi:10.1016/j.amjcard.2008.02.029
Kuroishi, T. (2015). Regulation of immunological and inflammatory functions by biotin. Can. J. Physiol. Pharmacol. 93, 1091–1096. doi:10.1139/cjpp-2014-0460
Levi-Rosenzvig, R., Beyer, A. M., Hockenberry, J., Ben-Shushan, R. S., Chuyun, D., Atiya, S., et al. (2017). 5,6-δ-DHTL, a stable metabolite of arachidonic acid, is a potential EDHF that mediates microvascular dilation. Free Radic. Biol. Med. 103, 87–94. doi:10.1016/j.freeradbiomed.2016.12.022
Li, C., Xu, T., Zhou, P., Zhang, J., Guan, G., Zhang, H., et al. (2018a). Post-marketing safety surveillance and re-evaluation of Xueshuantong injection. BMC Complement. Altern. Med. 18, 277. doi:10.1186/s12906-018-2329-z
Li, L., Jin, R., and Li, X. (2012). Progress in experimental studies on anaphylactoid reactions to traditional Chinese medicine injections. Pharmacol. Clin. Chin. Materia Medica 28, 187–190. doi:10.13412/j.cnki.zyyl.2012.01.060
Li, Q., Chen, G., Chen, H., Zhang, W., Ding, Y., Yu, P., et al. (2018b). Se-enriched G. frondosa polysaccharide protects against immunosuppression in cyclophosphamide-induced mice via MAPKs signal transduction pathway. Carbohydr. Polym. 196, 445–456. doi:10.1016/j.carbpol.2018.05.046
Li, S. (2023). Modulation of immunity by tryptophan microbial metabolites. Front. Nutr. 10, 1209613. doi:10.3389/fnut.2023.1209613
Li, S., Wang, L., Liang, W., and Xiao, H. (2022). Research on arginine metabolic pathway and its application in livestock production. Chin. J. Animal Nutr. 34, 2156–2166. doi:10.3969/j.issn.1006-267x.2022.04.012
Ma, A., and Qi, X. (2021). Mining plant metabolomes: methods, applications, and perspectives. Plant Commun. 2, 100238. doi:10.1016/j.xplc.2021.100238
Makare, N., Bodhankar, S., and Rangari, V. (2001). Immunomodulatory activity of alcoholic extract of Mangifera indica L. in mice. J. Ethnopharmacol. 78, 133–137. doi:10.1016/s0378-8741(01)00326-9
Mosedale, M., and Watkins, P. B. (2020). Understanding idiosyncratic toxicity: lessons learned from drug-induced liver injury. J. Med. Chem. 63, 6436–6461. doi:10.1021/acs.jmedchem.9b01297
Pang, D. K. T., Nong, Z., Sutherland, B. G., Sawyez, C. G., Robson, D. L., Toma, J., et al. (2016). Niacin promotes revascularization and recovery of limb function in diet-induced obese mice with peripheral ischemia. Pharmacol. Res & Perspec 4, e00233. doi:10.1002/prp2.233
Piao, J., Su, Z., He, J., Zhu, T., Fan, F., Wang, X., et al. (2024). SphK1 deficiency ameliorates the development of atherosclerosis by inhibiting the S1P/S1PR3/Rhoa/ROCK pathway. Cell. Signal. 121, 111252. doi:10.1016/j.cellsig.2024.111252
Ristovski, M., Farhat, D., Bancud, S. E. M., and Lee, J.-Y. (2021). Lipid transporters beam signals from cell membranes. Membranes 11, 562. doi:10.3390/membranes11080562
Rodriguez-Melendez, R., and Zempleni, J. (2003). Regulation of gene expression by biotin (review). J. Nutr. Biochem. 14, 680–690. doi:10.1016/j.jnutbio.2003.07.001
Roy, S., Chompunud Na Ayudhya, C., Thapaliya, M., Deepak, V., and Ali, H. (2021). Multifaceted MRGPRX2: new insight into the role of mast cells in health and disease. J. Allergy Clin. Immunol. 148, 293–308. doi:10.1016/j.jaci.2021.03.049
Seki, M. (2006). Biological significance and development of practical synthesis of biotin. Med. Res. Rev. 26, 434–482. doi:10.1002/med.20058
Shen, B., and Zhou, Y. (2015). Analysis and disscussion of the adverse drug reactions of 127 cases induced by traditional Chinese medicine injections. China J. Traditional Chin. Med. 30, 428–431.
Siavashani, A. Z., Mohammadi, J., Maniura-Weber, K., Senturk, B., Nourmohammadi, J., Sadeghi, B., et al. (2020). Correction: silk based scaffolds with immunomodulatory capacity: anti-inflammatory effects of nicotinic acid. Biomater. Sci. 8, 517. doi:10.1039/c9bm90059d
Tang, X., Rönnberg, E., Säfholm, J., Thulasingam, M., Trauelsen, M., Schwartz, T. W., et al. (2022). Activation of succinate receptor 1 boosts human mast cell reactivity and allergic bronchoconstriction. Allergy 77, 2677–2687. doi:10.1111/all.15245
Ulrich, R. G. (2007). Idiosyncratic toxicity: a convergence of risk factors. Annu. Rev. Med. 58, 17–34. doi:10.1146/annurev.med.58.072905.160823
Verma, N., Kumar, P., Mitra, S., Taneja, S., Dhooria, S., Das, A., et al. (2018). Drug idiosyncrasy due to pirfenidone presenting as acute liver failure: case report and mini-review of the literature. Hepatol. Commun. 2, 142–147. doi:10.1002/hep4.1133
Wang, A., Li, Y., Wang, Z., Xin, G., You, Y., Sun, M., et al. (2022). Proteomic analysis revealed the pharmacological mechanism of Xueshuantong injection in preventing early acute myocardial infarction injury. Front. Pharmacol. 13, 1010079. doi:10.3389/fphar.2022.1010079
Wang, C., Huang, X., Jiang, Z., and Zhang, L. (2015). Advances in the role of steroids hormones in rheumatoid arthritis. J. China Pharm. Univ. 46, 757–763. doi:10.11665/j.issn.1000-5048.20150621
Wang, D., Duan, J., Guo, Y., Chen, J., Chen, T., Wang, J., et al. (2024). Targeting the glutamine-arginine-proline metabolism axis in cancer. J. Enzyme Inhibition Med. Chem. 39, 2367129. doi:10.1080/14756366.2024.2367129
Wang, H., Wang, M., Chen, J., Tang, Y., Dou, J., Yu, J., et al. (2011). A polysaccharide from Strongylocentrotus nudus eggs protects against myelosuppression and immunosuppression in cyclophosphamide-treated mice. Int. Immunopharmacol. 11, 1946–1953. doi:10.1016/j.intimp.2011.06.006
Wang, J., Zhang, T., Shen, X., Liu, J., Zhao, D., Sun, Y., et al. (2016a). Serum metabolomics for early diagnosis of esophageal squamous cell carcinoma by UHPLC-QTOF/MS. Metabolomics 12, 116. doi:10.1007/s11306-016-1050-5
Wang, T., Fu, X., Chen, Q., Patra, J. K., Wang, D., Wang, Z., et al. (2019). Arachidonic acid metabolism and kidney inflammation. Int. J. Mol. Sci. 20, 3683. doi:10.3390/ijms20153683
Wang, Y., Liu, Y., Yu, H., Zhou, S., Zhang, Z., Wu, D., et al. (2017). Structural characterization and immuno-enhancing activity of a highly branched water-soluble β-glucan from the spores of Ganoderma lucidum. Carbohydr. Polym. 167, 337–344. doi:10.1016/j.carbpol.2017.03.016
Wang, Y., Qi, Q., Li, A., Yang, M., Huang, W., Xu, H., et al. (2016b). Immuno-enhancement effects of Yifei Tongluo Granules on cyclophosphamide-induced immunosuppression in Balb/c mice. J. Ethnopharmacol. 194, 72–82. doi:10.1016/j.jep.2016.08.046
Wei, S., Zhang, J., Liu, L., Ye, T., Gowda, G. A. N., Tayyari, F., et al. (2011). Ratio analysis nuclear magnetic resonance spectroscopy for selective metabolite identification in complex samples. Anal. Chem. 83, 7616–7623. doi:10.1021/ac201625f
Wu, G., Bazer, F. W., Burghardt, R. C., Johnson, G. A., Kim, S. W., Knabe, D. A., et al. (2011). Proline and hydroxyproline metabolism: implications for animal and human nutrition. Amino Acids 40, 1053–1063. doi:10.1007/s00726-010-0715-z
Xiao, P., Hou, L., Liu, Z., Mu, Y., Liu, Z., Wang, J., et al. (2020). Animal models for analysis of hypersensitivity reactions to Shuanghuanglian injection. Mol. Immunol. 122, 62–68. doi:10.1016/j.molimm.2020.03.014
Xie, J., Zhang, L., Yi, J., Kang, L., and Zhao, L. (2019). Establishment of new evaluation standards for systemic anaphylactoid reactions using mouse model. China J. Chin. Materia Medica 44, 3763–3772. doi:10.19540/j.cnki.cjcmm.20190422.401
Xue, C., Li, G., Zheng, Q., Gu, X., Shi, Q., Su, Y., et al. (2023). Tryptophan metabolism in health and disease. Cell Metab. 35, 1304–1326. doi:10.1016/j.cmet.2023.06.004
Yang, Y., Xie, J., Chen, M., Song, Y., and Huang, Y. (2019). Research progress on the mechanisms of anaphylactoid reactions to traditional Chinese medicine injections. Chin. Tradit. Pat. Med. 41, 1935–1940. doi:10.3969/j.issn.1001-1528.2019.08.037
Zhao, T., Feng, Y., Li, J., Mao, R., Zou, Y., Feng, W., et al. (2014). Schisandra polysaccharide evokes immunomodulatory activity through TLR 4-mediated activation of macrophages. Int. J. Biol. Macromol. 65, 33–40. doi:10.1016/j.ijbiomac.2014.01.018
Keywords: anaphylactoid reaction, different immunization status, Xueshuantong injection, metabolic pathway, metabolomics
Citation: Guo X, Zhang C, Li Y, Wen W, He Y, Tang F, Chen C, Hu C, OuYang L, Liu W, Zhu Z and Liu H (2025) Metabolomics analysis of anaphylactoid reactions induced by Xueshuantong injection in normal and immunocompromised mice. Front. Pharmacol. 15:1526875. doi: 10.3389/fphar.2024.1526875
Received: 12 November 2024; Accepted: 09 December 2024;
Published: 06 January 2025.
Edited by:
Rong-Rong He, Jinan University, ChinaReviewed by:
Jiawei Ling, Zhejiang University, ChinaJinfa Tang, First Affiliated Hospital of Henan University of Traditional Chinese Medicine, China
Copyright © 2025 Guo, Zhang, Li, Wen, He, Tang, Chen, Hu, OuYang, Liu, Zhu and Liu. This is an open-access article distributed under the terms of the Creative Commons Attribution License (CC BY). The use, distribution or reproduction in other forums is permitted, provided the original author(s) and the copyright owner(s) are credited and that the original publication in this journal is cited, in accordance with accepted academic practice. No use, distribution or reproduction is permitted which does not comply with these terms.
*Correspondence: Zhenhua Zhu, emhlbmh1YTc4N0AxNjMuY29t; Hongyu Liu, bGh5OTU0NEAxNjMuY29t
†These authors have contributed equally to this work and share first authorship