 Gaojie He1†
 Jinhui Man1†Ying Chen1Xiaoqin Zhang1Xin Wang1Kelu An1Laha Amu1Wenqin Chen1Baowei Wang1Yue Shi2,3*Xiaohui Wang2,4*
 Shengli Wei1,2*
- 1School of Chinese Materia Medica, Beijing University of Chinese Medicine, Beijing, China
- 2Engineering Research Center of Good Agricultural Practice for Chinese Crude Drugs, Ministry of Education, Beijing, China
- 3School of Biology and Medicine, Beijing City University, Beijing, China
- 4Modern Research Center for Traditional Chinese Medicine, Beijing Institute of Traditional Chinese Medicine, Beijing University of Chinese Medicine, Beijing, China
Introduction: Salvia miltiorrhiza radix et rhizoma (Danshen) is a crucial medicinal material for treating cardiovascular and cerebrovascular diseases. However, the presence of adulterants and intraspecific variability poses challenges to its clinical safety.
Methods: This study collected samples of S. miltiorrhiza from various regions and commonly encountered adulterants. The composition differences of S. miltiorrhiza radix and its adulterants were analyzed by fingerprint and broad-target metabolomics. Chloroplast genome was used to distinguish intra-genus species and DNA barcoding was used to identify germplasm sources.
Results: The fingerprinting analysis proved that there is no chemical composition consistency between S. miltiorrhiza radix and its adulterants. Broad-targeted metabolomics can distinguish S. miltiorrhiza radix from Salvia yunnanensis radix, Dipsacus asperoides radix, and Arctium lappa radix. Additionally, comparative chloroplast genome analysis indicated that atpF and rps4-trnT-UGU were the potential DNA barcodes for S. miltiorrhiza. 259 samples from 13 provinces and 21 origins were amplified and sequenced, resulting in the identification of 62 haplotypes. The unique haplotypes found in Shanxi Luoyang, Shandong Qingdao and other places can be used as molecular geographic markers for the identification of the germplasm source of S. miltiorrhiza.
Discussion: This study systematically differentiates S. miltiorrhiza from its adulterants and highlights the potential of unique haplotypes as markers for sourcing. The findings provide strong scientific evidence for the clinical safety of S. miltiorrhiza, emphasizing the importance of proper cultivation, selection, and breeding of varieties.
1 Introduction
Danshen, the dried roots and rhizomes of Salvia miltiorrhiza. (NationalPharmacopoeiaCommittee, 2020), is widely used in China, the United States and Japan (Cheng, 2006; Pang et al., 2016). It was firstly characterized in Shennong Bencao Jing (200–300 AD, Han Dynasty). The traditional clinical uses of S. miltiorrhiza radix include activating blood circulation and removing blood stasis, nourishing blood and tranquilizing the mind, and cooling blood and dispersing carbuncles. Available studies have shown that diterpenes and phenolic acids have a variety of pharmacological activities, the main components of which include tanshinone ⅡA, cryptotanshinone, salvianolic acid A-E, tanshinol, etc., (Lam et al., 2006; Zhou et al., 2011; Mei et al., 2019). Salvianolic acid from S. miltiorrhiza radix has anti-inflammatory and antioxidant activities, cardioprotective effects, and can be clinically used for the treatment of thrombosis and hypertension (Ho and Hong, 2011; Zhang et al., 2016). Tanshinone has powerful anticancer effects both in vivo and in vitro, and is also used in the treatment and prevention of atherosclerosis and coronary heart disease (Liu et al., 2016; Zhao D. et al., 2016). In addition, S. miltiorrhiza radix is used in the treatment of Alzheimer’s disease as well as neurodegenerative insomnia (Fang et al., 2010; Li et al., 2015).
S. miltiorrhiza radix is widely used in clinics because of its rich pharmacological effects and good pharmacodynamic effects. With the increasing clinical usage of S. miltiorrhiza radix, the cultivation area of S. miltiorrhiza has been expanded and some problems have been highlighted. Studies have shown that the content of active ingredients in S. miltiorrhiza radix is affected by a variety of factors (Su et al., 2015). In the market, some herbs imitate S. miltiorrhiza radix, such as Dipsacus asperoides radix and Arctium lappa radix (Ma et al., 2012; Zhu et al., 2019). Moreover, due to the relatively similar morphology of plants within the Salvia genus, they are also easily confused with S. trijuga radix, S. przewalskii radix, S. digitaloide radix, S. yunnanensis radix, and so on (Pang et al., 2016; Liang et al., 2019), which is not conducive to the safety of clinical use of the drug. S. miltiorrhiza has a wide geographic distribution and a complex environment, resulting in complex intraspecies resources, and the morphology of S. miltiorrhiza plants originating from different regions varies markedly, with variations in traits such as leaf morphology, flower color, and root morphology (Li et al., 2009; Peng et al., 2014). Therefore, S. miltiorrhiza is involved in the complexity of resources among other plant species and within Salvia species, and the efficient identification of S. miltiorrhiza interspecies and intraspecies is of great significance for standardization of S. miltiorrhiza cultivation, clinical application, resource protection, and origin tracing, and is the main direction of the present study to be tackled.
The common identification methods for traditional Chinese medicine (TCM) include morphological, microscopic, physicochemical, chemical fingerprinting, DNA barcoding, chloroplast genomics, and metabolomics methods. The chemical fingerprint analysis of traditional Chinese medicine was proposed by the State Food and Drug Administration (SFDA) in 2000 and has been widely used for the authentication, origin identification, and quality evaluation of Chinese herbal medicines and related preparations. By comparing S. miltiorrhiza radix from different origins and its counterfeit S. przewalskii radix through hierarchical cluster analysis, significant differences could be detected between them. They further selected salvianolic acid B, rosmarinic acid, cryptotanshinone, tanshinone I, and tanshinone IIA as evaluation standards (Zhong G. X. et al., 2009). The fingerprints of 13 batches of S. miltiorrhiza radix were also identified by UPLC combined with chemometric analysis (Luo et al., 2015).
The concept of metabolomics was first introduced by Fiehn et al. (2000). Plant metabolomics has now been widely applied in the field of TCM, including the identification of medicinal materials, quality evaluation, changes before and after processing of medicinal materials, and the effects under stress conditions (Ye et al., 2016; Awin et al., 2019; Mun et al., 2020; Wang C. X. et al., 2021). For example, using untargeted metabolomics, 11 identifying markers were found in 85 samples of Coptidis rhizoma from three different origins, samples from different origins could be successfully differentiated with 100% accuracy (Cao et al., 2021). Similarly, the differential compounds between Chuanwu and processed Chuanwu could be successfully identified by metabolomics methods (Li et al., 2013).
With the development of plant identification research, DNA barcoding technology has emerged, and many scholars have used this technique for molecular-level identification of plants in nature (Wang et al., 2023). Currently, chloroplast genomes have been applied to various aspects such as plant evolutionary analysis, species origin identification, molecular marker development, and genetic diversity analysis, achieving significant scientific results (Liu et al., 2018; Shidhi et al., 2021; Guo et al., 2022). Chloroplast DNA fragments primarily fall into two categories: one includes universal barcodes such as trnH-psbA, matK, and rbcL; the other consists of specifically selected barcodes. Single fragments may not accurately identify all medicinal plants, but multi-gene combinations provide more variable site information, offering higher accuracy in species identification. Moon et al. distinguished Fritillariae Thunbergii and Fritillariae Hupehensis Bulbus and five Fritillaria species using the matK and rps16 genes (Moon et al., 2018).
Each technique has its unique advantages and limitations. The combined application of multiple techniques can not only complement each other but also validate the results obtained. For example, the combination of metabolomics based on ultra-high-performance liquid chromatography-quadrupole time-of-flight mass spectrometry (UHPLC-QTOF-MS) and DNA barcoding methods based on trnH-psbA and ITS2 barcodes has been used to distinguish between S. yangii and S. abrotanoides (Bielecka et al., 2021).
Although some scholars have distinguished S. miltiorrhiza radix and its adulterants (Cao et al., 2021) or S. miltiorrhiza from different regions (Zhong G. X. et al., 2009), the number of samples and geographic scope of the identifications were limited, and only a rough differentiation between S. miltiorrhiza radix and its adulterants or some of the production regions was made. This study employed a combination of methods to systematically distinguish S. miltiorrhiza radix and its adulterants, as well as different origins of S. miltiorrhiza. Specifically, S. miltiorrhiza radix and its adulterants could be distinguished by chemical fingerprints. Three chemical markers were selected by broad-targeted metabolomics to differentiate S. miltiorrhiza radix from different origins. S. miltiorrhiza from its intraspecific species could be differentiated by chloroplast genomes. Finally, by comparing the chloroplast genomes of different origins, specific barcodes atpF and rps4-trnT-UGU were identified, which can be used to identify the germplasm origin of S. miltiorrhiza from different origins.
2 Materials and methods
2.1 Plant materials
The plant samples were collected from different production area by ourselves in 2021–2022, and were identified by Prof. Shengli Wei of the School of Chinese Materia Medica, Beijing University of Chinese Medicine. Among them, the samples used for HPLC fingerprint experiment contain 10 batches of S. miltiorrhiza radix samples from different producing areas, 6 batches of S. yunnanensis radix, 6 batches of S. przewalskii radix, 6 batches of D. asperoides radix, and 5 batches of A. lappa radix (Supplementary Table S1). The samples used for the metabolomics experiment include the roots and rhizomes of ten S. miltiorrhiza and three S. yunnanensis, as well as the roots of three D. asperoides and three A. lappa (Supplementary Table S2). The fresh plant of S. miltiorrhiza samples (Sm01∼Sm09) were collected from different production area and used for the chloroplast genome analysis (Supplementary Table S3). The fresh young leaves collected were quickly dehydrated and dried in silica gel for chloroplast genome DNA extraction. A total of 259 S. miltiorrhiza samples were collected from 21 different production area in 13 provinces and were used for DNA barcoding analysis (Supplementary Table S4).
2.2 HPLC-UV analysis
S. miltiorrhiza radix and its adulterants were crushed to prepare sample solution, and appropriate amount of salvianolic acid B, cryptotanshinone, tanshinone Ⅰ and tanshinone ⅡA were weighed to prepare standard solution. The chromatograph was Shimadzu LC-40D high performance liquid chromatograph. The chromatographic column was Waters XBridge®C18 column (250 mm × 4.6 mm, 5 um) with mobile phase consisting of acetonitrile (A) and 0.1% phosphoric acid water (B). The elution procedure was referred to Zhu et al. (2023): 0 min 80% B, 15 min 74% B, 22 min 60% B, 29 min 53% B, 49 min 37% B, 57 min 31% B, 72 min 10% B, 75 min 10% B. The flow rate was 1 mL·min−1. The detection wavelength was set to 275 nm. The injection volume was 10 μL and the column temperature was set at 20°C.
2.3 Widely targeted metabolomics analysis
The samples of S. miltiorrhiza radix and its adulterants were crushed and extracted for HPLC-MS experiment. The solution to be measured was obtained through 0.22 μm filtration membrane. The mass spectrometer used was the QTRAP 6500 Plus. The parameters were set as follows: ion source temperature was 500°C, spray voltage (IS) was 5500 V (positive mode)/−5500 V (negative mode). Ion source gas I (GS1), gas II (GS2), and curtain gas (CUR) were set at 40, 40, and 25 psi, respectively.
Qualitative analysis of compounds was performed based on the self-built database WT-PMDB from Huada BGI. Skyline software was used for relative quantitative analysis of the data. Analyst 1.6.3 software was used to process mass spectrometry data. MetaboAnalyst (https://www.metaboanalyst.ca/MetaboAnalyst/) was used for principal component analysis (PCA) and partial least squares discriminant analysis (PLS-DA) of the samples to observe sample grouping.
2.4 Chloroplast genome analysis
Total DNA from S. miltiorrhiza leaves was extracted using the E. Z.N.A Plant DNA kit (D3485, OMEGA, United States). The quality of the extracted DNA was evaluated by 1.0% agarose gel electrophoresis, and the DNA concentration and purity were determined using a NanoDrop micro-spectrophotometer (Thermo Scientific, United States). Sequencing was performed using the Illumina sequencing platform.
The annotated chloroplast genome of S. miltiorrhiza (GenBank accession number: JX312195.1) available in the NCBI database was used as a reference. The raw sequences obtained after sequencing were quality checked using FastQC, and Trimmomatic software was used to filter out adapter sequences and low-quality regions. NOVOPlasty was used to assemble the raw reads into complete chloroplast genomes. BWA was used to align high-quality reads back to the chloroplast genome sequence, and manual inspection was performed in IGV to ensure accurate assembly. The complete chloroplast genome sequence was annotated using CPGAVAS software, and tRNA genes were identified and manually corrected using tRNAscan-SE software. The chloroplast genome map was drawn online using Organellar Genome DRAW (http://ogdraw.mpimp-golm.mpg.de/cgi-bin/ogdraw.pl).
Long repeat sequences in the chloroplast genome were analyzed using the online software REPuter (http://bibiserv.techfak.uni-bielefeld.de/reputer/) with parameters set to Hamming distance of 3, maximum computed repeats of 5,000, and minimal repeat size of 30. Simple sequence repeat (SSR) sequences in the chloroplast genome were analyzed using the online software MISA (http://pgrc.ipk-gatersleben.de/misa/) with threshold parameters set to 1, 2, 3, 4, 5, and 6, and nucleotide parameters set to 10, 5, 4, 3, 3, and 3, respectively. The minimum distance between two SSRs was set to 100 bp. Tandem repeat sequences were detected using the Tandem Repeats Finder software (https://tandem.bu.edu/trf/trf.html) with default settings.
A phylogenetic tree was constructed using 24 chloroplast genome sequences from 22 species of the Salvia genus published on NCBI (Supplementary Table S5) and the nine chloroplast genome sequences of S. miltiorrhiza obtained in this study. The chloroplast genome sequences of 23 species were aligned using the online software MAFFT 7 (https://mafft.cbrc.jp/alignment/server/), and the aligned sequences were imported into MEGA X software. The neighbor-joining (NJ) method was used to construct the phylogenetic tree, with bootstrap set to 1,000.
2.5 Identification of specific S. miltiorrhiza DNA barcodes
The chloroplast genome of S. miltiorrhiza was aligned using the mVISTA online tool (http://genome.lbl.gov/vista/index.shtml) with the shuffle-LAGAN mode. Multi-sequence alignment analysis of gene regions and intergenic regions of the nine chloroplast genomes of S. miltiorrhiza was performed using ClustalX software to observe the number of different chloroplast genomes that can be distinguished by different sequences and their similarity.
Based on the selected sequences, two fragment-specific primers were designed using Primer 5 software (Supplementary Table S6) for amplification of samples from different origins of S. miltiorrhiza. The total PCR reaction volume was 50 μL, including 5 µL of 10 × Taq buffer, 4 µL of dNTP Mix (2.5 mmol·L−1), 1 μL of 0.1% BSA, 1 µL of Taq DNA polymerase (2.5 U·µL-1), 2 µL of 10 µmol primer, and ddH2O up to 50 µL.
The PCR amplification procedures included predenaturation at 94°C for 5 min, 94°C denaturation for 30, renaturation for 30 s (atpF annealing temperature of 51.3°C and rps4-trnT-UGU annealing temperature of 54.2°C), and 72°C for 1 min (35 cycles); a 72°C extension for 10 min; and storage at 4°C.
The amplified PCR products were analyzed by 1% agarose gel electrophoresis. The amplification results were observed under UV light. The gel containing the target DNA bands was excised quickly. The gel-purified PCR products were recovered and purified using the Vazyme PCR product recovery kit. The purified products were sent to Beijing Liuhe Huada Genomics Institute for bidirectional sequencing.
The sequences were manually checked and edited using Chromas software, assembled using Contig Express, and low-quality sequences were removed. The assembled sequences were imported into DNAMAN 9.0 for alignment analysis. DnaSP software was used to calculate the number of segregating sites (S), the number of haplotypes (h), haplotype diversity (hd), and nucleotide diversity (Pi) for S. miltiorrhiza populations. ArcMap was employed to construct haplotype geographic distribution maps. MEGAX was used to calculate genetic distances for combined analysis fragments, and a neighbor-joining method was applied to construct haplotype phylogenetic trees.
3 Results
3.1 HPLC fingerprint analysis could identify S. miltiorrhiza radix and the adulterants
To identify S. miltiorrhiza radix and the adulterants, we first performed HPLC fingerprint analysis. The separation degree of the four components specified in the 2020 edition of the Chinese Pharmacopoeia had met the requirements (Figure 1A). The chromatographic peaks of the four standard components contained in the sample solution were identified, where peak 1 corresponded to salvianolic acid B, peak 2 corresponded to cryptotanshinone, peak 3 corresponded to tanshinone I, and peak 4 corresponded to tanshinone IIA. The chromatographic fingerprints of 10 batches of S. miltiorrhiza radix from different origins were imported into the Chinese Medicine Chromatographic Fingerprint Similarity Evaluation System (2012 Edition) software. Using the chromatographic profile of S3 S. miltiorrhiza radix as the reference fingerprint, multi-point correction was applied to match the chromatographic profiles of the 10 batches of S. miltiorrhiza radix. Finally, 10 common peaks were determined, and a reference chromatogram was generated using the median method (Figure 1B). Among them, peak 3 corresponded to salvianolic acid B, peak 7 corresponded to cryptotanshinone, peak 8 corresponded to tanshinone I, and peak 10 corresponded to tanshinone IIA. The methodological investigation experiments showed that the instrument precision, method reproducibility and sample stability were good.
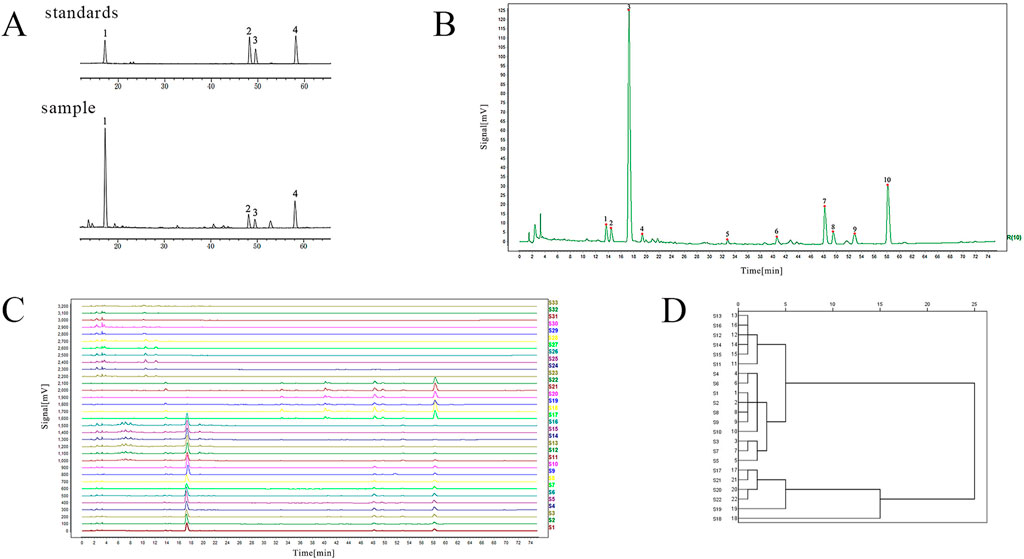
Figure 1. The HPLC fingerprint of S. miltiorrhiza radix and its adulterants. (A) The peak charts of the standard and sample solutions (1: salvianolic acid B; 2: cryptotanshinone; 3: tanshinone I; 4: tanshinone IIA). (B) The chromatogram of ten common peaks of S. miltiorrhiza radix. (C) HPLC fingerprints of S. miltiorrhiza radix and its adulterants (S. miltiorrhiza radix: S1∼S10; S. yunnanensis radix: S11∼S16; S. przewalskii radix: S17∼S22; D. asperoides radix: S23∼S28; A. lappa radix: S29∼S33). (D) Systematic clustering dendrogram of four components of S. miltiorrhiza radix.
All obtained batch samples were imported into the Traditional Chinese Medicine Chromatographic Fingerprint Similarity Evaluation System workstation to obtain a comprehensive fingerprint map containing 10 batches of S. miltiorrhiza radix, 6 batches each of S. yunnanensis radix, S. przewalskii radix, D. asperoides radix, and 5 batches of A. lappa radix (Figure 1C). The fingerprint spectra of multiple batches showed significant differences between S. miltiorrhiza radix (S1-S10) and D. asperoides radix (S23-S28) and A. lappa radix (S29-S33), indicating that S. miltiorrhiza radix has many different chemical components from the latter two. However, the peak shapes of S. miltiorrhiza radix (S1-S10) were more similar to those of S. yunnanensis radix (S11-S16) and S. przewalskii radix (S17-S22), suggesting that they share more similar chemical components. From 4 to 10 min, S. yunnanensis radix exhibited more chromatographic peaks than S. miltiorrhiza radix. From 46 to 60 min, the overall peak area of S. yunnanensis radix was lower than that of S. miltiorrhiza radix, indicating that S. yunnanensis radix contains more water-soluble components, but S. miltiorrhiza radix contains richer tanshinones compounds. Compared to S. przewalskii radix, S. miltiorrhiza radix showed more chemical components with larger peak areas from 12 to 24 min. From 30 to 60 min, S. przewalskii radix had more components eluted, and the overall peak area of the three tanshinones components (tanshinone IIA, cryptotanshinone, and tanshinone I) was larger than that of S. miltiorrhiza radix, indicating that S. przewalskii radix contains more lipophilic components and fewer water-soluble components than S. miltiorrhiza radix.
The intra-group similarity of fingerprint profiles was calculated for S. miltiorrhiza radix, S. yunnanensis radix, S. przewalskii radix, D. asperoides radix and A. lappa radix, respectively. Using S3 as the standard reference chromatogram for S. miltiorrhiza radix, the intra-group similarity of 10 batches of S. miltiorrhiza radix is shown in Supplementary Table S7. The similarity between each batch and the reference chromatogram was greater than 0.9700, indicating good intra-group similarity. The similarity among samples from different regions of S. miltiorrhiza radix was greater than 0.9300, indicating good consistency within the group. Using S11 as the standard reference chromatogram for S. yunnanensis radix, the intra-group similarity of S. yunnanensis radix was analyzed (Supplementary Table S8). All samples showed high similarity with the reference chromatogram, with a similarity greater than 0.9900, and the similarity among different samples was also higher than 0.9900, indicating good consistency within the group. Using S17 as the standard reference chromatogram for S. przewalskii radix, the intra-group similarity of S. przewalskii radix was analyzed (Supplementary Table S9). The similarity of all samples with the reference chromatogram was greater than or equal to 0.9900, and the similarity among different samples was greater than 0.9700, indicating good consistency within the group. Using S23 as the standard reference chromatogram for D. asperoides radix, the intra-group similarity of D. asperoides radix was analyzed (Supplementary Table S10). The similarity of all samples with the reference chromatogram was greater than 0.9200, and the similarity among different samples was also greater than 0.8000, indicating good consistency within the group. Using S29 as the standard reference chromatogram for A. lappa radix, the intra-group similarity of A. lappa radix was analyzed (Supplementary Table S11). The similarity of all samples with the reference chromatogram was not less than 0.8900, and except for the similarity between S33 and S31, which was 0.7820, the similarity among different batches was greater than 0.8300, indicating good consistency within the group.
The content determination indicators specified in the 2020 edition of the Chinese Pharmacopoeia, including salvianolic acid B, cryptotanshinone, tanshinone I, and tanshinone IIA, were selected as analytical variables. System clustering was performed based on the peak areas of these four components in S. miltiorrhiza radix, S. yunnanensis radix, and S. przewalskii radix. The results show that the clustering can be broadly categorized into three groups: S. miltiorrhiza radix, S. yunnanensis radix, and S. przewalskii radix (Figure 1D). This suggests that there is no consistency among these three herbs in terms of the four selected chemical components used for systematic clustering.
3.2 Metabolomic could distinguish different origins of S. miltiorrhiza radix and the adulterants
Based on ten samples of S. miltiorrhiza radix from different origins and three samples each of S. yunnanensis radix, D. asperoides radix and A. lappa radix, a broad-targeted metabolomic analysis was conducted to detect and analyze metabolites. A total of 387 compounds were detected, including flavonoids, amino acids and derivatives, organic acids, terpenes, and other primary and secondary metabolites (Supplementary Table S12). The PCA score plot shows that the data from different species fall within their respective confidence intervals (Figure 2A). The model had an R2 value of 0.9910 and a p value of 0.0010, indicating a good model with reliable predictions. The species are clearly separated from each other and relatively clustered within their own groups, indicating different metabolic patterns among S. miltiorrhiza radix, D. asperoides radix, A. lappa radix, and S. yunnanensis radix. To further elucidate these differences, a supervised analysis method, PLS-DA, was used to analyze the data of the four species. The model had an R2 value of 0.8970 and a Q2 value of 0.6700, indicating a good model with reliable predictions. The results show that S. miltiorrhiza radix, D. asperoides radix, A. lappa radix, and S. yunnanensis radix can be clearly distinguished (Figure 2B). Using fold change values and variable importance in the projection (VIP) from the PLS-DA model as selection criteria (fold change >2, VIP >1.5) (Supplementary Tables S13, S14), differential metabolites between samples were screened. Finally, five differential compounds were selected, namely Hederacoside C, Cardamoni, Emodin, Eriodictyol, and Honokiol (Figure 2C). These five differential compounds are predominantly present in S. miltiorrhiza radix and can be used to differentiate it from D. asperoides radix, A. lappa radix, and S. yunnanensis radix.
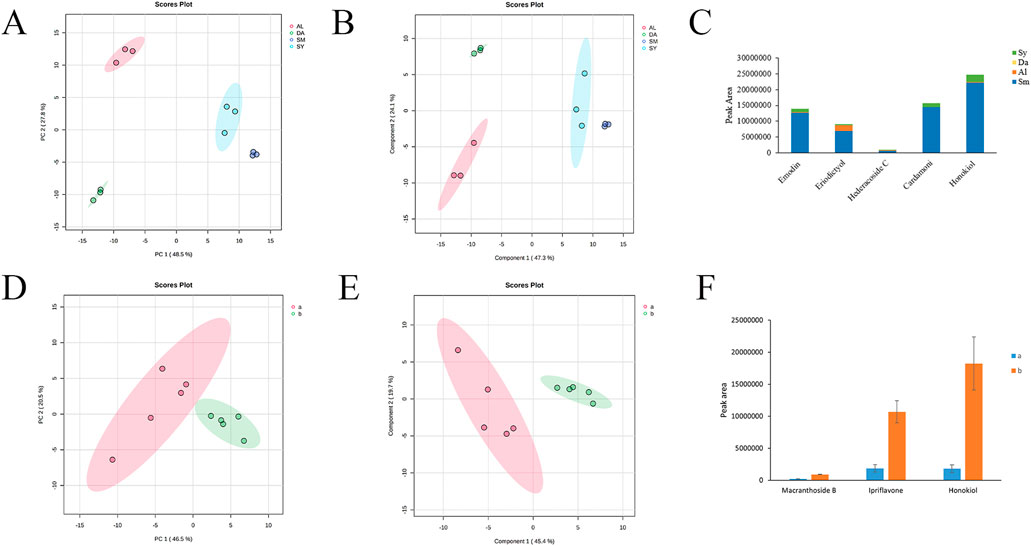
Figure 2. Broad-Targeted metabolomic analysis of S. miltiorrhiza radix and its adulterants. (A) PCA scores of S. miltiorrhiza radix, D. asperoides radix, A. lappa radix and S. yunnanensis radix (SM: S. miltiorrhiza; AL: A. lappa radix; DA: D. asperoides radix; SY: S. yunnanensis radix). (B) PLS-DA scores of S. miltiorrhiza radix, D. asperoides radix, A. lappa radix and S. yunnanensis radix (SM: S. miltiorrhiza radix; AL: A. lappa radix; DA: D. asperoides radix; SY: S. yunnanensis radix). (C) Peak areas of differential metabolites of S. miltiorrhiza radix and its adulterants (Sm: S. miltiorrhiza radix; Al: A. lappa radix; Da: D. asperoides radix; Sy: S. yunnanensis radix). (D) PCA scores of S. miltiorrhiza radix from different origins (a: Sichuan, Shanxi, Hebei, Henan, Shaanxi; b: Anhui, Jiangxi, Liaoning, Shandong, Gansu). (E) PLS-DA scores of S. miltiorrhiza radix from different origins (a: Sichuan, Shanxi, Hebei, Henan, Shaanxi; b: Anhui, Jiangxi, Liaoning, Shandong, Gansu). (F) Relative peak area share of different compounds of S. miltiorrhiza radix from different origins (a: Sichuan, Shanxi, Hebei, Henan, Shaanxi; b: Anhui, Jiangxi, Liaoning, Shandong, Gansu).
The broad-targeted metabolomic data of S. miltiorrhiza radix from ten different origins were subjected to PCA analysis. The model had an R2 value of 0.5560 and a p value of 0.0090. As shown in Figure 2D, the samples from ten production areas of S. miltiorrhiza radix were divided into two main clusters. Cluster a includes samples from Sichuan, Shanxi, Hebei, Henan, and Shaanxi, while Cluster b includes samples from Anhui, Jiangxi, Liaoning, Shandong, and Gansu. This suggests that samples from similar geographical regions of S. miltiorrhiza radix share similar chemical compositions. PLS-DA analysis was performed on the samples from ten production areas of S. miltiorrhiza radix. The model had an R2 value of 0.9970 and a Q2 value of 0.8710. The significant differences between the two groups of samples can be observed from Figure 2E, suggesting that there may be distinct differences in metabolites between S. miltiorrhiza radix from Sichuan, Shanxi, Hebei, Henan, and Shaanxi, and those from Anhui, Jiangxi, Liaoning, Shandong, and Gansu. Using fold change values and VIP from the PLS-DA model as selection criteria (fold change, VIP >2) (Supplementary Tables S15, S16), three differential metabolites were selected between samples. These metabolites are Ipriflavone, Macranthoside B, and Honokiol. Overall, the content of these three differential compounds is higher in samples from Anhui, Jiangxi, Liaoning, Shandong, and Gansu production areas (Figure 2F). These three compounds can serve as biomarkers for distinguishing S. miltiorrhiza radix from different production areas.
3.3 Chloroplast genome and phylogenetic tree for identification within the genus
The chloroplast genomes of S. miltiorrhiza from different origins were assembled, annotated, and analyzed. The results (Supplementary Table S17; Figure 3) showed that the total length of the chloroplast genome sequences from nine different origins of S. miltiorrhiza ranged from 151,371 to 151,589 bp, which is similar to other angiosperms and exhibits a typical circular quadripartite structure. The length of the large single copy region (LSC) ranged from 82,753 to 82,841 bp (36.10%–36.14%), the small single copy region (SSC) ranged from 17,572 to 17,591 bp (31.98%–32.05%), and the inverted repeat regions (IRs) ranged from 25,521 to 25,590 bp (43.10%–43.14%). These findings provide insights into the chloroplast genome features of S. miltiorrhiza and lay the foundation for further phylogenetic analyses.
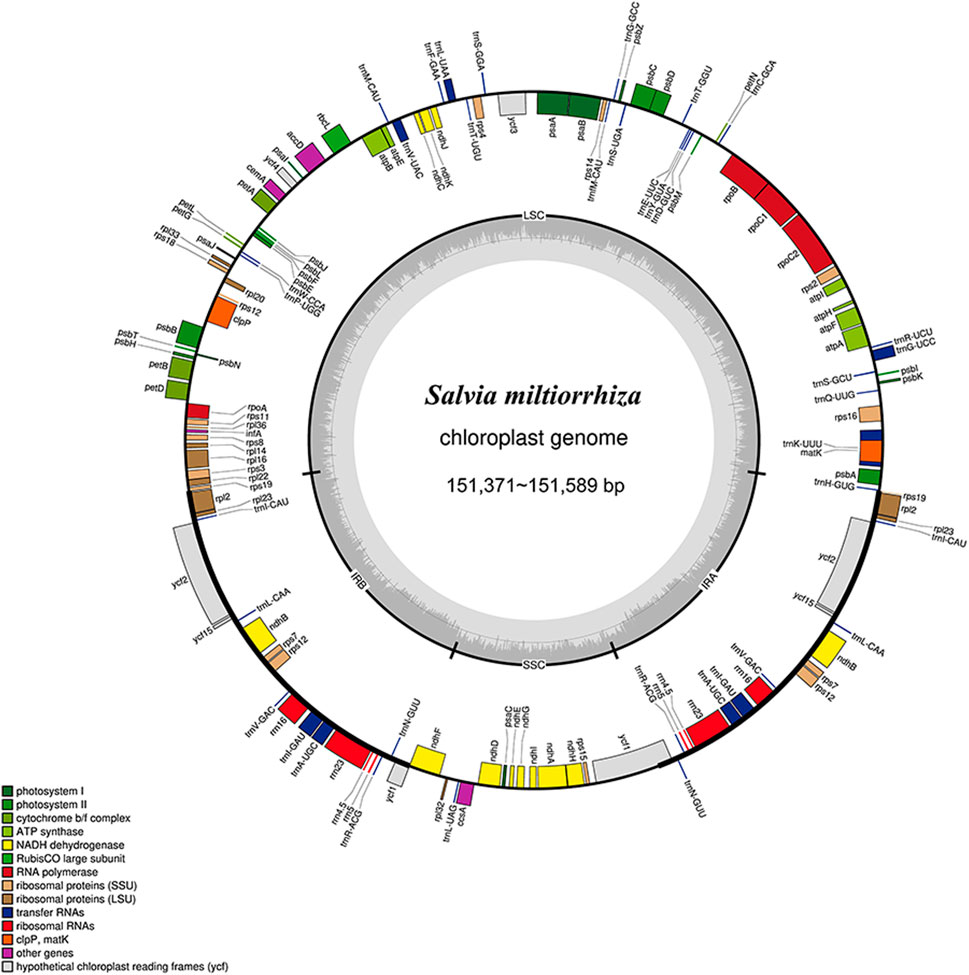
Figure 3. Chloroplast genome map of S. miltiorrhiza. Thick lines indicate the extent of the inverted repeat regions (Ira and Irb), which separate the genome into small (SSC) and large (LSC) single copy regions. Genes drawn inside the circle are transcribed clockwise, and those outside are transcribed counterclockwise. Different colors represent different functional groups of genes.
The chloroplast genomes of S. miltiorrhiza from nine different origins have consistent gene numbers (Supplementary Table S18), each containing 132 genes (including 18 repeated genes), consisting of 87 protein-coding genes (CDS), 37 tRNA genes, and 8 rRNA genes. These genes can be classified into 4 major categories and 18 subcategories based on their functions: genes related to photosynthesis and self-replication are relatively abundant, while other genes and those with unknown functions are generally less represented. Among these genes, 18 different genes contain introns, with 15 genes containing a single intron and 3 protein-coding genes containing 2 introns (ycf3, clpP, rps12). The genes ndhB, rpl2, rpl23, rps12, rps7, rrn16, rrn23, rrn4.5, rrn5, trnA-UGC, trnI-CAU, trnI-GAU, trnL-CAA, trnN-GUU, trnR-ACG, trnV-GAC, ycf15, and ycf2 are located in the inverted repeat regions, with each gene having a duplicate. The results of REPuter long repeat sequence analysis showed that the nine S. miltiorrhiza chloroplast genomes had 43∼55 long repeat sequences, and forward and palindromic repeats were the more abundant types, with 21∼26 forward repeats, 22∼26 palindromic repeats, and 0 reverse and complementary repeats (Supplementary Table S19). Most of the repeats were in the range of 30∼39 bp in length, followed by 40∼49 bp. The number of tandem repeat sequences in nine S. miltiorrhiza chloroplast genomes was 14∼23. Simple repeat sequence analysis of different S. miltiorrhiza chloroplast genomes by MISA showed that there were 40∼49 SSRs in nine S. miltiorrhiza chloroplast genomes, and a total of 407 SSRs were identified, which were mainly single-nucleotide repeats with the repeat type of A/T, followed by tetranucleotide repeats with the repeat types of AAAC/GTTT, AAAG/CTTT, AAAT/ATTT, AATT/AATT, ACAG/CTGT, followed by dinucleotide repeats as AG/CT, AT/AT repeats, and a smaller number of pentanucleotide AATAT/ATATATT and hexanucleotide AAGATC/ATCTTG, AAGTCT/ACTTAG repeats, with no trinucleotide repeats identified (Figure 4A).
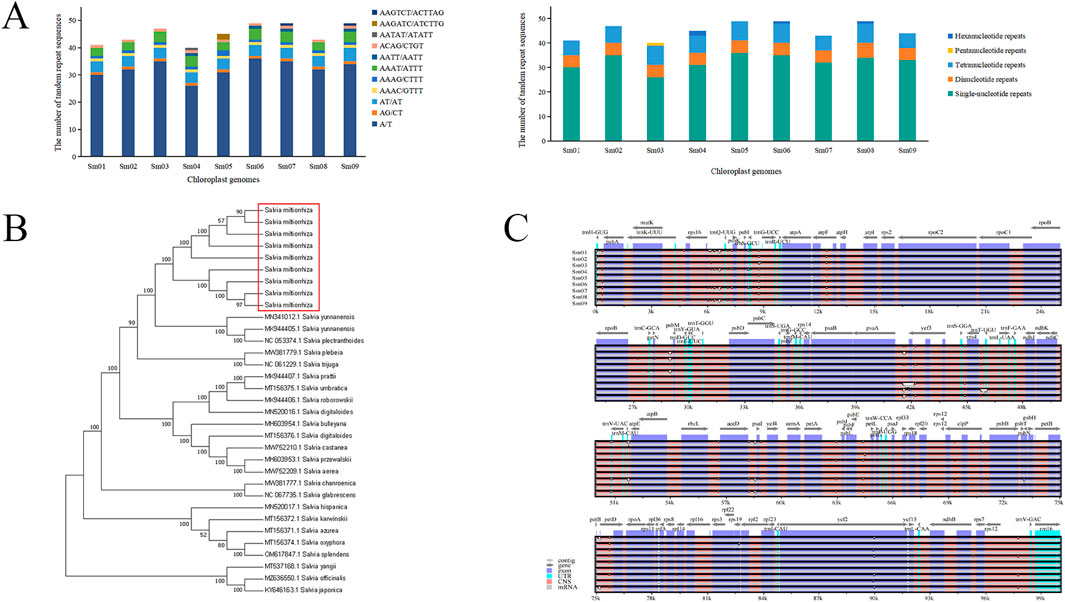
Figure 4. S. miltiorrhiza chloroplast genomes analysis. (A) The number of different types of simple repeat sequences in different chloroplast genomes (left) and the number of different repeat types in different chloroplast genomes (right). (B) Phylogenetic tree of 33 chloroplast genomes in the Salvia species. (C) Intraspecific global comparison of nine S. miltiorrhiza chloroplast genomes.
24 annotated chloroplast genomes of Salvia species from NCBI, along with the 9 chloroplast genomes of S. miltiorrhiza sequenced in this study, were used to construct a NJ phylogenetic tree. The results (Figure 4B) showed that the 9 chloroplast genomes of S. miltiorrhiza formed a single branch, with 100% support, clustering with S. yunnanensis and S. plectranthoides, indicating a close relationship between S. miltiorrhiza and the two species. The phylogenetic tree revealed that chloroplast genomes could be used for identification of S. miltiorrhiza and other species within the Salvia genus, achieving intragenus discrimination of S. miltiorrhiza.
3.4 Identification of S. miltiorrhiza germplasm resources based on specific DNA barcodes
Using the annotated chloroplast genome of S. miltiorrhiza as a reference, nine chloroplast genomes from different origins of S. miltiorrhiza were compared intraspecifically using the mVISTA online software (Figure 4C). The results showed that variation within S. miltiorrhiza was relatively conservative, with larger variations observed in intergenic regions compared to coding regions. Regions such as rps16-trnQ-UUG, atpF, ycf3, rps4-trnT-UGU, accD-psaI, petB-petD, and clpP exhibited greater variability compared to other genes or intergenic regions. Analysis of the nine chloroplast genomes of S. miltiorrhiza using ClustalX software revealed that the sequences of ndhF, atpF, ycf3, clpP, rpl32, rps7-ndhB, atpA-atpF, trnS-GCU-trnG-UCC, rrn4.5-rrn5, trnG-GCC-trnfM-CAU, petB-petD, psbI-trnS-GCU, rps16-trnQ-UUG, rps8-to-rpl14, and rps4-trnT-UGU could distinguish the nine chloroplast genomes with low sequence similarity (Supplementary Table S20). Combining the analysis results from mVISTA, rps16-trnQ-UUG, atpF, ycf3, rps4-trnT-UGU, petB-petD, and clpP could be preliminary candidates for DNA barcoding of S. miltiorrhiza.
Based on the previous data analysis results, fragments with a length range of 300–1,300 bp, containing a high number of variable sites, and with relatively high amplification efficiency were further selected. The atpF and rps4-trnT-UGU fragments were ultimately chosen as the research fragments, and specific primers were designed. DNA extraction, PCR amplification, product purification, and sequence comparison were conducted for 259 samples from 21 different production areas in 13 provinces and cities. The experiment showed that the two selected specific fragments could efficiently amplify 259 samples of S. miltiorrhiza from different production areas, with amplification efficiencies of 98.0% (atpF) and 92.7% (rps4-trnT-UGU), respectively. Both fragments successfully amplified a total of 235 samples (Supplementary Figure S1).
After alignment, the length of the atpF sequence was determined to be 977 bp, producing a total of 35 variable sites upon sequencing. There were 23 insertion/deletion sites (251∼257 bp, 339∼344 bp, 441 bp, 404∼408 bp, 536∼538 bp, 605 bp), accounting for 65.7% of the variations. There were 12 nucleotide substitutions (56 bp, 280 bp, 308 bp, 405 bp, 411 bp, 455 bp, 517 bp, 687 bp, 745 bp, 809 bp, 901 bp, 929 bp), accounting for 34.3% (Supplementary Table S21). Thus, a total of 34 haplotypes were formed, named aHap1∼aHap34. The length of the rps4-trnT-UGU sequence after alignment was 407 bp, and analysis revealed 57 variable sites upon sequencing. Among them, there were 50 insertion/deletion sites (53∼57 bp, 101∼107 bp, 150∼167 bp, 221∼240 bp), accounting for 87.7% of the variations. There were 7 nucleotide substitutions (80 bp, 184 bp, 213 bp, 245 bp, 250 bp, 277 bp, 286 bp), accounting for 12.3% (Supplementary Table S22). Thus, 22 haplotypes were formed, named rHap1∼rHap22.
The length variation in both atpF and rps4-trnT-UGU sequences was mainly caused by insertion and deletion of bases. Upon combined analysis of the two fragments, a total of 62 haplotypes were formed among the 235 samples, named Hap1∼Hap62. Among them, Hap37 was the predominant haplotype, found in 25 samples distributed in Shanxi Yuncheng, Shanxi Linfen, Henan Nanyang, Henan Luoyang, and Gansu Qingyang, accounting for 11%. Haplotypes with frequencies higher than 5% included Hap16, Hap42, Hap10, Hap12, and Hap18, while the rest were relatively less abundant (Figure 5A).
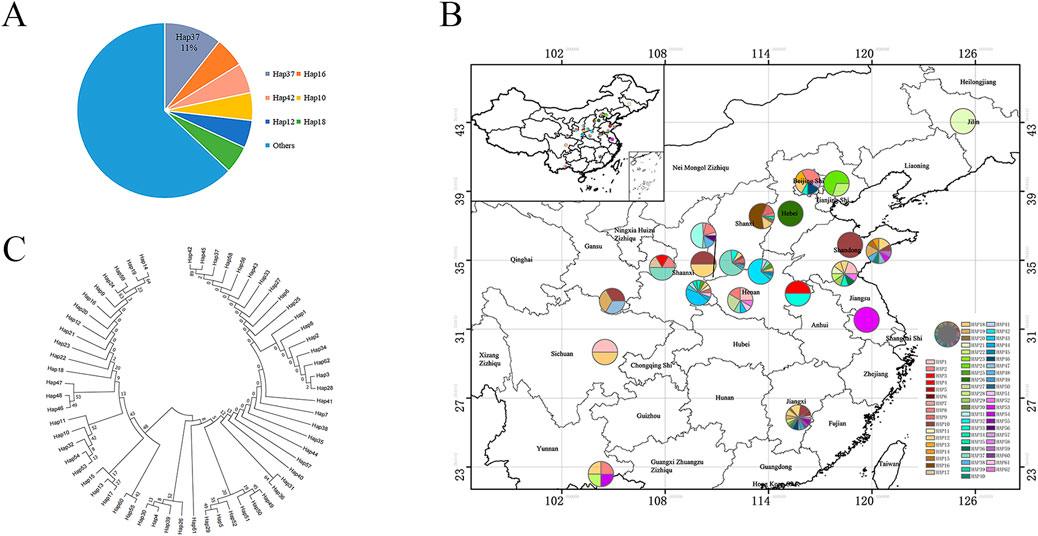
Figure 5. S. miltiorrhiza haplotype analysis. (A) Percentage of joint haplotypes. (B) Geographic distribution of S. miltiorrhiza joint sequence frequencies. (C) Phylogenetic tree of 62 joint haplotypes of S. miltiorrhiza.
The distribution of these 62 haplotypes in different regions was statistically analyzed (Supplementary Table S23). Results revealed that AHBZ (Anhui Bozhou), HBBD (Hebei Baoding), HNLY (Henan Luoyang), and YNWS (Yunnan Wenshan) each possessed a unique haplotype, namely Hap3, Hap26, Hap45, and Hap54, respectively. SDQD (Shandong Qingdao), GSQY (Gansu Qingyang), BJHR (Beijing Huairou), BJMY (Beijing Miyun), and SXLF (Shanxi Linfen) each had two unique haplotypes. HBSJZ (Hebei Shijiazhuang), SDLY (Shandong Linyi), and SXYC (Shanxi Yuncheng) had three unique haplotypes each. HNNY (Henan Nanyang) and SXSL (Shaanxi Shangluo) had four unique haplotypes each. JXGZ (Jiangxi Ganzhou) had 10 unique haplotypes. In total, 19 unique haplotypes were distributed among the populations, indicating rich haplotype diversity. These region-specific haplotypes can be used as DNA barcode markers for regional identification, facilitating the identification of geographical origins.
3.5 S. miltiorrhiza has rich genetic diversity and small genetic differences
To create the geographic distribution frequency map of the 62 haplotypes using ArcMap, locations like Changchun in Jilin, Weifang in Shandong, Baoding in Hebei, and Yangzhou in Jiangsu each have one haplotype, indicating relatively pure haplotypes (Figure 5B). There are three populations with 10 or more haplotypes: Qingdao in Shandong with 10 haplotypes, Shangluo in Shaanxi with 11 haplotypes, and Ganzhou in Jiangxi with 19 haplotypes, indicating high genetic diversity in these areas. Among the 62 haplotypes, there are 21 shared haplotypes. The most widely distributed shared haplotype is Hap18, found in seven different locations including Shijiazhuang in Hebei, Deyang in Sichuan, Ganzhou in Jiangxi, Shangluo in Shaanxi, Linyi in Shandong, Huairou in Beijing, and Luoyang in Henan. The next most widespread haplotype is Hap10, found in six locations including Qingdao in Shandong, Linfen in Shanxi, Ganzhou in Jiangxi, Weifang in Shandong, Weinan in Shaanxi, and Longnan in Gansu.
Using DnaSP software, genetic diversity parameters of the chloroplast gene combined analysis fragment of S. miltiorrhiza were calculated (Supplementary Table S24). The range of haplotype diversity (hd) among the 21 populations of S. miltiorrhiza varied from 0 to 1, nucleotide diversity (Pi) ranged from 0 to 4.5200, the number of segregating sites (S) ranged from 0 to 11, and the number of haplotypes (h) ranged from 1 to 10. These results indicate that different geographical regions of S. miltiorrhiza exhibit differences in genetic diversity. The population JXGZ (Jiangxi Ganzhou) harbored the richest variation in haplotype number and segregating sites, with 11 and 10, respectively. The population BJMY (Beijing Miyun) had the highest hd and Pi values, reaching 1 and 4.52, respectively. Overall, the 21 populations exhibited relatively high genetic diversity, with 71.43% of populations having hd > 0.5.
Genetic distances were calculated for the 62 haplotypes obtained from the combined analysis. The average genetic distance among the 62 haplotypes was 0.0023, ranging from 0.0000 to 0.0054. Hap42 and Hap45 exhibited the largest genetic distance of 0.00536 with Hap24, Hap59, Hap10, Hap32, Hap53, and Hap54. Overall, the genetic distances among the haplotypes were small, indicating minor genetic differences between them. A phylogenetic tree of the 62 combined haplotypes of S. miltiorrhiza was constructed using MEGAX software (Figure 5C). It can be observed that the 62 haplotypes have close genetic relationships with each other, with small genetic distances between them. The predominant haplotype, Hap37, is closely related to Hap42 and Hap45.
4 Discussion
The correct origin of traditional Chinese medicine (TCM) germplasm is a crucial guarantee for the safety and effectiveness of clinical medication. Due to the adulteration by unscrupulous merchants and the similarity of S. miltiorrhiza to other species of the same genus, the germplasm resources of S. miltiorrhiza have become confused, affecting clinical efficacy (Li et al., 2009; Zhu et al., 2019). Therefore, it is essential to study the quality consistency of S. miltiorrhiza and its adulterants, as well as the germplasm identification of S. miltiorrhiza.
The chemical fingerprint of TCM is a comprehensive and quantifiable spectrum obtained from the determination of the complex chemical components in TCM. It is a commonly used method for evaluating the consistency of TCM quality (Zhong X. K. et al., 2009; Liang et al., 2010). In this study, the fingerprints of S. miltiorrhiza radix and its adulterants S. yunnanensis radix, S. przewalskii radix, D. asperoides radix and the A. lappa radix were determined. The results showed that significant differences in peak shapes between S. miltiorrhiza radix and D. asperoides radix, and the A. lappa radix, suggesting many different chemical components between S. miltiorrhiza radix and these two, indicating no quality consistency and allowing differentiation through chemical fingerprints (Figure1C). The spectra of S. miltiorrhiza radix, S. yunnanensis radix, and S. przewalskii radix were more similar, indicating many similar chemical components, making differentiation more challenging. However, our study found that compared to S. miltiorrhiza radix, the content of tanshinones was lower in S. yunnanensis radix, while S. przewalskii radix had a higher content of tanshinone components. Other studies in recent years have reached similar conclusions. The fingerprints of lipophilic component fingerprints of 16 batches of S. miltiorrhiza radix and 18 batches of S. yunnanensis radix were compared and found to be somewhat similar, but the contents of the main active components (Cryptotanshinone, Tanshinone I, and Tanshinone IIA) were significantly lower in S. yunnanensis radix (Zhang et al., 2019). Similarly, the identification of S. miltiorrhiza radix and S. yunnanensis radix using NIR, UHPLC, and LC-MS-MS revealed significant differences in the content of lipophilic constituents between the two (Ni et al., 2019). Further clustering analysis of the four components (Salvianolic acid B, Tanshinone I, Tanshinone IIA, and Cryptotanshinone) under the content determination items of S. miltiorrhiza radix in the 2020 edition of the “Chinese Pharmacopoeia” showed that S. miltiorrhiza radix, S. yunnanensis radix, and S. przewalskii radix can be clustered into a single branch separately, indicating inconsistency in these four chemical components. Therefore, identifying S. miltiorrhiza radix and its adulterants such as S. yunnanensis radix, S. przewalskii radix, D. asperoides radix and the A. lappa radix is essential for market regulation and clinical application, and research on the identification of TCM and its adulterants should be strengthened.
Fingerprinting and clustering analysis indicate that S. miltiorrhiza radix and its common adulterants are not interchangeable, highlighting the importance of distinguishing S. miltiorrhiza radix from its adulterants. Therefore, this study further measured the metabolites of S. miltiorrhiza radix and its common adulterants using widely targeted metabolomics technology. Metabolomics is divided into targeted metabolomics, untargeted metabolomics, and a new integrated method—widely targeted metabolomics (Chen et al., 2013). The widely targeted metabolomics technology, based on liquid chromatography-mass spectrometry (LC-MS) and/or gas chromatography-mass spectrometry (GC-MS), combines the precision of targeted analysis with the broadness of untargeted analysis and is widely used in the study of plant secondary metabolism (Yuan et al., 2022). Zhou et al. compared widely targeted metabolomics and untargeted metabolomics of wild Ophiocordyceps sinensis, identifying 778 and 1,449 metabolites, respectively. Untargeted metabolomics can rapidly classify samples and obtain more comprehensive metabolic information, while widely targeted metabolomics can focus on specific metabolites related to particular metabolic pathways for quality assessment and metabolite identification (Zhou et al., 2022). Currently, only a few scholars have conducted metabolomic studies on S. miltiorrhiza radix and its related species. Zhao et al. used LC/MS technology to analyze the metabolomics of different genotypes and growing environments of S. miltiorrhiza radix, finding significant metabolic differences among the same genotype of S. miltiorrhiza radix grown in three different locations and three genotypes grown in the same location, and identified 16 and 14 secondary metabolites as specific markers for different growing locations and genotypes of S. miltiorrhiza radix, respectively (Zhao Q. et al., 2016). In one study, metabolomic analysis of S. miltiorrhiza and S. prattii seeds, combined with differences in their antioxidant activities, revealed that the differential compounds included flavonoids and terpenoids (Xia et al., 2023). This study added species outside the genus Salvia, D. asperoides radix and the A. lappa radix, to the analysis of S. miltiorrhiza radix and its common adulterants. PCA and PLS-DA analysis revealed chemical differences consistent with previous research, and identified five differential compounds: Hederacoside C, Cardamoni, Emodin, Eriodictyol, and Honokiol, all of which had the highest content in S. miltiorrhiza radix. Meanwhile, this study applied widely targeted metabolomics technology to chemically determine S. miltiorrhiza radix from ten different regions: Sichuan, Hebei, Shandong, Shanxi, Anhui, Gansu, Henan, Jiangxi, Shaanxi, and Liaoning. PCA and PLS-DA analysis showed that the ten regions could be clearly divided into two groups, with Group a including samples from five origins, namely, Sichuan, Shanxi, Hebei, Henan, and Shaanxi, and Group b including samples from the origins of Anhui, Jiangxi, Liaoning, Shandong, and Gansu. Ipriflavone, Macranthoside B, and Honokiol were identified as differential components, with higher overall contents in S. miltiorrhiza radix samples from Group b. These three compounds can serve as chemical markers to distinguish different regions of S. miltiorrhiza radix. The differential compounds identified between S. miltiorrhiza radix and its adulterants, as well as between different regions of S. miltiorrhiza radix, can preliminarily distinguish the origins of S. miltiorrhiza radix and differentiate it from its adulterants, providing a theoretical reference for the identification of other TCM materials.
In addition to chemical identification, molecular-level identification techniques are increasingly developing. With advancements in chloroplast genomics research, the chloroplast genomes of various medicinal plants such as Atractylodes, Styrax, and Artemisia annua have been revealed. The entire chloroplast genome evidently contains more informative loci, offering significant advantages in plant genetic development analysis and species identification, serving as a super barcode for plant DNA (Shen et al., 2017; Wang Y. H. et al., 2021; Song et al., 2022). In this study, nine complete chloroplast genes of S. miltiorrhiza were obtained. Each chloroplast genome of S. miltiorrhiza annotated a total of 132 genes, with lengths ranging from 151,371 to 151,589 bp, similar to other Salvia species (Liang et al., 2019). Subsequently, using the nine chloroplast genomes of S. miltiorrhiza and 24 other chloroplast genome sequences of Salvia species downloaded from NCBI, an NJ phylogenetic tree was constructed. The phylogenetic tree showed that the nine chloroplast genomes of S. miltiorrhiza clustered into a single branch, with 100% support, grouped together with S. yunnanensis and S. plectranthoides, indicating a close phylogenetic relationship between S. miltiorrhiza and these two species. The phylogenetic tree indicates that whole chloroplast genome analysis can be used for the identification of S. miltiorrhiza and other morphologically similar species within the Salvia genus, enabling intrageneric identification of S. miltiorrhiza. This study provides a scientific basis for distinguishing S. miltiorrhiza from related species, standardizing the cultivation and market circulation of medicinal materials.
Although the chloroplast genome can serve as a super DNA barcode for species identification, it is relatively expensive, and the operation is complex, making large-scale implementation in actual production challenging. At the same time, due to the wide geographical distribution of S. miltiorrhiza, the distinction of its origin is also very important, so more convenient and effective method is needed for further identification. Recent studies have found that mutations in the chloroplast genome often occur in hotspot regions (Xu et al., 2017), which vary between species. The ITS and matK combination sequences are superior barcodes for distinguishing Astragali and its adulterants (Guo et al., 2010). Similarly, three candidate DNA barcodes (trnH-psbA, rbcL-α, matK) can distinguish Sabia parviflora and its common adulterants to different degrees (Sui et al., 2011). Therefore, highly variable regions of the chloroplast genome can serve as specific DNA barcodes for species identification, useful for distinguishing between and within species. Research on the highly variable regions of S. miltiorrhiza has primarily focused on the genus level. Gao et al. compared S. miltiorrhiza with S. yangii and identified ten mutation hotspots (trnK-rps16, atpH-atpI, psaA-ycf3, ndhC-trnV, ndhF, rpl32-trnL, ndhG-ndhI, rps15-ycf1, ycf1a, and ycf1b) (Gao et al., 2020). Liang et al. compared the chloroplast genomes of four Salvia species, identifying candidate segments for distinguishing Salvia species: trnV-ndhC, trnQ-rps16, atpI-atpH, psbA-ycf3, ycf1, rpoC2, ndhF, matK, rpoB, rpoA, and accD. However, there is limited research on highly variable regions within S. miltiorrhiza (Liang et al., 2019). In this study, the chloroplast genomes from nine different production area were analyzed using mVISTA and ClustalX software, resulting 6 candidate specific DNA fragments including rps16-trnQ-UUG, atpF, ycf3, rps4-trnT-UGU, petB-petD, and clpP, which were different from the specific DNA barcodes distinguishing Salvia species. Subsequently, we selected the segments atpF and rps4-trnT-UGU, which are 300–1,300 bp long and have more variable loci, for further study. The aligned lengths of the atpF and rps4-trnT-UGU sequences were 977 bp and 407 bp, respectively, yielding 34 haplotypes and 22 haplotypes. Combined analysis of the two segments resulted in 62 haplotypes among the 235 samples, with Hap37 being the main haplotype, found in 25 samples from Shanxi Yuncheng, Shanxi Linfen, Henan Nanyang, Henan Luoyang, and Gansu Qingyang, accounting for 11%. Unique haplotypes were found in several locations, such as Henan Luoyang, Shandong Qingdao, Beijing Miyun, and Shanxi Linfen, which can serve as molecular markers for origin identification. Recent reports indicated that DNA could be also extracted from the herbal drugs in market, and the market samples also could be identified the species, haplotypes and production area according the haplotypes analysis in all production areas in China through DNA barcoding. For example, the analyzed results of the commercial Rhei rhizoma samples using matK gene indicated that 8 genotypes were identified, and the commercial samples are Rheum palmatume and mainly from Gansu, Sichuan and Yunan provinces (Man et al., 2022). Our investigation of haplotypes in S. miltiorrhiza will be provided a foundation for identifying the genotypes and production areas of herbal drugs in market. Additionally, a phylogenetic tree was constructed using MEGAX software for the 62 haplotypes, S. yunnanensis, S. przewalskii, and S. trijuga. The results showed high similarity among the different haplotypes of S. miltiorrhiza, clustering with S. yunnanensis, indicating a close phylogenetic relationship between the two species. This study provides a scientific basis for distinguishing S. miltiorrhiza from related species, standardizing the cultivation and market circulation of medicinal materials.
Intraspecific genetic diversity is a crucial component of biodiversity, reflecting a species’ evolutionary and environmental adaptability (Wan et al., 2022). Some scholars analyzed the genetic diversity of cultivated S. miltiorrhiza from 40 populations collected in China, indicating that cultivated S. miltiorrhiza has rich genetic diversity (Feng et al., 2022). This study’s genetic diversity analysis reveals high genetic diversity in multiple locations, with 71.43% of populations having an hd > 0.5, consistent with previous findings, indicating S. miltiorrhiza’s strong environmental adaptability. The average genetic distance among the 62 haplotypes of S. miltiorrhiza was 0.00226. Hap42 and Hap45 had the greatest genetic distance from Hap24, Hap59, Hap10, Hap32, Hap53, and Hap54, with a distance of 0.00536. The overall genetic distance among haplotypes was relatively small, indicating minimal genetic differentiation among the S. miltiorrhiza samples from the 21 populations. These results provide a theoretical foundation for the conservation of S. miltiorrhiza germplasm resources, genetic breeding, and origin identification.
5 Conclusion
In this study, we selected S. miltiorrhiza radix, a commonly used bulk Chinese herbal medicine in the market, as the research object, and synthesized various experimental methods to identify S. miltiorrhizaits from different origins and its adulterants. First, it was confirmed by fingerprinting that S. miltiorrhiza radix and its adulterants (S. yunnanensis radix, S. przewalskii radix, D. asperoides radix, and A. lappa radix) did not have quality consistency, and then five compounds (Hederacoside C, Cardamoni, Emodin, Eriodictyol, and Honokiol) were screened out for the differentiation of S. miltiorrhiza radix from S. yunnanensis radix, D. asperoides radix, and A. lappa radix by broad-targeted metabolomics. And three compounds (Ipriflavone, Macranthoside B, Honokiol) were used for the preliminary differentiation of different production areas of S. miltiorrhiza radix. Then, by chloroplast whole genome analysis, S. miltiorrhiza was distinguished from most of the similar plants within Salvia genus such as S. przewalskii, S. trijuga, and S. digitaloides. Finally, 62 haplotypes were formed by joint analysis of two fragments, atpF and rps4-trnT-UGU, which can be used to discriminate S. miltiorrhiza from different geographical origins. Overall, the research achieved discrimination between S. miltiorrhiza and adulterants from different families, within the same genus, and among samples from different geographical origins. It provides a scientific basis for the subsequent resource protection, market circulation and origin identification of S. miltiorrhiza, and has high application value.
Data availability statement
The data presented in the study are deposited in the National Center for Biotechnology Information (NCBI). The accession numbers of nine chloroplast genomes of S. miltiorrhiza are as follows: BankIt2882670 Seq1 PQ540593, BankIt2882670 Seq2 PQ540594, BankIt2882670 Seq3 PQ540595, BankIt2882670 Seq4 PQ540596, BankIt2882670 Seq5 PQ540597, BankIt2882670 Seq6 PQ540598, BankIt2882670 Seq7 PQ540599, BankIt2882670 Seq8 PQ540600, and BankIt2882670 Seq9 PQ540601.
Author contributions
GH: Conceptualization, Data curation, Formal Analysis, Investigation, Methodology, Project administration, Writing–original draft, Writing–review and editing. JM: Conceptualization, Data curation, Formal Analysis, Investigation, Methodology, Project administration, Writing–original draft, Writing–review and editing. YC: Data curation, Writing–original draft, Writing–review and editing. XZ: Investigation, Writing–original draft, Writing–review and editing. XnW: Formal Analysis, Writing–original draft, Writing–review and editing. KA: Methodology, Writing–original draft, Writing–review and editing. LA: Investigation, Writing–original draft, Writing–review and editing. WC: Investigation, Writing–original draft, Writing–review and editing. BW: Investigation, Writing–original draft, Writing–review and editing. YS: Writing–original draft, Writing–review and editing. XaW: Writing–original draft, Writing–review and editing. SW: Writing–original draft, Writing–review and editing.
Funding
The author(s) declare that financial support was received for the research, authorship, and/or publication of this article. This study was supported by National Key Research and Development Program of China (2022YFC3501505).
Acknowledgments
I am grateful for the guidance and support of my teachers and the help of my fellows.
Conflict of interest
The authors declare that the research was conducted in the absence of any commercial or financial relationships that could be construed as a potential conflict of interest.
Generative AI statement
The author(s) declare that no Generative AI was used in the creation of this manuscript.
Publisher’s note
All claims expressed in this article are solely those of the authors and do not necessarily represent those of their affiliated organizations, or those of the publisher, the editors and the reviewers. Any product that may be evaluated in this article, or claim that may be made by its manufacturer, is not guaranteed or endorsed by the publisher.
Supplementary material
The Supplementary Material for this article can be found online at: https://www.frontiersin.org/articles/10.3389/fphar.2024.1518906/full#supplementary-material
References
Awin, T., Mediani, A., Maulidiani, , Leong, S. W., Faudzi, S. M. M., Shaari, K., et al. (2019). Phytochemical and bioactivity alterations of Curcuma species harvested at different growth stages by NMR-based metabolomics. J. Food Compos. Analysis 77, 66–76. doi:10.1016/j.jfca.2019.01.004
Bielecka, M., Pencakowski, B., Stafiniak, M., Jakubowski, K., Rahimmalek, M., Gharibi, S., et al. (2021). Metabolomics and DNA-based authentication of two traditional asian medicinal and aromatic species of Salvia subg. Perovskia. Cells 10, 112. doi:10.3390/cells10010112
Cao, S. R., Du, H., Tang, B. B., Xi, C. X., and Chen, Z. Q. (2021). Non-target metabolomics based on high-resolution mass spectrometry combined with chemometric analysis for discriminating geographical origins of Rhizoma Coptidis. Microchem. J. 160, 105685. doi:10.1016/j.microc.2020.105685
Chen, W., Gong, L., Guo, Z. L., Wang, W. S., Zhang, H. Y., Liu, X. Q., et al. (2013). A novel integrated method for large-scale detection, identification, and quantification of widely targeted metabolites: application in the study of rice metabolomics. Mol. Plant 6 (6), 1769–1780. doi:10.1093/mp/sst080
Cheng, T. O. (2006). Danshen: a popular Chinese cardiac herbal drug. J. Am. Coll. Cardiol. 47 (7), 1499–1500. doi:10.1016/j.jacc.2006.01.001
Fang, X. S., Hao, J. F., Zhou, H. Y., Zhu, L. X., Wang, J. H., and Song, F. Q. (2010). Pharmacological studies on the sedative-hypnotic effect of Semen Ziziphi spinosae (Suanzaoren) and Radix et Rhizoma Salviae miltiorrhizae (Danshen) extracts and the synergistic effect of their combinations. Phytomedicine 17 (1), 75–80. doi:10.1016/j.phymed.2009.07.004
Feng, J., Liao, F., Kong, D. Y., Ren, R. H., Sun, T., Liu, W., et al. (2022). Genetic diversity of the cultivated Salvia miltiorrhiza populations revealed by four intergenic spacers. Plos One 17 (4), e0266536. doi:10.1371/journal.pone.0266536
Fiehn, O., Kopka, J., Dörmann, P., Altmann, T., Trethewey, R. N., and Willmitzer, L. (2000). Metabolite profiling for plant functional genomics. Nat. Biotechnol. 18 (11), 1157–1161. doi:10.1038/81137
Gao, C. W., Wu, C. H., Zhang, Q., Zhao, X., Wu, M. X., Chen, R. R., et al. (2020). Characterization of chloroplast genomes from two Salvia medicinal plants and gene transfer among their mitochondrial and chloroplast genomes. Front. Genet. 11, 574962. doi:10.3389/fgene.2020.574962
Guo, H. J., Wang, L., Xu, W. B., Huo, Z. T., Yang, P., Zhang, Q. W., et al. (2022). The complete chloroplast genome sequence of Cyathula officinalis and comparative analysis with four related species. Gene 839, 146728. doi:10.1016/j.gene.2022.146728
Guo, H. Y., Wang, W. W., Yang, N., Guo, B. L., Zhang, S., Yang, R. J., et al. (2010). DNA barcoding provides distinction between Radix Astragali and its adulterants. Sci. China-Life Sci. 53 (8), 992–999. doi:10.1007/s11427-010-4044-y
Ho, J. H. C., and Hong, C. Y. (2011). Salvianolic acids: small compounds with multiple mechanisms for cardiovascular protection. J. Biomed. Sci. 18, 30. doi:10.1186/1423-0127-18-30
Lam, F. F. Y., Yeung, J. H. K., Cheung, J. H. Y., and Or, P. M. Y. (2006). Pharmacological evidence for calcium channel inhibition by Danshen (Salvia miltiorrhiza) on rat isolated femoral artery. J. Cardiovasc. Pharmacol. 47 (1), 139–145. doi:10.1097/01.fjc.0000197540.12685.ce
Li, C. G., Sheng, S. J., Pang, E. C. K., Marriott, P., May, B., Zhou, S. F., et al. (2009). Cultivar variations of Australian-grown danshen (Salvia miltiorrhiza): bioactive markers and root yields. Chem. and Biodivers. 6 (2), 170–181. doi:10.1002/cbdv.200700441
Li, J., Wen, P. Y., Li, W. W., and Zhou, J. (2015). Upregulation effects of Tanshinone IIA on the expressions of NeuN, Nissl body, and IκB and downregulation effects on the expressions of GFAP and NF-κB in the brain tissues of rat models of Alzheimer's disease. Neuroreport 26 (13), 758–766. doi:10.1097/wnr.0000000000000419
Li, Y. B., Wang, Y. M., Su, L. N., Li, L. X., and Zhang, Y. J. (2013). Exploring potential chemical markers by metabolomics method for studying the processing mechanism of traditional Chinese medicine using RPLC-Q-TOF/MS: a case study of Radix Aconiti. Chem. Central J. 7, 36. doi:10.1186/1752-153x-7-36
Liang, C. L., Wang, L., Lei, J., Duan, B. Z., Ma, W. S., Xiao, S. M., et al. (2019). A comparative analysis of the chloroplast genomes of four Salvia medicinal plants. Engineering 5 (5), 907–915. doi:10.1016/j.eng.2019.01.017
Liang, Y. Z., Xie, P. S., and Chan, K. (2010). Perspective of chemical fingerprinting of Chinese herbs. Planta Medica 76 (17), 1997–2003. doi:10.1055/s-0030-1250541
Liu, B. Y., Du, Y. H., Cong, L. X., Jia, X. Y., and Yang, G. (2016). Danshen (Salvia miltiorrhiza) compounds improve the biochemical indices of the patients with coronary heart disease. Evidence-Based Complementary Altern. Med. 2016, 9781715. doi:10.1155/2016/9781715
Liu, Y. P., Su, X., Lü, T., and Liu, T. (2018). Characterization and phylogenetic analysis of the complete chloroplast genome of Orinus thoroldii (Poaceae). Conserv. Genet. Resour. 10 (4), 761–764. doi:10.1007/s12686-017-0923-x
Luo, H. L., Kong, W. J., Hu, Y. C., Chen, P., Wu, X. R., Wan, L., et al. (2015). Quality evaluation of Salvia miltiorrhiza Bge. by ultra high performance liquid chromatography with photodiode array detection and chemical fingerprinting coupled with chemometric analysis. J. Sep. Sci. 38 (9), 1544–1551. doi:10.1002/jssc.201401430
Ma, Y. Y., Lu, X. L., Zhai, M., and Yang, Y. (2012). Micromorphological comparative identification between several Chinese herbal medicines and their counterfeits. China J. Chin. Materia Medica 37 (08), 1161–1164. doi:10.4268/cjcmm20120823
Man, J. H., Shi, Y., Zhang, J. H., Zhang, Z. F., Yin, G. Y., Wang, X. W., et al. (2022). Molecular identification and quality analysis of Rhei Rhizoma based on chloroplast matK gene and UPLC. Acta Pharm. Sin. 57 (02), 514–524. doi:10.16438/j.0513-4870.2021-1225
Mei, X. D., Cao, Y. F., Che, Y. Y., Li, J., Shang, Z. P., Zhao, W. J., et al. (2019). Danshen: a phytochemical and pharmacological overview. Chin. J. Nat. Med. 17 (1), 59–80. doi:10.1016/s1875-5364(19)30010-x
Moon, B. C., Park, I., Kim, W. J., Yang, S., and Kang, Y. M. (2018). The complete chloroplast genome sequence of Fritillaria thunbergii Miq., an important medicinal plant, and identification of DNA markers to authenticate Fritillariae Bulbus. Hortic. Environ. Biotechnol. 59 (1), 71–80. doi:10.1007/s13580-018-0008-0
Mun, H. I., Kim, Y. X., Suh, D. H., Lee, S., Singh, D., Jung, E. S., et al. (2020). Metabolomic response of Perilla frutescens leaves, an edible-medicinal herb, to acclimatize magnesium oversupply. PLoS One 15 (7), e0236813. doi:10.1371/journal.pone.0236813
NationalPharmacopoeiaCommittee (2020). Chinese Pharmacopoeia. Beijing: China Medical Science and Technology Press.
Ni, L. J., Zhang, F. F., Han, M. Y., Zhang, L. G., Luan, S. R., Li, W., et al. (2019). Qualitative analysis of the roots of Salvia miltiorrhiza and Salvia yunnanensis based on NIR, UHPLC and LC-MS-MS. J. Pharm. Biomed. Analysis 170, 295–304. doi:10.1016/j.jpba.2019.01.010
Pang, H. Q., Wu, L., Tang, Y. P., Zhou, G. S., Qu, C., and Duan, J. A. (2016). Chemical Analysis of the Herbal Medicine Salviae miltiorrhizae Radix et Rhizoma (Danshen). Molecules 21 (1), 51. doi:10.3390/molecules21010051
Peng, L., Ru, M., Wang, K. R., Li, B., Wang, Y. C., Xia, P. G., et al. (2014). Spaceflight environment-induced variation in root yield and active constituents of Salvia miltiorrhiza. Planta Medica 80 (12), 1029–1035. doi:10.1055/s-0034-1382908
Shen, X. F., Wu, M. L., Liao, B. S., Liu, Z. X., Bai, R., Xiao, S. M., et al. (2017). Complete chloroplast genome sequence and phylogenetic analysis of the medicinal plant Artemisia annua. Molecules 22 (8), 1330. doi:10.3390/molecules22081330
Shidhi, P. R., Nadiya, F., Biju, V. C., Vijayan, S., Sasi, A., Vipin, C. L., et al. (2021). Complete chloroplast genome of the medicinal plant Evolvulus alsinoides: comparative analysis, identification of mutational hotspots and evolutionary dynamics with species of Solanales. Physiology Mol. Biol. Plants 27 (8), 1867–1884. doi:10.1007/s12298-021-01051-w
Song, Y., Zhao, W. J., Xu, J., Li, M. F., and Zhang, Y. J. (2022). Chloroplast genome evolution and species identification of Styrax (styracaceae). Biomed Res. Int. 2022, 5364094. doi:10.1155/2022/5364094
Su, C. Y., Ming, Q. L., Rahman, K., Han, T., and Qin, L. P. (2015). Salvia miltiorrhiza: traditional medicinal uses, chemistry, and pharmacology. Chin. J. Nat. Med. 13 (3), 163–182. doi:10.1016/s1875-5364(15)30002-9
Sui, X. Y., Huang, Y. A., Tan, Y., Guo, Y., and Long, C. L. (2011). Molecular authentication of the ethnomedicinal plant Sabia parviflora and its adulterants by DNA barcoding technique. Planta Medica 77 (5), 492–496. doi:10.1055/s-0030-1250468
Wan, N. F., Fu, L. W., Dainese, M., Hu, Y. Q., Kiær, L. P., Isbell, F., et al. (2022). Plant genetic diversity affects multiple trophic levels and trophic interactions. Nat. Commun. 13 (1), 7312. doi:10.1038/s41467-022-35087-7
Wang, C. X., Zhang, Y., Ding, H., Song, M. F., Yin, J. X., Yu, H. S., et al. (2021a). Authentication of zingiber species based on analysis of metabolite profiles. Front. Plant Sci. 12, 705446. doi:10.3389/fpls.2021.705446
Wang, W. J., Chen, B. X., Ma, R. K., Qiao, M. J., and Fu, Y. L. (2023). The DNA barcode identification of Dalbergia odorifera T. Chen and Dalbergia tonkinensis Prain. Bmc Plant Biol. 23 (1), 546. doi:10.1186/s12870-023-04513-3
Wang, Y. H., Wang, S., Liu, Y. L., Yuan, Q. J., Sun, J. H., and Guo, L. P. (2021b). Chloroplast genome variation and phylogenetic relationships of Atractylodes species. Bmc Genomics 22 (1), 103. doi:10.1186/s12864-021-07394-8
Xia, Y. T., Zhang, L., Hong, X. Y., Huang, Y. B., Lou, G. G., Hou, Z. N., et al. (2023). Metabolomic and antioxidant analyses of Salvia miltiorrhiza Bunge and Salvia prattii Hemsl. seeds. Nat. Prod. Res. 38, 3909–3916. doi:10.1080/14786419.2023.2269459
Xu, C., Dong, W., Li, W., Lu, Y., Xie, X., Jin, X., et al. (2017). Comparative analysis of six lagerstroemia complete chloroplast genomes. Front. Plant Sci. 8, 15. doi:10.3389/fpls.2017.00015
Ye, T. T., Shi, H. T., Wang, Y. P., Yang, F., and Chan, Z. L. (2016). Contrasting proteomic and metabolomic responses of bermudagrass to drought and salt stresses. Front. Plant Sci. 7, 1694. doi:10.3389/fpls.2016.01694
Yuan, H. L., Cao, G. P., Hou, X. D., Huang, M. L., Du, P. M., Tan, T. T., et al. (2022). Development of a widely targeted volatilomics method for profiling volatilomes in plants. Mol. Plant 15 (1), 189–202. doi:10.1016/j.molp.2021.09.003
Zhang, J., An, S. J., Fu, J. Q., Liu, P., Shao, T. M., Lie, M. L., et al. (2016). Mixed aqueous extract of Salvia miltiorrhiza reduces blood pressure through inhibition of vascular remodelling and oxidative stress in spontaneously hypertensive rats. Cell. Physiology Biochem. 40 (1-2), 347–360. doi:10.1159/000452550
Zhang, L. G., Hu, T. T., Zhang, F. F., Luan, S. R., Li, W., Deng, H. X., et al. (2019). Analysis of lipophilic components of Salvia miltiorrhiza roots and S. yunnanensis roots by UPLC and LC-MS/MS. Zhongguo Zhong Yao Za Zhi 44 (6), 1208–1215. doi:10.19540/j.cnki.cjcmm.20181226.020
Zhao, D., Tong, L. F., Zhang, L. X., Li, H., Wan, Y. X., and Zhang, T. Z. (2016a). Tanshinone II A stabilizes vulnerable plaques by suppressing RAGE signaling and NF-κB activation in apolipoprotein-E-deficient mice. Mol. Med. Rep. 14 (6), 4983–4990. doi:10.3892/mmr.2016.5916
Zhao, Q., Song, Z., Fang, X., Pan, Y., Guo, L., Liu, T., et al. (2016b). Effect of genotype and environment on Salvia miltiorrhiza roots using LC/MS-Based metabolomics. Molecules 21 (4), 414. doi:10.3390/molecules21040414
Zhong, G. X., Li, P., Zeng, L. J., Guan, J., Li, D. Q., and Li, S. P. (2009a). Chemical characteristics of Salvia miltiorrhiza (danshen) collected from different locations in China. J. Agric. Food Chem. 57 (15), 6879–6887. doi:10.1021/jf901462s
Zhong, X. K., Li, D. C., and Jiang, J. G. (2009b). Identification and quality control of Chinese medicine based on the fingerprint techniques. Curr. Med. Chem. 16 (23), 3064–3075. doi:10.2174/092986709788803051
Zhou, J. N., Hou, D. H., Zou, W. Q., Wang, J. H., Luo, R., Wang, M., et al. (2022). Comparison of widely targeted metabolomics and untargeted metabolomics of wild Ophiocordyceps sinensis. Molecules 27 (11), 3645. doi:10.3390/molecules27113645
Zhou, Y. Q., Li, W. X., Xu, L., and Chen, L. Y. (2011). In Salvia miltiorrhiza, phenolic acids possess protective properties against amyloid β-induced cytotoxicity, and tanshinones act as acetylcholinesterase inhibitors. Environ. Toxicol. Pharmacol. 31 (3), 443–452. doi:10.1016/j.etap.2011.02.006
Zhu, H. L., Qin, J. Y., Chen, X. D., Lin, W. B., Zhang, L. K., Yao, S. J., et al. (2019). Comparative discriminant analysis of Salviae miltiorrhizae Radix et Rhizoma and its counterfeit and adulterants. J. Guangdong Pharm. Univ. 35 (01), 16–21. doi:10.16809/j.cnki.2096-3653.2018101702
Keywords: Salvia miltiorrhiza, targeted metabolomics, chloroplast genome, DNA barcoding, germplasm resource identification
Citation: He G, Man J, Chen Y, Zhang X, Wang X, An K, Amu L, Chen W, Wang B, Shi Y, Wang X and Wei S (2025) Identification of Salvia miltiorrhiza germplasm resources based on metabolomics and DNA barcoding. Front. Pharmacol. 15:1518906. doi: 10.3389/fphar.2024.1518906
Received: 29 October 2024; Accepted: 13 December 2024;
Published: 07 January 2025.
Edited by:
Javier Echeverria, University of Santiago, ChileReviewed by:
Ruyu Yao, Chinese Academy of Sciences (CAS), ChinaKa Yui Kum, Life Code Limited, Hong Kong SAR, China
Copyright © 2025 He, Man, Chen, Zhang, Wang, An, Amu, Chen, Wang, Shi, Wang and Wei. This is an open-access article distributed under the terms of the Creative Commons Attribution License (CC BY). The use, distribution or reproduction in other forums is permitted, provided the original author(s) and the copyright owner(s) are credited and that the original publication in this journal is cited, in accordance with accepted academic practice. No use, distribution or reproduction is permitted which does not comply with these terms.
*Correspondence: Shengli Wei, d3NsNzQ5MUAxMjYuY29t; Xiaohui Wang, d2FuZ3hodWkyMDE0QDE2My5jb20=; Yue Shi, c2hpbnkwNDIwQDE2My5jb20=
†These authors have contributed equally to this work and share first authorship