- 1Department of Chemical and Biological Engineering, University at Buffalo, The State University of New York, Buffalo, NY, United States
- 2Department of Biomedical Engineering, University at Buffalo, The State University of New York, Buffalo, NY, United States
- 3Institute for Artificial Intelligence and Data Science, University at Buffalo, The State University of New York, Buffalo, NY, United States
- 4Department of Pharmaceutical Sciences, University at Buffalo, The State University of New York, Buffalo, NY, United States
Background: Glomerular fibrosis is a tissue damage that occurs within the kidneys of chronic and diabetic kidney disease patients. Effective treatments are lacking, and the mechanism of glomerular damage reversal is poorly understood.
Methods: A mathematical model suitable for hypothesis-driven systems pharmacology of glomerular fibrosis in diabetes was developed from a previous model of interstitial fibrosis. The adapted model consists of a system of ordinary differential equations that models the complex disease etiology and progression of glomerular fibrosis in diabetes.
Results: Within the scope of the mechanism incorporated, advanced glycation end products (AGE)—matrix proteins that are modified due to high blood glucose—were identified as major contributors to the delay in the recovery from glomerular fibrosis after glucose control. The model predicted that inhibition of AGE production is not an effective approach for accelerating the recovery from glomerular fibrosis. Further, the model predicted that treatment breaking down accumulated AGE is the most productive at reversing glomerular fibrosis. The use of the model led to the identification that glucose control and aminoguanidine are ineffective treatments for reversing advanced glomerular fibrosis because they do not remove accumulated AGE. Additionally, using the model, a potential explanation was generated for the lack of efficacy of alagebrium in treating advanced glomerular fibrosis, which is due to the inability of alagebrium to reduce TGF-
Impact: Using the mathematical model, a mechanistic understanding of disease etiology and complexity of glomerular fibrosis in diabetes was illuminated, and then hypothesis-driven explanations for the lack of efficacy of different pharmacological agents for treating glomerular fibrosis were provided. This understanding can enable the development of more efficacious therapeutics for treating kidney damage in diabetes.
1 Introduction
Diabetic kidney disease (DKD) is a significant global health problem. With over 135 million patients and a yearly incidence rate of over two million new cases, the burden of DKD is rising (Deng et al., 2021). DKD is a chronic disease for which treatments that can prevent or completely reverse kidney damage are lacking.
DKD is a complex disease that has multiple factors that cause the development and progression of kidney damage. Although hyperglycemia is the initial stimulus for the development of kidney damage in diabetes, the continued progression of damage is mediated by a host of other stimuli, such as advanced glycation end products (AGE), hypertension, angiotensin, and enhanced oxidative stress (Zhang et al., 2021). These stimuli work both dependently and independently through mechanical and chemical signaling to induce damage, such as kidney fibrosis, proteinuria, and glomerular filtration rate decline, ultimately resulting in kidney failure (Thomas and Ford Versypt, 2022). Consequently, treatments must be comprehensive to target the multifaceted nature of DKD. Current treatment for DKD consists of approaches to reduce the risk of the development and progression of kidney damage, depending on the stage of DKD. If diagnosed very early, lifestyle changes such as nutrition, exercise, and control of glycemic and lipid levels and blood pressure can reduce the risk of DKD progression (Guedes and Pecoits-Filho, 2022). As DKD progresses, inhibitors of the renin-angiotensin-aldosterone system (RAAS) and sodium-glucose cotransporter-2 (SGLT2) are the suggested treatments (Guedes and Pecoits-Filho, 2022). RAAS and SGLT2 inhibitors, although not cures for DKD, can significantly reduce the risk of further progression of DKD. However, once DKD has advanced, the efficacy of known therapeutic approaches becomes limited (Pillai and Fulmali, 2023).
One of the reasons for the limited efficacy of therapeutics for advanced DKD is the concept of glycemic memory, i.e., even after blood glucose has been regulated, kidney damage continues to progress (Testa et al., 2017; Xu and Guo, 2017; Yamazaki et al., 2021). Glycemic memory was observed in patients who received pancreatic transplants to restore regulation of their blood glucose levels (Fioretto et al., 1998). Although blood glucose normalization was achieved relatively quickly, full recovery from kidney damage was only observed 10 years after pancreatic transplant (Fioretto et al., 1998). AGE, enhanced oxidative stress, and epigenetic changes have been strongly implicated as independently or interdependently being responsible for glycemic memory (Drzewoski et al., 2009; Testa et al., 2017; Xu and Guo, 2017; Yamazaki et al., 2021). Epigenetic modifications are still in basic research, while AGE and oxidative stress have been hypothesized to form a vicious cycle that is the major contributor to glycemic memory (Xu and Guo, 2017).
Treatments targeting AGE have been developed but have not entered the market as additional therapies for managing DKD. AGE formation inhibitors, such as aminoguanidine and pyridoxamine, had mixed results in clinical trials (Bolton et al., 2004; Williams et al., 2007; Rabbani et al., 2009). Alagebrium, an AGE crosslink breaker, made it to human clinical trials but was not approved as a viable treatment approach (Toprak and Yigitaslan, 2019).
Questions associated with glycemic memory remain unanswered, such as why kidney function takes years to recover after initiating glucose control, what approaches can accelerate the recovery from kidney damage, and why treatments for AGE—species implicated in glycemic memory—are not efficacious. To provide explanations for these questions and thus shed more light on hypothesized mechanisms governing glycemic memory, we developed a mechanistic mathematical model of diabetes-induced kidney damage, specifically a model of glomerular fibrosis, by adapting a previous model of interstitial fibrosis in lupus (Hao et al., 2014). We used the core pieces of the previous model, gathered data from the literature, and adapted the model to the mechanisms of disease progression relevant to diabetic glomerular fibrosis. The new model was then used to explore explanations for delayed recovery from glomerular fibrosis and lack of therapeutic efficacy and suggest approaches to accelerate recovery.
2 Methods
2.1 Mechanism identification
In the interstitial fibrosis model (Hao et al., 2014), fibrosis occurs through the recruitment of macrophages that cause the activation of resident cells, which then produce excess quantities of extracellular matrix (ECM), resulting in fibrosis. To adapt the model, we compared the mechanistic details of the lupus interstitial fibrosis model to published data relevant to diabetic glomerular fibrosis from in vitro and in vivo experimental studies and well-established protein-enzyme interactions. The literature-supported mechanism for the progression of glomerular fibrosis in diabetes is shown in Figure 1 and described below.
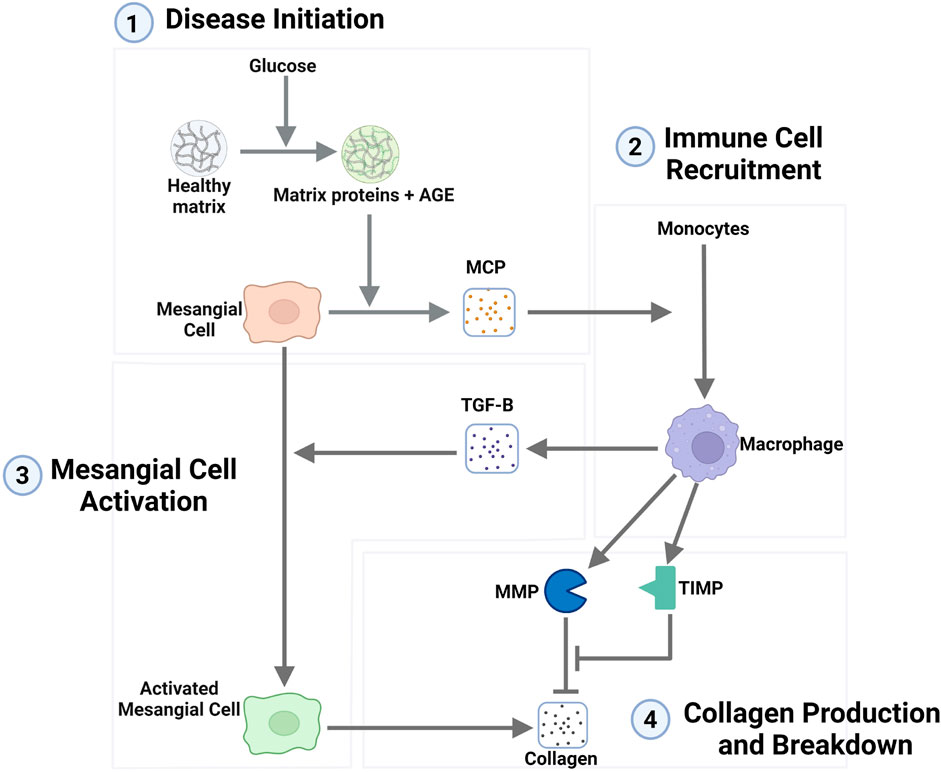
Figure 1. Network representation of the mechanism of the progression of glomerular fibrosis in diabetes consisting of four steps: (1) disease initiation, (2) immune cell recruitment, (3) mesangial cell activation, and (4) collagen production and breakdown. Degradation terms are not shown in this figure. Arrows toward chemical and cellular species represent their production, and arrows towards other arrows represent the activation of a process. Flat-ended lines towards other lines represent inhibition, and flat-ended lines towards chemical and cellular species represent degradation. Abbreviations: AGE, advanced glycation end products; MCP, monocyte chemoattractant protein; TGF-B, transforming growth factor–
2.1.1 Disease initiation mechanism
In the interstitial fibrosis model (Hao et al., 2014), epithelial cell damage is the initiator of fibrosis. However, in diabetes-induced glomerular fibrosis, the consensus is that high glucose initiates fibrosis through mesangial cells, not epithelial cells (Thomas and Ford Versypt, 2022), as collagen is increasingly accumulated when mesangial cells are cultured in high glucose conditions (Ayo et al., 1990; 1991; Haneda et al., 1991; Baccora et al., 2007).
Here, we considered a mechanism in which high glucose initiates fibrosis through mesangial cells via AGE. AGE can cause inflammation within mesangial cells (Yamagishi et al., 2002; Sun et al., 2017) and is implicated in the progression of glomerular damage in diabetes. AGE has been shown to rapidly form when ECM is incubated in high glucose conditions (Singh et al., 2014) and has been observed to readily accumulate within the glomerulus of diabetic mice (Sohn et al., 2013; Do et al., 2018; Iacobini et al., 2018).
Mesangial cells produce monocyte chemoattractant protein (MCP) in the in vitro diabetic glomerular fibrosis model (Min et al., 2009) and in vivo during diabetes-induced fibrosis (Li et al., 2020). MCP is a chemoattractant commonly associated with the recruitment of macrophages. The inflammation induced by AGE has been shown to enhance MCP expression by mesangial cells (Yamagishi et al., 2002; Sun et al., 2017). The inflammation of mesangial cells and the enhanced production of MCP support the mechanism of MCP-mediated recruitment of macrophages.
2.1.2 Immune cell recruitment
Macrophages are part of the immune response to injury. As such, they can be found across the body during different inflammatory scenarios with cellular damage. Macrophages are known to be recruited to the site of damage via the production of chemoattractants by the damaged cells. Here, we considered macrophage recruitment to the glomerulus through MCP where the inflamed mesangial cells are the source of the MCP. This MCP causes the recruitment and activation of macrophages from precursor monocytes.
The recruitment and accumulation of macrophages within the glomerulus during diabetes are well documented. Many in vivo studies in diabetic mice show a significant accumulation of macrophages within the glomerulus a short period after the mice develop the diabetic condition (Ichinose et al., 2006; Saito et al., 2011; Kim et al., 2013; Hong et al., 2014; Terami et al., 2014; Choi et al., 2018; Kim et al., 2018; Hwang et al., 2019).
2.1.3 Mesangial cell activation
In the interstitial fibrosis model, transforming growth factor-
In the interstitial fibrosis model, the source of TGF-
2.1.4 Collagen production and degradation
Excess production of collagen is seen in in vitro studies of mesangial cells incubated in high glucose, a culture model representative of the glomerulus in diabetes (Ayo et al., 1990; 1991; Haneda et al., 1991; Baccora et al., 2007). These studies showed that collagen protein is significantly upregulated in the diabetic milieu. Similarly, in vivo studies in spontaneously diabetic mice also showed significant amounts of collagen deposited in the mesangium of the glomerulus after a few weeks of hyperglycemia (Ichinose et al., 2006; Kosugi et al., 2010; Kim et al., 2013; Chen et al., 2014; Hong et al., 2014; Park et al., 2016; Choi et al., 2018; Kim et al., 2018; Hwang et al., 2019). However, the source of the excess collagen protein is not well defined. These in vitro and in vivo studies do not delineate whether quiescent mesangial cells produce excess collagen or if a different phenotype of mesangial cells produces excess collagen. In other fibrosis mechanisms, fibroblasts (resident cells) get activated to become myofibroblasts, an increasingly fibrotic phenotype that leads to the excess production of collagen (Hao et al., 2014). In vitro mesangial cell studies do not explicitly state that the activation of mesangial cells leads to the phenotype that is increasingly fibrotic. However, other studies have made these parallels of mesangial cells becoming activated or differentiating and behaving similarly to myofibroblasts (Simonson, 2007; Li et al., 2020). Mesangial cells have been shown to exhibit similar behaviors to myofibroblasts, such as increased expression of
The mechanism of collagen production and degradation considered here was built upon well-established protein-enzyme interactions. Collagen is a protein degraded by enzyme MMPs, which are inhibited by tissue inhibitor of metalloproteinases (TIMP). These proteins, enzymes, and inhibitors vary in the in vitro diabetic culture model (McLennan et al., 1994; Wahab and Mason, 1996; McLennan et al., 2000), indicating that their involvement is pertinent to the progression of glomerular fibrosis.
An in vitro co-culture study of mesangial and macrophage cells showed that macrophages regulate MMP expression but not expression of TIMP (Min et al., 2009). In contrast in the same paper, mesangial cells were shown to regulate both MMP and TIMP expression (Min et al., 2009). This differs from the interstitial fibrosis case, where macrophages regulate both MMP and TIMP, and the resident fibroblast cell in that context has no role in MMP and TIMP regulation. Currently, in our model, the sources of MMP and TIMP are the same as in the interstitial fibrosis case. In future iterations of the model, variations in the sources of MMP and TIMP could be incorporated.
2.2 Model equations
Here, we describe the equations used to model glomerular fibrosis in diabetes, the specific biological interpretation of each of the terms in the equations, and how the equations for the model were derived.
A mathematical model for interstitial fibrosis in lupus nephritis was built by Hao et al. (2014). Our approach was to adapt their model to glomerular fibrosis in diabetes using the mechanistic steps identified in Section 2.1. In this adapted mathematical model (Figure 1), ten species are the critical cells and biomolecules involved in the process of glomerular fibrosis in diabetes. The ten species consist of 3 cell types: mesangial cells, activated mesangial cells, and macrophages. The remaining seven species are biomolecules: glucose, AGE, MCP, TGF-
The dynamics for the species depend on biological processes that lead to changes in their amounts within the glomerulus. The main changes in biomolecule concentrations are due to production by particular cells within the glomerulus and their natural and enzymatic degradation. The main changes in cellular populations are due to cell proliferation, infiltration of immune cells, differentiation of resident cells, and natural death.
These biological processes were modeled using mass action, Michaelis-Menten, or Hill function type kinetics. For biological processes where a biomolecule activates cells to a phenotypic change or a biomolecule stimulates cells to produce another biomolecule, Michaelis-Menten or Hill function type kinetics were used because the stimulation of a cell through a biomolecule interacting with the receptors on the cell is a receptor-limited process as receptors become saturated. Thus, even at high ligand concentrations, the rate of cellular stimulation by ligands reaches a maximum. The use of Michaelis-Menten or Hill function type kinetics for modeling the stimulation and activation of cells is a common approach (Hao et al., 2014; 2015; Ruggiero et al., 2017; Islam et al., 2021; Cook et al., 2022; Patidar and Ford Versypt, 2023; Islam et al., 2023; Cook et al., 2024). Equation 1 defines the generalized Hill function for activation by any species
where
Using these modeling approaches and adapting equations from Hao et al. (2014), the following equations were defined to model the steps within the progression of glomerular fibrosis in diabetes (Figure 1). We have provided the code and analysis files for the glomerular fibrosis model in a repository at https://github.com/ashleefv/GlomerularFibrosis (Thomas and Ford Versypt, 2024).
2.2.1 Disease initiation
The progression of glomerular fibrosis in diabetes is initiated by glucose stimulating the formation of AGE. Equation 2 defines the resulting AGE dynamics as
where the first term represents the rate of production of AGE dictated by the AGE formation rate constant
Equation 3 describes the dynamics of MCP, the chemoattractant protein that is involved in the recruitment of macrophages, as
where
The population of mesangial cells (MC) is assumed to be constant at the value listed in Table 1. Activated mesangial cells (AMC) are considered as a separate population.
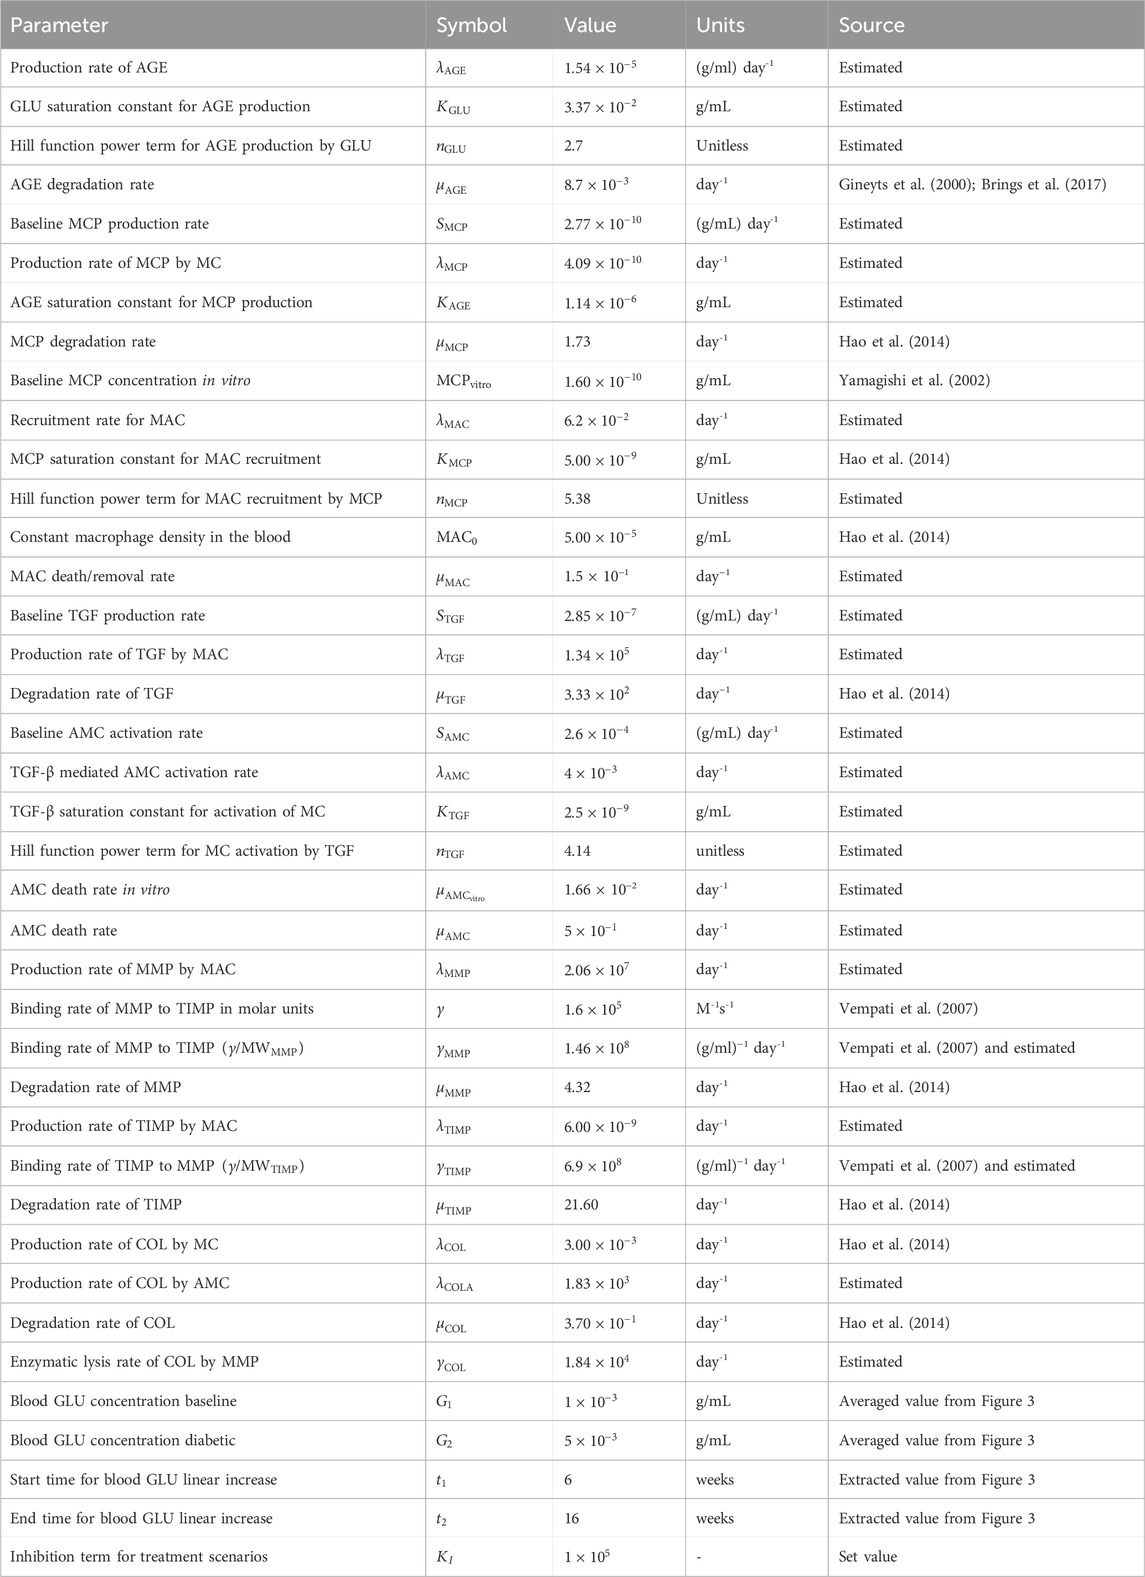
Table 1. Parameters for glomerular fibrosis model. Abbreviations: AGE, advanced glycation end products; GLU, glucose; MCP, monocyte chemoattractant protein; MC, mesangial cells; MAC, macrophages; TGF, transforming growth factor–
2.2.2 Immune cell recruitment
Equation 4 defines the population dynamics of the macrophages (MAC) recruited by MCP as
where the first term represents the MCP-dependent recruitment of macrophages from the blood dictated by the maximum recruitment rate
2.2.3 Mesangial cell activation
Equation 5 defines the dynamics for TGF-
where the first two terms represent the baseline production of TGF-
Equation 6 defines the population dynamics for activated mesangial cells (AMC) as
where
2.2.4 Collagen production and degradation
Collagen degradation depends on the enzymes MMP and TIMP. As in Hao et al. (2014), the population dynamics of MMP and TIMP are defined by Equations 7, 8, respectively.
The first, second, and third terms of Equation 7 represent macrophage-mediated production, MMP inhibition by TIMP, and degradation, respectively. The terms have rate constants
The first, second, and third terms of Equation 8 represent macrophage-mediated production, TIMP binding with MMP, and the degradation of TIMP, respectively. The terms have rate constants
Equation 9 defines the dynamics of collagen (COL) as
where the first two terms represent collagen production by MC and AMC, respectively. The last two terms represent the natural degradation of collagen and the MMP-mediated enzymatic lysis of collagen. Each of the terms are dictated by corresponding rate constants
There are several differences between the Hao et al. (2014) model for interstitial fibrosis and our model beyond the application to glomerular fibrosis. Foremost, our model does not have a spatial component for the transport in the small mesangial region for glomerular fibrosis. Equations 2, 3 are newly included here because of mechanistic differences between glomerular and interstitial fibrosis. Equation 4 has a similar mechanism as the interstitial model, but due to the removal of the spatial component, the recruitment and activation of macrophages term is modeled using a simpler Hill function than the boundary condition-dependent equation implemented in Hao et al. (2014). Equation 5 has a baseline TGF-
2.3 Parameter estimation
The model parameters were calibrated based on a combination of in vivo and in vitro data and parameter values obtained from the literature (Supplementary Section S1; Figure 2). Parameters were estimated using a subsystem approach where only three to four parameters were determined simultaneously. The estimation was divided such that the parameters involved in the dynamics of one group of species were estimated before moving on to the next. The process was continued until all parameters were calibrated. As such, we discuss the estimation of parameters involving each group of species separately below. Unless stated otherwise, nonlinear least squares regression in MATLAB was used to minimize the sum of squared differences between model predictions and experimental data. The resulting parameter values are listed in Table 1.
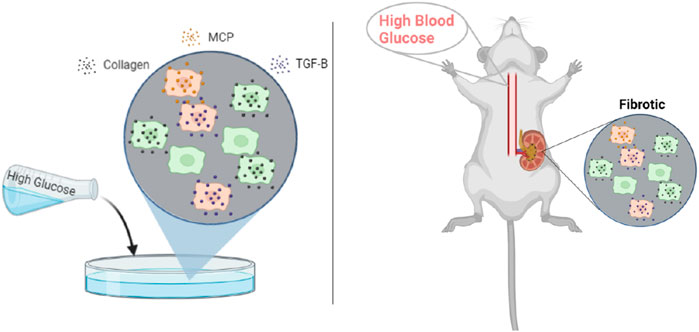
Figure 2. Published rodent in vitro mesangial cell culture and in vivo glomerular data from db/db mice were used for parameter estimation. Abbreviations: MCP, monocyte chemoattractant protein; TGF-
2.3.1 Glucose and AGE
The glomerular fibrosis model defined in Section 2.2 uses an input of blood glucose concentration as the stimulus for fibrosis progression (Figure 3A). For this input, we used the in vivo blood glucose concentration from db/db mice over 24 weeks (Figure 3B; Supplementary Figure S1) (Cohen et al., 1995; 2001; 2002; Ziyadeh et al., 2000; Koya et al., 2000; Kolavennu et al., 2008). We approximated the data as a ramp input to simplify the model. The input GLU (Equation 10) is fed into the model via the AGE dynamics (Equation 2).
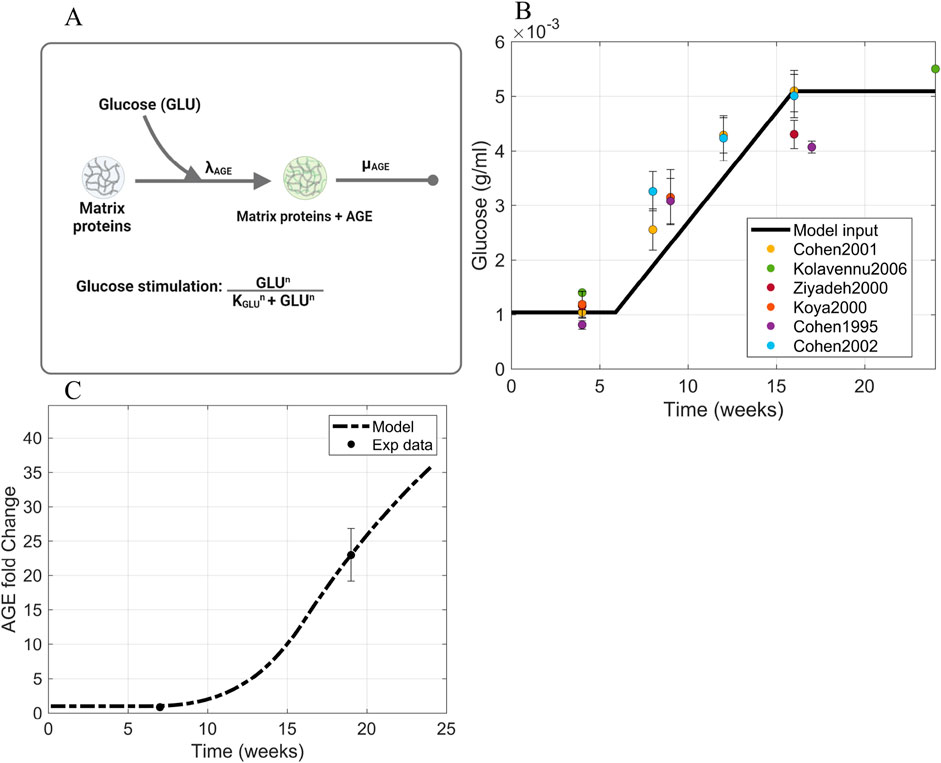
Figure 3. Information supporting AGE parameter estimation. (A) The rate constants and species contributing to AGE dynamics (Equation 2). (B) Blood glucose concentration dynamics within db/db mice approximated as a piecewise function of ramp input between two constant intervals. Sources: Cohen et al. (1995, 2001, 2002); Ziyadeh et al. (2000); Koya et al. (2000); Kolavennu et al. (2008). Raw data points are shown in Supplementary Figure S1. (C) Fitting of AGE time-series data to estimate parameters involved in AGE dynamics. Source: Sohn et al. (2013). Abbreviations: AGE, advanced glycation end products; GLU, glucose.
Equation 10 defines the dynamics of the glucose (GLU) concentration as a piecewise function
where
that approximates the increase in glucose concentration in the interval of
AGE is formed through the non-enzymatic cross-linking reaction of glucose with proteins to form a covalently bonded, stable molecule (Abbas et al., 2016). Different types of AGE can be formed due to high glucose concentration within the body, such as glycated albumin, hydroimidazolones, and glucosepane (Rabbani and Thornalley, 2018). Out of the many types of AGE, N
We calculated the AGE degradation rate
The AGE initial value
2.3.2 MCP
To calibrate the Michaelis-Menten parameters
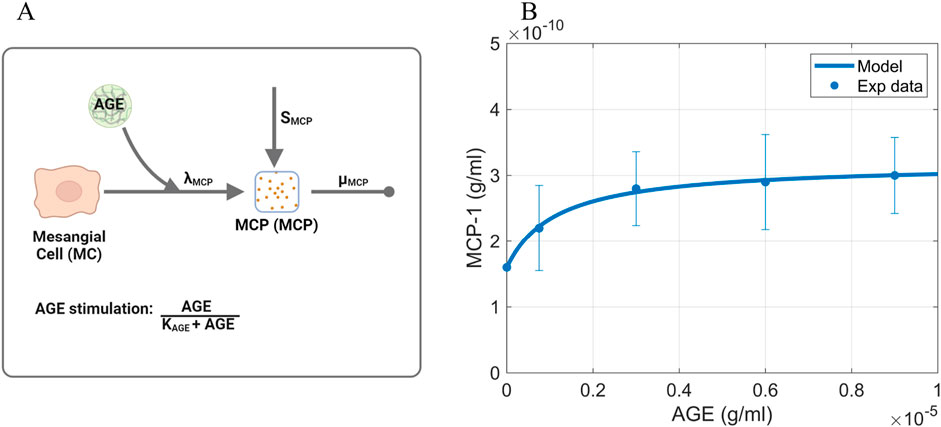
Figure 4. Information supporting MCP parameter estimation. (A) The rate constants and species contributing to the dynamics of MCP (Equation 3). (B) Fitting of dose-response curve to estimate Michaelis-Menten parameters. Source: Lu et al. (2004). Raw data points are shown in Supplementary Figure S2. Panel A created with BioRender.com. Abbreviations: AGE, advanced glycation end products; MCP, monocyte chemoattractant protein; MC, mesangial cells.
The baseline MCP production rate
where
2.3.3 Macrophages
The macrophage dynamics (Equation 4) are dictated by the macrophage recruitment rate constant
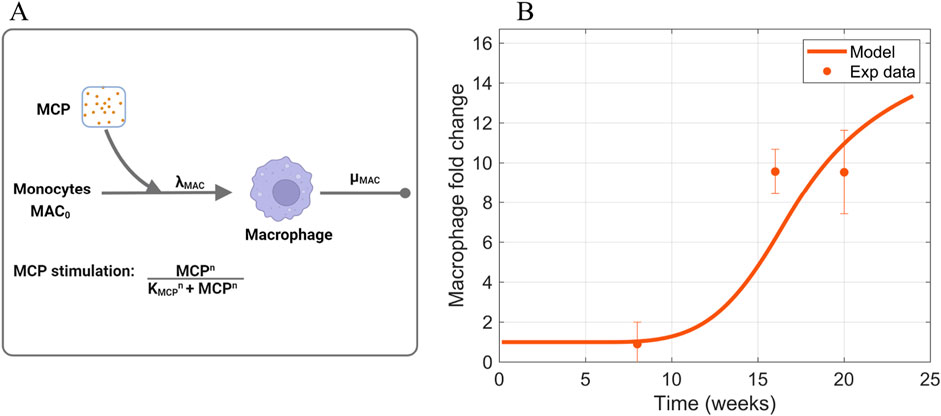
Figure 5. Information supporting MAC parameter estimation. (A) The rate constants and species contributing to the dynamics of macrophages (Equation 4). (B) Fitting of macrophage time-series data to estimate parameters that dictate macrophage dynamics. Sources: Ichinose et al. (2006); Saito et al. (2011); Kim et al. (2013); Hong et al. (2014); Choi et al. (2018); Kim et al. (2018); Hwang et al. (2019). Non-averaged experimental data points are shown in Supplementary Figure S3. Panel A created with BioRender.com. Abbreviations: MCP, monocyte chemoattractant protein; MAC, macrophages.
The Hill activation function parameter
2.3.4 TGF-
TGF-
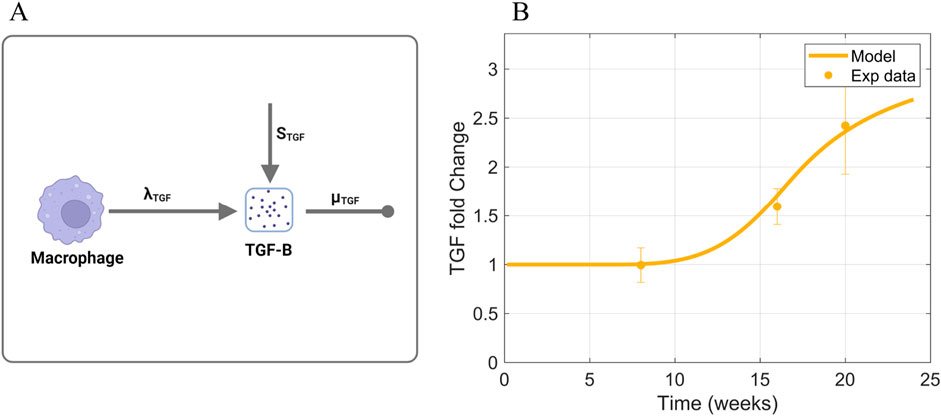
Figure 6. Information supporting TGF-
2.3.5 Activated mesangial cells
Activated mesangial cell dynamics (Equation 6) depend on a baseline activation of mesangial cells
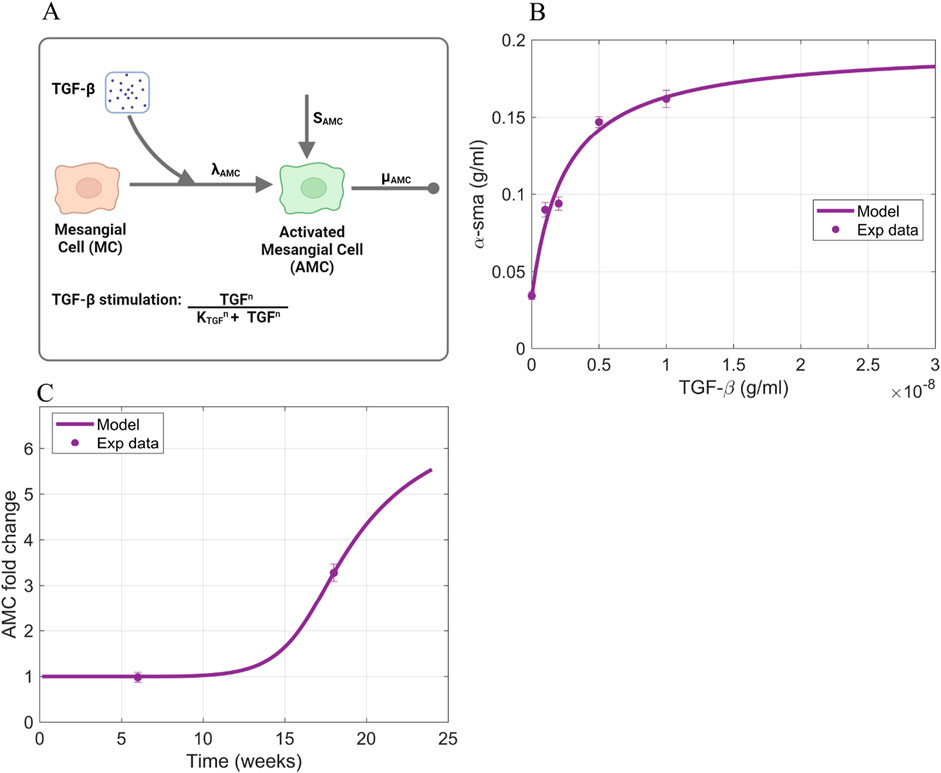
Figure 7. Information supporting AMC parameter estimation. (A) The rate constants and species contributing to the dynamics of activated mesangial cells (Equation 6). (B) Fitting of TGF-
To estimate the rate parameters involved in each process, we used a combination of in vitro and in vivo data. The in vitro data is the expression of
2.3.6 MMP, TIMP, and collagen
MMP and TIMP dynamics (Equations 7, 8) are dependent on their production rate constants
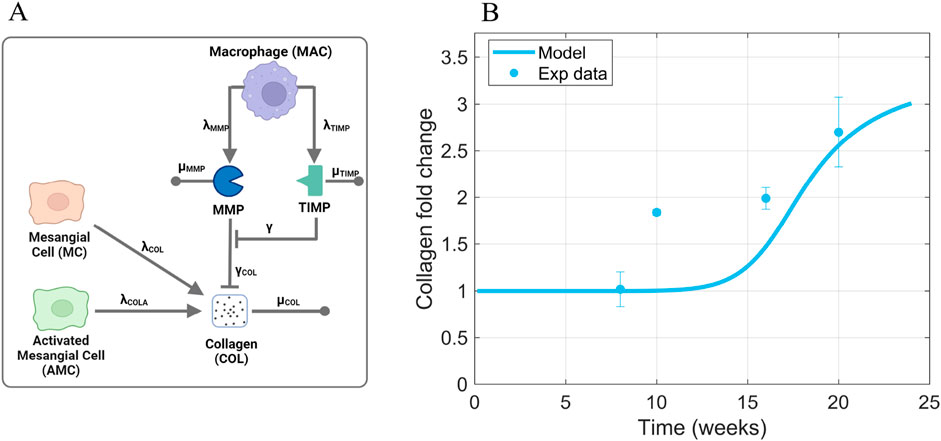
Figure 8. Information supporting MMP, TIMP, and COL parameter estimation. (A) The rate constants and species contributing to MMP, TIMP, and collagen dynamics (Equations 7–9). (B) Fitting of collagen time-series data from db/db mice to estimate parameters that dictate collagen dynamics. Sources: Ichinose et al. (2006); Kosugi et al. (2010); Kim et al. (2013); Chen et al. (2014); Hong et al. (2014); Park et al. (2016); Choi et al. (2018); Kim et al. (2018); Hwang et al. (2019). Non-averaged data points are shown in Supplementary Figure S6. Panel A created with BioRender.com. Abbreviations: MC, mesangial cells; MAC, macrophages; AMC, activated mesangial cells; MMP, matrix metalloproteinase; TIMP, tissue inhibitor of metalloproteinase; COL, collagen.
Collagen dynamics (Equation 9) depend on production rate constants
The collagen production rate constant
2.4 Determination of initial values
The initial value for AGE was obtained from the experimental data found in the literature (Yuan et al., 2017; Menini et al., 2018). The initial value for AGE within the glomerulus was assumed to be the same as the average serum concentration of CML within healthy mice and rats. The initial values for the other species within the model were estimated by running the model with healthy glucose levels until a steady state was reached for each of the species. Thus, the initial values are denoted with the subscript

Table 2. Initial values for model species. Abbreviations: AGE, advanced glycation end products; MCP, monocyte chemoattractant protein; MAC, macrophages; TGF, transforming growth factor–
3 Results
We simulated different scenarios to answer key questions that were raised in the introduction. We first simulated the base case scenario for high glucose-induced glomerular fibrosis to capture diabetes-induced glomerular fibrosis. Next, we simulated glucose control to identify why kidney damage recovery takes years after initiation of glucose control. Then, we simulated different treatment approaches to identify ways to accelerate the recovery from kidney damage. Additionally, we performed a local sensitivity analysis to identify the most influential parameters in the model (Supplementary Section S2; Supplementary Figure S7) with respective to the peak collagen concentration. This model output was selected for sensitivity analysis as it is the last output of the glomerular fibrosis network (Figure 1).
3.1 Glomerular fibrosis base case scenario
The base case scenario for glomerular fibrosis is when the model uses a prescribed blood glucose concentration (Equation 10), specific initial concentrations of cellular and biomolecular species (Table 2), and parameter values based on experimental data for species dynamics within db/db mice or mesangial cell cultures (Table 1) as described in Section 2.3. The base case scenario shows the dynamics of the critical cells and biomolecules involved in the glomerular fibrosis of diabetic mice over 24 weeks (Figure 9). In the base case scenario, the blood glucose concentration increased at 6 weeks and plateaued at 16 weeks (Figure 9A), causing an increased accumulation of AGE (Figure 9B). This started the cascade of immune cell recruitment followed by mesangial cell activation and eventual collagen accumulation. All species reached a steady state within 24 weeks except for AGE. The AGE concentration did not reach a steady state within the given time frame because its degradation rate was small relative to its formation rate.
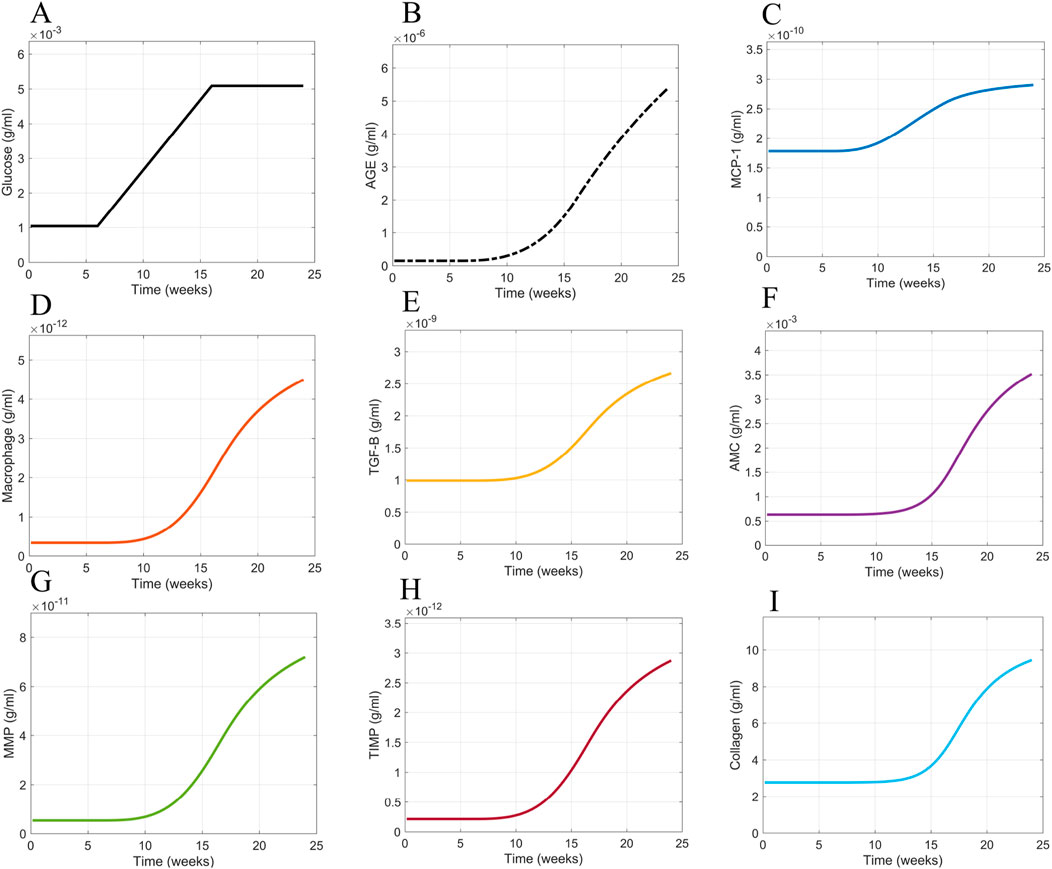
Figure 9. Model simulation dynamics of cells and biomolecules involved in glomerular fibrosis over 24 weeks. (A) Glucose input concentration, (B) AGE concentration, (C) MCP concentration, (D) macrophage concentration, (E) TGF-
For the given conditions, these results showed that a switch in blood glucose concentration from baseline levels (0–6 weeks) to high blood glucose concentration levels (16–24 weeks) resulted in a similar switch from healthy glomerular tissue (0–16 weeks) to a fibrotic glomerular tissue (after 16 weeks) (Figure 9I).
3.2 Glucose control scenario
Once we had the cellular and biomolecular dynamics of glomerular fibrosis as the base case scenario, we ran different scenarios to determine what mechanistic pieces are responsible for the delayed recovery from glomerular fibrosis after achieving good blood glucose control. Good blood glucose control is defined as regulation that returns the blood glucose concentration to sustained baseline levels.
We simulated a scenario applying good blood glucose control (Figure 10A) to the model at 24 weeks via an immediate decrease in blood glucose levels from the elevated state to the normal baseline levels (Figures 10B, D). The reduction of blood glucose levels showed little effect on collagen within 30 weeks, which we defined as the short-term period (Figure 10C). Additionally, the profile of collagen was similar to that of the base case scenario (Figure 9I). For immediate blood glucose regulation, there is not an immediate decrease in glomerular fibrosis. We then simulated the model for an extended period of time (Figures 10D–G). It takes a long time (
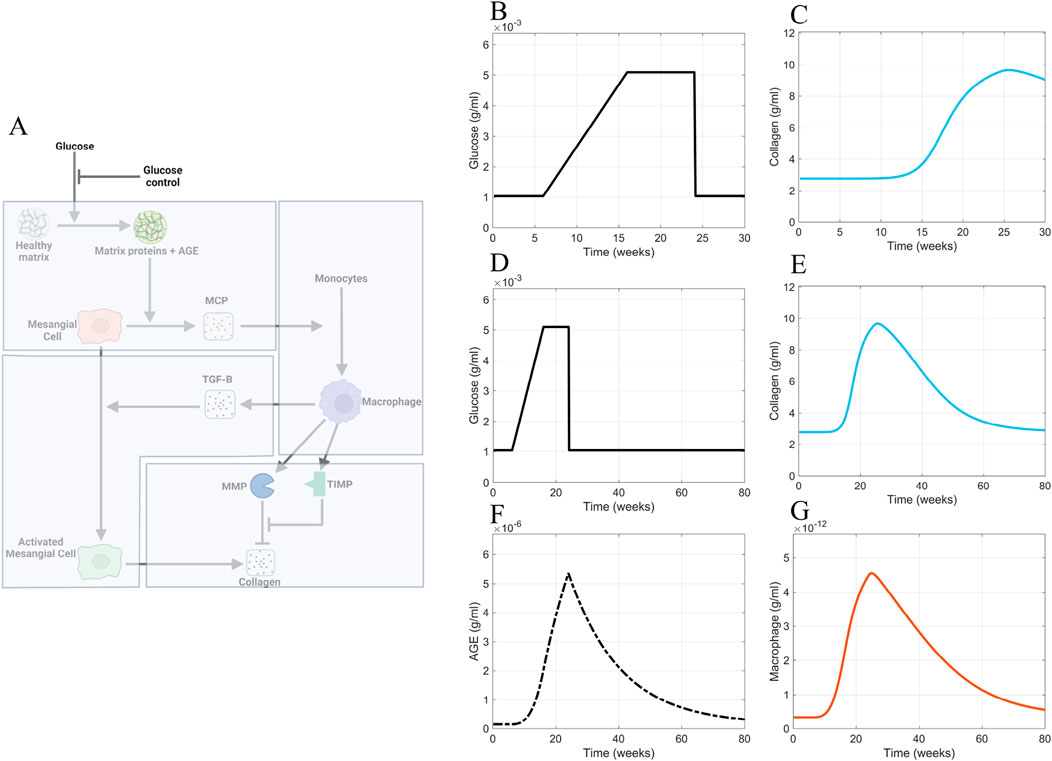
Figure 10. Glucose control results. (A) Non-shaded regions of the glomerular fibrosis network show changes to the model for the blood glucose control scenario (inhibition of glucose input). The effects of good blood glucose control on (B) glucose concentration and (C) collagen concentration in the short term. The effects of good blood glucose control on (D) glucose concentration, (E) collagen concentration, (F) AGE concentration, and (G) macrophage concentration in the long term. Panel A created with BioRender.com. Abbreviations: AGE, advanced glycation end products.
The continuously elevated AGE concentration caused the delayed recovery from fibrosis in the simulations. Although glucose concentration is immediately brought down to healthy-baseline levels (Figures 10B, D), the AGE concentration (Figure 10F) immediately downstream of glucose in the progression of fibrosis does not decrease to healthy baseline levels in the short term. Instead, a slow decline in the AGE concentration within the glomerulus is observed (Figure 10F). The continued elevated level of AGE causes a persistent stimulation of mesangial cells, which results in the persistent recruitment and accumulation of macrophages (Figure 10G). The accumulation of macrophages results in persistent glomerular fibrosis through the continued activation of mesangial cells, the source of the excess collagen (Figure 10E).
3.3 Inhibited AGE production scenario
Having determined that the continuously elevated AGE concentration is the cause of the delay in the recovery from glomerular fibrosis in our model, we sought to avert these elevated AGE levels. As our first approach, we inhibited the production of AGE (Figure 11). To implement this inhibition, the AGE equation (Equation 2) was modified to give Equation 13:
where an inhibition term
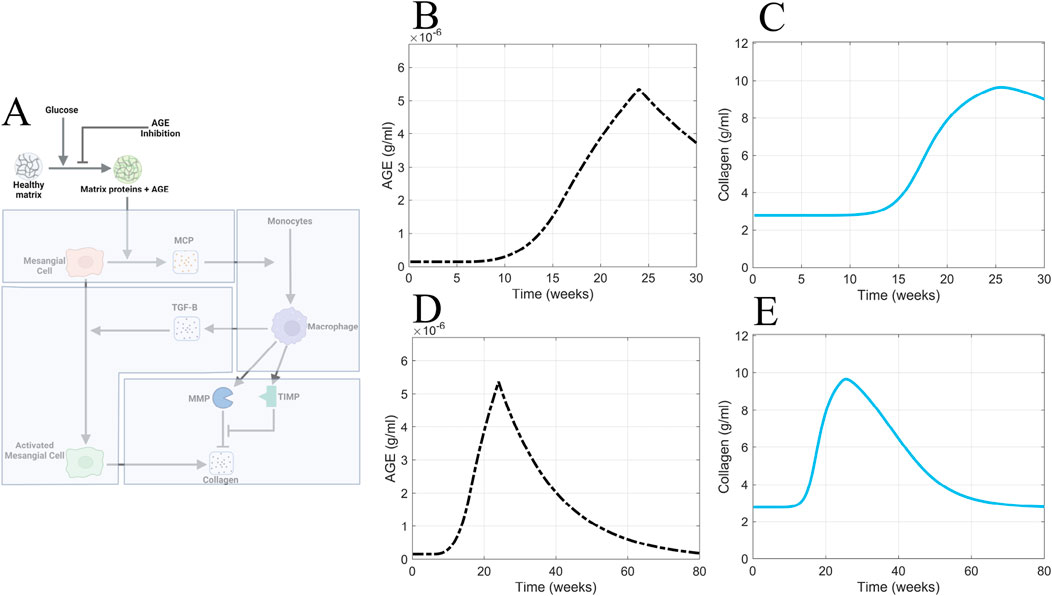
Figure 11. AGE inhibition is insufficient for accelerating recovery from glomerular fibrosis. (A) Non-shaded regions of the glomerular fibrosis network show changes to the model for the AGE inhibition scenario. The effects of inhibited AGE production on (B) AGE concentration and (C) collagen concentration in the short term. The effects of inhibited AGE production on (D) AGE concentration and (E) collagen concentration in the long term. Panel A created with BioRender.com. Abbreviations: AGE, advanced glycation end products.
Consistent with the other scenarios, inhibited AGE production was applied at 24 weeks (Figure 11A). Inhibited AGE production had little impact on glomerular fibrosis in the short term (Figure 11C) and took over 54 weeks for a complete reversal to occur, as seen in the long-term simulation (Figure 11E). Further, the dynamics of AGE in this scenario (Figures 11B, D) mirrored the dynamics of AGE in the glucose control scenario (Figure 10F), indicating that inhibited AGE production has the equivalent effect of applying glucose control. As such, its efficacy is limited and does not accelerate the recovery from glomerular fibrosis.
Inhibited AGE production is ineffective at immediately reversing glomerular fibrosis because glomerular fibrosis has developed at this point, and AGE is also significantly accumulated. Inhibited AGE production only prevents the further production of AGE and does not remove the already accumulated levels of AGE, thus delaying the recovery from glomerular fibrosis. Consequently, the best approach to accelerate recovery from fibrosis is to actively remove the already accumulated AGE from the system.
3.4 Enhanced AGE degradation scenario
To test the in silico hypothesis that active removal of AGE accelerates recovery from fibrosis, we simulated the model with enhanced removal of AGE from the system (Figure 12A).
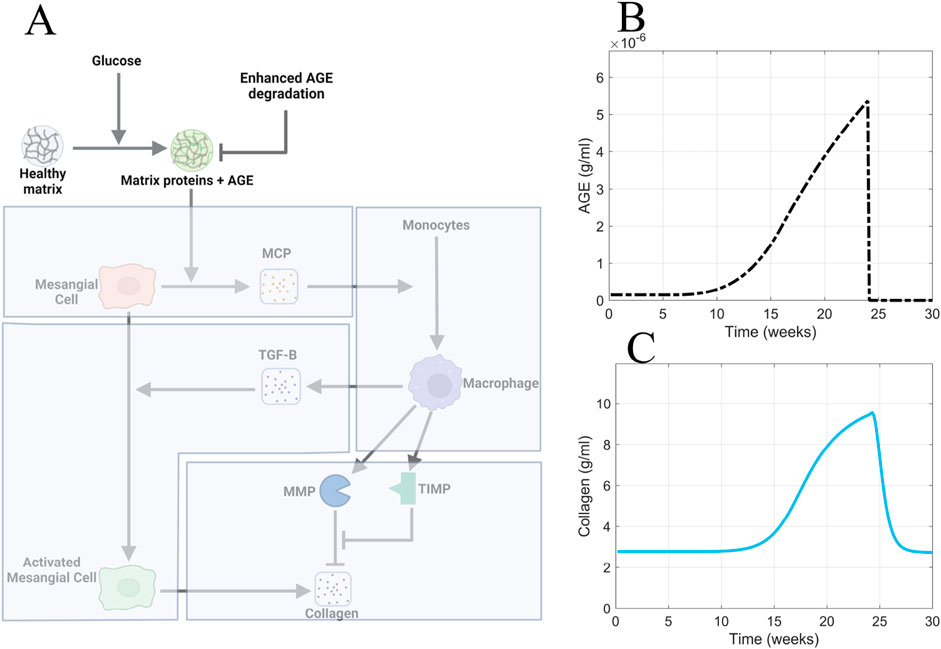
Figure 12. Enhanced AGE degradation is the most efficacious approach for accelerating recovery from glomerular fibrosis. (A) Non-shaded regions of the glomerular fibrosis network show changes to the model for the enhanced AGE degradation scenario. The effects of enhanced AGE degradation on (B) AGE concentration and (C) glomerular fibrosis in the short term. Panel A created with BioRender.com. Abbreviations: AGE, advanced glycation end products.
To implement the enhanced degradation of AGE, the AGE equation was modified to give Equation 14:
where the degradation term of AGE was multiplied by the term
4 Discussion
Using our model, we considered the effects of different treatment strategies for advanced glomerular fibrosis. Specifically, we asked why it takes so long to reverse the condition after glucose treatment.
Our model captured delayed recovery from advanced glomerular fibrosis when glucose control was applied (Figure 10D). This behavior was observed in patients with advanced glomerular fibrosis when glucose control via pancreatic transplant did not result in immediate recovery from fibrosis but took a long time (10 years) (Fioretto et al., 1998). The complete reversal of advanced glomerular fibrosis has not been shown in animal models, likely because the length of the studies is not long enough (Pugliese et al., 1997). The length of study for normoglycemia post-advanced glomerular fibrosis in the rat study by Pugliese et al. (1997) was a maximum of 4 months, during which no reversal of glomerular fibrosis was observed. However, non-advanced glomerular fibrosis has been shown to be at least partially reversible (Mauer et al., 1974; 1975; Lee et al., 1974; Steffes et al., 1980). Our model predicted that it should take around 1.25 years for a complete reversal of glomerular fibrosis to be observed (Figures 10E–G). Although we cannot compare this value to any data for a time to fully reverse advanced glomerular fibrosis in rodents, the value shows that it takes a long time for glomerular fibrosis to be reversed (Fioretto et al., 1998).
Our mechanistic explanation for why the reversal of advanced fibrosis takes a long time is that the slow degradation of AGE results in the persistent stimulation of mesangial cells and the continued recruitment of macrophages, which mediates the continued accumulation of collagen through the persistent activation of mesangial cells (Figure 10). The slow degradation of AGE, specifically CML, is well known. Diabetic rats that were given pancreatic transplants to achieve normoglycemia after having had diabetes for some time showed that the collagen glycated AGE content did not decrease even after 4 months of normoglycemia, regardless of whether glomerular fibrosis was in the early stage or advanced stage (Pugliese et al., 1997). Our model predicted a faster degradation of AGE (
Having found that the slow degradation of AGE is a cause for the delay in the reversal of fibrosis in our model, we attempted to accelerate the process by inhibiting AGE formation. We found that inhibition of AGE formation did little to accelerate recovery from fibrosis because long-lived AGE was still accumulated in the glomerulus. Aminoguanidine is a molecule that inhibits the formation of AGE and has been studied as a potential therapeutic for treating glomerular fibrosis. Although the efficacy of aminoguanidine on advanced glomerular fibrosis has not been studied, its effect on the development of glomerular fibrosis in diabetic rats has been studied (Kelly et al., 2001). The study found that aminoguanidine reduces TGF-
Our model predicted that the complete recovery from fibrosis with AGE formation inhibition takes 1.25 years, which means that not much recovery will be observed in a short-time frame. Clinical trials for AGE formation inhibitors, such as aminoguanidine, have had limited success (Bolton et al., 2004; Williams et al., 2007; Rabbani et al., 2009). One reason could be that once glomerular fibrosis has developed, inhibiting AGE formation is not an effective strategy to reverse glomerular fibrosis quickly. Since these clinical trials do not run for long periods, the efficacy observed could be small and not statistically significant.
The approach that we determined is the most productive at quickly reversing advanced glomerular fibrosis is the active removal of the long-lived AGE from the glomerulus. Alagebrium, an AGE crosslink breaker capable of breaking down long-lived AGE such as CML, has been studied as a potential therapeutic target for treating glomerular fibrosis. A study on diabetic rats showed that the early treatment of these rats (16 weeks into diabetes) with alagebrium for 16 weeks was able to reverse glomerular fibrosis almost to normal levels and also reduce the long-lived AGE, TGF-
A phenomenon our model did not seek to replicate is the different responses to treatment between early and advanced glomerular fibrosis. Early treatment of glomerular fibrosis, such as 4 months after the development of diabetes, has been shown to be fully reversible within 4 months of normoglycemia (Pugliese et al., 1997) and late treatment of glomerular fibrosis (8 months post-induction of diabetes) has been shown to be not reversible with 4 months of treatment (Pugliese et al., 1997). A similar pattern has been observed when AGE crosslink breaker alagebrium was used. The investigators observed that early treatment (4 months post diabetes) reversed the glomerular fibrosis, but late treatment (6 months post diabetes) did not (Forbes et al., 2003). A potential explanation for the different responses to treatment is that the early and late stages of glomerular fibrosis occur via other mechanisms. Possibly, short-lived AGE mediates the early development of glomerular fibrosis, and long-lived AGE mediates the late development of fibrosis. Thus, early glomerular fibrosis is reversible because short-lived AGE is quickly removed from the glomerulus due to the short half-life. In contrast, late glomerular fibrosis is not quickly reversible due to the long half-lives of long-lived AGE. This hypothesized mechanism could be explored in future iterations of the model.
A limitation of the model is that portions of the model are fitted to datasets containing only two experimental values (as shown in Figure 3C; Figure 7C), which can impact the ability of the model to capture the shape of the experimental data. Due to the scarcity of experimental data of activated mesangial cell population and AGE concentration within the glomeruli of db/db mice, we were not able to find more than two data points for these quantities. In the future, as more experimental data becomes available, additional data points can be incorporated into the model to reduce model uncertainty. Additionally, the applicability of the model to predict glomerular damage in humans is limited since all the data used to parameterize the model were from db/db mice or rodent cell cultures. However, as more data on glomerular fibrosis in humans becomes available, future work will aim to refine the model parameters to better account for interspecies differences and improve its applicability.
5 Conclusion
We developed a computational model of glomerular fibrosis in diabetes to understand the current lack of therapeutic efficacy and to propose more efficacious therapeutic approaches. Our model recapitulates the experimentally observed phenomenon that good blood glucose control does not lead to immediate recovery from glomerular fibrosis in diabetes. We determined using our model that good glucose control is not immediately efficacious due to the accumulation of AGE and slow removal from the system. We further proposed and simulated the more efficacious treatment approach of enhanced AGE degradation, which theoretically accelerates the recovery from glomerular fibrosis.
Data availability statement
The original contributions presented in the study are included in the article/Supplementary Material, further inquiries can be directed to the corresponding author.
Author contributions
HT: Conceptualization, Data curation, Formal Analysis, Investigation, Methodology, Visualization, Writing–original draft, Writing–review and editing. AF: Conceptualization, Formal Analysis, Funding acquisition, Methodology, Project administration, Resources, Supervision, Writing–review and editing.
Funding
The author(s) declare that financial support was received for the research, authorship, and/or publication of this article. This material is based upon work supported by the National Science Foundation under Grant No. 2133411 and resources from the University at Buffalo.
Acknowledgments
We thank Dr. Stelios T. Andreadis, Dr. Rudiyanto Gunawan, and Dr. Mohammad Aminul Islam from the University at Buffalo for discussions about the model and lab members, particularly Eduardo A. Chacin Ruiz and Krutika Patidar, for their thorough feedback on the manuscript.
Conflict of interest
The authors declare that the research was conducted in the absence of any commercial or financial relationships that could be construed as a potential conflict of interest.
Publisher’s note
All claims expressed in this article are solely those of the authors and do not necessarily represent those of their affiliated organizations, or those of the publisher, the editors and the reviewers. Any product that may be evaluated in this article, or claim that may be made by its manufacturer, is not guaranteed or endorsed by the publisher.
Supplementary material
The Supplementary Material for this article can be found online at: https://www.frontiersin.org/articles/10.3389/fphar.2024.1481768/full#supplementary-material
References
Abbas, G., Al-Harrasi, A. S., Hussain, H., Hussain, J., Rashid, R., and Choudhary, M. I. (2016). Antiglycation therapy: discovery of promising antiglycation agents for the management of diabetic complications. Pharm. Biol. 54, 198–206. doi:10.3109/13880209.2015.1028080
Ayo, S. H., Radnik, R. A., Garoni, J. A., Glass, W. F., and Kreisberg, J. I. (1990). High glucose causes an increase in extracellular matrix proteins in cultured mesangial cells. Am. J. Pathology 136, 1339–1348.
Ayo, S. H., Radnik, R. A., Glass, W. F., Garoni, J. A., Rampt, E. R., Appling, D. R., et al. (1991). Increased extracellular matrix synthesis and mRNA in mesangial cells grown in high-glucose medium. Am. J. Physiology Ren. Physiology 260, F185–F191. doi:10.1152/ajprenal.1991.260.2.f185
Baccora, M. H., Cortes, P., Hassett, C., Taube, D. W., and Yee, J. (2007). Effects of long-term elevated glucose on collagen formation by mesangial cells. Kidney Int. 72, 1216–1225. doi:10.1038/sj.ki.5002517
Bolton, W. K., Cattran, D. C., Williams, M. E., Adler, S. G., Appel, G. B., Cartwright, K., et al. (2004). Randomized trial of an inhibitor of formation of advanced glycation end products in diabetic nephropathy. Am. J. Nephrol. 24, 32–40. doi:10.1159/000075627
Brings, S., Fleming, T., Freichel, M., Muckenthaler, M. U., Herzig, S., and Nawroth, P. P. (2017). Dicarbonyls and advanced glycation end-products in the development of diabetic complications and targets for intervention. Int. J. Mol. Sci. 18, 984. doi:10.3390/ijms18050984
Chen, H. Y., Zhong, X., Huang, X. R., Meng, X. M., You, Y., Chung, A. C., et al. (2014). MicroRNA-29b inhibits diabetic nephropathy in db/db mice. Mol. Ther. 22, 842–853. doi:10.1038/mt.2013.235
Chen, S., Iglesias-de la Cruz, M. C., Jim, B., Hong, S. W., Isono, M., and Ziyadeh, F. N. (2003). Reversibility of established diabetic glomerulopathy by anti-TGF- antibodies in db/db mice. Biochem. Biophysical Res. Commun. 300, 16–22. doi:10.1016/S0006-291X(02)02708-0
Choi, S. R., Lim, J. H., Kim, M. Y., Kim, E. N., Kim, Y., Choi, B. S., et al. (2018). Adiponectin receptor agonist AdipoRon decreased ceramide, and lipotoxicity, and ameliorated diabetic nephropathy. Metabolism Clin. Exp. 85, 348–360. doi:10.1016/j.metabol.2018.02.004
Cohen, M. P., Lautenslager, G. T., and Shearman, C. W. (2001). Increased urinary type IV collagen marks the development of glomerular pathology in diabetic d/db mice. Metabolism Clin. Exp. 50, 1435–1440. doi:10.1053/meta.2001.28074
Cohen, M. P., Sharma, K., Jin, Y., Hud, E., Wu, V. Y., Tomaszewski, J., et al. (1995). Prevention of diabetic nephropathy in db/db mice with glycated albumin antagonists. A novel treatment strategy. J. Clin. Investigation 95, 2338–2345. doi:10.1172/JCI117926
Cohen, M. P., Ziyadeh, F. N., Soon, W. H., Shearman, C. W., Hud, E., Lautenslager, G. T., et al. (2002). Inhibiting albumin glycation in vivo ameliorates glomerular overexpression of TGF-1. Kidney Int. 61, 2025–2032. doi:10.1046/j.1523-1755.2002.00352.x
Cook, C. V., Islam, M. A., Smith, B. J., and Ford Versypt, A. N. (2022). Mathematical modeling of the effects of Wnt-10b on bone metabolism. AIChE J. 68, e17809. doi:10.1002/aic.17809
Cook, C. V., Lighty, A. M., Smith, B. J., and Ford Versypt, A. N. (2024). A review of mathematical modeling of bone remodeling from a systems biology perspective. Front. Syst. Biol. 4, 1368555. doi:10.3389/fsysb.2024.1368555
Deng, Y., Li, N., Wu, Y., Wang, M., Yang, S., Zheng, Y., et al. (2021). Global, regional, and national burden of diabetes-related chronic kidney disease from 1990 to 2019. Front. Endocrinol. 12, 672350. doi:10.3389/fendo.2021.672350
Do, M. H., Hur, J., Choi, J., Kim, Y., Park, H. Y., and Ha, S. K. (2018). Spatholobus suberectus ameliorates diabetes-induced renal damage by suppressing advanced glycation end products in db/db mice. Int. J. Mol. Sci. 19, 2774. doi:10.3390/ijms19092774
Doan, V. M., Chen, C., Lin, X., Nguyen, V. P., Nong, Z., Li, W., et al. (2015). Yulangsan polysaccharide improves redox homeostasis and immune impairment in D-galactose-induced mimetic aging. Food Funct. 6, 1712–1718. doi:10.1039/c5fo00238a
Drzewoski, J., Kasznicki, J., and Trojanowski, Z. (2009). The role of “metabolic memory”’ in the natural history of diabetes mellitus. Pol. Arch. Med. Wewnetrznej 119, 493–500. doi:10.20452/pamw.747
Fioretto, P., Steffes, M. W., Sutherland, D. E., Goetz, F. C., and Mauer, M. (1998). Reversal of lesions of diabetic nephropathy after pancreas transplantation. N. Engl. J. Med. 339, 69–75. doi:10.1056/.NEJM199807093390202
Forbes, J. M., Thallas, V., Thomas, M. C., Founds, H. W., Burns, W. C., Jerums, G., et al. (2003). The breakdown of pre-existing advanced glycation end products is associated with reduced renal fibrosis in experimental diabetes. FASEB J. 17, 1762–1764. doi:10.1096/fj.02-1102fje
Fu, R.-G., Wu, J.-J., Xue, R.-L., Zhang, T., Wang, L., Wu, X.-L., et al. (2013). Premature senescence and cellular phenotype transformation of mesangial cells induced by TGF-B1. Ren. Fail. 35, 1142–1145. doi:10.3109/0886022X.2013.817279
Gineyts, E., Cloos, P. A. C., Borel, O., Grimaud, L., Delmas, P. D., and Garnero, P. (2000). Racemization and isomerization of type I collagen C-telopeptides in human bone and soft tissues: assessment of tissue turnover. Biochem. J. 345, 481–485. doi:10.1042/0264-6021:3450481
Guedes, M., and Pecoits-Filho, R. (2022). Can we cure diabetic kidney disease? Present and future perspectives from a nephrologist’s point of view. J. Intern. Med. 291, 165–180. doi:10.1111/joim.13424
Haneda, M., Kikkawa, R., Horide, N., Togawa, M., Koya, D., Kajiwara, N., et al. (1991). Glucose enhances type IV collagen production in cultured rat glomerular mesangial cells. Diabetologia 34, 198–200. doi:10.1007/BF00418276
Hao, W., Marsh, C., and Friedman, A. (2015). A mathematical model of idiopathic pulmonary fibrosis. PloS One 10, e0135097. doi:10.1371/journal.pone.0135097
Hao, W., Rovin, B., and Friedman, A. (2014). Mathematical model of renal interstitial fibrosis. Proc. Natl. Acad. Sci. U. S. A. 111, 14193–14198. doi:10.1073/pnas.1413970111
Hong, S. W., Isono, M., Chen, S., Iglesias-De La Cruz, M. C., Han, D. C., and Ziyadeh, F. N. (2001). Increased glomerular and tubular expression of transforming growth factor-beta1, its type II receptor, and activation of the Smad signaling pathway in the db/db mouse. Am. J. Pathology 158, 1653–1663. doi:10.1016/s0002-9440(10)64121-1
Hong, Y. A., Lim, J. H., Kim, M. Y., Kim, T. W., Kim, Y., Yang, K. S., et al. (2014). Fenofibrate improves renal lipotoxicity through activation of AMPK-PGC-1α in db/db mice. PloS One 9, e96147. doi:10.1371/journal.pone.0096147
Hwang, S. D., Song, J. H., Kim, Y., Lim, J. H., Kim, M. Y., Kim, E. N., et al. (2019). Inhibition of lymphatic proliferation by the selective VEGFR-3 inhibitor SAR131675 ameliorates diabetic nephropathy in db/db mice. Cell Death Dis. 10, 219. doi:10.1038/s41419-019-1436-1
Iacobini, C., Menini, S., Blasetti Fantauzzi, C., Pesce, C. M., Giaccari, A., Salomone, E., et al. (2018). FL-926-16, a novel bioavailable carnosinase-resistant carnosine derivative, prevents onset and stops progression of diabetic nephropathy in db/db mice. Br. J. Pharmacol. 175, 53–66. doi:10.1111/bph.14070
Ichinose, K., Maeshima, Y., Yamamoto, Y., Kinomura, M., Hirokoshi, K., Kitayama, H., et al. (2006). 2-(8-Hydroxy-6-methoxy-1-oxo-1H-2-benzopyran-3-yl) propionic acid, an inhibitor of angiogenesis, ameliorates renal alterations in obese type 2 diabetic mice. Diabetes 55, 1232–1242. doi:10.2337/db05-1367
Islam, M. A., Cook, C. V., Smith, B. J., and Ford Versypt, A. N. (2021). Mathematical modeling of the gut-bone axis and implications of butyrate treatment on osteoimmunology. Industrial Eng. Chem. Res. 60, 17814–17825. doi:10.1021/acs.iecr.1c02949
Islam, M. A., Getz, M., Macklin, P., and Ford Versypt, A. N. (2023). An agent-based modeling approach for lung fibrosis in response to covid-19. PloS Comput. Biol. 19, 10117411–e1011827. doi:10.1371/journal.pcbi.1011741
Johnson, R. J., Fboege, J., Yoshimura, A., Lida, H., Couser, W. G., and Alpers, C. E. (1992). The activated mesangial cell: a glomerular “myofibroblast”. J. Am. Soc. Nephrol. 190, S190–S197. doi:10.1681/ASN.V210s190
Kelly, D. J., Gilbert, R. E., Cox, A. J., Soulis, T., Jerums, G., and Cooper, M. E. (2001). Aminoguanidine ameliorates overexpression of prosclerotic growth factors and collagen deposition in experimental diabetic nephropathy. J. Am. Soc. Nephrol. 12, 2098–2107. doi:10.1681/asn.v12102098
Kim, M. Y., Lim, J. H., Youn, H. H., Hong, Y. A., Yang, K. S., Park, H. S., et al. (2013). Resveratrol prevents renal lipotoxicity and inhibits mesangial cell glucotoxicity in a manner dependent on the AMPK-SIRT1-PGC1α axis in db/db mice. Diabetologia 56, 204–217. doi:10.1007/s00125-012-2747-2
Kim, Y., Lim, J. H., Kim, M. Y., Kim, E. N., Yoon, H. E., Shin, S. J., et al. (2018). The adiponectin receptor agonist AdipoRon ameliorates diabetic nephropathy in a model of type 2 diabetes. J. Am. Soc. Nephrol. 29, 1108–1127. doi:10.1681/ASN.2017060627
Kolavennu, V., Zeng, L., Peng, H., Wang, Y., and Daneshi, F. R. (2008). Targeting of RhoA/ROCK signaling ameliorates progression of diabetic nephropathy independent of glucose control. Diabetes 57, 714–723. doi:10.2337/db07-1241
Kosugi, T., Nakayama, T., Li, Q., Chiodo, V. A., Zhang, L., Campbell-Thompson, M., et al. (2010). Soluble Flt-1 gene therapy ameliorates albuminuria but accelerates tubulointerstitial injury in diabetic mice. Am. J. Physiology Ren. Physiology 298, 609–616. doi:10.1152/ajprenal.00377.2009
Koya, D., Haneda, M., Nakagawa, H., Isshiki, K., Sato, H., Maeda, S., et al. (2000). Amelioration of accelerated diabetic mesangial expansion by treatment with a PKC inhibitor in diabetic db/db mice, a rodent model for type 2 diabetes. FASEB J. 14, 439–447. doi:10.1096/fasebj.14.3.439
Lassila, M., Seah, K. K., Allen, T. J., Thallas, V., Thomas, M. C., Candido, R., et al. (2004). Accelerated nephropathy in diabetic apolipoprotein E-knockout mouse: role of advanced glycation end products. J. Am. Soc. Nephrol. 15, 2125–2138. doi:10.1097/01.ASN.0000133025.23732.46
Lee, C. S., Mauer, S. M., Brown, D. M., Sutherland, D. E., Michael, A. F., and Najarian, J. S. (1974). Renal transplantation in diabetes mellitus in rats. J. Exp. Med. 139, 793–800. doi:10.1084/jem.139.4.793
Li, H., Rong, P., Ma, X., Nie, W., Chen, Y., Zhang, J., et al. (2020). Mouse umbilical cord mesenchymal stem cell paracrine alleviates renal fibrosis in diabetic nephropathy by reducing myofibroblast transdifferentiation and cell proliferation and upregulating MMPs in mesangial cells. J. Diabetes Res. 2020, 3847171. doi:10.1155/2020/3847171
Liu, Y. (2006). Renal fibrosis: new insights into the pathogenesis and therapeutics. Kidney Int. 69, 213–217. doi:10.1038/sj.ki.5000054
Lu, C., He, J. C., Cai, W., Liu, H. I., Zhu, L., and Vlassara, H. (2004). Advanced glycation endproduct (AGE) receptor 1 is a negative regulator of the inflammatory response to AGE in mesangial cells. Proc. Natl. Acad. Sci. U. S. A. 101, 11767–11772. doi:10.1073/pnas.0401588101
Mauer, S., Sutherland, D., Steffes, M., Leonard, R., Najarian, J., Michael, A., et al. (1974). Pancreatic islet transplantation: effects on the glomerular lesions of experimental diabetes in the rat. Diabetes 23, 748–753. doi:10.2337/diab.23.9.748
Mauer, S. M., Steffes, M. W., Sutherland, D. E., Najarian, S., Michael, A. F., and Brown, D. M. (1975). Studies of the rate of regression of the glomerular lesions in diabetic rats treated with pancreatic islet transplantation. Diabetes 24, 280–285. doi:10.2337/diab.24.3.280
McLennan, S. V., Fisher, E. J., Yue, D. K., and Turtle, J. R. (1994). High glucose concentration causes a decrease in mesangium degradation: a factor in the pathogenesis of diabetic nephropathy. Diabetes 43, 1041–1045. doi:10.2337/diab.43.8.1041
McLennan, S. V., Martell, S. Y., and Yue, D. K. (2000). High glucose concentration inhibits the expression of membrane type metalloproteinase by mesangial cells: possible role in mesangium accumulation. Diabetologia 43, 642–648. doi:10.1007/s001250051353
Menini, S., Iacobini, C., de Latouliere, L., Manni, I., Ionta, V., Blasetti Fantauzzi, C., et al. (2018). The advanced glycation end-product N-carboxymethyllysine promotes progression of pancreatic cancer: implications for diabetes-associated risk and its prevention. J. Pathology 245, 197–208. doi:10.1002/path.5072
Min, D., Lyons, J. G., Bonner, J., Twigg, S. M., Yue, D. K., and McLennan, S. V. (2009). Mesangial cell-derived factors alter monocyte activation and function through inflammatory pathways: possible pathogenic role in diabetic nephropathy. Am. J. Physiology Ren. Physiology 297, 1229–1237. doi:10.1152/ajprenal.00074.2009
Oh, J. H., Ha, H., Yu, M. R., and Lee, H. B. (1998). Sequential effects of high glucose on mesangial cell transforming growth factor-1 and fibronectin synthesis. Kidney Int. 54, 1872–1878. doi:10.1046/j.1523-1755.1998.00193.x
Park, H. S., Lim, J. H., Kim, M. Y., Kim, Y., Hong, Y. A., Choi, S. R., et al. (2016). Resveratrol increases AdipoR1 and AdipoR2 expression in type 2 diabetic nephropathy. J. Transl. Med. 14, 176. doi:10.1186/s12967-016-0922-9
Patidar, K., and Ford Versypt, A. N. (2023). Logic-based modeling of inflammatory macrophage crosstalk with glomerular endothelial cells in diabetic kidney disease. bioRxiv Prepr. doi:10.1101/2023.04.04.535594
Pillai, A., and Fulmali, D. (2023). A narrative review of new treatment options for diabetic nephropathy. Cureus 2, e33235–e33237. doi:10.7759/cureus.33235
Pugliese, G., Pricci, F., Pesce, C., Romeo, G., Lenti, E., Caltabiano, V., et al. (1997). Early, but not advanced, glomerulopathy is reversed by pancreatic islet transplants in experimental diabetic rats: correlation with glomerular extracellular matrix mRNA levels. Diabetes 46, 1198–1206. doi:10.2337/diab.46.7.1198
Rabbani, N., Alam, S. S., Riaz, S., Larkin, J. R., Akhtar, M. W., Shafi, T., et al. (2009). High-dose thiamine therapy for patients with type 2 diabetes and microalbuminuria: a randomised, double-blind placebo-controlled pilot study. Diabetologia 52, 208–212. doi:10.1007/s00125-008-1224-4
Rabbani, N., and Thornalley, P. J. (2018). “Glycation- and/or polyol pathway-inducing complications,” in Encyclopedia of endocrine diseases (Academic Press), 170–179. doi:10.1016/B978-0-12-801238-3.03829-0
Rikard, S. M., Athey, T. L., Nelson, A. R., Christiansen, S. L., Lee, J. J., Holmes, J. W., et al. (2019). Multiscale coupling of an agent-based model of tissue fibrosis and a logic-based model of intracellular signaling. Front. Physiology 10, 1481. doi:10.3389/fphys.2019.01481
Ruggiero, S. M., Pilvankar, M. R., and Ford Versypt, A. N. (2017). Mathematical modeling of tuberculosis granuloma activation. Processes 5, 79. doi:10.3390/pr5040079
Sáez, P., Peña, E., Ángel Martínez, M., and Kuhl, E. (2013). Mathematical modeling of collagen turnover in biological tissue. J. Math. Biol. 67, 1765–1793. doi:10.1007/s00285-012-0613-y
Saito, D., Maeshima, Y., Nasu, T., Yamasaki, H., Abe, K., Sugiyama, H., et al. (2011). Amelioration of renal alterations in obese type 2 diabetic mice by vasohibin-1, a negative feedback regulator of angiogenesis. Am. J. Physiology Ren. Physiology 300, 873–886. doi:10.1152/ajprenal.00503.2010
Simonson, M. (2007). Phenotypic transitions and fibrosis in diabetic nephropathy. Kidney Int. 71, 846–854. doi:10.1038/sj.ki.5002180
Singh, V. P., Bali, A., Singh, N., and Jaggi, A. S. (2014). Advanced glycation end products and diabetic complications. Korean J. Physiology and Pharmacol. 18, 1–14. doi:10.4196/kjpp.2014.18.1.1
Sohn, E., Kim, J., Kim, C. S., Lee, Y. M., Jo, K., Shin, S. D., et al. (2013). The extract of litsea japonica reduced the development of diabetic nephropathy via the inhibition of advanced glycation end products accumulation in db/db mice. Evidence-based Complementary Altern. Med. 2013, 769416. doi:10.1155/2013/769416
Steffes, M. W., Brown, D. M., Basgen, J. M., and Mauer, S. M. (1980). Amelioration of mesangial volume and surface alterations following islet transplantation in diabetic rats. Diabetes 29, 509–515. doi:10.2337/diab.29.7.509
Sun, M., Li, Y., Bu, W., Zhao, J., Zhu, J., Gu, L., et al. (2017). DJC suppresses advanced glycation end products-induced JAK-STAT signaling and ROS in mesangial cells. Evidence-based Complementary Altern. Med. 2017, 2942830–2942837. doi:10.1155/2017/2942830
Sutariya, B., Jhonsa, D., and Saraf, M. N. (2016). TGF-β: the connecting link between nephropathy and fibrosis. Immunopharmacol. Immunotoxicol. 38, 39–49. doi:10.3109/08923973.2015.1127382
Terami, N., Ogawa, D., Tachibana, H., Hatanaka, T., Wada, J., Nakatsuka, A., et al. (2014). Long-term treatment with the sodium glucose cotransporter 2 inhibitor, dapagliflozin, ameliorates glucose homeostasis and diabetic nephropathy in db/db mice. PloS One 9, 1007777–e100813. doi:10.1371/journal.pone.0100777
Testa, R., Bonfigli, A. R., Prattichizzo, F., La Sala, L., De Nigris, V., and Ceriello, A. (2017). The “metabolic memory” theory and the early treatment of hyperglycemia in prevention of diabetic complications. Nutrients 9, 437. doi:10.3390/nu9050437
Thomas, H. Y., and Ford Versypt, A. N. (2022). Pathophysiology of mesangial expansion in diabetic nephropathy: mesangial structure, glomerular biomechanics, and biochemical signaling and regulation. J. Biol. Eng. 16, 19. doi:10.1186/s13036-022-00299-4
Tilahun, H. G., Mullagura, H. N., Humphrey, J. D., and Baek, S. (2023). A biochemomechanical model of collagen turnover in arterial adaptations to hemodynamic loading. Biomechanics Model. Mechanobiol. 22, 2063–2082. doi:10.1007/s10237-023-01750-1
Toprak, C., and Yigitaslan, S. (2019). Alagebrium and complications of diabetes mellitus. Eurasian J. Med. 51, 285–292. doi:10.5152/eurasianjmed.2019.18434
Vempati, P., Karagiannis, E. D., and Popel, A. S. (2007). A biochemical model of matrix metalloproteinase 9 activation and inhibition. J. Biol. Chem. 282, 37585–37596. doi:10.1074/jbc.M611500200
Wahab, N. A., and Mason, R. M. (1996). Modulation of neutral protease expression in human mesangial cells by hyperglycaemic culture. Biochem. J. 320, 777–783. doi:10.1042/bj3200777
Wang, X., Shen, E., Wang, Y., Li, J., Cheng, D., Chen, Y., et al. (2016). Cross talk between miR-214 and PTEN attenuates glomerular hypertrophy under diabetic conditions. Sci. Rep. 6, 31506–31511. doi:10.1038/srep31506
Williams, M. E., Bolton, W. K., Khalifah, R. G., Degenhardt, T. P., Schotzinger, R. J., and McGill, J. B. (2007). Effects of pyridoxamine in combined phase 2 studies of patients with type 1 and type 2 diabetes and overt nephropathy. Am. J. Nephrol. 27, 605–614. doi:10.1159/000108104
Xu, Y., and Guo, H. (2017). Role of advanced glycation end products in the progression of diabetes mellitus. Glob. J. Obes. Diabetes Metabolic Syndrome 4, 024–035. doi:10.17352/2455-8583.000019
Yamagishi, S. I., Inagaki, Y., Okamoto, T., Amano, S., Koga, K., Takeuchi, M., et al. (2002). Advanced glycation end product-induced apoptosis and overexpression of vascular endothelial growth factor and monocyte chemoattractant protein-1 in human-cultured mesangial cells. J. Biol. Chem. 277, 20309–20315. doi:10.1074/jbc.M202634200
Yamazaki, T., Mimura, I., Tanaka, T., and Nangaku, M. (2021). Treatment of diabetic kidney disease: current and future. Diabetes and Metabolism J. 45, 11–26. doi:10.4093/dmj.2020.0217
Yuan, Y., Sun, H., and Sun, Z. (2017). Advanced glycation end products (AGEs) increase renal lipid accumulation: a pathogenic factor of diabetic nephropathy (DN). Lipids Health Dis. 16, 126–129. doi:10.1186/s12944-017-0522-6
Zhang, Q., Yang, M., Xiao, Y., Han, Y., Yang, S., and Sun, L. (2021). Towards better drug repositioning: targeted immunoinflammatory therapy for diabetic nephropathy. Curr. Med. Chem. 28, 1003–1024. doi:10.2174/0929867326666191108160643
Ziyadeh, F. N., Hoffman, B. B., Han, D. C., Iglesias-De La Cruz, M. C., Hong, S. W., Isono, M., et al. (2000). Long-term prevention of renal insufficiency, excess matrix gene expression, and glomerular mesangial matrix expansion by treatment with monoclonal antitransforming growth factor-antibody in db/db diabetic mice. Proc. Natl. Acad. Sci. U. S. A. 97, 8015–8020. doi:10.1073/pnas.120055097
Keywords: kidney fibrosis, advanced glycation end products, mesangial cells (MCs), systems pharmacology, systems biology, metabolic memory effect, macrophages, diabetic nephropathy
Citation: Thomas HY and Ford Versypt AN (2024) A mathematical model of glomerular fibrosis in diabetic kidney disease to predict therapeutic efficacy. Front. Pharmacol. 15:1481768. doi: 10.3389/fphar.2024.1481768
Received: 16 August 2024; Accepted: 14 October 2024;
Published: 25 October 2024.
Edited by:
James Costello, University of Colorado Anschutz Medical Campus, United StatesReviewed by:
Nicholas A. Graham, University of Southern California, Los Angeles, United StatesOwen Richfield, Yale University, United States
Copyright © 2024 Thomas and Ford Versypt. This is an open-access article distributed under the terms of the Creative Commons Attribution License (CC BY). The use, distribution or reproduction in other forums is permitted, provided the original author(s) and the copyright owner(s) are credited and that the original publication in this journal is cited, in accordance with accepted academic practice. No use, distribution or reproduction is permitted which does not comply with these terms.
*Correspondence: Ashlee N. Ford Versypt, YXNobGVlZnZAYnVmZmFsby5lZHU=
 Haryana Y. Thomas
 Ashlee N. Ford Versypt