Abstract
Herbal medicines (HMs) have long played a pivotal role in preventing and treating various human diseases and have been studied widely. However, the complexities present in HM metabolites and their unclear mechanisms of action have posed significant challenges in the modernization of traditional Chinese medicine (TCM). Over the past two decades, mass spectrometry imaging (MSI) has garnered increasing attention as a robust analytical technique that enables the simultaneous execution of qualitative, quantitative, and localization analyses without complex sample pretreatment. With advances in technical solutions, MSI has been extensively applied in the field of HMs. MSI, a label-free ion imaging technique can comprehensively map the spatial distribution of HM metabolites in plant native tissues, thereby facilitating the effective quality control of HMs. Furthermore, the spatial dimension information of small molecule endogenous metabolites within animal tissues provided by MSI can also serve as a supplement to uncover pharmacological and toxicological mechanisms of HMs. In the review, we provide an overview of the three most common MSI techniques. In addition, representative applications in HM are highlighted. Finally, we discuss the current challenges and propose several potential solutions. We hope that the summary of recent findings will contribute to the application of MSI in exploring metabolites and mechanisms of action of HMs.

1 Introduction
Herbal medicines (HM), an essential component of traditional Chinese medicine (TCM), are used extensively in China and have garnered global attention for its beneficial effects and safety (Liu H. et al., 2023). Most bioactive compounds present in HMs are derived from secondary metabolites synthesized by medicinal plants, which play a key role in the therapeutic effects of HM by regulating various pathological processes within the biological system (Sturtevant et al., 2016; Gong et al., 2024). Natural herbal metabolites also serve as important resources for novel drug discovery (Hou J. J. et al., 2022). For example, artemisinin, an active antimalarial substance extracted from the botanical drug Artemisiae Annua Herba (the dried aboveground part of Artemisia annua L.), has highlighted the leading role of TCM in modern medicine (Tu, 2016). Nevertheless, HM is a complicated group containing diverse compounds that act simultaneously on multiple targets and pathways (Zhou et al., 2021). This inevitably leads to the uncertainty and complexity of the material basis and mechanisms of action of HM. Hence, efficient and convenient analytical approaches are required to delineate the roles of HM metabolites.
By convention, the compound analysis of HM extracts is implemented following homogenization, using common analytical methods, such as thin layer chromatography, liquid chromatography (LC), gas chromatography (GC), and mass spectrometry (MS) (Jiang H. et al., 2022). In general, LC–MS and GC–MS are two routine analytical tools allowing for qualitative and quantitative analysis of a wide range of metabolites. However, these methods often entail complex sample pretreatment (i.e., extraction, separation, and purification), which can inevitably damage unstable components. During extraction, analytes may be diluted beyond the minimum detection limit (Dong and Aharoni, 2022). More importantly, the importance of spatial distribution of metabolites in heterogeneous tissues or cells is ignored, thus hindering a comprehensive understanding of metabolites and intervention mechanisms of HMs.
Mass spectrometry imaging (MSI) has recently emerged as a powerful technique that overcomes the disadvantages of traditional analytical methods. By integrating MS analysis with ion imaging, MSI can enable precise characterization of their structural features, relative contents, and spatial distribution on the tissue surfaces (Zou et al., 2022; Ren et al., 2023). The useful technique complements traditional metabolomics and chemical analysis by integrating qualitative and quantitative molecular data with spatial information, thereby offering a more comprehensive understanding. Although the currently established molecular imaging technologies, such as computed tomography, Raman imaging, fluorescence imaging, and Magnetic Resonance Imaging, also enable in situ detection of metabolites (Kuzma et al., 2021), few imaging technologies can detect thousands of molecules simultaneously on a label-free basis. As a label-free ion imaging technique, MSI allows for simultaneous visualization of hundreds of analytes of interest, without prior knowledge of the metabolites present in a sample (Baijnath et al., 2022). In comparison to traditional analytical methods, MSI is characterized by high sensitivity, throughput, and spatial resolution, making it possible to spatially locate numerous endogenous and exogenous metabolites and toxic molecules without the need for solvent extraction processes (Pareek et al., 2020; Thomen et al., 2020). Therefore, MSI, as a powerful and complementary approach, has been applied extensively across scientific fields, including nutrition sciences (Yukihiro and Zaima, 2020), pharmaceutical development (Schulz et al., 2019), and clinical research (Djambazova et al., 2023; Kumar, 2023).
MSI was initially developed to visualize biomolecules (lipids, proteins/peptides, drugs, and their metabolites) in animal tissues. Given its inherent advantages, MSI has attracted considerable attention in recent years and has been expanded to the field of HMs, as first proposed by Sumner et al. at the Joint Annual Meeting of the American Fern Society (Jiang H. et al., 2022). Indeed, MSI application in botanical drugs dates back to 2007, when Wu et al. (2007a) established a matrix-assisted laser desorption ionization (MALDI) method for direct alkaloid profiling of four botanical drugs: Fuzi, processed Fuzi, Coptis chinensis Franch., and Corydalis yanhusuo W.T.Wang. Subsequently, Ng et al. (2007) applied the technique to determine the spatial distribution of secondary metabolites, especially alkaloids, in different tissue regions of Sinomenium acutum stem. Over the years, MSI has been increasingly used and significantly advanced in HM quality control and mechanism exploration. Without requiring tedious sample pretreatment, MSI allows for direct visualization of original compound distribution, enabling an in-depth understanding of the biosynthesis and dynamic accumulation of secondary metabolites. In animal tissues, its capacity for in situ analysis makes MSI well-suited for explaining complex HM mechanisms of action by characterizing tissue distributions of active metabolites or capturing endogenous biomarkers associated with HM efficacy and toxicity, enabling spatial pharmacology (Rajbhandari et al., 2024). In addition, MS-based metabolomics is a feasible method to explore mechanisms of action and find novel therapeutic targets based on the discovery of differential metabolites and prediction of differential metabolic pathways, which is consistent with the holistic view of Chinese medicine. Recently, chinmedomics strategy (i.e., the organic combination of metabolomics with serum pharmacochemistry of HM) using analytical techniques such as LC-MS and nuclear magnetic resonance has also shown great potential for discovering HM active metabolites and predicting their potential action targets, especially TCM formula (Zhang Y. et al., 2024; Wan et al., 2024). MSI-based spatial metabolomics will further promote the discovery of disease markers and multitarget exploration of HM by directly presenting the spatial position of metabolites in tissues and complementing histopathological staining and immunohistochemistry (Ren et al., 2023). MSI techniques commonly used in HMs are divided into three categories based on their ionization principles: secondary ion MS (SIMS) (Guo X. et al., 2023), MALDI (Wang J. et al., 2023), and desorption electrospray ionization (DESI) (Gao et al., 2023). A detailed comparison of the three ionization methods is presented in Table 1.
TABLE 1
| Ionization features | SIMS | MALDI | DESI |
|---|---|---|---|
| Introduction time | 1960s | 1997 | 2004 |
| Ionization environment | High vacuum | High/medium vacuum | Ambient |
| Ionization source | High-energetic primary ion beams | Laser beam (UV/IR) | Highly charged droplets |
| Sample treatment | No matrix coating | Matrix coating | No matrix coating |
| Spatial resolution (μm) | ∼0.05 | 5–100, lowest 1 | 30–200, lowest 20 |
| Imaging scale | Cell, subcellular | Whole body, organ tissue, and cell | Whole body, organ, and tissue |
| Classes of analytes | Lipids, metabolites | Lipids, metabolites, glycans, peptides, proteins | lipids, metabolites, glycans, peptides |
| The degree of ionization | Hard | Soft | Soft |
| Strengths | High spatial resolution | Wide ranges of molecules | High throughput and sensitivity, easy sample pretreatment |
| Drawbacks | Low throughput, high degree of fragmentation, high cost | Ion suppression/matrix interferences | Low spatial resolution |
| Application status in TCM | Relatively rare | Very common | Increasingly common |
| References | Behrens et al. (2012); Heeren (2015) | Caprioli et al. (1997); Mokosch et al. (2021) | Takáts et al. (2004); Morato and Cooks (2023); Yang et al. (2023) |
A detailed comparison of the SIMS, MALDI, and DESI.
Several typical MSI steps, including sample preparation, data analysis, and matrix selection, have been thoroughly reviewed elsewhere (Dong et al., 2016; Yoon and Lee, 2018; Leopold et al., 2023; Ma and Fernández, 2024). Herein, we provide an overview of three MSI techniques and their key imaging principles. In addition, we mainly focus on their practical applications in visualizing HM metabolites and exploring their pharmacological and toxicological mechanisms. We especially summarize and analyze the novel application of MSI technology in elucidating processing mechanism of HMs in chemical analysis, which is a topic not covered in the previous review. Finally, current limitations and future perspectives are systematically summarized and discussed. This review aims to provide readers with a comprehensive understanding of common MSI techniques and their applications in HMs, thus facilitating further development of TCM.
2 Three common MSI ionization methods
2.1 Secondary ion mass spectrometry (SIMS)
SIMS was first proposed by Castaing and Soldzian in the 1960s (Audinot et al., 2021), and then introduced as an imaging technique in 1983 (Bjarnholt et al., 2014). SIMS has attracted significant interest because of its extremely high spatial resolution at the sub-micrometer, and even nanometer, scale (i.e., 50–100 nm), making it especially suitable for imaging single cells and subcellular structures (Figure 1A) (Guerquin-Kern et al., 2005; Barut and Fletcher, 2023). SIMS uses a focused primary ion beam (e.g., Ga+, Bi+) with high energy (5–30 keV) to bombard the sample surface, generating a series of secondary ions. The desorbed and ionized analytes are directed into the mass analyzer for measurement (Amstalden van Hove et al., 2010; Hanrieder et al., 2013). Figure 1B provides a detailed schematic of the SIMS principle. The whole ionization process operates in a high-vacuum environment, thus the object must be freeze dried, and the process is unsuitable for unstable components (Paine et al., 2017). It is worth noting that SIMS typically images the characteristic fragments of analytes rather than their intact metabolites, owing to a very high degree of fragmentation (Vickerman, 2011). Accordingly, SIMS usually detects metabolites with low molecular weight (<1,000 Da), such as phospholipids and fatty acids (Bjarnholt et al., 2014). However, the introduction of new cluster ion beams has enabled detection of different analytes. For example, argon cluster ion beams allow for the analysis of large organic molecules such as peptides and proteins (Ninomiya et al., 2009; Lee et al., 2010). In other words, the development of gas cluster ion beams (GCIBs) with SIMS significantly decreased the fragmentation yield and improved molecular ion signals. Time-of-flight (TOF)-SIMS with GCIBs has been extensively used to investigate drug mechanisms and disease-related biomarkers in biological tissues, especially brain tissues (i.e., a highly complex, heterogeneous organ) (Sjövall et al., 2004; Bich et al., 2013; Hanrieder et al., 2013). However, the relatively high cost of SIMS compared with other imaging techniques means fewer laboratories are using it worldwide. Nonetheless, the ultra-high spatial resolution of SIMS still holds great promise for analysis of HM trace active compounds, pesticide residues, and therapeutic mechanisms.
FIGURE 1
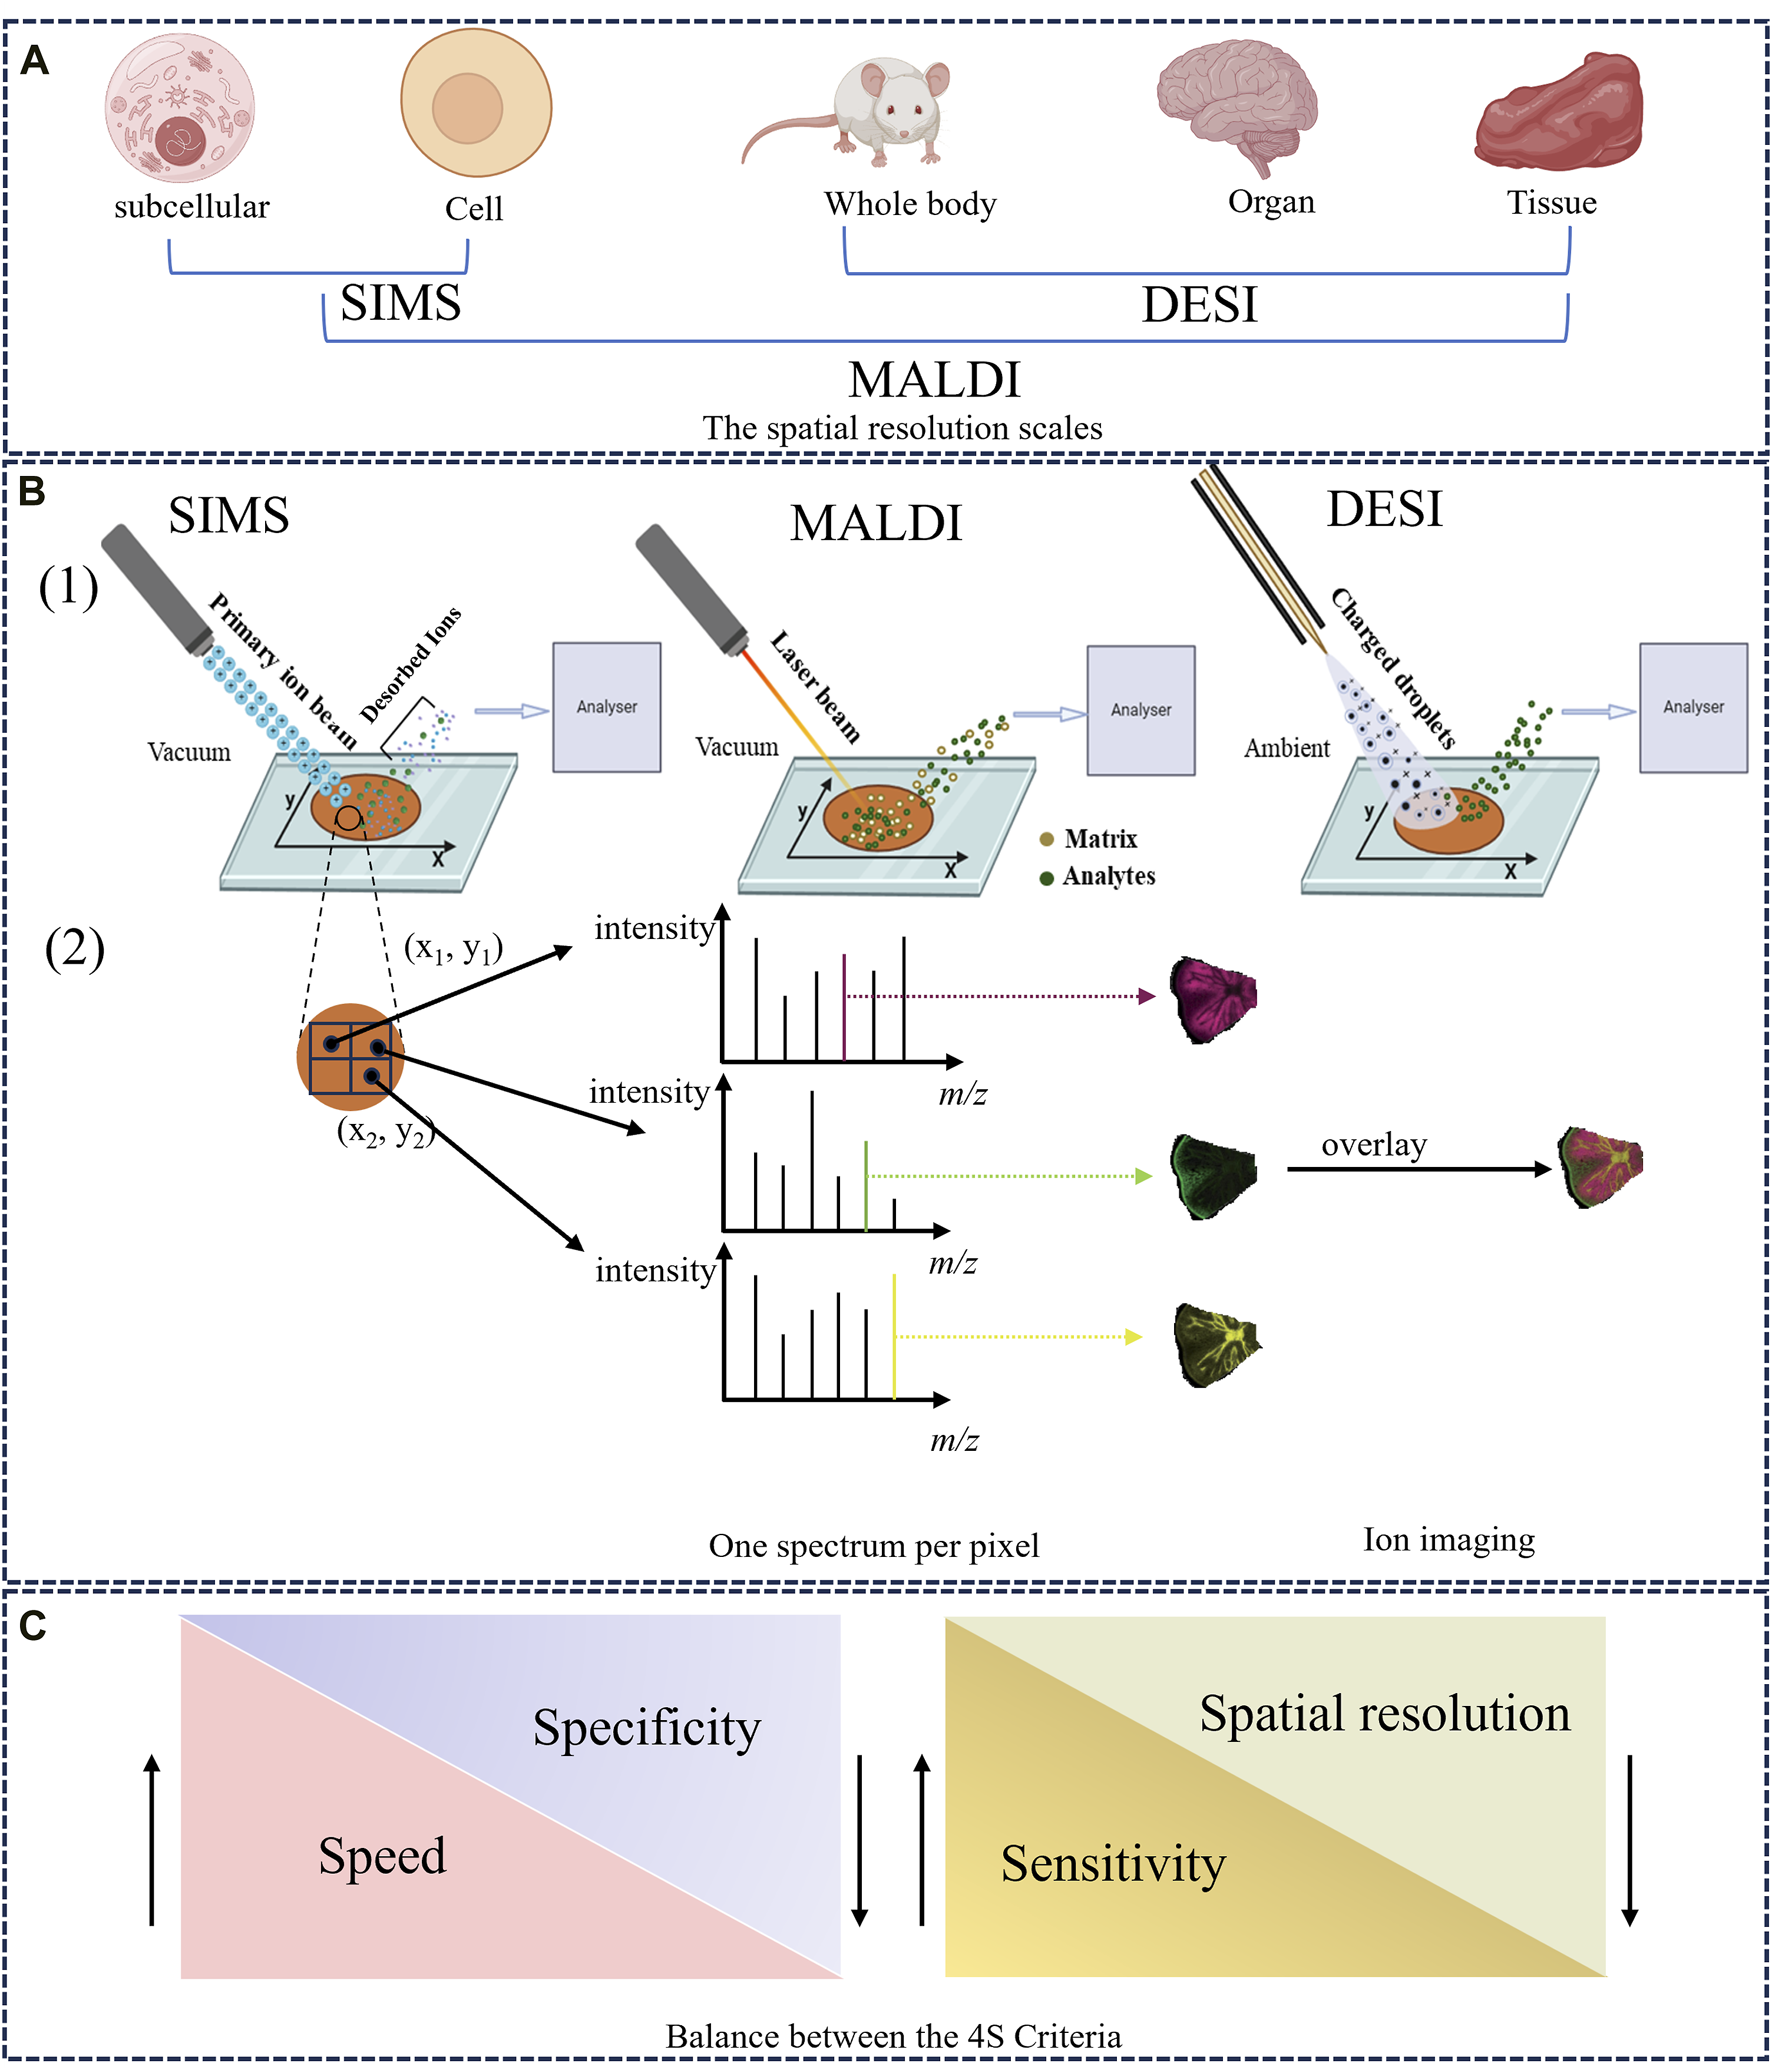
The overview of MSI technique. (A) The spatial resolution scales of SIMS, MALDI, and DESI. (B) Schematic illustration of the ionization and imaging principles of MSI. (1) A thin-section sample is placed onto a glass slide, coated with or without matrix. Ions are generated at each pixel spot by using ion beam (SIMS), a laser (MALDI) or charged solvent stream (DESI) and are measured by mass analyzer. (2) One-pixel spot corresponds to one mass spectrum. The ion intensity of each m/z peak can be extracted from individual spots and represented as a false color heat map, known as an MS image or ion image. In addition, MS images can be overlaid to compare their ion distributions (Dong and Aharoni, 2022). (C) The balance between the 4S Criteria (speed, specificity, spatial resolution, and sensitivity).
2.2 Matrix-assisted laser desorption ionization (MALDI)
MALDI was first employed in 1997 to analyze biological macromolecules such as peptides and proteins (Caprioli et al., 1997). Since then, the technique has been widely applied to drug discovery (Cornett and Scholle, 2017), clinical research (Croxatto et al., 2012), and food analysis (Kokesch-Himmelreich et al., 2022). In 2002, MALDI earned its inventor the Nobel Prize in Chemistry for great contributions to biological analysis (Cho and Normile, 2002), and has emerged as the most often used and commercially available imaging device (Harkin et al., 2022). Recently, high spatial resolutions of 1.4 μm and 1 μm have been achieved with MALDI–MSI (Kompauer et al., 2017) and atmospheric pressure-scanning microprobe MALDI–MSI (Mokosch et al., 2021), respectively.
Several steps are fundamental to the desorption/ionization mechanisms of MALDI. First, the appropriate matrix material is evenly sprayed on the surface and co-crystallized with analytes on the metal plate, generating matrix-analyte complexes (Wang J. et al., 2023). Next, a pulsed ultraviolet or infrared laser beam bombards the sample surface; its energy is directly absorbed by the matrix, and then transferred to the analyte molecules. Finally, the matrix is vaporized, carrying intact sample molecules into the gas phase, leading to their desorption and ionization (Bjarnholt et al., 2014). A classic MALDI ionization process is described in Figure 1B. During the process, some ions (e.g., H+, Na+) can be exchanged between the matrix and analyte, producing numerous quasi-molecular ions (Engel et al., 2022). Accordingly, MALDI is a relatively soft ionization method, generating singly charged ions with a wide mass/charge number (m/z) range (Koestler et al., 2008). Large biomolecules in biological samples (e.g., proteins, lipids, peptides) are typically imaged by MALDI–MSI (Spengler, 2015).
In MALDI–MSI analysis, the selection and optimization of a matrix plays a pivotal role in ion imaging. It both facilitates ionization of analytes that do not absorb light energy themselves and affects spatial resolution by impacting the displacement of analytes on the sample surface (Vallianatou et al., 2019; Guo X. et al., 2023). However, a matrix effect exists during imaging, suppressing or enhancing analyte ionization efficiency based on other analytes present in the sample or biological matrix (Rajbhandari et al., 2024). A high matrix ion signal can lead to interference at the low mass range, significantly affecting detection of small molecules (m/z < 750 Da) (Guo X. et al., 2023). Hence, an ideal matrix material is characterized by the smallest possible crystal size and a low ion signal background. Common matrices are organic acid compounds, like 2,5-dihydroxybenzoicacid, sinapic acid, and α-cyano-4-hydroxycinnamicacid. A list of matrices for this technique, and corresponding analytes, are in Table 2. As more classes of novel matrices with high analyte desorption/ionization are discovered and applied [e.g., nitro indole derivatives (Liang et al., 2024), 2-hydrazinoterephthalic acid (Wang H. et al., 2023), 3,4-dimethoxycinnamic acid (He et al., 2019)], MALDI will become more applicable for analyzing diverse compounds. This issue has been elaborated on previously (Engel et al., 2022; Jiang H. et al., 2022; Guo X. et al., 2023). In addition, like SIMS, MALDI is typically carried out under high vacuum conditions, necessitating relatively complicated sample preparation compared with ambient conditions. Freezing microtome sectioning is essential for biological tissues, which are easily deformed in the vacuum, destroying information about their original spatial distributions (Zhu et al., 2021). Consequently, there is a growing demand for ionization techniques that do not rely on a matrix coating and can operate in real-world environments.
TABLE 2
| Matrixes | Analytes | Reference |
|---|---|---|
| 2,5-Dihydroxybenzoicacid | Lipids, amino acids, and oligosaccharides | Bjarnholt et al. (2014); McMillen et al. (2020) |
| 1,5-Diaminonaphthalene | Phospholipids, fatty acids, amino acids and nucleotides | Korte and Lee (2014); Jiang H. et al. (2022) |
| 9-Aminoacridine | Amino acids, nucleotide derivatives, and lipids | Morikawa-Ichinose et al. (2019) |
| α-Cyano-4-hydroxycinnamicacid | Peptides, lipids, and glycoproteins | Laugesen and Roepstorff (2003); Jiang H. et al. (2022) |
| 3-Hydroxypicolinic acid | Oligonucleotides | Yokoi et al. (2018) |
| Sinapic acid | Large proteins, oligosaccharides, and glycoproteins | Botting (2003); Guo X. et al. (2023) |
| 2,5-Dihydroxyacetophenone (DHAP) | Large proteins, peptides, and glycoproteins | Wenzel et al. (2006); Jacksén and Emmer (2012) |
Commonly used matrixes for MALDI-MSI.
2.3 Desorption electrospray ionization (DESI)
Based on MALDI, Cooks et al. (Wu et al., 2013) initially introduced DESI in 2004 and used this novel ionization source to image biological tissues in 2006 (Wiseman et al., 2006), initiating a new field of ionization at atmospheric pressure. That DESI can be used directly in ambient environments, without vacuum requirements, which is the vital feature distinguishing it from MALDI and SIMS (Takáts et al., 2005). This technique is widely popular because it requires fewer complex sample treatments and no matrix compound, thus also avoiding matrix interference. The ionization mechanism for DESI was described by Cooks et al. as a “droplet pick-up” process (Morato and Cooks, 2023).
In this method, a charged solvent spray is first generated by a constant flow rate (μL/min) of solvent (e.g., methanol, acetonitrile, dimethylformamide) under a high voltage potential and a nebulizer gas (typically nitrogen). When the charged spray micro-droplets are directed toward a sample surface, sample molecules (mostly metabolites and lipids in animal tissues) are extracted, desorbed, and ionized, producing a series of gaseous ions (Talaty et al., 2005). Finally, desorbed ions enter the mass analyzer through an ion transfer line. A simple schematic of this process is provided in Figure 1B. DESI, a soft ionization process, allows the analysis of intact polar molecules with low molecular weight (Takáts et al., 2004; Kafeenah et al., 2022). Nevertheless, since the solvents used are usually hydrophilic, DESI is inappropriate for non-polar metabolites and its sensitivity to proteins and other large biomolecules is not also ideal. Compared with SIMS and MALDI, DESI possesses a lower spatial resolution (180–220 μm) because the spray area cannot be accurately controlled (Ifa et al., 2010). Recently, the introduction of nano-DESI has enhanced the spatial resolution imaging to 40 μm (Mesa Sanchez et al., 2022). This lower spatial resolution can be compensated for by high throughput and sensitivity according to the 4S-criteria (Figure 1C). Working in air, DESI can be used with various sample types, including fresh-cut plant tissues, animal tissues, and biological liquids (e.g., urine, plasma) (Takáts et al., 2005). With its advantages of high throughput and easy sample preparation, DESI–MSI is increasingly applied in HM research.
2.4 The key imaging principles
As a well-established molecular imaging technique, MSI involves different ion source types coupled to mass analyzers (e.g., TOF, ion trap analyzers), which are largely responsible for the mass accuracy, mass resolution, and quality of ion imaging (Guo X. et al., 2023). Differences among MSI techniques mainly depend on how the analytes are ionized. In the MSI process, a large number of metabolites from every pixel point on the sample are first desorbed and ionized by an energetic primary ion beam, laser beam, or charged microdroplets, all of which generate ions (Dong and Aharoni, 2022). The produced ions enter the mass analyzer and are separated according to their m/z, and detected. Finally, the spatial positions of analytes are recorded within the original imaging dataset by mapping an x-y array of coordinates along with their relative abundance. In general, one pixel corresponds to a mass spectrum, thus a large number of mass spectra can be obtained for a tissue slice (Figure 1B) (Schulz et al., 2019). During data analysis, MSI software enables the extraction of the ion intensity value of a targeted m/z peak within the specific mass spectrum and plots these using different color scales, thus constructing an MS image that represents the distribution of a compound of interest (Bjarnholt et al., 2014). More importantly, the spatial distributions of several ions in a sample can be compared by overlaying their MS images, as shown in Figure 1B.
When using MSI, four important parameters (spatial resolution, speed, sensitivity, and specificity), which mutually constrain each other, are subject to the 4S-criteria (Figure 1C) (Schulz et al., 2019). For example, when high spatial resolution is the experimental priority, sensitivity and throughput decreases are inevitable due to the increased pixels and decreased sampling volume. Consequently, selecting the appropriate integration between ionization source and mass analyzer (e.g., MALDI–TOF, SIMS–TOF, MALDI–Orbitrap) is crucial for successfully detecting and imaging the desired analytes, which depends on the sample dimensions and properties. For instance, when imaging differential metabolites at the cellular level, MALDI should be prioritized for its high spatial resolution and wide mass range. For mass analyzer, TOF would be preferred for its high mass resolution and accuracy especially when combined with MALDI (i.e., MALDI–TOF).
Herein, we have briefly discussed the three most common MSI techniques and their ionization mechanisms. More detailed explanations and introductions have been presented in several excellent reviews (Cooks et al., 2006; Fuchs et al., 2010; Guo X. et al., 2023; Jia et al., 2023).
3 MSI application in chemical analysis of HM
Secondary metabolites (e.g., saponins, flavonoids, alkaloids) in medicinal plants are not only involved in defensive functions and signal transmissions but serve as the material basis for HM efficacies. However, the distribution of these metabolites in HM is usually heterogeneous. MSI makes it possible to visualize the spatial distribution of functional HM compounds, allowing direct indications for an in-depth understanding of their biosynthetic processes and revealing where and how they are enriched. Moreover, visualizing the spatial distribution of metabolites in both crude and processed HMs facilitates the identification of quality markers and uncovers potential chemical transformation mechanisms during the processing procedure, known as Pao Zhi in Chinese. This approach not only aids in refining processing methodologies but also ensures the safety of medications, thereby enhancing overall product quality and efficacy.
3.1 Direct readout of spatial location of medicinal compound
The spatial distribution of compounds within HMs varied across medicinal tissues. However, traditional analytical methods can only identify and analyze the metabolites, failing to provide specific spatial information. As a complement to traditional chemical analysis, MSI allows non-labeled in situ metabolite analysis, and enables their precise location. Furthermore, the types and contents of active metabolites in HMs are also affected by factors such as growth stage, medicinal portion, cultivation year, microregion, and growing environment. MSI directly reveals overall differences in metabolites and abundance by combining chemometric analysis. By showing spatial distribution of chemical components within heterogeneous HM tissues, MSI can provide researchers with more contextualized information. The MSI methods, research drugs, sample types, and imaged analytes involved in this article are summarized in Table 3, categorized according to research objectives and chronology.
TABLE 3
| Purposes | Medicinal plants or drugs | Tissue types | Imaging technique | Imaged analytes | References |
|---|---|---|---|---|---|
| Metabolite distribution (medicinal plants) | Periplaneta americana (Family: Blattidae, Genus: Periplaneta) | Whole body | MALDI-MSI | N-acetyldopamine oligomers | Zhang J. et al. (2024) |
| Ganoderma lingzhi (Ganodermataceae; Ganoderma lucidum or Ganoderma sinense) | Dried fruiting body | DESI-MSI | Metabolites | Xia et al. (2024) | |
| Scutellaria baicalensis (Family: Lamiaceae; Genus: Scutellaria) | Whole body | MALDI-MSI | Metabolites | Zhou et al. (2024) | |
| Fuzi (Ranunculaceae; Aconitum carmichaelii Debeaux) | Lateral roots | DESI-MSI | Paclobutrazol | Hou et al. (2023) | |
| Angelica pubescens (Family: Umbelliferae; Genus: Angelica) | Root | MALDI-MSI | Coumarins | Li et al. (2023c) | |
| Rauvolfia tetraphylla (Family: Apocynaceae; Genus: Rauvolfia) | Stem, roots, and leaves | MALDI and DESI-MSI | Monoterpenoid indole alkaloids | Lorensen et al. (2023a) | |
| Puerariae lobata and Puerariae thomsonii (Family: Leguminosae; Genus: Puerariae) | Root | DESI-MSI | Metabolites | Guo N. et al. (2023) | |
| Salvia miltiorrhiza Bunge (Lamiaceae; Salviae miltiorrhizae radix et rhizoma) | Root and rhizome | DESI–MSI | Diterpenoids | Xia et al. (2023) | |
| Isatidis Radix (Brassicaceae; Isatis indigotica) | Root | MALDI and DESI-MSI | Quality markers | Nie et al. (2023) | |
| Angelica sinensis (Umbelliferae; Angelica sinensis (Oliv.) Diels) | Root | MALDI-MSI | Volatile oil | Li Q. et al. (2023) | |
| Chinese jujube (Rhamnaceae; Ziziphus jujuba Mill.) | Fruit | MALDI-MSI | Metabolites | Lu D. et al. (2023) | |
| Isatidis radix | Root | DESI-MSI | Metabolites | Nie et al. (2022) | |
| Forsythia suspensa (Oleaceae; Forsythia suspensa (Thunb.) Vahl) | Fruit | MALDI-MSI | Metabolites | Jing et al. (2022) | |
| Gelsemium elegans (Family: Gelsemicaeae; Genus: Gelsemium) | Roots, stems, and leaves | DESI-MSI | Alkaloids | Wu et al. (2022a) | |
| Salvia miltiorrhiza Bunge | Whole body | DESI-MSI | Metabolites | Tong et al. (2022) | |
| Cordyceps sinensis (Clavicipitaceae; cordyceps sinensis (Berk.) Sacc) | Whole body | TOF-SIMS | Active metabolites | Liu Q. B. et al. (2022) | |
| Coptis chinensis (Ranunculaceae; Coptis chinensis Franch., Coptis deltoidea C.Y.Cheng et Hsiao., and Coptis teeta Wall.) | Rhizome | TOF-SIMS | Alkaloids | He et al. (2022) | |
| Cordyceps sinensis | Whole body | TOF-SIMS | Active metabolites | (M.-C. et al., 2022) | |
| Arctium lappa L. (Family: Asteraceae; Genus: Arctium) | Root | MALDI-MSI | Metabolites | Li et al. (2022) | |
| Paris polyphylla var. yunnanensis (Family: Veratriceae; Genus: Paris) | Rhizome | MALDI-MSI | Metabolites | Zhang G. H. et al. (2022) | |
| Coptis chinensis | Rhizome | DESI-MSI | Metabolites | Wang et al. (2022) | |
| Paeonia lactiflora | Root | DESI-MSI | Active metabolites | Chen et al. (2022) | |
| Paeonia suffruticosa and Paeonia lactiflora (Family: Paeoniaceae) | Root | MALDI-MSI | Metabolites | Li B. et al. (2021) | |
| Lotus Seed (Nymphaeaceae; Nelumbo nucifera Gaertn.) | Seeds | MALDI-MSI | Metabolites | Sun C. L. et al. (2021) | |
| Wolfberry fruit (Solanaceae; Lycium barbarum L.) | Fruit | MALDI-MSI | Metabolites | Zhao et al. (2021) | |
| Heshouwu (Polygonaceae; Polygonum multiflorum Thunb) | Root tubers | MALDI-MSI | Related markers | Wiseman et al. (2006) | |
| Salvia miltiorrhiza Bunge | Root and rhizome | MALDI-MSI | Metabolites | Sun et al. (2020a) | |
| Scutellaria baicalensis (Family: Lamiaceae; Genus: Scutellaria) | Root | MALDI-MSI | Flavones | Sun et al. (2020b) | |
| Ginkgo biloba L. (Family: Ginkgoaceae; Genus: Ginkgo) | Leaves | MALDI-MSI | Metabolites | Li et al. (2018) | |
| Psychotria prunifolia (Family: Rubiaceae; Genus: Psychotria) | Leaves | DESI-MSI | Alkaloids | Kato et al. (2018) | |
| Paeonia lactiflora | Root | MALDI-MSI | Active components | Li B. et al. (2016) | |
| Ginkgo biloba L. | Leaves | MALDI-MSI | Flavonoid glycosides and bioflavonoids | Beck and Stengel (2016) | |
| Panax ginseng (Araliaceae; Panax ginseng C.A.Mey.) | Root | MALDI-MSI | Ginsenosides | Taira et al. (2010) | |
| Fuzi | lateral root | MALDI-MSI | Alkaloids | Wang et al. (2009) | |
| Processing mechanisms (medicinal plants) | Fuzi and Processed Fuzi | Lateral root | MALDI-MSI | Alkaloids | Wu et al. (2007a) |
| Panax quinquefolius processed product (Araliaceae; Panax quinquefolium L.) | Root | MALDI-MSI | Ginsenosides | Li H. Z. et al. (2023) | |
| Morindae Officinalis Radixp processed products (Rubiaceae; Morinda officinalis How) | Root | MALDI-MSI | Iridoid and saccharousins | Qiao et al. (2022) | |
| Aconiti Radix Cocta processed product (Ranunculaceae; Aconitum carmichaelii Debx.) | Mother root | MALDI-MSI | Alkaloids | Dai et al. (2022) | |
| Gastrodiae Rhizoma processed product (Orchidaceae; Gastrodia elata Bl.) | Tuber | MALDI-MSI | Phenols | Harkin et al. (2022) | |
| Ligustri Lucidi Fructus and wine-processed product (Oleaceae, Ligustrum lucidum Ait.) | Fruit | MALDI-MSI | Related markers | Li et al. (2020) | |
| Panax notoginseng processed product (Araliaceae; Panax notoginseng (Burkill) F.H.Chen) | Root and rhizome | MALDI-MSI | Active components | Sun C. et al. (2021) | |
| Strychnos nux-vomica seeds and its processed products (Loganiaceae; Strychnos nux-vomica L.) | Seeds | MALDI-MSI | Alkaloids | Wu et al. (2007b) | |
| Aconitum pendulum and its processed product (Family: Polygonaceae; Genus: Aconitum) | Root | DESI-MSI | Differential metabolites | Tan et al. (2023) | |
| Raw and processed fuzi | Lateral root | DESI-MSI | Aconitum alkaloids | Liu Y. et al. (2022) | |
| Raw and processed Panax notoginseng | Root | MALDI-MSI | Ginsenosides | Fan et al. (2022) | |
| Bombyx batryticatus and stir-fried product (Bombycidae; Bombyx mori Linnaeus) | Whole body | MALDI-MSI | Protein-related metabolites | Liu P. et al. (2023) | |
| Metabolic distribution (animal tissues) | Uncaria rhynchophylla (Miq.) Miq. ex Havil. (Rubiaceae; Rubiaceae) | Rat brain | DESI-MSI | Uncaria alkaloids | Gao et al. (2022) |
| Xiaoke pills | Zebrafish | DESI-MSI | Chemical components and their metabolites | Zhu et al. (2022) | |
| Rubia tinctorum (Family: Rubiaceae; Genus: Rubia) | Rat kidney | DESI-MSI | Anthraquinone | Ishii et al. (2022) | |
| Scutellarin | Mouse kidney | MALDI-MSI | Scutellarin and metabolites | Wang T. et al. (2021) | |
| Ginsenoside Rg1 | Rat organs | DESI-MSI | Ginsenoside Rg1 | Wei et al. (2021) | |
| Salidroside | Mouse organs | MALDI-MSI | Scutellarin and scutellarein | Meng et al. (2020) | |
| Paclitaxel | Mouse body | Virtual calibration quantitative MSI | Paclitaxel and its prodrug | Zhang et al. (2020) | |
| Stephania tetrandra S. Moore. (Family: Menispermaceae; Genus: Stephania) | Rat organs | MALDI–MSI | Tetrandrine | Tang et al. (2019) | |
| Ephedra sinica (Family: Ephedraceae; Genus: Ephedra) | Rat lung | MALDI-MSI | Ephedrine | Matsumoto et al. (2017) | |
| Puerarin | Mouse kidney | GD-4-assisted MSI | Puerarin and its two metabolites | Shi et al. (2017) | |
| Vinblastine | Rat whole body | MALDI–MSI | Vinblastine and metabolites | Trim et al. (2008) | |
| Pharmacological and toxicological mechanisms (animal tissues) | heshouwu | Mouse liver | DESI-MSI | Endogenous metabolites | Jiang H. Y. et al. (2022) |
| Aristolochic acids | Rat kidney | DESI-MSI | Endogenous metabolites | Wang et al. (2020) | |
| Pterostilbene | Rat brain | DESI-MSI | Endogenous metabolites | Ban et al. (2024) | |
| Ningxin fomula | Rat heart | MALDI-MSI | Endogenous metabolites | Huang et al. (2023) | |
| Yi-Xin-Shu capsule | Rat heart | MALDI-MSI | Endogenous metabolites | Zhang M. et al. (2022) | |
| Ginseng and Panax quinquefolius | Rat brain | DESI-MSI | Endogenous metabolites | Huang et al. (2023) | |
| Fritillariae cirrhosae bulbus (Liliaceae; Fritillaria taipaiensis P. Y. Li) | Rat lung | MALDI-MSI | Endogenous metabolites | Qin et al. (2024) | |
| Notoginseng leaf triterpenes | Rat brain | MALDI–MSI | Endogenous metabolites | Wang L. et al. (2021) | |
| XueFu ZhuYu decoction | Rat brain | nanoDESI-MSI | Endogenous metabolites | Li Y. et al. (2021) | |
| Notoginsenoside R1 | Rat brain | MALDI–MSI | Endogenous metabolites | Zhu et al. (2020) | |
| Thymoquinone | Rat brain | MALDI–MSI | Endogenous metabolites | Tian et al. (2020) | |
| Fuzi | Rat heart | MALDI-MSI | Endogenous metabolites | Wu et al. (2019b) | |
| Shenfu injection | Rat heart | MALDI-MSI | Endogenous metabolites | Wu et al. (2019a) | |
| N(6)-(4-hydroxybenzyl)-adenosine | Rat whole body | DESI-MSI | Endogenous metabolites | He et al. (2015) |
A summary of MSI applications in metabolite analysis and mechanisms of action of HMs.
In the HM context, SIMS has been used to image several medicinal plants to determine the spatial distributions of specific trace substances, such as Cordyceps sinensis (e.g., mannitol, cordycepin, ergosterol) (Li Z. P. et al., 2016; Xia et al., 2021; Meng-Chan et al., 2022) and Coptis chinensis rhizome (e.g., berberine, epiberberine, coptisine) (He et al., 2022). These findings have provided the valuable reference for HM quality control. For example, TOF-SIMS was used to analyze the distribution of compounds in the cross-section of C. chinensis rhizome. Palmatine was found to be more widely distributed in the pith compared to other parts, while oxyberberine was primarily concentrated in the cork and xylem rays. Meanwhile, the findings were further verified using HPLC coupled with triple quadrupole MS. In addition, Sun et al. (2020a) developed a high-coverage MALDI–MSI method, primarily to profile the spatial locations and dynamic changes of a wide range of endogenous small molecules, including amino acids, phenolic acids, and fatty acids in diverse structures (e.g., cork, cortex, phloem, cambium, xylem, medulla) of the root and stem of Salvia miltiorrhiza Bunge[Lamiaceae; Salviae miltiorrhizae radix et rhizoma]. Interestingly, tanshinone metabolite—which is traditionally obtained from the root—was also observed in the stem (Figure 2A). The result can contribute to the further selection of medicinal parts of S. miltiorrhiza Bge. Subsequently, another study used DESI–MSI to characterize and visualize diverse metabolites in different parts of the medicinal plant (e.g., roots, stems, leaves, and flowers), and to visualize the biosynthesis of flavonoids and phenolic acids (Tong et al., 2022). The finding revealed that danshensu was identified as a key precursor for the generation of phenolic acids in Salvia species. In another study, DESI–MSI and multiomics analysis unveiled the spatial distribution and biosynthesis mechanisms of diterpenoid tanshinones and polyphenolic salvianolic acids in the root and leaves of S. miltiorrhiza Bunge, respectively, and determined the key genes expressed in this pathway (Xia et al., 2023). These findings enhance our understanding of the precise locations and biosynthesis of metabolites, especially of the effective compounds in S. miltiorrhiza. In exploring the root of Paeonia lactiflora (PL), atmospheric pressure-scanning microprobe MALDI–MSI was performed to visualize cellular-level distributions of gallotannins, monoterpene glucosides, and other secondary metabolites (Li B. et al., 2016). The study revealed that gallotannins were primarily accumulated in the cork and xylem regions, where they serve a defensive function against external damage. The relationship between physiological function and spatial distribution has been established. Nevertheless, many isomers including the two most important active secondary metabolites: paeoniflorin and albiflorin could not be well distinguished using MSI technique alone. In another comparative study, ion images of major intermediates participating in the biosynthetic pathway of gallotannins were achieved in the root sections of P. suffruticosa (PS) and PL. More importantly, researchers developed tandem MSI to eliminate ambiguity in the spatial distribution of the isomers paeoniflorin and albiflorin. The results showed that these bioactive constituents were also accumulated in the corks of PS and PL roots, indicating the desirability of preservation of the cork layer as much as possible in the production and processing of crude drugs (Li B. et al., 2021; Chen et al., 2022).
FIGURE 2
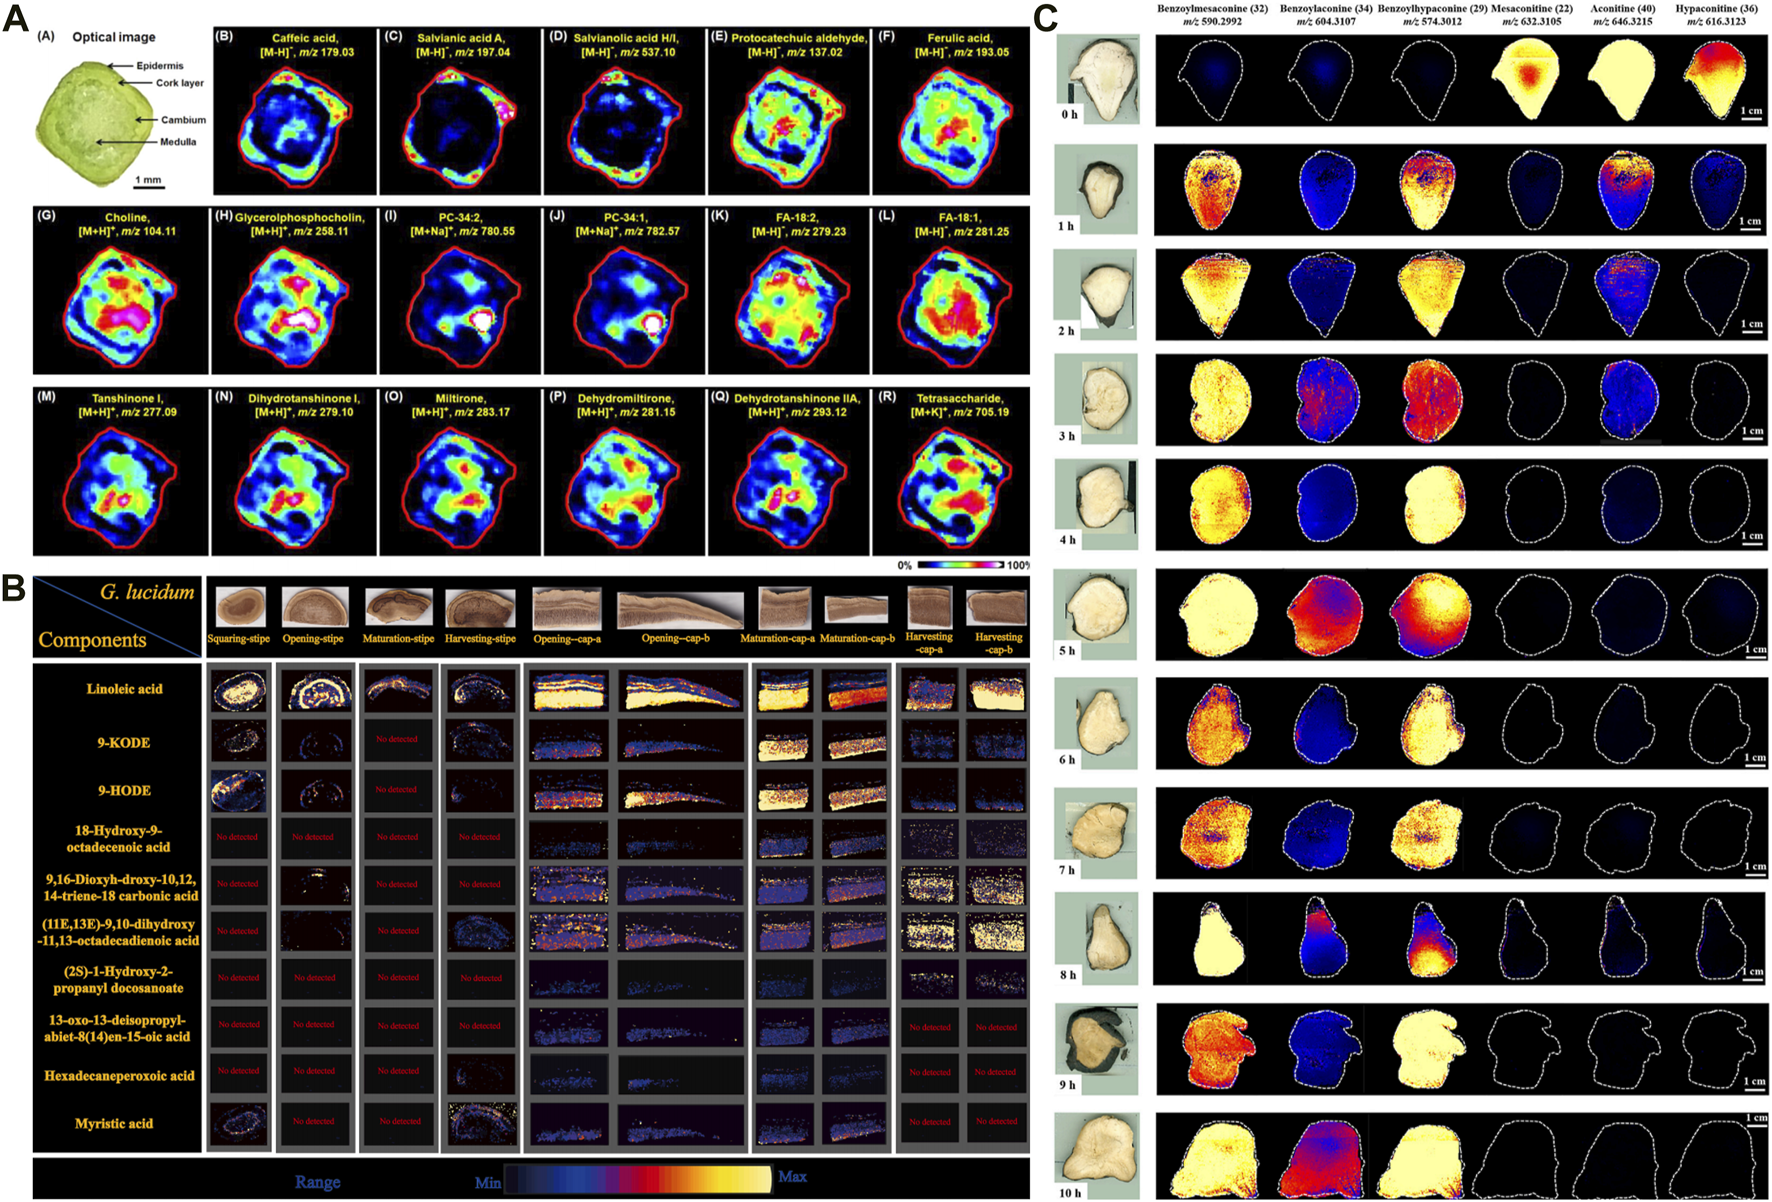
Application of mass spectrometry imaging in chemical analysis of herbal medicines. (A) The distribution of representative metabolites in Salvia miltiorrhiza Bge stem microregions (Sun et al., 2020a). (B) DESI-MSI spatial distribution of the ganoderic acids in different tissues of G. lingzhi at different maturity stages (Xia et al., 2024). (C) DESI-MS images of six ester-type alkaloids in raw and processed Fuzi steamed for different time points (Liu Y. et al., 2022).
Ginsenosides are important active compounds, present extensively in the family Araliaceae (e.g., Panax quinquefolius, Ginseng, and P. notoginseng). A growing number of studies have identified and imaged these using MSI. Recently, DESI–MSI and UPLC-Q-TOF/MS were used jointly to identify 15 differential metabolites in different microregions of P. quinquefolius [Araliaceae; P. quinquefolium L.]. Among them, ginsenosides were the main differential biomarkers distinguishing the outer core from the center. Additionally, higher levels of ginsenosides, acting as defensive plant regulators, were detected in the cork and phloem compared with the medulla and xylem (Taira et al., 2010; Luo et al., 2024). This study demonstrated tissue-specific distributions of metabolites and revealed a direct connection between this distribution and the physiological functions of the metabolites. Likewise, MALDI was used to comprehensively describe the spatial distributions of metabolites in P. notoginseng [Araliaceae; P. notoginseng (Burkill) F.H.Chen] (Sun C. et al., 2021). The differentially expressed ginsenosides in Ginseng [Araliaceae; Panax ginseng C.A.Mey.] and P. notoginseng across cultivation years were visualized using the same method, revealing quality differences (Liu et al., 2020; Yang et al., 2021; Lu Y. et al., 2023). In another ginseng species [Zhu-Zi-Shen, [Araliaceae; Panax japonicus var. major et rhizome)], DESI–MSI showed that ginsenosides accumulated predominantly in the cork and phloem, and a large number of unknown structures were unveiled primarily. These studies provide valuable insights into the accurate locations within targeted tissues, accumulation patterns, and tissue-specific extraction of saponins. However, differentiating among many isomeric ginsenosides remains challenging due to the limited analytical capabilities of DESI (Jiang M. et al., 2023).
Licorice [Fabaceae; Glycyrrhiza uralensis Fisch. et rhizome] is a common medicinal plant with a homology of medicine and food. Functional small molecule metabolites (i.e., flavonoids and saponins) present in licorice have been characterized in various microregions by MALDI–MSI and DESI–MSI. These results suggest that flavonoids are primarily accumulated in the cork, phloem, and medulla of the rhizome, while triterpenoids are widely distributed in the medullary, xylem, and phloem near the cork layer (Li et al., 2014). Similarly, MSI cannot separate or precisely identify isomers without tandem MS, which leads to the loss of chemical information in licorice. Thus, complementary methods are required for analyzing compounds with the same or similar molecular weights. In a recent study regarding licorice, the ion mobility (IM) technique was employed to add an extra isolation dimension to MSI. Researchers used DESI–MSI to detect 21 flavonoids and 12 triterpenoids in different areas of rhizome tissue. In subsequent work, the research team integrated DESI–MSI and HILIC/IM-QTOF-HDMSE (hydrophilic interaction chromatography/ion mobility-quadrupole time-off light high-definition) to directly characterized the distribution of oligosaccharides with eight different degrees of polymerization (Zhao et al., 2023), offering more comprehensive information for sustainable utilization and further development licorice. DESI–IM–Q/TOF was also applied to spatially visualize the seeds of peach, bitter almond, and Chinese dwarf cherry, observing that most unique compounds, especially amygdalin, were more abundant at the edges of the seed kernels than in the centers of the cotyledons (Hou J. et al., 2022). The finding provided us a hint that long-term soaking of bitter almond seeds should be avoided, to prevent amygdalin hydrolysis. Additionally, another important class of active components, flavonoids, were also fully mapped in HMs such as Ginkgo biloba L., Cannabis sativa, and Scutellaria baicalensis Georgi (Beck and Stengel, 2016; Li et al., 2018; Sun et al., 2020b; Lorensen et al., 2023b). Such studies can further enhance our understanding of the biosynthesis and biological functions of secondary HM metabolites.
Metabolite accumulation patterns and abundances are dynamic across growth stages and tissue parts. MSI can be used to investigate these aspects by visualizing their heterogeneous distribution, which can help determine optimal harvest periods and advance rational HM use. For example, Ganoderma lingzhi (G. lingzhi) [Ganodermataceae; Dried fruiting body of Ganoderma lucidum or Ganoderma sinense] is valued for its high medicinal and nutritional value. Xia et al. developed DESI–MSI combined with LC–MS plant metabolomics to explore the dynamic accumulation patterns of G. lingzhi components during four maturity stages (i.e., squaring, opening, maturation, and harvesting). Approximately 132 metabolites, including 115 triterpenoids, 11 fatty acids, and other components, were identified. Further analysis revealed a higher concentration of ganoderic acids in caps compared with stipes. The abundance of most ganoderic acids decreased in both stipe and cap as G. lingzhi matured. The accumulation of fatty acids was predominantly observed during the opening and maturing stages of the caps (Xia et al., 2024) (Figure 2B). These findings provide a basis for the rational use of medicinal parts of G. lingzhi., and trace how its triterpenes accumulate. Over recent years, parallel studies of other medicinal plants have been conducted, including Jujube (Lu D. et al., 2023), Forsythia suspensa (Jing et al., 2022), Gelsemium elegans (Wu et al., 2022a; Wu et al., 2022b), and wolfberry fruit at different development stages (Zhao et al., 2021).
In TCM, Angelica sinensis [Umbelliferae; A. sinensis (Oliv.) Diels et root] are routinely divided into the head, body, and tail according to their distinct clinical medicinal properties. Traditionally, the body is used to replenish blood, while the head and tail promote blood circulation (Yang et al., 2017). However, the material basis for these differential effects had not been fully elucidated. Therefore, both fluorescence imaging and MALDI–MSI were used to perform a comparative analysis of the root’s volatile oil. Fluorescence imaging suggested significant differences in the content of the total volatile oil between the head, body, and tail. Meanwhile, the specific spatial distribution of each compound was also revealed by MSI (Li Q. et al., 2023). This offers a novel approach to understanding the pharmacological differences across medicinal parts of A. sinensis. MSI-based spatial metabolomics combined with multivariate statistical analysis (principal component analysis, PCA; orthogonal partial least squares discriminant analysis, OPLS-DA) were used to discriminate HM adulteration (Zhao et al., 2021) and other quality characteristics (Nie et al., 2022; Nie et al., 2023).
In addition to the abovementioned medicinal plants, the use of MSI has expanded to spatially resolved analysis of active constituents related to animal-based TCMs. For instance, Periplaneta americana [Family: Blattidae, Genus: Periplaneta] is a medicinal insect that improves blood circulation and alleviates blood stasis. Fifteen N-acetyldopamine oligomers with anti-inflammatory and vasorelaxant effects were extracted from the insect, and their distribution throughout the insect was visualized using MALDI–MSI. This analysis indicated that N-acetyldopamine oligomers were more highly distributed in peripheral parts (Zhang J. et al., 2024). That study presented an innovative approach to examining active substances in animal-derived medicines. Collectively, MSI application to the chemical analysis of HM provides direct guidance for their quality control.
3.2 Chemical perspectives on processing (Pao Zhi) mechanisms of HM
Processing (Pao Zhi) is a unique Chinese pharmaceutical technique for attenuating toxicity and altering HM efficacy (Pan et al., 2023). In general, most HM requires simple or complicated processing procedures, based on clinical requirements. Nevertheless, investigating the processing mechanisms of HM is challenging, leading to a lack of processing standardizations. A pivotal strategy to address the issue involves the analysis of dynamic transformation of chemical components between raw and processed products (Wu et al., 2018). MSI is particularly advantageous for this application due to its requirement for minimal sample preparation, thereby preserving the natural state of compounds. In HMs, although alkaloids serve as pharmacologically active constituents in numerous herbs, excessive concentrations of these compounds can lead to adverse toxic effects. Therefore, it is crucial to maintain alkaloid levels within an optimal range through adequate processing, thus ensuring efficacy and safe clinical use. MSI has been widely applied for in situ detection of alkaloid dynamic changes in HM processing such as Tibetan medicine Radix Aconiti (Tan et al., 2023), Fuzi (Wu et al., 2007a; Liu Y. et al., 2022), and Strychnos nux-vomica seed (Wu et al., 2007b). For example, Fuzi, the lateral root of Aconitum carmichaelii Debeaux (Family: Ranunculaceae), is a highly toxic HM. The processing mechanism behind detoxification of Fuzi has been uncovered using DESI–MSI combined with metabolomics analysis. The results demonstrated significant differences in the spatial distribution of six alkaloids among samples exposed to different steaming time points (Figure 2C). Among them, 4-h steaming was found to be the optimal steaming time to attenuate toxicity and preserve efficacy. In addition, 42 metabolic markers were identified to discriminate between raw Fuzi and those steamed for 4 h and 8 h (Lei et al., 2021). The chemical transformations, primarily involving the hydrolysis of diester-diterpenoid alkaloids, were visually depicted through DESI–MSI. Furthermore, MSI also serves as a valuable tool for evaluating the disparities in the chemical transformation that arise from different processing methods. Radix Aconiti, also known as Tie-bang-chui (TBC), is a perennial herb of the genus Aconitum pendulum Busch. and A. flavum Hand.-Mazz. dry roots and is a typical Tibetan medicine with remarkable efficacy and high toxicity (Wang et al., 2016). The Tibetan medicine is often processed by non-heating highland barley wine ((HBW) and fructus chebulae soup (FCS) to reduce toxicity. In another study, researchers used high performance thin-layer chromatography (HPTLC) and DESI-MSI to intuitively uncover the alkaloid change of TBC processed by FCS (F-TBC) and HBW (H-TBC). The finding indicated that the content of all six alkaloids decreased in F-TBC, while all five alkaloids decreased except aconitine increased in H-TBC. Further analysis revealed that the difference may be associated with a high concentration of acidic tannins in FCS. These chemicals can accelerate the hydrolysis of toxic diester alkaloids and complex with alkaloids to form insoluble substances, while H-TBC does not have this rule (Tan et al., 2023). Both crude and processed P. notoginseng exhibit high medicinal values due to their distinctive pharmacologic activities. MALDI–MSI was performed to visualize the dynamic changes among diverse metabolites during steaming. Dencichine, a hemostatic substance, gradually reduced with steaming time, verifying the superior hemostatic effects of raw P. notoginseng over steamed products. Alternatively, an increase in essential amino acids like arginine and glutamine was observed after steaming, accounting for the augmented blood-nourishing effects of the steamed form (Sun C. et al., 2021). The varying effects between raw and steamed P. notoginseng can also be attributed to the transformation of ginsenosides that occurs during the processing. Untargeted metabolomics identified 19 processing-associated markers. MALDI–MSI indicated that the major ginsenosides M-Rb1, R1, Rg1, Rb1, Rd, and Re were rich in the xylem and gradually decreased during processing (Fan et al., 2022). The transformation pathway of ginsenosides during processing was associated with chemical reactions such as deglycosylation, dehydration, hydration, acetylation, and isomerization. These studies can provide a clue for the distinct bioactivities between raw and processed P. notoginseng. Furthermore, an integral strategy combining multi-component characterization, non-target metabolomics, and MSI was proposed for quality control of processed Ligustri Lucidi Fructus [Oleaceae, mature fruit of Ligustrum lucidum Ait.] with different steaming times (0–12 h). MSI was employed to visualize four major processing-associated markers.
The comprehensive method, as opposed to conventional approaches, provides more compelling data for investigating HM processing mechanisms from a macroscopic perspective (Li et al., 2020). Likewise, MSI has been extensively utilized to identify chemical alterations between various raw and processed products, including raw and steamed Gastrodiae Rhizoma (Harkin et al., 2022), raw and steamed Aconiti Radix Cocta (Dai et al., 2022), raw and steamed Morindae Officinalis Radix (Qiao et al., 2022), raw and multi-steamed Panax quinquefolius (Li H. Z. et al., 2023). From a chemical standpoint, MSI has emerged as an efficient, rapid tool to unravel the processing mechanisms of HMs through the characterization of chemical structures, relative contents, and spatial distributions of specific metabolites during processing. This approach offers significant advantages for quality evaluation and control of HM processing, as well as for further standardizing processing methodologies. In summary, MSI establishes a direct link between the location of secondary metabolites and their physiological functions, metabolic differences across various conditions, and chemical transformations during processing. This information can guide targeted extraction of active metabolites and further optimize processing techniques.
4 MSI to elucidate HM mechanisms of action
The HM therapeutic effects are intricate and involve multiple components and target organs. This complexity poses a significant challenge for researchers in interpreting their pharmacologic actions. MSI has been employed to visualize the spatial distribution of active components as well as the metabolic status of endogenous metabolites in specific animal tissues. MSI-based metabolomics can offer valuable insights into the spatial alterations of endogenous biomarkers within tissues following drug administration, enabling a comprehensive understanding of the molecular-level pharmacological and toxic mechanisms of HMs (He et al., 2015).
4.1 Animal tissue distributions of active ingredients
The majority of HM compounds exhibit heterogeneous distribution in vivo, specifically targeting specific organ regions to achieve curative efficacies (Karlsson and Hanrieder, 2017). Their heterogeneous distributions in pathological tissues can provide valuable information for drug development. However, excessive accumulation in target organs can cause toxic side effects (Jiang et al., 2021). Hence, monitoring the spatial distribution and abundance of these compounds and their metabolites is a prerequisite for exploring their pharmacokinetic and pharmacodynamic properties. In addition to medicinal plant tissues, MSI is an efficient method for assessing the spatial dynamics of active constituents in animal tissues.
For example, tetrandrine, derived from the Chinese herb Stephania tetrandra S. Moore, is a notable natural product with remarkable anti-tumor bioactivity (Yu et al., 2018). MALDI-MSI result indicated that tetrandrine was widely distributed in the lung basal region, kidney cortex, and heart apex region. Despite homogeneous distribution in the liver, the elimination rate of tetrandrine was slow (Tang et al., 2019). Excessive accumulation of tetrandrine in these organs can trigger potentially pulmonary (Jin et al., 2011), hepatic (Wang et al., 2011), and renal (Qi et al., 2013) toxicities. Uncaria species (Rubiaceae) are used to treat central nervous system (CNS) disorders. Monoterpene indole alkaloids serve as the main active substances. Gao et al. successfully adopted DESI–MSI to locate and quantify seven Uncaria alkaloids in 13 brain regions. These alkaloids exhibited a heterogeneous distribution pattern across brain regions. Of note, 5 min post-administration, the pineal gland, a brain region that regulates biological rhythms, contained a higher abundance of alkaloids compared with other brain regions (Gao et al., 2022). Their enrichment phenomenon in specific region had an instructive significance in future pharmacodynamic studies. Ginsenoside Rg1 is a main active compound in the family Araliaceae, including P. notoginseng and Panaxginseng. Its distributions in heart, liver, spleen, lung, brain, and kidney tissues were revealed by nano-DESI combined with LC–MS/MS (Wei et al., 2021). The compound was mainly concentrated in the kidney pelvis, while there were no obvious accumulation trends in other organs. Rg1 also appeared in the CNS pons and medulla oblongata 15 min after intravenous administration. These cumulative findings provide new directions for further discovery of Rg1 effects. The spatial distribution of HM components within tissues serves as an informative indicator for predicting their bioactivities and identifying their target organs.
4.2 Pharmacologic and toxicologic mechanisms
Beyond compound distribution, MSI enables the visualization of the spatial positioning and dynamic alterations of endogenous metabolites within specific animal tissues. Recently, MSI-based spatial metabolomics has emerged as a novel way to visualize efficacy-related biomarkers and associate spatial distributions with histopathological staining. These approaches are more beneficial for detailing the pharmacological and toxicological mechanisms of HM from a spatial view compared with traditional metabolomics.
For example, pterostilbene, a polyphenolic compound extracted from grapes and blueberries (Dutta et al., 2023), is also the primary active substance in Resina Draconis. Ban et al. (2024) used DESI–MSI-based spatial metabolomics to probe the intricate mechanisms of pterostilbene in cerebral ischemia/reperfusion injury. Pterostilbene was widely distributed across the ischemic cortex lesion site. The specific distribution patterns of pterostilbene in ischemic brain tissue played a crucial role in explaining its unique pharmacological characteristics. Furthermore, the in situ reversal of the spatial distribution and abundance of altered metabolites, including glucose, glutamate, and creatine, in rat brain tissues, contributes to a deeper understanding of the underlying mechanisms of pterostilbene.
In a representative study regarding a TCM formula, XueFuZhuYu decoction, spatial metabolomics based on nano-DESI was employed to unveil the pathological progression and therapeutic effectiveness in the treatment of traumatic brain injury (TBI). According to ion imaging, phosphatidylcholines, lysophosphatidylcholine, and diacylglycerols were highly increased in the midbrain and thalamus after treatment. The accumulation was associated with the activation of “self-repair” mechanisms in the lesion area, activated by neuroinflammation during the chronic TBI phase. A total of 10 significant metabolic pathways were impacted following TBI treatment, and six related formula target proteins were identified, shedding light on the molecular mechanisms of XueFuZhuYu decoction in TBI treatment (Li Y. et al., 2021). Similarly, the protective mechanism of Shuangshen Ningxin Capsule against myocardial ischemia has been evaluated by spatial metabolomics (Lian et al., 2024). Researchers have applied DESI–MSI to search for brain biomarkers reflecting the warm and cool properties of ginseng and American ginseng, to explain the modern scientific connotation of the medicinal properties of HM (Huang et al., 2023). Therefore, MSI-based spatial metabolomics could become a reference methodology for interpreting TCM theory. In addition to pharmacological mechanisms, it is crucial to comprehensively describe the toxicological processes of candidates for drug discovery and development (Spruill et al., 2022). MSI can also serve as a powerful tool for investigating the toxicological mechanisms of HM, such as nephrotoxicity associated with aristolochic acids (Wang et al., 2020) and hepatotoxicity induced by Heshouwu [Polygonaceae; Root tubers of Polygonum multiflorum Thunb] (Jiang H. Y. et al., 2022). In conclusion, the integration of MSI-based spatial metabolomics with biochemical and histopathological examination can further deepen our understanding of the pharmacological and toxicological mechanisms of HM.
5 Future perspectives and challenges
Over the decades, MSI has benefited from continuous improvements in ion sources and mass analyzers. Various commercial ionization techniques, with higher spatial resolution and greater sensitivity, have been developed to accommodate the analysis of various metabolites. In the MSI process, abundant information on molecular structures, original spatial location, and relative contents of molecules are simultaneously provided without complex sample pretreatment. With its increasing popularity and technological superiority, MSI is expected to become a major tool in HM. Additionally, researchers should strive to expand MSI for other HM applications. For example, MSI might soon serve as a powerful tool for predicting HM component bioactivities, investigating unknown compounds according to their spatial distribution patterns, detecting HM pesticide residues, or authenticating HM combining with PCA and OPLS-DA. In terms of the therapeutic mechanisms of HM, most research has been focused on the evaluation of HM efficacy against brain disorders. Given its characteristics of in situ analysis and high spatial resolution, MSI will assist in unlocking dynamic metabolic processes in the tumor or disease microenvironment. Despite the unique strengths and novelty of MSI compared with other analytics, several major intrinsic limitations and challenges remain to be addressed. First, vast numbers of isomeric compounds in HM cannot be accurately distinguished by MSI alone due to its inability to perform chromatographic separation. Therefore, ion images obtained may contain a sum of substantial isomers. Complementary techniques are required to overcome the limitation. Although the introduction of tandem MSI can partially address this problem (Bednařík et al., 2022), distinguishing polysaccharides and isomers remains challenging. The integration of IM separation has enabled more isomer discrimination by determining the collision cross-section of metabolites based on shape, size, and ion charge (Jiang L. X. et al., 2023). Besides, it is also essential to use specific chemical reactions or structure-specific derivatization to identify isomers (Zhan et al., 2021). Second, accurate quantitation of HM ingredients and their metabolites between different regions of the same tissue or between different tissues using MSI techniques is a prerequisite for exploring their pharmacokinetic-pharmacodynamic properties. However, absolute quantitation remains a considerable challenge owing to the impacts of matrix effects and ion suppression on sample pixels during ionization (Alexandrov, 2023). Numerous efforts have been reported to achieve the relative or absolute MSI analysis. For example, the compensation for matrix effects is necessary for accurate quantification in MSI. As previously outlined (Unsihuay et al., 2021), various normalization strategies, appropriate sample preparation, and calibration measures have garnered significant attention for their potential to mitigate matrix signal interference. Third, enhanced confidence in compound/metabolite identification is in high demand. Generally, coupling MSI with tandem MS has proven to be an effective approach for acquiring additional structural information, thereby facilitating more reliable metabolite identification (Yin et al., 2023). Fourth, the high dimensionality of MSI data poses challenges in data analysis (e.g., data handling, processing, integration, storage). Consequently, specialized software and algorithm optimization are necessary to effectively manage and analyze the large volume of data generated in MSI experiments. Multiple vendors offer most of the currently used software, such as SCiLS™ Lab and MetaboScape® software from Bruker, ImageQuest from Thermo, High Definition Imaging Software from Waters Corp, and so on. In addition, some comprehensive software provided by Thermo Fisher Scientific, Agilent Technologies, SCIEX, etc. also have the function of processing MSI data, including PeakView®, MassHunter, and XCMS. Moreover, lipostarMSI is a newly developed and comprehensive software capable of executing all steps in the processing flow of MSI data. Per E. Andrén’s team has developed a space-efficient, direct access data compression algorithm for MSI to achieve efficient data archiving (Källback et al., 2018). Subsequently, an innovative spectral cross-normalization algorithm was introduced, incorporating intensity profile normalization and peptide mass resampling, along with a secondary normalization step. This approach adeptly minimizes technical discrepancies within the data, while preserving the integrity of the underlying biological information (Boskamp et al., 2021). Moreover, the establishment of public repositories and databases for published and shareable MSI data, coupled with the application of data mining tools/software, will facilitate convenient access to MSI techniques and promote its wider adoption. In the experiment, the MSI technique is capable of simultaneously detecting thousands of metabolites, which might lead to poor molecular specificity. Therefore, specific scanning modes such as Single Ion Monitoring need to be established during MS data collection to target the drugs and their metabolites of interest. Compared with LC-MS data, MSI also confronts the challenge of lower detection limits. Although some studies have been conducted to measure the absorption and distribution of HM components in vivo by increasing the medication dose, it may give rise to the potential risk of stress response and metabolic homeostasis disruption during high-dose administration. The advancements in mass analyzers in recent years have contributed to solving the problem. For example, in addition to the most widely used TOF, the introduction of Fourier transform ion cyclotron resonance and orbitrap mass analyzer is characterized by high mass resolving power and mass accuracy, significantly enhancing the detection limits and molecular specificity for MSI analysis (Kihara et al., 2017). Lastly, metabolites differ among preferred ion sources (Alexandrov, 2023). A single MSI technique cannot simultaneously detect all analytes of interest. Therefore, selecting an appropriate ionization approach, tailored to the characteristics of the target compound, is crucial for practical applications.
6 Conclusion
MSI plays an increasingly pivotal role in HM research, particularly in the analysis of spatial information about molecules within heterogeneous tissues. This technique is crucial for unveiling the biosynthetic pathways of active ingredients, providing insights into processing mechanisms, and understanding the target organs and actions of HMs by visualizing compound spatial distribution. This review provides a comprehensive overview of the three most common MSI techniques, highlighting their current applications in HM and strategies for improving the technique. It is anticipated that advancements in spatial resolution, matrix selection, and sample preparation will further enhance the discovery of novel HM compounds. With its exceptional performance and accessibility, MSI holds immense potential to revolutionize our understanding of HM, paving the way for more effective drug development and therapeutic strategies.
Statements
Author contributions
JZ: Writing–original draft. ZM: Writing–review and editing. DZ: Writing–review and editing. LG: Writing–review and editing. HZ: Writing–review and editing. MM: Writing–review and editing.
Funding
The author(s) declare that no financial support was received for the research, authorship, and/or publication of this article.
Conflict of interest
The authors declare that the research was conducted in the absence of any commercial or financial relationships that could be construed as a potential conflict of interest.
Publisher’s note
All claims expressed in this article are solely those of the authors and do not necessarily represent those of their affiliated organizations, or those of the publisher, the editors and the reviewers. Any product that may be evaluated in this article, or claim that may be made by its manufacturer, is not guaranteed or endorsed by the publisher.
References
1
AlexandrovT. (2023). Spatial metabolomics: from a niche field towards a driver of innovation. Nat. Metab.5 (9), 1443–1445. 10.1038/s42255-023-00881-0
2
Amstalden van HoveE. R.SmithD. F.HeerenR. M. (2010). A concise review of mass spectrometry imaging. J. Chromatogr. A1217 (25), 3946–3954. 10.1016/j.chroma.2010.01.033
3
AudinotJ. N.PhilippP.De CastroO.BiesemeierA.HoangQ. H.WirtzT. (2021). Highest resolution chemical imaging based on secondary ion mass spectrometry performed on the helium ion microscope. Rep. Prog. Phys.84 (10), 105901. 10.1088/1361-6633/ac1e32
4
BaijnathS.KayaI.NilssonA.ShariatgorjiR.AndrénP. E. (2022). Advances in spatial mass spectrometry enable in-depth neuropharmacodynamics. Trends Pharmacol. Sci.43 (9), 740–753. 10.1016/j.tips.2022.06.005
5
BanW.JiangX.LvL.JiaoY.HuangJ.YangZ.et al (2024). Illustrate the distribution and metabolic regulatory effects of pterostilbene in cerebral ischemia-reperfusion rat brain by mass spectrometry imaging and spatial metabolomics. Talanta266 (Pt 2), 125060. 10.1016/j.talanta.2023.125060
6
BarutI.FletcherJ. S. (2023). Cell and tissue imaging by secondary ion mass spectrometry. Biointerphases18 (6), 061202. 10.1116/6.0003140
7
BeckS.StengelJ. (2016). Mass spectrometric imaging of flavonoid glycosides and biflavonoids in Ginkgo biloba L. Phytochemistry130, 201–206. 10.1016/j.phytochem.2016.05.005
8
BednaříkA.PrysiazhnyiV.BezdekováD.SoltwischJ.DreisewerdK.PreislerJ. (2022). Mass spectrometry imaging techniques enabling visualization of lipid isomers in biological tissues. Anal. Chem.94 (12), 4889–4900. 10.1021/acs.analchem.1c05108
9
BehrensS.KapplerA.ObstM. (2012). Linking environmental processes to the in situ functioning of microorganisms by high-resolution secondary ion mass spectrometry (NanoSIMS) and scanning transmission X-ray microscopy (STXM). Environ. Microbiol.14 (11), 2851–2869. 10.1111/j.1462-2920.2012.02724.x
10
BichC.HavelundR.MoellersR.TouboulD.KollmerF.NiehuisE.et al (2013). Argon cluster ion source evaluation on lipid standards and rat brain tissue samples. Anal. Chem.85 (16), 7745–7752. 10.1021/ac4009513
11
BjarnholtN.LiB.D’AlviseJ.JanfeltC. (2014). Mass spectrometry imaging of plant metabolites--principles and possibilities. Nat. Prod. Rep.31 (6), 818–837. 10.1039/c3np70100j
12
BoskampT.CasadonteR.Hauberg-LotteL.DeiningerS.KriegsmannJ.MaassP. (2021). Cross-normalization of MALDI mass spectrometry imaging data improves site-to-site reproducibility. Anal. Chem.93 (30), 10584–10592. 10.1021/acs.analchem.1c01792
13
BottingC. H. (2003). Improved detection of higher molecular weight proteins by matrix-assisted laser desorption/ionization time-of-flight mass spectrometry on polytetrafluoroethylene surfaces. Rapid Commun. Mass Spectrom.17 (6), 598–602. 10.1002/rcm.954
14
CaprioliR. M.FarmerT. B.GileJ. (1997). Molecular imaging of biological samples: localization of peptides and proteins using MALDI-TOF MS. Anal. Chem.69 (23), 4751–4760. 10.1021/ac970888i
15
ChenW. J.ZhengY. N.ZhaoL.SongS. H.LongF.PeiZ. Q.et al (2022). Distribution of bioactive compounds in different tissues of Paeonia lactiflora roots by DESI-MSI and UPLC. China J. Chin. Materia Medica47 (16), 4333–4340. 10.19540/j.cnki.cjcmm.20220514.105
16
ChoA.NormileD. (2002). Nobel prize in chemistry. Mastering macromolecules. Science298 (5593), 527–528. 10.1126/science.298.5593.527b
17
CooksR. G.OuyangZ.TakatsZ.WisemanJ. M. (2006). Detection Technologies. Ambient mass spectrometry. Science311 (5767), 1566–1570. 10.1126/science.1119426
18
CornettD. S.ScholleM. D. (2017). Advances in MALDI mass spectrometry within drug discovery. SLAS Discov.22 (10), 1179–1181. 10.1177/2472555217735067
19
CroxattoA.Prod’homG.GreubG. (2012). Applications of MALDI-TOF mass spectrometry in clinical diagnostic microbiology. FEMS Microbiol. Rev.36 (2), 380–407. 10.1111/j.1574-6976.2011.00298.x
20
DaiS. Y.JingS. H.DongJ.LianC. J.QiaoF.ZhengJ.et al (2022). Visualization analysis of spatial distribution of alkaloids in Aconiti radix Cocta during processing processby matrix-assisted laser desorption ionization mass spectrometry imaging. Chin. Pharm. J.57 (10), 834–839. 10.11669/cpj.2022.10.010
21
DjambazovaK. V.van ArdenneJ. M.SpragginsJ. M. (2023). Advances in imaging mass spectrometry for biomedical and clinical research. Trends Anal. Chem.169, 117344. 10.1016/j.trac.2023.117344
22
DongY.AharoniA. (2022). Image to insight: exploring natural products through mass spectrometry imaging. Nat. Prod. Rep.39 (7), 1510–1530. 10.1039/d2np00011c
23
DongY.LiB.MalitskyS.RogachevI.AharoniA.KaftanF.et al (2016). Sample preparation for mass spectrometry imaging of plant tissues: a review. Front. Plant Sci.7, 60. 10.3389/fpls.2016.00060
24
DuttaB. J.RaksheP. S.MauryaN.ChibS.SinghS. (2023). Unlocking the therapeutic potential of natural stilbene: exploring pterostilbene as a powerful ally against aging and cognitive decline. Ageing Res. Rev.92, 102125. 10.1016/j.arr.2023.102125
25
EngelK. M.PrabutzkiP.LeopoldJ.NimptschA.LemmnitzerK.VosD. R. N.et al (2022). A new update of MALDI-TOF mass spectrometry in lipid research. Prog. Lipid Res.86, 101145. 10.1016/j.plipres.2021.101145
26
FanW.YangY.LiL.FanL.WangZ.YangL. (2022). Mass spectrometry-based profiling and imaging strategy, a fit-for-purpose tool for unveiling the transformations of ginsenosides in Panax notoginseng during processing. Phytomedicine103, 154223. 10.1016/j.phymed.2022.154223
27
FuchsB.SüssR.SchillerJ. (2010). An update of MALDI-TOF mass spectrometry in lipid research. Prog. Lipid Res.49 (4), 450–475. 10.1016/j.plipres.2010.07.001
28
GaoL.ZhangZ.WuW.DengY.ZhiH.LongH.et al (2022). Quantitative imaging of natural products in fine brain regions using desorption electrospray ionization mass spectrometry imaging (DESI-MSI): Uncaria alkaloids as a case study. Anal. Bioanal. Chem.414 (17), 4999–5007. 10.1007/s00216-022-04130-3
29
GaoS. Q.ZhaoJ. H.GuanY.TangY. S.LiY.LiuL. Y. (2023). Mass spectrometry imaging technology in metabolomics: a systematic review. Biomed. Chromatogr.37 (7), e5494. 10.1002/bmc.5494
30
GongP.LongH.GuoY.WangZ.YaoW.WangJ.et al (2024). Chinese herbal medicines: the modulator of nonalcoholic fatty liver disease targeting oxidative stress. J. Ethnopharmacol.318 (Pt B), 116927. 10.1016/j.jep.2023.116927
31
Guerquin-KernJ. L.WuT. D.QuintanaC.CroisyA. (2005). Progress in analytical imaging of the cell by dynamic secondary ion mass spectrometry (SIMS microscopy). Biochim. Biophys. Acta1724 (3), 228–238. 10.1016/j.bbagen.2005.05.013
32
GuoN.FangZ.ZangQ.YangY.NanT.ZhaoY.et al (2023a). Spatially resolved metabolomics combined with bioactivity analyses to evaluate the pharmacological properties of two Radix Puerariae species. J. Ethnopharmacol.313, 116546. 10.1016/j.jep.2023.116546
33
GuoX.WangX.TianC.DaiJ.ZhaoZ.DuanY. (2023b). Development of mass spectrometry imaging techniques and its latest applications. Talanta264, 124721. 10.1016/j.talanta.2023.124721
34
HanriederJ.PhanN. T.KurczyM. E.EwingA. G. (2013). Imaging mass spectrometry in neuroscience. ACS Chem. Neurosci.4 (5), 666–679. 10.1021/cn400053c
35
HarkinC.SmithK. W.CruickshankF. L.Logan MackayC.FlindersB.HeerenR. M. A.et al (2022). On-tissue chemical derivatization in mass spectrometry imaging. Mass Spectrom. Rev.41 (5), 662–694. 10.1002/mas.21680
36
HeF.HuangY. F.DaiW.QuX. Y.LuJ. G.LaoC. C.et al (2022). The localization of the alkaloids in Coptis chinensis rhizome by time-of-flight secondary ion mass spectrometry. Front. Plant Sci.13, 1092643. 10.3389/fpls.2022.1092643
37
HeH.QinL.ZhangY.HanM.LiJ.LiuY.et al (2019). 3,4-Dimethoxycinnamic acid as a novel matrix for enhanced in situ detection and imaging of low-molecular-weight compounds in biological tissues by MALDI-MSI. Anal. Chem.91 (4), 2634–2643. 10.1021/acs.analchem.8b03522
38
HeJ.LuoZ.HuangL.HeJ.ChenY.RongX.et al (2015). Ambient mass spectrometry imaging metabolomics method provides novel insights into the action mechanism of drug candidates. Anal. Chem.87 (10), 5372–5379. 10.1021/acs.analchem.5b00680
39
HeerenR. M. A. (2015). Getting the picture: the coming of age of imaging MS. Int. J. Mass Spectrom.377, 672–680. 10.1016/j.ijms.2014.04.021
40
HouJ.ZhangZ.ZhangL.WuW.HuangY.JiaZ.et al (2022a). Spatial lipidomics of eight edible nuts by desorption electrospray ionization with ion mobility mass spectrometry imaging. Food Chem.371, 130893. 10.1016/j.foodchem.2021.130893
41
HouJ. J.ZhangZ. J.WuW. Y.HeQ. Q.ZhangT. Q.LiuY. W.et al (2022b). Mass spectrometry imaging: new eyes on natural products for drug research and development. Acta Pharmacol. Sin.43 (12), 3096–3111. 10.1038/s41401-022-00990-8
42
HouY. S.PeiZ. Q.XvB. J.TangC. (2023). Real-time monitoring of the paclobutrazol variations in different parts ofAconitum carmichaeli during its growth based on UPLC-Q-TOF-MS and DESI-IMSI methods. Chin. Tradit. Pat. Med.45 (08), 2603–2608. 10.3969/j.issn.1001-1528
43
HuangX.WangR.WangY.ChenC.LiuS. (2023). Investigation on property differences of ginseng and American ginseng by spatial metabolomics of neurochemicals with desorption electrospray ionization mass spectrometry imaging. J. Ethnopharmacol.303, 116006. 10.1016/j.jep.2022.116006
44
IfaD. R.WuC.OuyangZ.CooksR. G. (2010). Desorption electrospray ionization and other ambient ionization methods: current progress and preview. Analyst135 (4), 669–681. 10.1039/b925257f
45
IshiiY.NakamuraK.MitsumotoT.TakimotoN.NamikiM.TakasuS.et al (2022). Visualization of the distribution of anthraquinone components from madder roots in rat kidneys by desorption electrospray ionization-time-of-flight mass spectrometry imaging. Food Chem. Toxicol.161, 112851. 10.1016/j.fct.2022.112851
46
JacksénJ.EmmerA. (2012). Evaluation of 2,6-dihydroxyacetophenone as matrix-assisted laser desorption/ionization matrix for analysis of hydrophobic proteins and peptides. Anal. Biochem.425 (1), 18–20. 10.1016/j.ab.2012.02.039
47
JiaF.ZhaoX.ZhaoY. (2023). Advancements in ToF-SIMS imaging for life sciences. Front. Chem.11, 1237408. 10.3389/fchem.2023.1237408
48
JiangH.GaoS.HuG.HeJ.JinH. (2021). Innovation in drug toxicology: application of mass spectrometry imaging technology. Toxicology464, 153000. 10.1016/j.tox.2021.153000
49
JiangH.ZhangY.LiuZ.WangX.HeJ.JinH. (2022a). Advanced applications of mass spectrometry imaging technology in quality control and safety assessments of traditional Chinese medicines. J. Ethnopharmacol.284, 114760. 10.1016/j.jep.2021.114760
50
JiangH. Y.GaoH. Y.LiJ.ZhouT. Y.WangS. T.YangJ. B.et al (2022b). Integrated spatially resolved metabolomics and network toxicology to investigate the hepatotoxicity mechanisms of component D of Polygonum multiflorum Thunb. J. Ethnopharmacol.298, 115630. 10.1016/j.jep.2022.115630
51
JiangL. X.HernlyE.HuH.HilgerR. T.NeuwegerH.YangM.et al (2023a). Nanospray desorption electrospray ionization (Nano-DESI) mass spectrometry imaging with high ion mobility resolution. J. Am. Soc. Mass Spectrom.34 (8), 1798–1804. 10.1021/jasms.3c00199
52
JiangM.LiX.ZhaoY.ZouY.BaiM.YangZ.et al (2023b). Characterization of ginsenosides from Panax japonicus var. major (Zhu-Zi-Shen) based on ultra-high performance liquid chromatography/quadrupole time-of-flight mass spectrometry and desorption electrospray ionization-mass spectrometry imaging. Chin. Med.18 (1), 115. 10.1186/s13020-023-00830-9
53
JinH.LiL.ZhongD.LiuJ.ChenX.ZhengJ. (2011). Pulmonary toxicity and metabolic activation of tetrandrine in CD-1 mice. Chem. Res. Toxicol.24 (12), 2142–2152. 10.1021/tx200290s
54
JingF.WangL.YangM.WuC.LiJ.ShiL.et al (2022). Visualizing the spatial distribution of functional metabolites in Forsythia suspensa at different harvest stages by MALDI mass spectrometry imaging. Fitoterapia162, 105285. 10.1016/j.fitote.2022.105285
55
KafeenahH.JenH. H.ChenS. H. (2022). Microdroplet mass spectrometry: accelerating reaction and application. Electrophoresis43 (1-2), 74–81. 10.1002/elps.202100208
56
KällbackP.NilssonA.ShariatgorjiM.AndrénP. E. (2018). A space efficient direct access data compression approach for mass spectrometry imaging. Anal. Chem.90 (6), 3676–3682. 10.1021/acs.analchem.7b03188
57
KarlssonO.HanriederJ. (2017). Imaging mass spectrometry in drug development and toxicology. Arch. Toxicol.91 (6), 2283–2294. 10.1007/s00204-016-1905-6
58
KatoL.MoraesA. P.de OliveiraC. M. A.VazB. G.de Almeida GonçalvesL.EcE. S.et al (2018). The spatial distribution of alkaloids in psychotria prunifolia (kunth) steyerm and palicourea coriacea (cham.) K. Schum leaves analysed by desorption electrospray ionisation mass spectrometry imaging. Phytochem. Anal.29 (1), 69–76. 10.1002/pca.2715
59
KiharaM.Matsuo-TezukaY.Noguchi-SasakiM.YorozuK.KurasawaM.ShimonakaY.et al (2017). Visualization of (57)Fe-labeled heme isotopic fine structure and localization of regions of erythroblast maturation in mouse spleen by MALDI FTICR-MS imaging. J. Am. Soc. Mass Spectrom.28 (11), 2469–2475. 10.1007/s13361-017-1768-y
60
KoestlerM.KirschD.HesterA.LeisnerA.GuentherS.SpenglerB. (2008). A high-resolution scanning microprobe matrix-assisted laser desorption/ionization ion source for imaging analysis on an ion trap/Fourier transform ion cyclotron resonance mass spectrometer. Rapid Commun. Mass Spectrom.22 (20), 3275–3285. 10.1002/rcm.3733
61
Kokesch-HimmelreichJ.WittekO.RaceA. M.RaketeS.SchlichtC.BuschU.et al (2022). MALDI mass spectrometry imaging: from constituents in fresh food to ingredients, contaminants and additives in processed food. Food Chem.385, 132529. 10.1016/j.foodchem.2022.132529
62
KompauerM.HeilesS.SpenglerB. (2017). Atmospheric pressure MALDI mass spectrometry imaging of tissues and cells at 1.4-μm lateral resolution. Nat. Methods14 (1), 90–96. 10.1038/nmeth.4071
63
KorteA. R.LeeY. J. (2014). MALDI-MS analysis and imaging of small molecule metabolites with 1,5-diaminonaphthalene (DAN). J. Mass Spectrom.49 (8), 737–741. 10.1002/jms.3400
64
KumarB. S. (2023). Desorption electrospray ionization mass spectrometry imaging (DESI-MSI) in disease diagnosis: an overview. Anal. Methods15 (31), 3768–3784. 10.1039/d3ay00867c
65
KuzmaB. A.PenceI. J.GreenfieldD. A.HoA.EvansC. L. (2021). Visualizing and quantifying antimicrobial drug distribution in tissue. Adv. Drug Deliv. Rev.177, 113942. 10.1016/j.addr.2021.113942
66
LaugesenS.RoepstorffP. (2003). Combination of two matrices results in improved performance of MALDI MS for peptide mass mapping and protein analysis. J. Am. Soc. Mass Spectrom.14 (9), 992–1002. 10.1016/s1044-0305(03)00262-9
67
LeeJ. L.NinomiyaS.MatsuoJ.GilmoreI. S.SeahM. P.ShardA. G. (2010). Organic depth profiling of a nanostructured delta layer reference material using large argon cluster ions. Anal. Chem.82 (1), 98–105. 10.1021/ac901045q
68
LeiH.ZhangY.YeJ.ChengT.LiangY.ZuX.et al (2021). A comprehensive quality evaluation of Fuzi and its processed product through integration of UPLC-QTOF/MS combined MS/MS-based mass spectral molecular networking with multivariate statistical analysis and HPLC-MS/MS. J. Ethnopharmacol.266, 113455. 10.1016/j.jep.2020.113455
69
LeopoldJ.PrabutzkiP.EngelK. M.SchillerJ. (2023). A five-year update on matrix compounds for MALDI-MS analysis of lipids. Biomolecules13 (3), 546. 10.3390/biom13030546
70
LiB.BhandariD. R.JanfeltC.RömppA.SpenglerB. (2014). Natural products in Glycyrrhiza glabra (licorice) rhizome imaged at the cellular level by atmospheric pressure matrix-assisted laser desorption/ionization tandem mass spectrometry imaging. Plant J.80 (1), 161–171. 10.1111/tpj.12608
71
LiB.BhandariD. R.RömppA.SpenglerB. (2016a). High-resolution MALDI mass spectrometry imaging of gallotannins and monoterpene glucosides in the root of Paeonia lactiflora. Sci. Rep.6, 36074. 10.1038/srep36074
72
LiB.GeJ.LiuW.HuD.LiP. (2021a). Unveiling spatial metabolome of Paeonia suffruticosa and Paeonia lactiflora roots using MALDI MS imaging. New Phytol.231 (2), 892–902. 10.1111/nph.17393
73
LiB.NeumannE. K.GeJ.GaoW.YangH.LiP.et al (2018). Interrogation of spatial metabolome of Ginkgo biloba with high-resolution matrix-assisted laser desorption/ionization and laser desorption/ionization mass spectrometry imaging. Plant Cell. Environ.41 (11), 2693–2703. 10.1111/pce.13395
74
LiH. Z.ZhaoY. F.WangD. J.LiH. J.HeJ. X.ChenX. F. (2023a). Identification and visualization analysis of ginsenosides in multi-steamed American ginseng based on UPLC-Q-TOF-MS/MS and MALDI-MSI. China J. Chin. Materia Medica, 1–14. 10.19540/j.cnki.cjcmm.20231211.301
75
LiL.QiuZ.JiangM.ZhangB.ChenQ.ZhangC.et al (2022). Visualizing the spatial distribution of arctium lappa L. Root components by MALDI-TOF mass spectrometry imaging. Foods11 (24), 3957. 10.3390/foods11243957
76
LiM.WangX.HanL.JiaL.LiuE.LiZ.et al (2020). Integration of multicomponent characterization, untargeted metabolomics and mass spectrometry imaging to unveil the holistic chemical transformations and key markers associated with wine steaming of Ligustri Lucidi Fructus. J. Chromatogr. A1624, 461228. 10.1016/j.chroma.2020.461228
77
LiQ.ChenY.GaoH.LiZ.QiuD.HuG. (2023b). In situ analysis of volatile oil in Angelica sinensis roots by fluorescence imaging combined with mass spectrometry imaging. Talanta255, 124253. 10.1016/j.talanta.2023.124253
78
LiY.WuQ.HuE.WangY.LuH. (2021b). Quantitative mass spectrometry imaging of metabolomes and lipidomes for tracking changes and therapeutic response in traumatic brain injury surrounding injured area at chronic phase. ACS Chem. Neurosci.12 (8), 1363–1375. 10.1021/acschemneuro.1c00002
79
LiZ. P.ZhenT.SunS. X. (2016b). TOF-SIMS study of mannitol and cordycepin in Cordyceps sinensis. Spectrosc. Spectr. analysis36 (04), 1230–1234. 10.3964/j.issn.1000-0593(2016)04-1230-05
80
LianC.ZhangF.YangH.ZhangX.LanJ.ZhangB.et al (2024). Multi-omics analysis of small RNA, transcriptome, and degradome to identify putative miRNAs linked to MeJA regulated and oridonin biosynthesis in Isodon rubescens. Int. J. Biol. Macromol.258 (Pt 2), 129123. 10.1016/j.ijbiomac.2023.129123
81
LiangQ.MondalP.LiQ.MaqboolT.ZhaoC.JiangD.et al (2024). Nitro indole derivatives as novel dual-polarity matrices for MALDI mass spectrometry and imaging with broad applications. Anal. Chem.96 (4), 1668–1677. 10.1021/acs.analchem.3c04684
82
LiQ.JiD. T.GaoH. (2023c). Spatial distribution of coumarins in Angelica pubescens fresh roots by MALDI-MSI. Chin. Traditional Herb. Drugs54 (11), 3438–3445. 10.7501/j.issn.0253-2670.2023.11.006
83
LiuF.ZhaoH. S.SunG. W.SongZ.XvF. H.MaM.et al (2020). Spatial distribution of panax notoginseng saponins visualized by matrix assisted laser analytical mass spectrometry. Chin. J. Anal. Chem.48 (07), 881–888. 10.19756/j.issn.0253-3820.201066
84
LiuH.BaiY.HuangC.WangY.JiY.DuY.et al (2023a). Recent progress of electrospun herbal medicine nanofibers. Biomolecules13 (1), 184. 10.3390/biom13010184
85
LiuP.WangJ. M.GuoH. C.ZhaoM. W.SongY. X.GuoH.et al (2023b). In situ detection and mass spectrometry imaging of protein-related metabolites in Bombyx batryticatus before and after frying with wheat bran. Front. Plant Sci.14, 1144556. 10.3389/fpls.2023.1144556
86
LiuQ. B.LuJ. G.JiangZ. H.ZhangW.LiW. J.QianZ. M.et al (2022a). In situ chemical profiling and imaging of cultured and natural Cordyceps sinensis by TOF-SIMS. Front. Chem.10, 862007. 10.3389/fchem.2022.862007
87
LiuY.YangX.ZhouC.WangZ.KuangT.SunJ.et al (2022b). Unveiling dynamic changes of chemical constituents in raw and processed Fuzi with different steaming time points using desorption electrospray ionization mass spectrometry imaging combined with metabolomics. Front. Pharmacol.13, 842890. 10.3389/fphar.2022.842890
88
LorensenM.BjarnholtN.St-PierreB.HeinickeS.CourdavaultV.O’ConnorS.et al (2023a). Spatial localization of monoterpenoid indole alkaloids in Rauvolfia tetraphylla by high resolution mass spectrometry imaging. Phytochemistry209, 113620. 10.1016/j.phytochem.2023.113620
89
LorensenM.HayatS. Y.WellnerN.BjarnholtN.JanfeltC. (2023b). Leaves of Cannabis sativa and their trichomes studied by DESI and MALDI mass spectrometry imaging for their contents of cannabinoids and flavonoids. Phytochem. Anal.34 (3), 269–279. 10.1002/pca.3202
90
LuD.WuY.ZhangJ.QiY.ZhangY.PanQ. (2023a). Visualizing the distribution of Jujube metabolites at different maturity stages using matrix-assisted laser desorption/ionization mass spectrometry imaging. Foods12 (20), 3795. 10.3390/foods12203795
91
LuY.CaoY.ChenD.ZhouY.ZhangL.SuY.et al (2023b). An online derivatization strategy targeting carbon-carbon double bonds by laser-ablation carbon fiber ionization mass spectrometry imaging: unraveling the spatial characteristic in mountain-cultivated ginseng and garden-cultivated ginseng with different ages. Food Chem.410, 135365. 10.1016/j.foodchem.2022.135365
92
LuoS.YangX.ZhangY.KuangT.TangC. (2024). Spatial metabolomics method to reveal differential metabolomes in microregions of Panax quinquefolius roots by using ultra-performance liquid chromatography quadrupole/time of flight-mass spectrometry and desorption electrospray ionization mass spectrometry imaging. Food Chem.435, 137504. 10.1016/j.foodchem.2023.137504
93
MaX.FernándezF. M. (2024). Advances in mass spectrometry imaging for spatial cancer metabolomics. Mass Spectrom. Rev.43 (2), 235–268. 10.1002/mas.21804
94
MatsumotoT.KushidaH.MatsushitaS.OyamaY.SudaT.WatanabeJ.et al (2017). Distribution analysis via mass spectrometry imaging of ephedrine in the lungs of rats orally administered the Japanese kampo medicine maoto. Sci. Rep.7, 44098. 10.1038/srep44098
95
McMillenJ. C.FincherJ. A.KleinD. R.SpragginsJ. M.CaprioliR. M. (2020). Effect of MALDI matrices on lipid analyses of biological tissues using MALDI-2 postionization mass spectrometry. J. Mass Spectrom.55 (12), e4663. 10.1002/jms.4663
96
MengX.FuW.HuoM.LiuY.ZhangZ.WeiJ.et al (2020). In situ label-free visualization of tissue distributions of salidroside in multiple mouse organs by MALDI-MS imaging. Int. J. Mass Spectrom.453, 116347. 10.1016/j.ijms.2020.116347
97
Meng-ChanX.CaiL.XuF.ZhanQ.FengJ.GuoC.et al (2022). Whole-body chemical imaging of Cordyceps sinensis by TOF-SIMS to visualize spatial differentiation of ergosterol and other active components. Microchem. J. Devoted Appl. Microtech. all Branches Sci.177, 107303. 10.1016/j.microc.2022.107303
98
Mesa SanchezD.BrownH. M.YinR.ChenB.VavrekM.CancillaM. T.et al (2022). Mass spectrometry imaging of diclofenac and its metabolites in tissues using nanospray desorption electrospray ionization. Anal. Chim. Acta1233, 340490. 10.1016/j.aca.2022.340490
99
MokoschA. S.GerbigS.GreveldingC. G.HaeberleinS.SpenglerB. (2021). High-resolution AP-SMALDI MSI as a tool for drug imaging in Schistosoma mansoni. Anal. Bioanal. Chem.413 (10), 2755–2766. 10.1007/s00216-021-03230-w
100
MoratoN. M.CooksR. G. (2023). Desorption electrospray ionization mass spectrometry: 20 years. Acc. Chem. Res.56 (18), 2526–2536. 10.1021/acs.accounts.3c00382
101
Morikawa-IchinoseT.FujimuraY.MurayamaF.YamazakiY.YamamotoT.WariishiH.et al (2019). Improvement of sensitivity and reproducibility for imaging of endogenous metabolites by matrix-assisted laser desorption/ionization-mass spectrometry. J. Am. Soc. Mass Spectrom.30 (8), 1512–1520. 10.1007/s13361-019-02221-7
102
NgK. M.LiangZ.LuW.TangH. W.ZhaoZ.CheC. M.et al (2007). In vivo analysis and spatial profiling of phytochemicals in herbal tissue by matrix-assisted laser desorption/ionization mass spectrometry. Anal. Chem.79 (7), 2745–2755. 10.1021/ac062129i
103
NieL. X.HuangL. Y.QianX. Y.KangS.YaoL. W.DaiZ.et al (2023). Complementary mass spectrometry imaging and discovery of quality characters-related markers of isati-dis radix based on AP-MALDI-IT-TOF/MS and DESI-Q-TOF/MS. Chin. Pharm. J.58 (09), 823–830. 10.11669/cpj.2023.09.009
104
NieL. X.HuangL. Y.WangX. P.LvL. F.YangX. X.JiaX. F.et al (2022). Desorption electrospray ionization mass spectrometry imaging illustrates the quality characters of isatidis radix. Front. Plant Sci.13, 897528. 10.3389/fpls.2022.897528
105
NinomiyaS.IchikiK.YamadaH.NakataY.SekiT.AokiT.et al (2009). Precise and fast secondary ion mass spectrometry depth profiling of polymer materials with large Ar cluster ion beams. Rapid Commun. Mass Spectrom.23 (11), 1601–1606. 10.1002/rcm.4046
106
PaineM. R. L.KooijmanP. C.FisherG. L.HeerenR. M. A.FernándezF. M.EllisS. R. (2017). Visualizing molecular distributions for biomaterials applications with mass spectrometry imaging: a review. J. Mater Chem. B5 (36), 7444–7460. 10.1039/c7tb01100h
107
PanL.WangY.YueL.WangN.XuW.LiaoX.et al (2023). Review on processing methods of toxic Chinese Materia Medica and the related mechanisms of action. Am. J. Chin. Med.51 (6), 1385–1412. 10.1142/s0192415x23500635
108
PareekV.TianH.WinogradN.BenkovicS. J. (2020). Metabolomics and mass spectrometry imaging reveal channeled de novo purine synthesis in cells. Science368 (6488), 283–290. 10.1126/science.aaz6465
109
QiX. M.MiaoL. L.CaiY.GongL. K.RenJ. (2013). ROS generated by CYP450, especially CYP2E1, mediate mitochondrial dysfunction induced by tetrandrine in rat hepatocytes. Acta Pharmacol. Sin.34 (9), 1229–1236. 10.1038/aps.2013.62
110
QiaoF.DaiS. Y.LianC. J.LiuJ.DongJ.ZhengJ.et al (2022). Visualization analysis of spatial distribution of chemical compositions in Morindae Officinalis Radix processed product by matrix-assisted la-sorption ionization mass spectrometry imaging. Chin. J. Pharm. Analysis42 (08), 1312–1318. 10.16155/j.0254-1793.2022.08.03
111
QinS. B.TanP.HaoL.XieJ. X.LinJ. Z.ZhangL.et al (2024). Mechanism of fritillariae cirrhosae bulbus against pulmonary fibrosis based on spatial metabolomics Chinese Traditional and herbal drugs55(02),479–488.
112
RajbhandariP.NeelakantanT. V.HosnyN.StockwellB. R. (2024). Spatial pharmacology using mass spectrometry imaging. Trends Pharmacol. Sci.45 (1), 67–80. 10.1016/j.tips.2023.11.003
113
RenJ. L.YangL.QiuS.ZhangA. H.WangX. J. (2023). Efficacy evaluation, active ingredients, and multitarget exploration of herbal medicine. Trends Endocrinol. Metab.34 (3), 146–157. 10.1016/j.tem.2023.01.005
114
SchulzS.BeckerM.GrosecloseM. R.SchadtS.HopfC. (2019). Advanced MALDI mass spectrometry imaging in pharmaceutical research and drug development. Curr. Opin. Biotechnol.55, 51–59. 10.1016/j.copbio.2018.08.003
115
ShiR.DaiX.LiW.LuF.LiuY.QuH.et al (2017). Hydroxyl-group-dominated graphite dots reshape laser desorption/ionization mass spectrometry for small biomolecular analysis and imaging. ACS Nano11 (9), 9500–9513. 10.1021/acsnano.7b05328
116
SjövallP.LausmaaJ.JohanssonB. (2004). Mass spectrometric imaging of lipids in brain tissue. Anal. Chem.76 (15), 4271–4278. 10.1021/ac049389p
117
SpenglerB. (2015). Mass spectrometry imaging of biomolecular information. Anal. Chem.87 (1), 64–82. 10.1021/ac504543v
118
SpruillM. L.Maletic-SavaticM.MartinH.LiF.LiuX. (2022). Spatial analysis of drug absorption, distribution, metabolism, and toxicology using mass spectrometry imaging. Biochem. Pharmacol.201, 115080. 10.1016/j.bcp.2022.115080
119
SturtevantD.LeeY. J.ChapmanK. D. (2016). Matrix assisted laser desorption/ionization-mass spectrometry imaging (MALDI-MSI) for direct visualization of plant metabolites in situ. Curr. Opin. Biotechnol.37, 53–60. 10.1016/j.copbio.2015.10.004
120
SunC.LiuW.MaS.ZhangM.GengY.WangX. (2020a). Development of a high-coverage matrix-assisted laser desorption/ionization mass spectrometry imaging method for visualizing the spatial dynamics of functional metabolites in Salvia miltiorrhiza Bge. J. Chromatogr. A1614, 460704. 10.1016/j.chroma.2019.460704
121
SunC.MaS.LiL.WangD.LiuW.LiuF.et al (2021a). Visualizing the distributions and spatiotemporal changes of metabolites in Panax notoginseng by MALDI mass spectrometry imaging. J. Ginseng Res.45 (6), 726–733. 10.1016/j.jgr.2021.04.001
122
SunC.ZhangM.DongH.LiuW.GuoL.WangX. (2020b). A spatially-resolved approach to visualize the distribution and biosynthesis of flavones in Scutellaria baicalensis Georgi. J. Pharm. Biomed. Anal.179, 113014. 10.1016/j.jpba.2019.113014
123
SunC. L.LiuW.GuoL. P.WangX. (2021b). Analysis on tissue distribution of metabolites in Lotus seed by MALDI mass spectrometry imaging technique. J. Instrum. Analysis40 (01), 86–91. 10.3969/j.issn.1004-4957.2021.01.012
124
TairaS.IkedaR.YokotaN.OsakaI.SakamotoM.KatoM.et al (2010). Mass spectrometric imaging of ginsenosides localization in Panax ginseng root. Am. J. Chin. Med.38 (3), 485–493. 10.1142/s0192415x10008007
125
TakátsZ.WisemanJ. M.CooksR. G. (2005). Ambient mass spectrometry using desorption electrospray ionization (DESI): instrumentation, mechanisms and applications in forensics, chemistry, and biology. J. Mass Spectrom.40 (10), 1261–1275. 10.1002/jms.922
126
TakátsZ.WisemanJ. M.GologanB.CooksR. G. (2004). Mass spectrometry sampling under ambient conditions with desorption electrospray ionization. Science306 (5695), 471–473. 10.1126/science.1104404
127
TalatyN.TakátsZ.CooksR. G. (2005). Rapid in situ detection of alkaloids in plant tissue under ambient conditions using desorption electrospray ionization. Analyst130 (12), 1624–1633. 10.1039/b511161g
128
TanX.HeQ.PeiZ.LiuY.FengZ.LiC.et al (2023). Rapid visual characterization of alkaloid changes in traditional processing of Tibetan medicine Aconitum pendulum by high-performance thin-layer chromatography coupled with desorption electrospray ionization mass spectrometry imaging. Front. Pharmacol.14, 1104473. 10.3389/fphar.2023.1104473
129
TangW.ChenJ.ZhouJ.GeJ.ZhangY.LiP.et al (2019). Quantitative MALDI imaging of spatial distributions and dynamic changes of tetrandrine in multiple organs of rats. Theranostics9 (4), 932–944. 10.7150/thno.30408
130
ThomenA.NajafinobarN.PenenF.KayE.UpadhyayP. P.LiX.et al (2020). Subcellular mass spectrometry imaging and absolute quantitative analysis across organelles. ACS Nano14 (4), 4316–4325. 10.1021/acsnano.9b09804
131
TianF.LiuR.FanC.SunY.HuangX.NieZ.et al (2020). Effects of thymoquinone on small-molecule metabolites in a rat model of cerebral ischemia reperfusion injury assessed using MALDI-MSI. Metabolites10 (1), 27. 10.3390/metabo10010027
132
TongQ.ZhangC.TuY.ChenJ.LiQ.ZengZ.et al (2022). Biosynthesis-based spatial metabolome of Salvia miltiorrhiza Bunge by combining metabolomics approaches with mass spectrometry-imaging. Talanta238 (Pt 2), 123045. 10.1016/j.talanta.2021.123045
133
TrimP. J.HensonC. M.AveryJ. L.McEwenA.SnelM. F.ClaudeE.et al (2008). Matrix-assisted laser desorption/ionization-ion mobility separation-mass spectrometry imaging of vinblastine in whole body tissue sections. Anal. Chem.80 (22), 8628–8634. 10.1021/ac8015467
134
TuY. (2016). Artemisinin-A gift from traditional Chinese medicine to the world (Nobel lecture). Angew. Chem. Int. Ed. Engl.55 (35), 10210–10226. 10.1002/anie.201601967
135
UnsihuayD.Mesa SanchezD.LaskinJ. (2021). Quantitative mass spectrometry imaging of biological systems. Annu. Rev. Phys. Chem.72, 307–329. 10.1146/annurev-physchem-061020-053416
136
VallianatouT.ShariatgorjiM.NilssonA.FridjonsdottirE.KällbackP.SchintuN.et al (2019). Molecular imaging identifies age-related attenuation of acetylcholine in retrosplenial cortex in response to acetylcholinesterase inhibition. Neuropsychopharmacology44 (12), 2091–2098. 10.1038/s41386-019-0397-5
137
VickermanJ. C. (2011). Molecular imaging and depth profiling by mass spectrometry--SIMS, MALDI or DESI?Analyst136 (11), 2199–2217. 10.1039/c1an00008j
138
WanS.XieX.YangG.FengF. (2024). Discovery of the toxicity-related quality markers and mechanisms of Zhi-Zi-Hou-Po decoction based on Chinmedomics combined with differentially absorbed components and network pharmacology. J. Ethnopharmacol.320, 117408. 10.1016/j.jep.2023.117408
139
WangB.DongJ.JiJ.YuanJ.WangJ.WuJ.et al (2016). Study on the alkaloids in Tibetan medicine Aconitum pendulum Busch by HPLC-MSn combined with column chromatography. J. Chromatogr. Sci.54 (5), 752–758. 10.1093/chromsci/bmw002
140
WangD.QiM.ZhaoH. D.ChenH.WangY. M.JiangY. N.et al (2022). HPLC and DESI-MSI study on the dynamic accumulation and distribution of secondary metabolites of Coptischinensis in different growth years. J. Beijing Univ. Traditional Chin. Med.45 (06), 612–620. 10.3969/j.issn.1006-2157.2022.06.021
141
WangH.GaoY.HeQ.LiaoJ.ZhouS.LiuY.et al (2023a). 2-Hydrazinoterephthalic acid as a novel negative-ion matrix-assisted laser desorption/ionization matrix for qualitative and quantitative matrix-assisted laser desorption/ionization-mass spectrometry analysis of N-glycans in peach allergy research. J. Agric. Food Chem.71 (1), 952–962. 10.1021/acs.jafc.2c06822
142
WangJ.van der HeijdenR.SpijksmaG.ReijmersT.WangM.XuG.et al (2009). Alkaloid profiling of the Chinese herbal medicine Fuzi by combination of matrix-assisted laser desorption ionization mass spectrometry with liquid chromatography-mass spectrometry. J. Chromatogr. A1216 (11), 2169–2178. 10.1016/j.chroma.2008.11.077
143
WangJ.ZhaoJ.NieS.XieM.LiS. (2023b). MALDI mass spectrometry in food carbohydrates analysis: a review of recent researches. Food Chem.399, 133968. 10.1016/j.foodchem.2022.133968
144
WangL.ZhuT.XuH. B.PuX. P.ZhaoX.TianF.et al (2021a). Effects of notoginseng leaf triterpenes on small molecule metabolism after cerebral ischemia/reperfusion injury assessed using MALDI-MS imaging. Ann. Transl. Med.9 (3), 246. 10.21037/atm-20-4898
145
WangN.PanW.ZhuM.ZhangM.HaoX.LiangG.et al (2011). Fangchinoline induces autophagic cell death via p53/sestrin2/AMPK signalling in human hepatocellular carcinoma cells. Br. J. Pharmacol.164 (2b), 731–742. 10.1111/j.1476-5381.2011.01349.x
146
WangT.LeeH. K.YueG. G. L.ChungA. C. K.LauC. B. S.CaiZ. (2021b). A novel binary matrix consisting of graphene oxide and caffeic acid for the analysis of scutellarin and its metabolites in mouse kidney by MALDI imaging. Analyst146 (1), 289–295. 10.1039/d0an01539c
147
WangZ.HeB.LiuY.HuoM.FuW.YangC.et al (2020). In situ metabolomics in nephrotoxicity of aristolochic acids based on air flow-assisted desorption electrospray ionization mass spectrometry imaging. Acta Pharm. Sin. B10 (6), 1083–1093. 10.1016/j.apsb.2019.12.004
148
WeiW.LiZ.LiH.AnY.QuH.YaoC.et al (2021). Exploration of tissue distribution of ginsenoside Rg1 by LC-MS/MS and nanospray desorption electrospray ionization mass spectrometry. J. Pharm. Biomed. Anal.198, 113999. 10.1016/j.jpba.2021.113999
149
WenzelT.SparbierK.MieruchT.KostrzewaM. (2006). 2,5-Dihydroxyacetophenone: a matrix for highly sensitive matrix-assisted laser desorption/ionization time-of-flight mass spectrometric analysis of proteins using manual and automated preparation techniques. Rapid Commun. Mass Spectrom.20 (5), 785–789. 10.1002/rcm.2378
150
WisemanJ. M.IfaD. R.SongQ.CooksR. G. (2006). Tissue imaging at atmospheric pressure using desorption electrospray ionization (DESI) mass spectrometry. Angew. Chem. Int. Ed. Engl.45 (43), 7188–7192. 10.1002/anie.200602449
151
WuC.DillA. L.EberlinL. S.CooksR. G.IfaD. R. (2013). Mass spectrometry imaging under ambient conditions. Mass Spectrom. Rev.32 (3), 218–243. 10.1002/mas.21360
152
WuH.DaiZ.LiuX.LinM.GaoZ.TianF.et al (2019a). Pharmacodynamic evaluation of shenfu injection in rats with ischemic heart failure and its effect on small molecules using matrix-assisted laser desorption/ionization-mass spectrometry imaging. Front. Pharmacol.10, 1424. 10.3389/fphar.2019.01424
153
WuH.LiuX.GaoZ. Y.DaiZ. F.LinM.TianF.et al (2019b). Anti-myocardial infarction effects of radix Aconiti lateralis preparata extracts and their influence on small molecules in the heart using matrix-assisted laser desorption/ionization-mass spectrometry imaging. Int. J. Mol. Sci.20 (19), 4837. 10.3390/ijms20194837
154
WuW.LiangZ.ZhaoZ.CaiZ. (2007a). Direct analysis of alkaloid profiling in plant tissue by using matrix-assisted laser desorption/ionization mass spectrometry. J. Mass Spectrom.42 (1), 58–69. 10.1002/jms.1138
155
WuW.QiaoC.LiangZ.XuH.ZhaoZ.CaiZ. (2007b). Alkaloid profiling in crude and processed Strychnos nux-vomica seeds by matrix-assisted laser desorption/ionization-time of flight mass spectrometry. J. Pharm. Biomed. Anal.45 (3), 430–436. 10.1016/j.jpba.2007.06.031
156
WuX.WangS.LuJ.JingY.LiM.CaoJ.et al (2018). Seeing the unseen of Chinese herbal medicine processing (Paozhi): advances in new perspectives. Chin. Med.13, 4. 10.1186/s13020-018-0163-3
157
WuZ. H.SuY.LuoZ. F.SunZ. L.GongZ. H.XiaoL. T. (2022a). In situ visual distribution of gelsemine, koumine, and gelsenicine by MSI in gelsemiumelegans at different growth stages. Molecules27 (6), 1810. 10.3390/molecules27061810
158
WuZ. H.WangR. Z.SunZ. L.SuY.XiaoL. T. (2022b). A mass spectrometry imaging approach on spatiotemporal distribution of multiple alkaloids in Gelsemium elegans. Front. Plant Sci.13, 1051756. 10.3389/fpls.2022.1051756
159
XiaJ.HeX.YangW.SongH.YangJ.ZhangG.et al (2024). Unveiling the distribution of chemical constituents at different body parts and maturity stages of Ganoderma lingzhi by combining metabolomics with desorption electrospray ionization mass spectrometry imaging (DESI). Food Chem.436, 137737. 10.1016/j.foodchem.2023.137737
160
XiaJ.LouG.ZhangL.HuangY.YangJ.GuoJ.et al (2023). Unveiling the spatial distribution and molecular mechanisms of terpenoid biosynthesis in Salvia miltiorrhiza and S. grandifolia using multi-omics and DESI-MSI. Hortic. Res.10 (7), uhad109. 10.1093/hr/uhad109
161
XiaM. C.ZhanQ.CaiL.WuJ.LiZ.SunS.et al (2021). Investigation into the content change and distribution of active components in Cordyceps sinensis with growth cycle by direct TOF-SIMS detection. Microchem. J.164, 106026. 10.1016/j.microc.2021.106026
162
YangJ.LiW. H.AnR.WangY. L.XuY.ChenJ.et al (2017). Differentially expressed genes in heads and tails of Angelica sinensis diels: focusing on ferulic acid metabolism. Chin. J. Integr. Med.23 (10), 779–785. 10.1007/s11655-016-2603-1
163
YangM.UnsihuayD.HuH.Nguele MekeF.QuZ.ZhangZ. Y.et al (2023). Nano-DESI mass spectrometry imaging of proteoforms in biological tissues with high spatial resolution. Anal. Chem.95 (12), 5214–5222. 10.1021/acs.analchem.2c04795
164
YangY.YangY.QiuH.JuZ.ShiY.WangZ.et al (2021). Localization of constituents for determining the age and parts of ginseng through ultraperfomance liquid chromatography quadrupole/time of flight-mass spectrometry combined with desorption electrospray ionization mass spectrometry imaging. J. Pharm. Biomed. Anal.193, 113722. 10.1016/j.jpba.2020.113722
165
YinZ.HuangW.FernieA. R.YanS. (2023). Mass spectrometry imaging techniques: a versatile toolbox for plant metabolomics. Trends Plant Sci.28 (2), 250–251. 10.1016/j.tplants.2022.10.009
166
YokoiH.KasaharaY.ObikaS.DoiT.KamadaH. (2018). Development of a detection method for antisense oligonucleotides in mouse kidneys by matrix-assisted laser desorption/ionization imaging mass spectrometry. Rapid Commun. Mass Spectrom.32 (23), 1984–1990. 10.1002/rcm.8274
167
YoonS.LeeT. G. (2018). Biological tissue sample preparation for time-of-flight secondary ion mass spectrometry (ToF-SIMS) imaging. Nano Converg.5 (1), 24. 10.1186/s40580-018-0157-y
168
YuM.LiuT.ChenY.LiY.LiW. (2018). Combination therapy with protein kinase inhibitor H89 and Tetrandrine elicits enhanced synergistic antitumor efficacy. J. Exp. Clin. Cancer Res.37 (1), 114. 10.1186/s13046-018-0779-2
169
YukihiroY.ZaimaN. (2020). Application of mass spectrometry imaging for visualizing food components. Foods9 (5), 575. 10.3390/foods9050575
170
ZhanL.HuangX.XueJ.LiuH.XiongC.WangJ.et al (2021). MALDI-TOF/TOF tandem mass spectrometry imaging reveals non-uniform distribution of disaccharide isomers in plant tissues. Food Chem.338, 127984. 10.1016/j.foodchem.2020.127984
171
ZhangG. H.LiuX. L.MaC. X.LiW. H.WangX. (2022a). Spatial distribution characteristics of metabolities in rhizome of Paris polyphylla var. yunnanensis: based on MALDI-MSI. China J. Chin. Materia Medica47 (05), 1222–1229. 10.19540/j.cnki.cjcmm.20211223.101
172
ZhangJ.DongF.WangY.WangC.ZhangC.XuK.et al (2024a). N-acetyldopamine oligomers from Periplaneta americana with anti-inflammatory and vasorelaxant effects and their spatial distribution visualized by mass spectrometry imaging. J. Ethnopharmacol.318 (Pt B), 116989. 10.1016/j.jep.2023.116989
173
ZhangJ.DuQ.SongX.GaoS.PangX.LiY.et al (2020). Evaluation of the tumor-targeting efficiency and intratumor heterogeneity of anticancer drugs using quantitative mass spectrometry imaging. Theranostics10 (6), 2621–2630. 10.7150/thno.41763
174
ZhangM.GuoF.LiX.XianM.WangT.WuH.et al (2022b). Yi-Xin-Shu capsule ameliorates cardiac hypertrophy by regulating RB/HDAC1/GATA4 signaling pathway based on proteomic and mass spectrometry image analysis. Phytomedicine103, 154185. 10.1016/j.phymed.2022.154185
175
ZhangY.YangY.RenJ.YanG.YangL.WuX.et al (2024b). Chinmedomics strategy for elucidating the effects and effective constituents of Danggui Buxue Decoction in treating blood deficiency syndrome. Front. Mol. Biosci.11, 1376345. 10.3389/fmolb.2024.1376345
176
ZhaoW. H.ZhangY. D.ShiY. P. (2021). Visualizing the spatial distribution of endogenous molecules in wolfberry fruit at different development stages by matrix-assisted laser desorption/ionization mass spectrometry imaging. Talanta234, 122687. 10.1016/j.talanta.2021.122687
177
ZhaoY.JiangM.LiuM.WangH.WangW.ZhangT.et al (2023). Spatial distribution and characterization of the small-molecule metabolites and in situ hydrolyzed oligosaccharides in the rhizome of Glycyrrhiza uralensis by desorption electrospray ionization-mass spectrometry imaging and high-resolution liquid chromatography-mass spectrometry. J. Agric. Food Chem.71 (50), 20372–20385. 10.1021/acs.jafc.3c04996
178
ZhouN.LiZ.WangJ. J.WuQ. T.LiK.ZhengX. K.et al (2021). Correlation analysis between extracts and endogenous metabolites to characterise the influence of salt-processing on compatibility mechanism of ‘Psoraleae Fructus & Foeniculi Fructus. J. Ethnopharmacol.270, 113782. 10.1016/j.jep.2021.113782
179
ZhouP.ZuoL.LiuC.XiongB.LiZ.ZhouX.et al (2024). Unraveling spatial metabolome of the aerial and underground parts of Scutellaria baicalensis by matrix-assisted laser desorption/ionization mass spectrometry imaging. Phytomedicine123, 155259. 10.1016/j.phymed.2023.155259
180
ZhuC.JiangX.TianJ.ChenJ.LinC.WangC.et al (2022). Integrated approach toward absorption, distribution, metabolism, and excretion of Xiaoke pills in zebrafish based on UPLC-HRMS and DESI-MS techniques. J. Chromatogr. B Anal. Technol. Biomed. Life Sci.1200, 123276. 10.1016/j.jchromb.2022.123276
181
ZhuT.WangL.TianF.ZhaoX.PuX. P.SunG. B.et al (2020). Anti-ischemia/reperfusion injury effects of notoginsenoside R1 on small molecule metabolism in rat brain after ischemic stroke as visualized by MALDI-MS imaging. Biomed. Pharmacother.129, 110470. 10.1016/j.biopha.2020.110470
182
ZhuX.XuT.PengC.WuS. (2021). Advances in MALDI mass spectrometry imaging single cell and tissues. Front. Chem.9, 782432. 10.3389/fchem.2021.782432
183
ZouY.TangW.LiB. (2022). Mass spectrometry imaging and its potential in food microbiology. Int. J. Food Microbiol.371, 109675. 10.1016/j.ijfoodmicro.2022.109675
Summary
Keywords
mass spectrometry imaging, herbal medicine, spatial distribution, chemical components, mechanisms of action
Citation
Zhang J, Mao Z, Zhang D, Guo L, Zhao H and Miao M (2024) Mass spectrometry imaging as a promising analytical technique for herbal medicines: an updated review. Front. Pharmacol. 15:1442870. doi: 10.3389/fphar.2024.1442870
Received
03 June 2024
Accepted
18 July 2024
Published
01 August 2024
Volume
15 - 2024
Edited by
Elizabeth Neumann, University of California, Davis, United States
Reviewed by
Linnan Li, Shanghai University of Traditional Chinese Medicine, China
Ruiping Zhang, Chinese Academy of Medical Sciences and Peking Union Medical College, China
Updates
Copyright
© 2024 Zhang, Mao, Zhang, Guo, Zhao and Miao.
This is an open-access article distributed under the terms of the Creative Commons Attribution License (CC BY). The use, distribution or reproduction in other forums is permitted, provided the original author(s) and the copyright owner(s) are credited and that the original publication in this journal is cited, in accordance with accepted academic practice. No use, distribution or reproduction is permitted which does not comply with these terms.
*Correspondence: Mingsan Miao, miaomingsan@hactcm.edu.cn
†These authors have contributed equally to this work
Disclaimer
All claims expressed in this article are solely those of the authors and do not necessarily represent those of their affiliated organizations, or those of the publisher, the editors and the reviewers. Any product that may be evaluated in this article or claim that may be made by its manufacturer is not guaranteed or endorsed by the publisher.