 Yi-Chang Zhao1,2Zhi-Hua Sun1,3Jia-Kai Li1,2Huai-Yuan Liu1,2
 Bi-Kui Zhang1,2
 Xu-Biao Xie4Chun-Hua Fang4
 Indy Sandaradura5,6
 Feng-Hua Peng4*
 Miao Yan1,2*
- 1Department of Pharmacy, The Second Xiangya Hospital, Central South University, Changsha, Hunan, China
- 2International Research Center for Precision Medicine, Transformative Technology and Software Services, Changsha, Hunan, China
- 3School of Basic Medicine and Clinical Pharmacy, China Pharmaceutical University, Nanjing, China
- 4Department of Urological Organ Transplantation, The Second Xiangya Hospital, Central South University, Changsha, Hunan, China
- 5School of Medicine, University of New South Wales, Sydney, NSW, Australia
- 6Centre for Infectious Diseases and Microbiology, Westmead Hospital, Sydney, NSW, Australia
Objectives: Significant increase in tacrolimus exposure was observed during co-administration with voriconazole, and no population pharmacokinetic model exists for tacrolimus in renal transplant recipients receiving voriconazole. To achieve target tacrolimus concentrations, an optimal dosage regimen is required. This study aims to develop individualized dosing parameters through population pharmacokinetic analysis and simulate tacrolimus concentrations under different dosage regimens.
Methods: We conducted a retrospective study of renal transplant recipients who were hospitalized at the Second Xiangya Hospital of Central South University between January 2016 and March 2021. Subsequently, pharmacokinetic analysis and Monte Carlo simulation were employed for further analysis.
Results: Nineteen eligible patients receiving tacrolimus and voriconazole co-therapy were included in the study. We collected 167 blood samples and developed a one-compartment model with first-order absorption and elimination to describe the pharmacokinetic properties of tacrolimus. The final typical values for tacrolimus elimination rate constant (Ka), apparent volume of distribution (V/F), and apparent oral clearance (CL/F) were 8.39 h−1, 2690 L, and 42.87 L/h, respectively. Key covariates in the final model included voriconazole concentration and serum creatinine. Patients with higher voriconazole concentration had lower tacrolimus CL/F and V/F. In addition, higher serum creatinine levels were associated with lower tacrolimus CL/F.
Conclusion: Our findings suggest that clinicians can predict tacrolimus concentration and estimate optimal tacrolimus dosage based on voriconazole concentration and serum creatinine. The effect of voriconazole concentration on tacrolimus concentration was more significant than serum creatinine. These findings may inform clinical decision-making in the management of tacrolimus and voriconazole therapy in solid organ transplant recipients.
1 Introduction
In the context of terminal renal failure, renal transplantation represents the most effective therapeutic intervention, offering the potential for significant improvements in both survival and quality of life (Turcotte, 1979; Vester et al., 1998). The management of renal transplantation recipients (RTRs) necessitates a complex immunosuppressive regimen, commonly involving calcineurin inhibitors such as tacrolimus or cyclosporine, alongside mycophenolate mofetil and corticosteroids (Vaden, 1997; Ciancio et al., 2004). Tacrolimus is a calcineurin inhibitor and a potent inhibitor of human T-cell proliferation (Naesens et al., 2009). In particular, is favored over cyclosporine due to its superior efficacy in promoting graft survival and its relatively more favorable side effect profile (Ciancio et al., 2004; Woodroffe et al., 2005; Bowman and Brennan, 2008). However, the clinical application of tacrolimus is complicated by its narrow therapeutic index and substantial intra- and inter-patient variability, which make precise dosing a persistent challenge for clinicians (Venkataramanan et al., 1995; Staatz and Tett, 2004; Davis et al., 2020; Degraeve et al., 2020). Achieving and maintaining therapeutic drug levels is critical, as deviations can lead to either graft rejection or drug toxicity, underscoring the necessity for meticulous dose optimization.
This challenge is further compounded in RTRs who are at an elevated risk for invasive fungal infections—a serious and often life-threatening complication in immunocompromised individuals (van Delden et al., 2020; Sharma et al., 2022). Azole agents, particularly voriconazole, are the cornerstone of therapy for these infections (Karthaus, 2010; Marr et al., 2015). However, the combination administration of tacrolimus and voriconazole is associated with significant pharmacokinetic interactions, most notably the inhibition of tacrolimus metabolism, which can lead to substantial fluctuations in tacrolimus blood levels (Kramer et al., 2011; Mori et al., 2012; Vanhove et al., 2017; Chen X. et al., 2021b). These fluctuations pose a critical risk to patient outcomes, necessitating careful management and dose adjustments to mitigate the potential for adverse reactions. Given the high prevalence of renal transplantation and the significant morbidity associated with improperly managed tacrolimus therapy, it is imperative to address the interaction between tacrolimus and voriconazole with precision. Although numerous pharmacogenetic and pharmacokinetic factors contribute to the variability in tacrolimus levels, the interaction with voriconazole is particularly significant and challenging to manage (Vanhove et al., 2017; Ota et al., 2019; Chen et al., 2022a). Current guidelines, including those outlined in the Vfend package insert, suggest reducing the initial dose of tacrolimus during voriconazole co-therapy. However, these these recommendations are often broad and lack specificity, resulting in inconsistent application across clinical settings. Furthermore, much of the existing literature has focused on the use of voriconazole in a general context rather than rigorously analyzing the specific impact of its dosage and concentration on tacrolimus pharmacokinetics (Vanhove et al., 2017; Chen et al., 2022a). This limitation underscores the need for a more nuanced and individualized approach to tacrolimus dosing, which remains a central concern for clinicians seeking to optimize therapeutic outcomes. Our previous study (Zhao et al., 2022), also provided critical insights into the interactions between these two drugs in RTRs, demonstrated that voriconazole significantly increases tacrolimus exposure and highlighted the importance of considering voriconazole concentration (CVRC) as a pivotal factor in the adjustment of tacrolimus dosing. However, while this study established a foundational understanding of the interaction, it also underscored the need for a more sophisticated modeling approach to guide clinical decision-making. Therefore, despite the widespread use of voriconazole in renal transplantation, there remains no consensus on the precise adjustments required for tacrolimus dosing during voriconazole co-therapy. By addressing this gap, our study seeks to provide clinicians with a practical and evidence-based tool to enhance patient outcomes through tailored tacrolimus management. Current study aims to develop a robust population pharmacokinetic (PopPK) model that incorporates CVRC as a critical covariate, which can be used to simulate and optimize tacrolimus dosing in RTRs, offering a more precise and individualized approach to therapy.
2 Materials and methods
2.1 Study design and population
A non-intervention clinical study was conducted to investigate renal transplant recipients hospitalized at the Second Xiangya Hospital of Central South University between January 2016 and March 2021. The study received approval from the Ethics Committee of the hospital [(2020) Ethical Review [CR] No. (077)] and was registered on the Chinese Clinical Trial Registry (Registration number: ChiCTR2100048712). Throughout the study and data analysis, strict measures were implemented to maintain patient confidentiality.
Inclusion Criteria: 1) Patients who underwent renal transplantation for the first time; 2) At least 18 years old; 3)Hospitalized in the Renal Transplantation Department of the Second Xiangya Hospital; 4) Received voriconazole within 15 days post-operation; 5) Had at least three measurements of tacrolimus and voriconazole concentrations; 6) Received an oral triple immunosuppressive regimen of tacrolimus consisting of tacrolimus, mycophenolate mofetil, and glucocorticoid.
Exclusion Criteria: 1) Patients without precise records of tacrolimus dosage and duration; 2) Lacking cytochrome P450 (CYP3A5) and cytochrome P450 2C19 (CYP2C19) genotyping data; 3) Concurrently receiving cyclosporine, sirolimus, or other immunosuppressive agents; 4) On medications such as rifampicin, isoniazid, phenytoin sodium, or other strong CYP450 solid inducers or inhibitors; 5) Underwent renal replacement therapy within 72 h prior to concentration measurement.
2.2 Concentration and data collection
Tacrolimus concentrations in whole-blood samples were analyzed using a chemiluminescence microparticle immunoassay, specifically employing the ARCHITECT Tacrolimus Reagent Kit IL77-35, in accordance with the Prograf Assay Kit instruction il77-G08363R10-B1L77C (Laboratories, 2020). Voriconazole plasma concentrations were determined using the method previously described (Zhao et al., 2021). The National Health Commission Clinical Testing Center conducted annual laboratory quality evaluations to ensure the reliability of the results. Clinical data, including sex, weight, time post-transplant, age, albumin, hematocrit, creatinine (CREA), aspartate aminotransferase, C-reactive protein, total bilirubin, direct bilirubin, CYP3A5 genotype, and CYP2C19 genotype were collected. The tacrolimus administration schedule was determined by attending physicians based on clinical guidelines and their professional experience. We ensured that there was no interference with the established oral administration schedule of tacrolimus. Blood samples were obtained without intervention, with the majority collected within a 30-min window prior to tacrolimus administration.
2.3 Pharmacokinetic analysis and Monte Carlo simulation
Prior to developing the PPK model, we conducted an exploratory analysis of the data characteristics using the QQ plot, histogram, and frequency distribution diagram provided by the software. Baseline characteristics were summarized as mean (standard deviation: SD) or median (first quartile, third quartile), depending on their distribution, with categorical with categorical variables expressed as number (%). Subsequently, we employed Phoenix NLME pharmacokinetic software (version 8.1, Pharsight, a Certara Company, USA) to construct the PPK model for tacrolimus blood concentration-time data in RTRs receiving concomitant voriconazole. We assessed the model fit by calculating the Bayesian information criterion (BIC) and Akaike information criterion (AIC) to identify the most appropriate structural model (Vrieze, 2012; Liu et al., 2023). A shrinkage value below 20% was deemed acceptable (Xu et al., 2012). Covariate models were evaluated using a stepwise approach, starting with forward inclusion (p ≤ 0.01, ΔOFV >6.635) followed by backward elimination with more stringent criteria (p < 0.001, ΔOFV >10.828), ensuring consistency across the model. Model evaluation involved goodness-fit plots, bootstrap resampling, and visual predictive check (VPC). After finalizing the PPK model, we identified key covariates and used the Monte Carlo simulation method to predict tacrolimus trough concentration on the third day. In our study, the optimal dosage regimen was determined to achieve a target tacrolimus trough concentration within the therapeutic range of 5–10 ng/mL, with a probability of target attainment (PTA) of 70% or higher (Chen et al., 2022b).
3 Results
3.1 Study population and effect of voriconazole on tacrolimus concentration
The study ultimately comprised 19 patients in the model-building group. The patients screening workflow is illustrated in the flow chart (Figure 1). Of these patients, 15 (78.9%) were male RTRs, with a median age of 44 years old and a median weight of 63 kg. Among them, 17 (89.5%) were donors from brain-dead organ donation (DBD), 1 (5.3%) was a donor from cardiac death organ donation (DCD), and 1 (5.3%) was a living donor. Only patients with the CYP3A5 genotypes *1/*3 (10 cases) and *3/*3 (9 cases) were included. In total, 167 blood samples were collected, with an average of 8–9 samples per patient. Detailed demographic data are presented in Table 1.

Figure 1. Flow chart of enrolled patients.
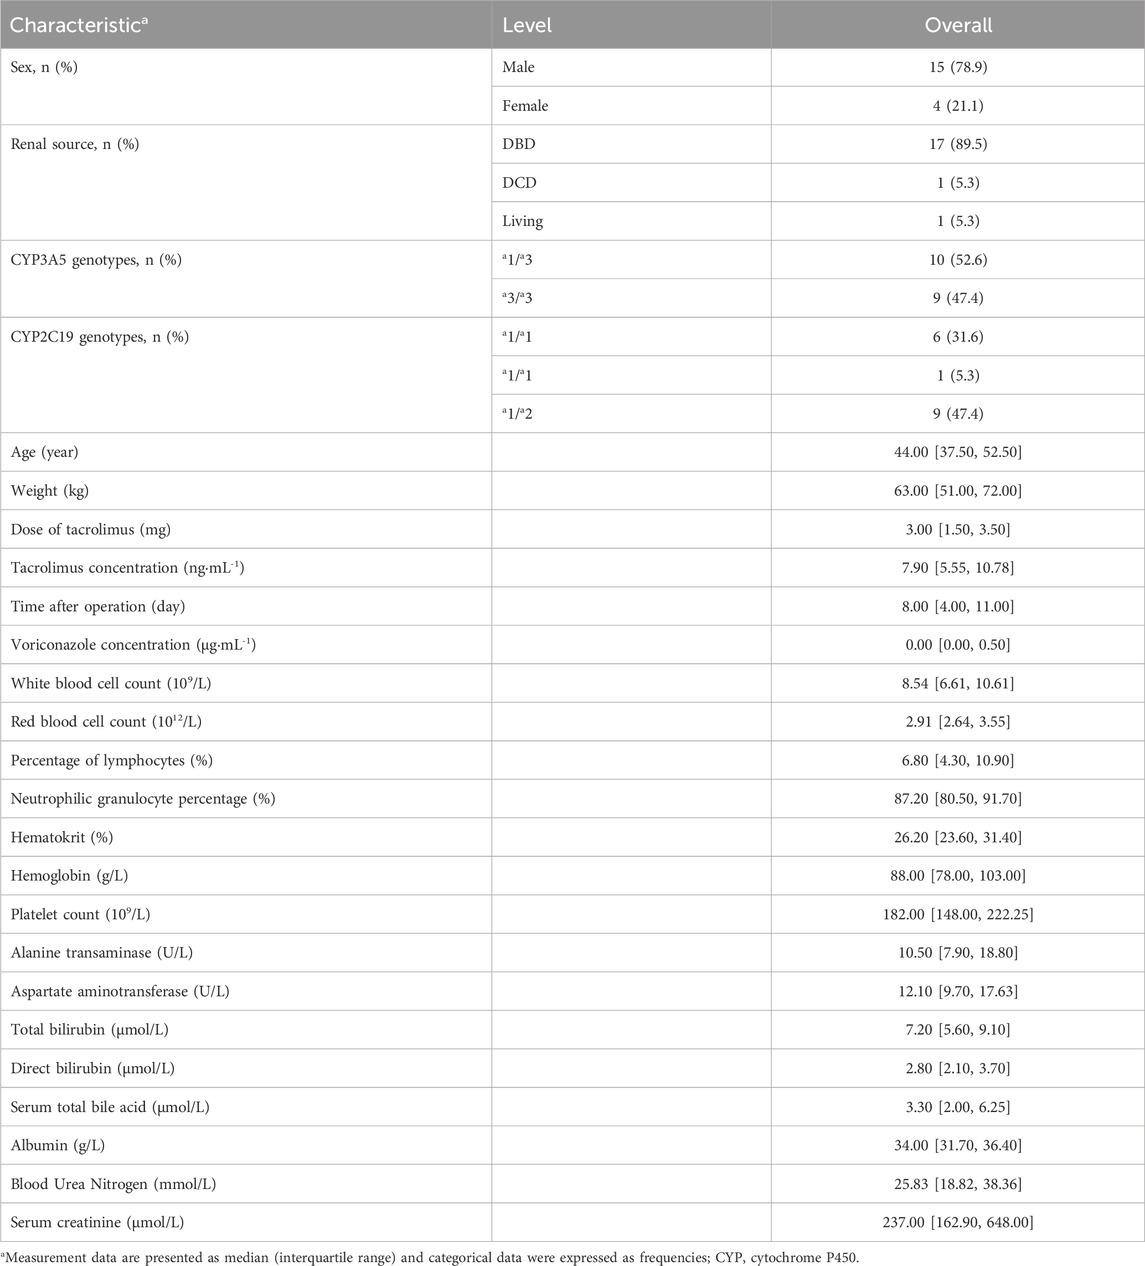
Table 1. Patient demographic data (N = 19).
3.2 Establishment of the PPK model
3.2.1 Base model
In the structural model development process, both one-compartment and two-compartment models were evaluated for their Log-Likelihood, AIC, OFV, and shrinkage parameters. The results, summarized in Table 2, indicate that the performance of the one-compartment model was comparable to that of the two-compartment model. Additionally, the additive residual model yielded results similar to those of the proportional residual model.
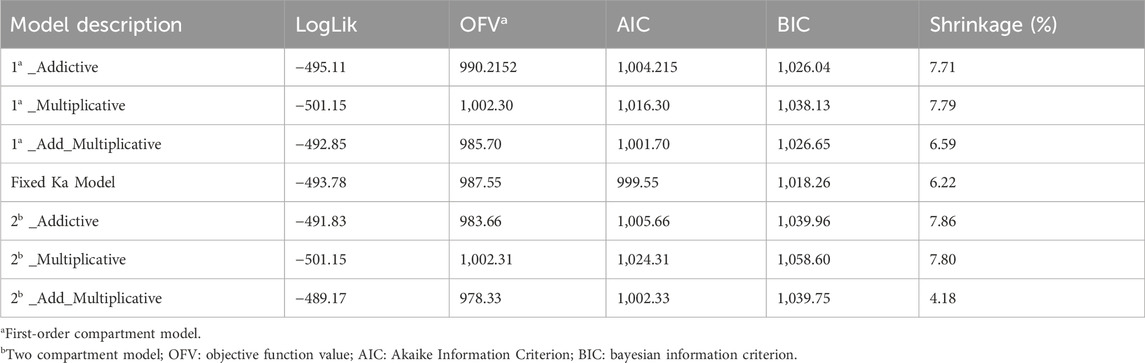
Table 2. Comparison of base models.
However, given its increased complexity and additional parameters, the two-compartment model was considered less suitable. Consequently, a one-compartment model with first-order absorption and elimination, along with an additive residual model, was selected to describe the pharmacokinetic characteristics of tacrolimus. The base PPK model includes parameters for the elimination rate constant (Ka), apparent volume of distribution (V/F), and apparent oral clearance (CL/F), with Ka fixed during the analysis. The results of these parameters mentioned above are illustrated in Table 3. The values for Ka, V/F, and CL/F in the base model were 8.39 h−1, 5,291/L, and 32.14 L/h, respectively, with coefficients of variation (CV%) of 13.31%, 22.91%, and 18.05%. Following the removal of diagonal elements, the shrinkage value of CL/F and V/F were reduced by 22.5% and 3.87% respectively.
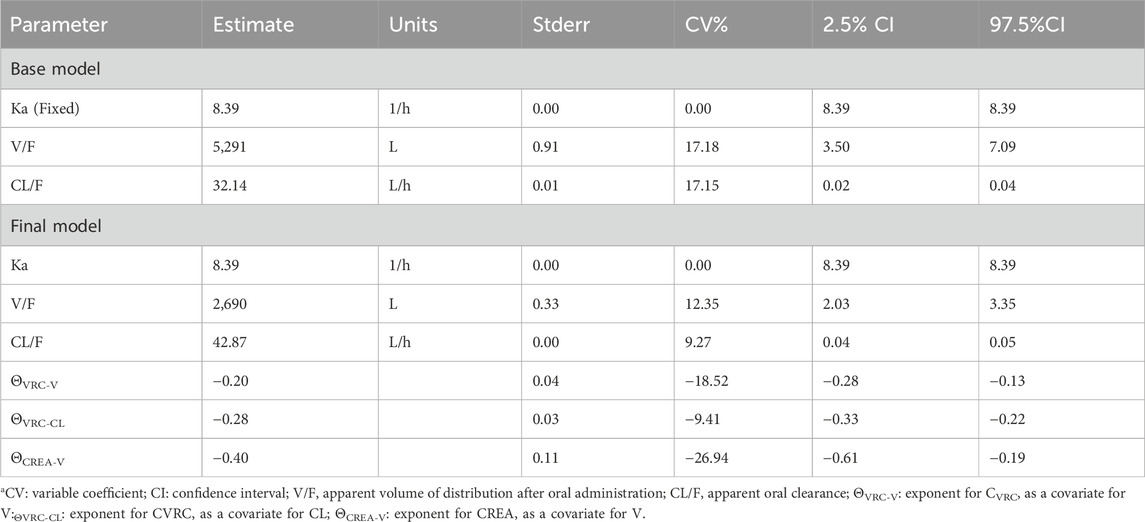
Table 3. Parametric results of the basic and final modela.
3.2.2 Final model
Prior to screening for covariates, we assessed correlations among the covariates to mitigate issues related to multicollinearity. The covariates evaluated included the CYP3A5 genotype, CYP2C19 genotype, CVRC, and 26 other additional variables. By integrating the trend plots of parameters such as Ka, V/F, CL/F, along with the covariates, a graphical analysis was conducted (Figure 2). The analysis revealed that urea nitrogen was positively correlated with both CL/F and V/F, while CREA was similarly positively correlated with both CL/F and V/F. In contrast, white blood cell count demonstrated a negative correlation with V/F. Subsequently, CVRC, CYP2C19 genotype, and CYP3A5 genotype were included to develop the full covariate model. During the covariate selection process, a forward addition procedure was applied with criteria of p ≤ 0.01 and ΔOFV >6.635, followed by backward elimination with more stringent criteria of p < 0.001 and ΔOFV >10.828. The final covariates selected were CVRC and CREA. A comparison results between the basic and final models are also presented in Table 3.
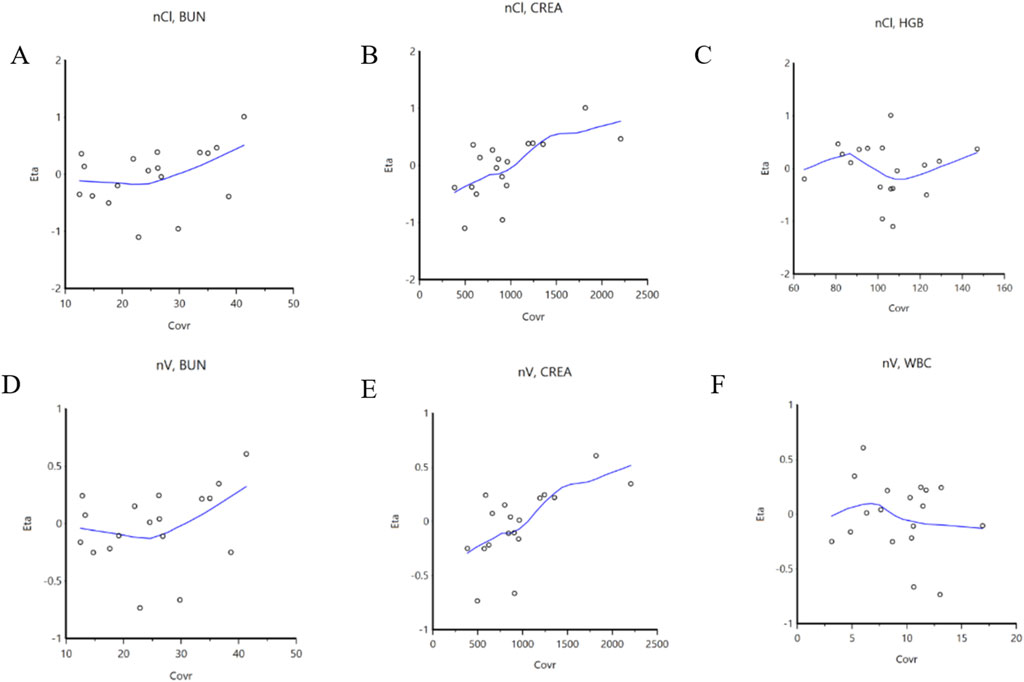
Figure 2. Correlation between covariables and parameters. (A): BUN is correlated with CL/F; (B): CREA is correlated with CL/F; (C): HGB is correlated with CL/F; (D): BUN is correlated with V/F; (E): CREA is correlated with V/F; (F): WBC is correlated with V/F. BUN: blood urea nitrogen; CL/F: apparent oral clearance; CREA: serum creatinine; HGB: Hemoglobin; V/F: apparent volume of distribution; WBC: white blood cell count.
3.3 Model validation
3.3.1 The plot of the goodness of fit
The goodness of fit plots of the final model are presented in Figures 3A–D. Figures 3A, B display the individual predicted values, population predicted value, and observed values, respectively. The concentration points are evenly distributed along the Y = X diagonal, indicating a strong correction between the predicted values (both individual and population) and the observed values in the final model. Figure 3C illustrates the distribution of conditionally weighted residuals (CWRES) against the individual predicted values, while Figure 3D shows the distribution of CWRES against the time after medication. The CWRES are centered around y = 0 and are uniformly distributed between y = ±2. Thus, the covariate model established is deemed reasonable.
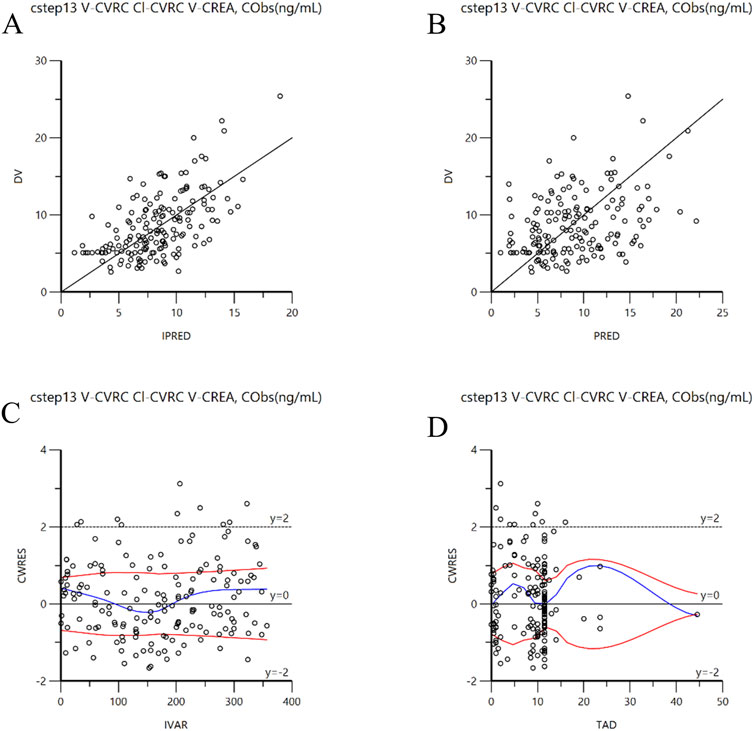
Figure 3. Goodness-of-fit plots for the final model. (A): DV versus individual IPRED; (B): DV versus PRED; (C): CWRES versus IVAR; (D): CWRES versus TAD. CWRES: Conditional population weighted residuals; DV: Dependent variable (observed concentration); IPRED: individual population prediction; PRED: population prediction; IVAR: individual observed value; TAD : Time after dose.
3.3.2 Bootstrap validation
The model was internally validated using the Bootstrap method with 1,000 resampling iterations. The mean values and 95% confidence intervals of pharmacokinetic parameters derived from the Bootstrap analysis are presented in Table 4. The average value of the parameter values obtained through the Bootstrap method are consistent with those of the final model, and the 95% confidence interval of the simulated results fall within a reasonable range, without including zero. Therefore, the parameter estimates from the final model are stable, reliable and minimally influenced by the sample distribution.
Table 4. Comparison of parameter estimates in the final model and bootstrapa.
3.3.3 VPC validation
The VPC method was employed to conduct 1,000 simulation iterations to validate the final model. The VPC diagnosis plots are displayed in Figure 4A (TAD vs. DV) and Figure 4B (IVAR vs. DV). As shown in the figures, the 5th, 50th, and 95th quantiles of the observed values all fall within the 90% confidence interval of the corresponding predicted values. This indicates a high degree of agreement between the predicted and observed values, demonstrating the model’s strong predictive performance.
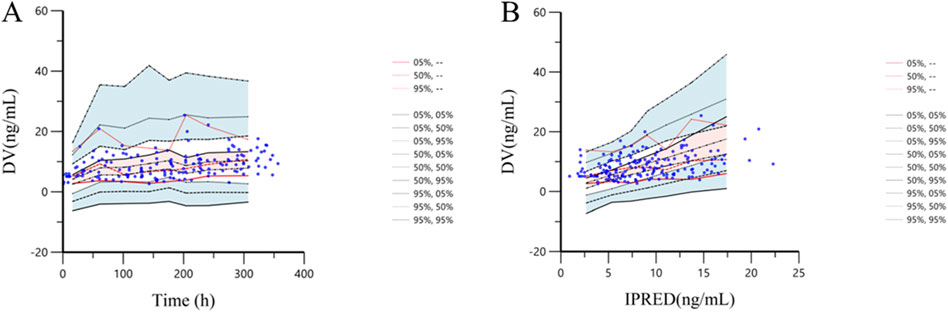
Figure 4. Prediction corrected-visual predictive check of tacrolimus final model. (A): The X-axis represents time, while the Y-axis represents observed tacrolimus concentrations. Blue hollow dots represent the observed tacrolimus concentrations. Black dotted lines show the 5th, 50th and 95th percentiles of the simulated data. Solid red lines indicate the 5th, 50th and 95th percentiles of the observed data. The shaded areas represent the 90% CIs of the quantile corresponding to the simulated data. (B): The X-axis represents IPRED, while the Y-axis represents observed tacrolimus concentrations. Blue hollow dots represent the observed tacrolimus concentrations. Black dotted lines show the 5th, 50th and 95th percentiles of the simulated data. Solid red lines indicate the 5th, 50th and 95th percentiles of the observed data. The shaded areas represent the 90% CIs of the quantile corresponding to the simulated data.
3.4 Monte Carlo simulation
3.4.1 Monte Carlo simulations of different CVRC
Using the final established final PPK model, we identified CVRC and CREA as two key covariates. We then evaluated 11 different tacrolimus dosing regimens and predicted tacrolimus trough concentration based on 15 different CVRC levels (Table 5). For this analysis, we conducted 1,000 Monte Carlo simulations for patients with varying levels of CVRC (ranging from 0 to 7.0 μg/mL). The CREA value, fixed at the median of 237 μmol/L, was held constant. The detailed mean and standard deviation of the trough concentration on the third day after tacrolimus administration are also presented in Table 5. The median tacrolimus trough concentrations based on the simulated data are visually depicted in Supplementary Figure S1. Based on the predicted tacrolimus concentrations, we further calculated the probability of target attainment (PTA) to maintain concentration within the therapeutic range of 5–10 ng/mL (Chen et al., 2022b). These results are provided in the (Supplementary Table S1). Additionally, a visual heat map of the data is shown in Figure 5.
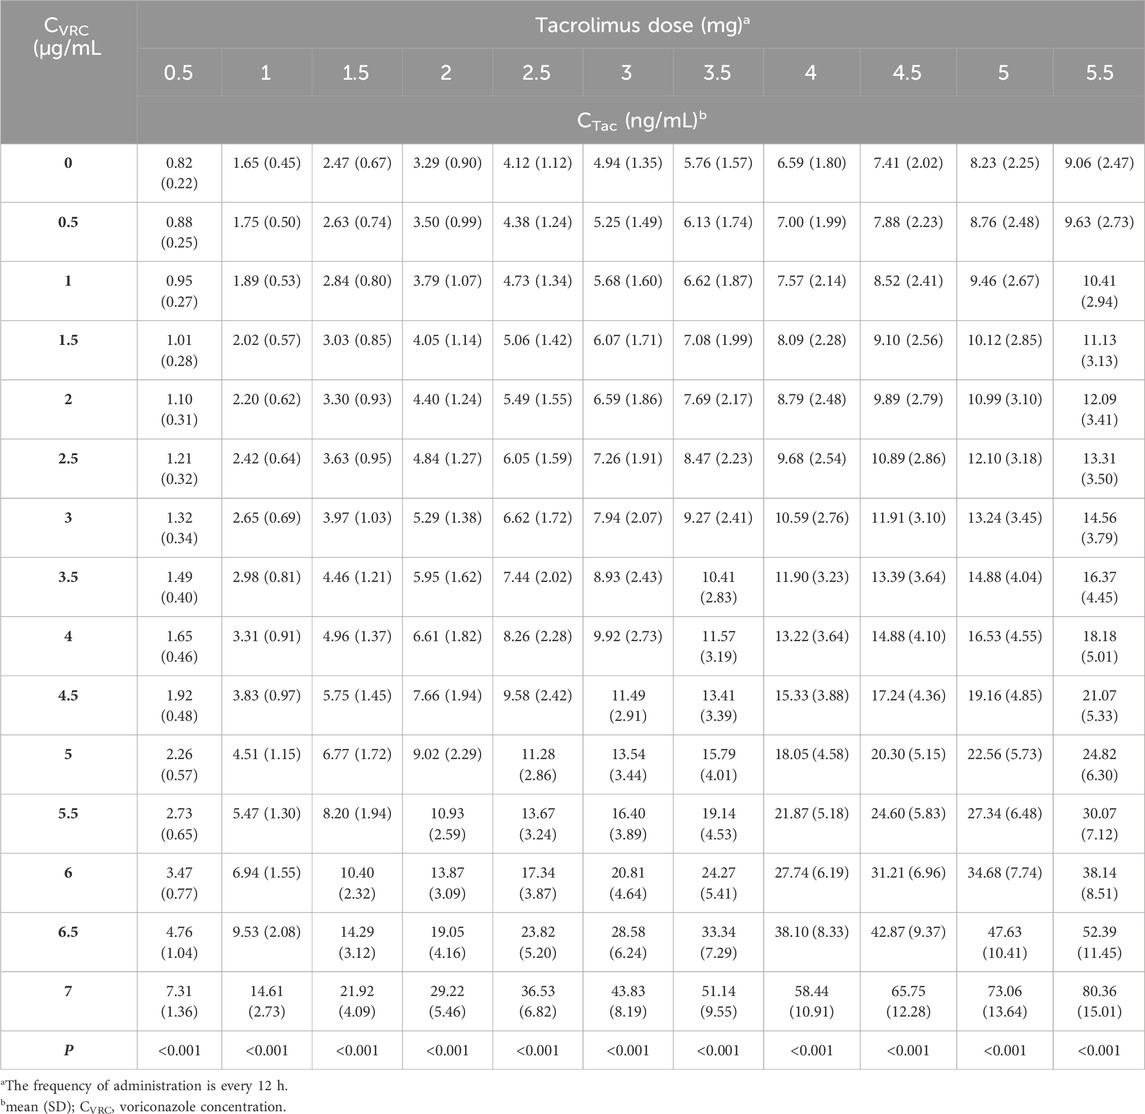
Table 5. Tacrolimus trough concentration on day 3 based on different CVRC and doses.
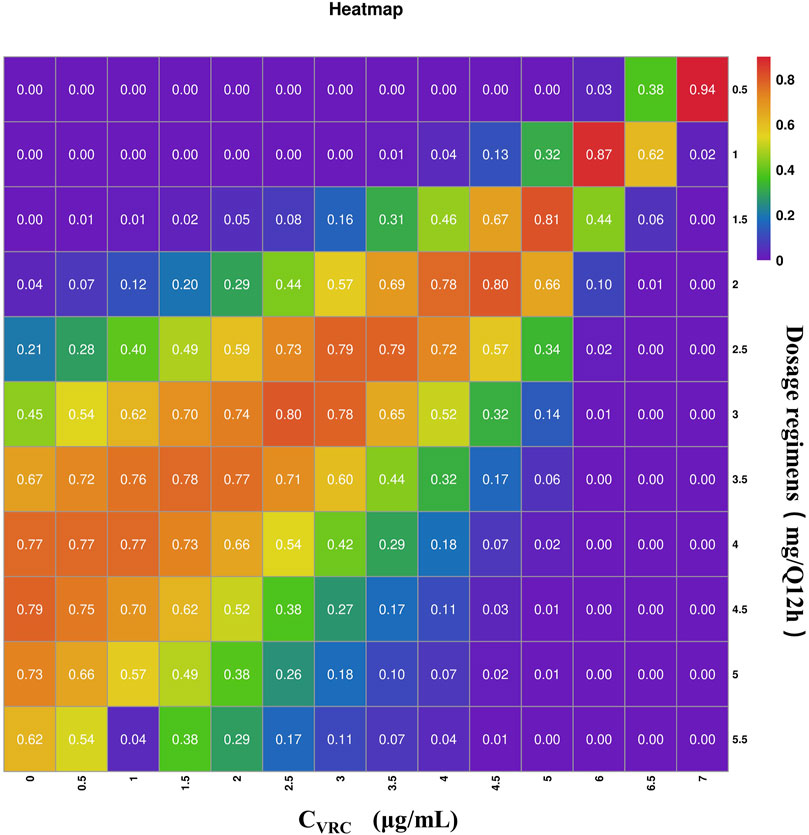
Figure 5. Heat map of tacrolimus PTA on day 3 under different administration regiments simulated based on different CVRC. The gradations of purple, blue-purple, blue, green, yellow, orange and red respectively represent the increasing of PTA from 0 to 100. The darker the red square is, the higher the PTA is; the darker the purple square is, the lower the PTA is.
The PTA results indicate that when the CVRC is 0 μg/mL, the recommended tacrolimus dose is 4 mg, with a dosing of 4–5.0 mg Q12 h achieving a standard tacrolimus concentration (5–10 ng/mL) in over 70% of cases. When the CVRC is 5.0 μg/mL, the recommended tacrolimus dose decreased to 1.5 mg, with this dosage level achieving the target concentration (5–10 ng/mL) in 81.3% of the cases.
3.4.2 Monte Carlo simulations with different CREA values
Given that CREA was identified as a significant covariate in this model, we performed 1,000 Monte Carlo simulations based on 11 tacrolimus dosing regimens across 10 different CREA levels. In this analysis, CVRC was fixed at to 0 μmol/L to eliminate the influence of voriconazole use. The simulation results are illustrated in Table 6.
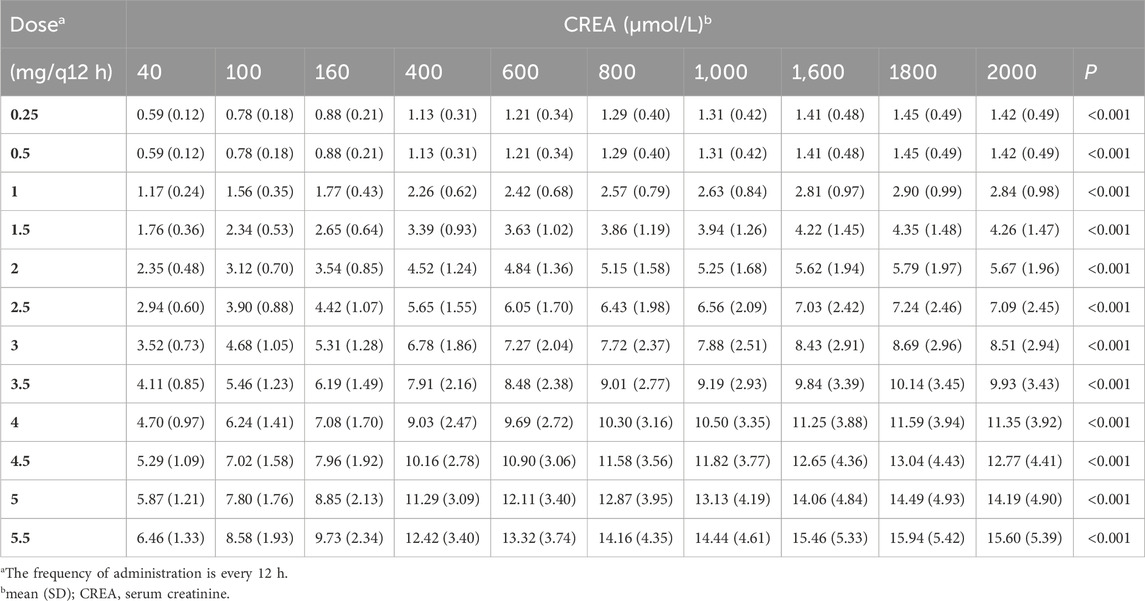
Table 6. Tacrolimus trough concentration on day 3 based on different CREA and doses.
The result indicated that, under the same dosing regimen, higher CREA were associated with higher tacrolimus concentration (Figure 6). The PTA for tacrolimus trough concentrations on the third day was also calculated., with the results provided in Supplementary Table S2. The predicted tacrolimus concentration and their corresponding PTA values for each CREA level were used. The predicted tacrolimus concentration and their corresponding PTA values for each CREA level were used to create visual heat maps, which in Supplementary Figures S2, S3. Based on these results, an appropriate tacrolimus dose can be determined. For example, when the CREA concentration is 40 μmol/L, the recommended tacrolimus dose is 5–5.5 mg Q12 h, achieving a PTA above 70%.
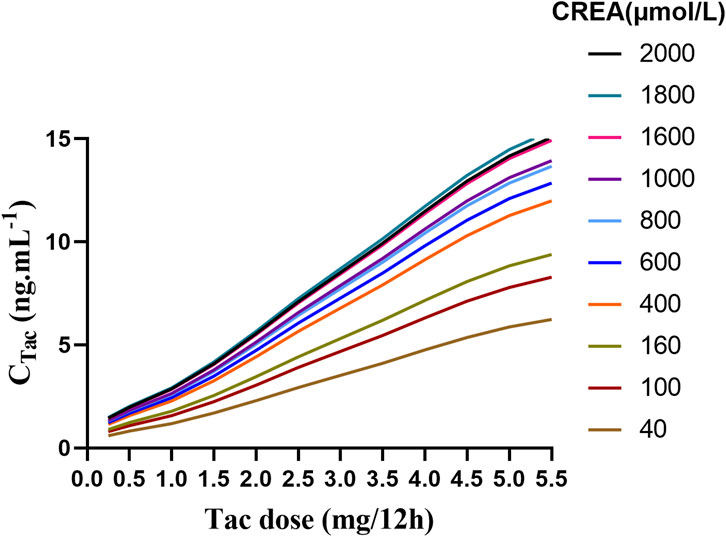
Figure 6. The fitting curve of tacrolimus trough concentration on the third day was simulated based on different creatinine values.
3.4.3 Practical application
The Monte Carlo simulation results provide robust, evidence-based guidelines for optimizing tacrolimus dosing in renal transplant recipients co-administered with voriconazole. To facilitate the clinical application of these findings, we have developed (Supplementary Table S3), which consolidates the recommended tacrolimus dosing regimens across a spectrum of CVRC and CREA levels. By thoroughly evaluating the pharmacokinetic interactions influenced by CVRC and CREA, we delineated dosing regimens to ensure the achievement of therapeutic drug levels with a high probability of target attainment. The analysis reveals that as CVRC increases, the required tacrolimus dose must be correspondingly reduced to mitigate the risk of drug toxicity. Conversely, elevated CREA levels, indicative of diminished renal function, necessitate a decrease in tacrolimus dosing to maintain therapeutic efficacy while minimizing potential adverse effects.
4 Discussion
In this study, we developed a one-compartment model with first-order elimination to describe the PPK of tacrolimus in RTRs undergoing voriconazole co-therapy. This model, applied for the first time in such a context, provides accurate predictions of tacrolimus concentration across various CVRC levels. According to tacrolimus prescribing information (2015),peak blood concentration are typically reached within 1–3 h after oral administration, with an average oral bioavailability of 20%–25%. Most patients achieve steady-state concentrations within 3 days. The steady-state distribution volume of tacrolimus in healthy individuals is approximately 1,300 L, based on the whole blood concentrations. However, in transplant patients, the half-life of tacrolimus is significantly shorter, and the clearance rate is considerably higher compared to healthy subjects. Tacrolimus is primarily metabolized in the liver, with CYP450-3A4 as the principal metabolic enzyme (Iwamoto et al., 2015). What sets this study apart from previous research is our ability to recommend specific tacrolimus doses for different levels of voriconazole, based on simulation results of tacrolimus trough concentration and the PTA. To our knowledge, no prior studies have adjusted tacrolimus dosing based on CVRC levels, making this approach a novel contribution to the field.
Meanwhile, the population’s typical V/F, derived from plasma concentration data, was estimated at 2690 L, a value notably higher than that observed in healthy individuals. In the final model, voriconazole concentration and CREA emerged as critical covariates. As voriconazole concentration increased, both V/F and CL/F decreased. Similarly, higher CREA levels were associated with a further reduction in V/F. Our findings regarding the influence of co-administration with voriconazole on the distribution of tacrolimus are consistent with previous studies. Voriconazole is known to inhibit the CYP3A4 enzyme, which plays a crucial role in the metabolism of tacrolimus (Fujita et al., 2013; Imamura et al., 2016; Gong et al., 2023). Polymorphisms in CYP3A5, POR, and CYP2C19 are also important biomarkers for individualized tacrolimus dosage adjustments (Suetsugu et al., 2019). This inhibition can increased systemic exposure to tacrolimus, leading to alterations in its distribution throughout the body. Furthermore, the interaction between voriconazole and tacrolimus at the level of drug transporters, such as P-glycoprotein (P-gp), can further impact the distribution of tacrolimus (Fu et al., 2019). Additionally, changes in protein binding due to the co-administration of voriconazole may contribute to modifications in tacrolimus distribution (Yuan et al., 2020). Lastly, the impact of voriconazole on liver and kidney function can indirectly influence tacrolimus distribution (Theuretzbacher et al., 2006; Neofytos et al., 2012). In a related study, Staatz and Tett (2002) collected 4,527 tacrolimus blood samples from 337 kidney transplant recipients and developed a two-compartment model. They reported that lower CREA levels were associated with increased tacrolimus clearance. Cheng et al. (2023) also found that direct bilirubin, albumin, and estimated glomerular filtration rate (eGFR) were significant factors influencing voriconazole trough concentrations and suggested that eGFR and platelet count should also be considered when administering voriconazole. Besides, Jahan et al. (2015) explored the clinical efficacy and pharmacokinetics of tacrolimus in children with steroid-resistant nephrotic syndrome and found that patients with elevated CREA may have lower trough concentration and AUC0–12 h. These studies collectively demonstrate that renal function indicators such as CREA and eGFR can significantly affect the concentration of tacrolimus and voriconazole.
In addition, we compared the parameters of the model established in this study with those of the tacrolimus PPK models from other studies. The summary of the models and their parameters is provided in Table 7. The comparison results revealed that most studies utilized either one-compartment or two-compartment models, indicating that the one-compartment model used in our study was also reasonable. Meanwhile, in our study, the CL/F was estimated 42.87 L/h, which is significantly reduced compared to other RTRs and healthy volunteers. This value is approximately 1/3 of that observed in patients not receiving voriconazole co-therapy. Beyond voriconazole, other factors identified as covariables include hematocrit, weight, Wu-Zhi capsule usage, and CYP3A4, and CYP3A5 genotypes (Barry and Levine, 2010; Bergmann et al., 2014; Jacobo-Cabral et al., 2015; Billing et al., 2017; Andrews et al., 2018; Campagne et al., 2018; Andrews et al., 2019).
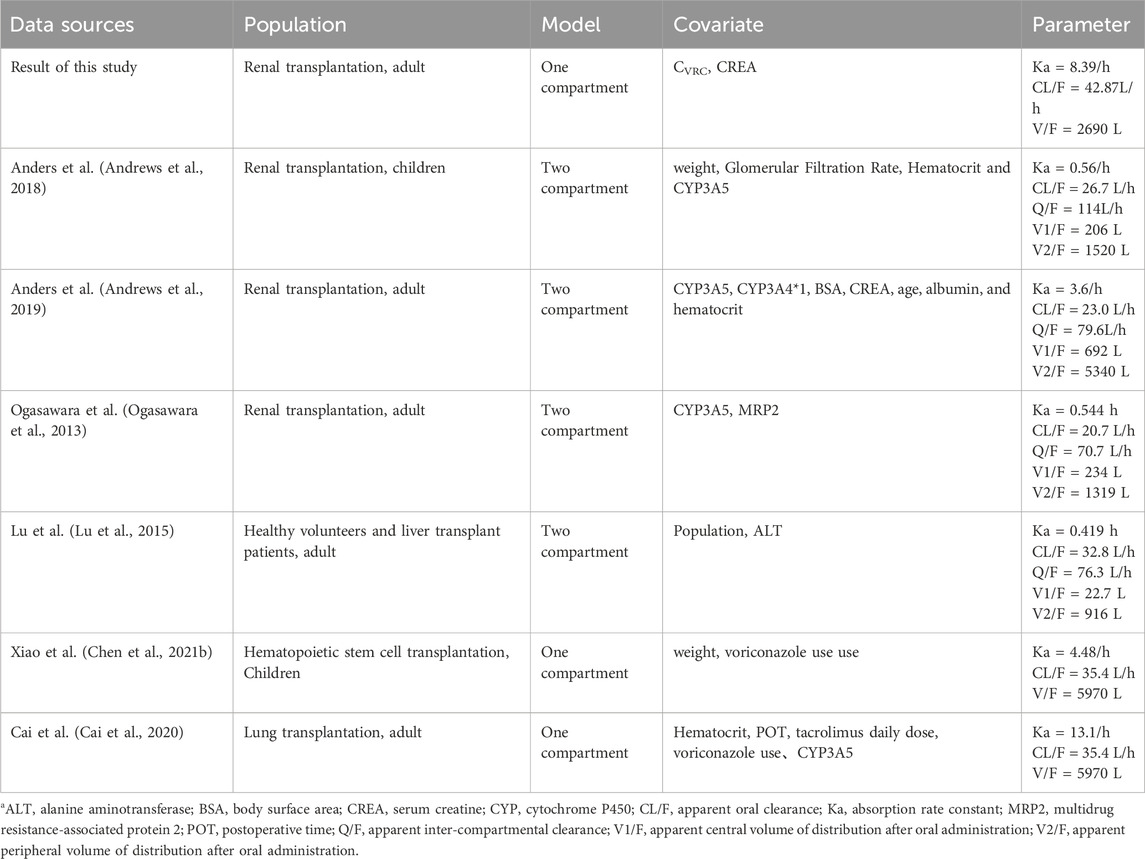
Table 7. Parameter comparison of population pharmacokinetic modelsa.
Therefore, different studies may include various covariates due to differing sample sizes and study designs. In our study, only CVRC and CREA were identified as significant covariates, likely due to the limited sample size, which may have restricted the inclusion of other potential covariates such as hematocrit, CYP3A5, and CYP2C19 genotypes. Additionally, we did not collect CYP3A4 genotype information, which could have further influenced the model.
Besides, CYP3A5 polymorphisms are known to significantly affect tacrolimus pharmacokinetics. Patients expressing the CYP3A5*1*3 genotype typically have a higher clearance rate and therefore require higher daily doses to achieve therapeutic drug levels compared to non-expressers (CYP3A5*3*3). Anders et al. found that pharmacokinetic parameters of CYP3A5 differ across metabolic types, with patients expressing CYP3A5 having a higher clearance rate than those without CYP3A5 expression (Andrews et al., 2018). This finding is supported by Ferraris et al., who demonstrated that patients with the CYP3A5*1*3 genotype had lower dose-adjusted tacrolimus trough levels and required higher daily doses to achieve therapeutic drug levels, underscoring the need for individualized dosing based on genotype (Ferraris et al., 2011). Similarly, Ogasawara et al. also identified that CYP3A5 was also a significant covariate for the apparent clearance of tacrolimus (Ogasawara et al., 2013). Additionally, the meta-analysis by Lee et al. (2022), further supported the association between CYP3A5 expression and tacrolimus pharmacokinetics, particularly in patients carrying the POR28 allele. These findings underscore the importance of considering CYP3A5 polymorphisms when determining optimal tacrolimus dosing regimens (Lee et al., 2022). However, patients with the CYP3A5*1*1 genotype were not included in this study, which may explain why the CYP3A5 genotype was not a covariate in our final model. It is also possible that the effect of CVRC was more pronounced than other factors, leading to the inclusion of only the most influential covariates in the final model. Several other studies have demonstrated that postoperative time can significantly affect the pharmacokinetic parameters of tacrolimus (Wang et al., 2019; Gong et al., 2020; Chen L. et al., 2021a; Srinivas et al., 2021). But in this study, postoperative time did not emerge as a key covariable influencing tacrolimus metabolism. Campagne et al. (2018) analyzed 63 studies on nonlinear mixed-effects models of tacrolimus published in the past 20 years and found that most studies focused on adult and pediatric renal and liver transplantation, and more than 50% of the PPK studies used one-compartment model and two-compartment model with delayed absorption. However, there are differences in the pharmacokinetics of tacrolimus in different populations, so studying the pharmacokinetic parameters in different drug combinations is necessary.
Although this study is the first to establish a PPK model for tacrolimus in RTRs co-administered with voriconazole, allowing us to predict tacrolimus concentration and estimate optimal dosage based on different CVRC levels, there are still some limitations. First, several studies have shown that postoperative time can significantly affect the pharmacokinetic parameters of tacrolimus. However, the data collected in this study were from RTRs within 15 days post-surgery. As a result, the decision to use a one-compartment model rather than a more complex two-compartment model may have been influenced by the limited amount of data available. The absence of a biphasic or more complex concentration-time curve pattern could be attributed to the limited sampling points, which could have hindered our ability to fully capture the true underlying pharmacokinetic characteristics. Second, the limited sample size in this study meant that only internal verification of the model was possible, without the benefit of external validation. Additionally, our reliance on a narrow range of drug dosage regimens for the simulations represents a further limitation. Consequently, to derive more accurate and optimal tacrolimus dosing regimens, it would be necessary to conduct a greater number of Monte Carlo simulations across a broader range of scenarios. Expanding the scope of these simulations would provide a more comprehensive understanding of the PTA across a wider spectrum of dosing strategies.
Therefore, further studies should focus on external verification of the model and clinical verification of these findings. Third, while we successfully established a stable PPK model, it is still important to note that most of the tacrolimus concentrations data collected were trough levels, with minimal clinical intervention. Additionally, the Ka value was fixed during the model’s development, which restricted our ability to explore the impact of other covariates on Ka. The simulations conducted to evaluate the model’s predictive performance, taking into account the VPC results (Figure 4A) and the residual variability indicated by the sigma value in Table 4, suggest that factors beyond voriconazole concentration and CREA may contribute to the observed inter- and intra-individual variability in tacrolimus pharmacokinetics within this population. Furthermore, the high CV% associated with the ΘVRC-CL parameter highlights potential uncertainty in its estimation, underscoring the need for additional research to identify and integrate other significant covariates. Despite these limitations, the findings of this study offer valuable insights that may contribute to the development of more robust and reliable models for predicting tacrolimus concentrations, ultimately aiding clinicians in optimizing patient outcomes. Further research should aim to address the identified limitations, thereby enhancing the precision and applicability of PPK models in clinical settings.
In healthy subjects, the rate and extent of tacrolimus absorption are highest when on an empty stomach (2015). Diet can reduce both the absorption rate and extent of tacrolimus, with this effect being most pronounced after consuming high-fat foods. Since dietary information was not collected in this study, the potential impact of food on tacrolimus metabolism was not considered. Therefore, prospective studies with large sample sizes and multicenter designs are necessary for further validation and exploration. In this study, we utilized a mixed linear function model that incorporated both additive and multiplicative covariate structures. However, there may be limitations in accurately estimating high voriconazole concentrations. The range of voriconazole concentrations included in our study was limited to 0–3.38 μg/mL. As a result, extrapolating the model predictions beyond this range, particularly for high concentrations, may lead to less accurate estimates. This limitation should be considered when interpreting the results of our study.
5 Conclusion
The population pharmacokinetics of tacrolimus co-administered with 15 days after renal transplantation were effectively described using the models presented in this study. The final model identified CVRC and CREA as critical covariates. Patients with higher CVRC had lower tacrolimus CL/F and V/F, while higher CREA also led to a reduction in tacrolimus CL/F. Based on different CVRC and CREA, clinicians can predict tacrolimus concentrations and adjust the dosage accordingly. In addition, the Monte Carlo simulation results offer clear, actionable dosage recommendations tailored to CVRC and CREA values. In general, a relatively lower dosage of tacrolimus is required as CVRC increases. Moreover, the influence of voriconazole on tacrolimus concentration was found to be more significant than that of CREA.
Data availability statement
The raw data supporting the conclusions of this article will be made available by the authors, without undue reservation.
Ethics statement
The studies involving humans were approved by the Ethics Committee of the Second Xiangya Hospital of Central South University. The studies were conducted in accordance with the local legislation and institutional requirements. The ethics committee/institutional review board waived the requirement of written informed consent for participation from the participants or the participants’ legal guardians/next of kin because Retrospective study, non-intervention.
Author contributions
Y-CZ: Investigation, Validation, Writing–original draft, Writing–review and editing. Z-HS: Software, Writing–original draft, Writing–review and editing. J-KL: Methodology, Writing–original draft, Writing–review and editing. H-YL: Investigation, Writing–original draft, Writing–review and editing. B-KZ: Supervision, Writing–original draft, Writing–review and editing. X-BX: Supervision, Writing–original draft, Writing–review and editing. C-HF: Investigation, Writing–original draft, Writing–review and editing. IS: Supervision, Writing–original draft, Writing–review and editing. F-HP: Validation, Writing–original draft, Writing–review and editing. MY: Funding acquisition, Writing–original draft, Writing–review and editing.
Funding
The author(s) declare that financial support was received for the research, authorship, and/or publication of this article. This research was funded by Hunan Medical Association with the founding number of (HMA202001002). It was also supported by the Interna-tional Research Center for Precision Medicine, Transformative Technology, and Software Services, Hunan, China.
Acknowledgments
We would like to acknowledge Hua-lin Cai, Mou-ze Liu, Jia-min Wu, Xian Lu and Yang Zou for their sincere help and advice. We also appreciate the effort of all the members in the Department of Urological Organ Transplantation and Information in our hospital.
Conflict of interest
The authors declare that the research was conducted in the absence of any commercial or financial relationships that could be construed as a potential conflict of interest.
Publisher’s note
All claims expressed in this article are solely those of the authors and do not necessarily represent those of their affiliated organizations, or those of the publisher, the editors and the reviewers. Any product that may be evaluated in this article, or claim that may be made by its manufacturer, is not guaranteed or endorsed by the publisher.
Supplementary material
The Supplementary Material for this article can be found online at: https://www.frontiersin.org/articles/10.3389/fphar.2024.1439232/full#supplementary-material
References
Andrews, L. M., Hesselink, D. A., Van Gelder, T., Koch, B. C. P., Cornelissen, E. a.M., Brüggemann, R. J. M., et al. (2018). A population pharmacokinetic model to predict the individual starting dose of tacrolimus following pediatric renal transplantation. Clin. Pharmacokinet. 57, 475–489. doi:10.1007/s40262-017-0567-8
Andrews, L. M., Hesselink, D. A., Van Schaik, R. H. N., Van Gelder, T., De Fijter, J. W., Lloberas, N., et al. (2019). A population pharmacokinetic model to predict the individual starting dose of tacrolimus in adult renal transplant recipients. Br. J. Clin. Pharmacol. 85, 601–615. doi:10.1111/bcp.13838
Barry, A., and Levine, M. (2010). A systematic review of the effect of CYP3A5 genotype on the apparent oral clearance of tacrolimus in renal transplant recipients. Ther. Drug Monit. 32, 708–714. doi:10.1097/FTD.0b013e3181f3c063
Bergmann, T. K., Hennig, S., Barraclough, K. A., Isbel, N. M., and Staatz, C. E. (2014). Population pharmacokinetics of tacrolimus in adult kidney transplant patients: impact of CYP3A5 genotype on starting dose. Ther. Drug Monit. 36, 62–70. doi:10.1097/FTD.0b013e31829f1ab8
Billing, H., Höcker, B., Fichtner, A., Van Damme-Lombaerts, R., Friman, S., Jaray, J., et al. (2017). Single-nucleotide polymorphism of CYP3A5 impacts the exposure to tacrolimus in pediatric renal transplant recipients: a pharmacogenetic substudy of the TWIST trial. Ther. Drug Monit. 39, 21–28. doi:10.1097/FTD.0000000000000361
Bowman, L. J., and Brennan, D. C. (2008). The role of tacrolimus in renal transplantation. Expert Opin. Pharmacother. 9, 635–643. doi:10.1517/14656566.9.4.635
Cai, X., Song, H., Jiao, Z., Yang, H., Zhu, M., Wang, C., et al. (2020). Population pharmacokinetics and dosing regimen optimization of tacrolimus in Chinese lung transplant recipients. Eur. J. Pharm. Sci. 152, 105448. doi:10.1016/j.ejps.2020.105448
Campagne, O., Mager, D. E., Brazeau, D., Venuto, R. C., and Tornatore, K. M. (2018). Tacrolimus population pharmacokinetics and multiple CYP3A5 genotypes in black and white renal transplant recipients. J. Clin. Pharmacol. 58, 1184–1195. doi:10.1002/jcph.1118
Chen, L., Yang, Y., Wang, X., Wang, C., Lin, W., Jiao, Z., et al. (2021a). Wuzhi capsule dosage affects tacrolimus elimination in adult kidney transplant recipients, as determined by a population pharmacokinetics analysis. Pharmgenomics Pers. Med. 14, 1093–1106. doi:10.2147/PGPM.S321997
Chen, W., Wang, X., Li, B., Qin, W., Li, S., Wang, X., et al. (2022a). Effects of voriconazole exposure on the pharmacokinetics of tacrolimus in lung transplantation patients, based on therapeutic drug monitoring data. J. Clin. Pharmacol. 62, 1310–1320. doi:10.1002/jcph.2066
Chen, W., Zhang, L., Zhang, G., Sun, L., Chen, W., Huang, J., et al. (2022b). Expert consensus on individualized treatment of tacrolimus in solid organ transplantation. Electron. J. Pract. Organ Transplant. 10, 301–308.
Chen, X., Wang, D., Lan, J., Wang, G., Zhu, L., Xu, X., et al. (2021b). Effects of voriconazole on population pharmacokinetics and optimization of the initial dose of tacrolimus in children with chronic granulomatous disease undergoing hematopoietic stem cell transplantation. Ann. Transl. Med. 9, 1477. doi:10.21037/atm-21-4124
Cheng, L., Liang, Z., Liu, F., Lin, L., Zhang, J., Xie, L., et al. (2023). Factors influencing plasma concentration of voriconazole and voriconazole- N-oxide in younger adult and elderly patients. Front. Pharmacol. 14, 1126580. doi:10.3389/fphar.2023.1126580
Ciancio, G., Burke, G. W., Gaynor, J. J., Mattiazzi, A., Roth, D., Kupin, W., et al. (2004). A randomized long-term trial of tacrolimus and sirolimus versus tacrolimus and mycophenolate mofetil versus cyclosporine (NEORAL) and sirolimus in renal transplantation. I. Drug interactions and rejection at one year. Transplantation 77, 244–251. doi:10.1097/01.TP.0000101290.20629.DC
Davis, S., Gralla, J., Klem, P., Stites, E., Wiseman, A., and Cooper, J. E. (2020). Tacrolimus intrapatient variability, time in therapeutic range, and risk of de novo donor-specific antibodies. Transplantation 104, 881–887. doi:10.1097/TP.0000000000002913
Degraeve, A. L., Moudio, S., Haufroid, V., Chaib Eddour, D., Mourad, M., Bindels, L. B., et al. (2020). Predictors of tacrolimus pharmacokinetic variability: current evidences and future perspectives. Expert Opin. Drug Metab. Toxicol. 16, 769–782. doi:10.1080/17425255.2020.1803277
Ferraris, J. R., Argibay, P. F., Costa, L., Jimenez, G., Coccia, P. A., Ghezzi, L. F., et al. (2011). Influence of CYP3A5 polymorphism on tacrolimus maintenance doses and serum levels after renal transplantation: age dependency and pharmacological interaction with steroids. Pediatr. Transpl. 15, 525–532. doi:10.1111/j.1399-3046.2011.01513.x
Fu, R., Tajima, S., Suetsugu, K., Watanabe, H., Egashira, N., and Masuda, S. (2019). Biomarkers for individualized dosage adjustments in immunosuppressive therapy using calcineurin inhibitors after organ transplantation. Acta Pharmacol. Sin. 40, 151–159. doi:10.1038/s41401-018-0070-2
Fujita, Y., Araki, T., Okada, Y., Aomori, T., Shimizu, R., Tomizawa, T., et al. (2013). Analysis of cytochrome P450 gene polymorphism in a lupus nephritis patient in whom tacrolimus blood concentration was markedly elevated after administration of azole antifungal agents. J. Clin. Pharm. Ther. 38, 74–76. doi:10.1111/jcpt.12004
Gong, F., Hu, H., Ouyang, Y., Liao, Z. Z., Kong, Y., Hu, J. F., et al. (2023). Physiologically-based pharmacokinetic modeling-guided rational combination of tacrolimus and voriconazole in patients with different CYP3A5 and CYP2C19 alleles. Toxicol. Appl. Pharmacol. 466, 116475. doi:10.1016/j.taap.2023.116475
Gong, Y., Yang, M., Sun, Y., Li, J., Lu, Y., and Li, X. (2020). Population pharmacokinetic analysis of tacrolimus in Chinese cardiac transplant recipients. Eur. J. Hosp. Pharm. 27, e12–e18. doi:10.1136/ejhpharm-2018-001764
Imamura, C. K., Furihata, K., Okamoto, S., and Tanigawara, Y. (2016). Impact of cytochrome P450 2C19 polymorphisms on the pharmacokinetics of tacrolimus when coadministered with voriconazole. J. Clin. Pharmacol. 56, 408–413. doi:10.1002/jcph.605
Iwamoto, T., Monma, F., Fujieda, A., Nakatani, K., Gayle, A. A., Nobori, T., et al. (2015). Effect of genetic polymorphism of CYP3A5 and CYP2C19 and concomitant use of voriconazole on blood tacrolimus concentration in patients receiving hematopoietic stem cell transplantation. Ther. Drug Monit. 37, 581–588. doi:10.1097/FTD.0000000000000182
Jacobo-Cabral, C. O., García-Roca, P., Romero-Tejeda, E. M., Reyes, H., Medeiros, M., Castañeda-Hernández, G., et al. (2015). Population pharmacokinetic analysis of tacrolimus in Mexican paediatric renal transplant patients: role of CYP3A5 genotype and formulation. Br. J. Clin. Pharmacol. 80, 630–641. doi:10.1111/bcp.12649
Jahan, A., Prabha, R., Chaturvedi, S., Mathew, B., Fleming, D., and Agarwal, I. (2015). Clinical efficacy and pharmacokinetics of tacrolimus in children with steroid-resistant nephrotic syndrome. Pediatr. Nephrol. 30, 1961–1967. doi:10.1007/s00467-015-3133-3
Karthaus, M. (2010). Guideline based treatment of invasive aspergillosis. Mycoses 53 (Suppl. 1), 36–43. doi:10.1111/j.1439-0507.2009.01840.x
Kramer, M. R., Amital, A., Fuks, L., and Shitrit, D. (2011). Voriconazole and itraconazole in lung transplant recipients receiving tacrolimus (FK 506): efficacy and drug interaction. Clin. Transpl. 25, E163–E167. doi:10.1111/j.1399-0012.2010.01373.x
Lee, D. H., Lee, H., Yoon, H. Y., Yee, J., and Gwak, H. S. (2022). Association of P450 oxidoreductase gene polymorphism with tacrolimus pharmacokinetics in renal transplant recipients: a systematic review and meta-analysis. Pharmaceutics 14, 261. doi:10.3390/pharmaceutics14020261
Liu, Q., Charleston, M. A., Richards, S. A., and Holland, B. R. (2023). Performance of Akaike information criterion and bayesian information criterion in selecting partition models and mixture models. Syst. Biol. 72, 92–105. doi:10.1093/sysbio/syac081
Lu, Y. X., Su, Q. H., Wu, K. H., Ren, Y. P., Li, L., Zhou, T. Y., et al. (2015). A population pharmacokinetic study of tacrolimus in healthy Chinese volunteers and liver transplant patients. Acta Pharmacol. Sin. 36, 281–288. doi:10.1038/aps.2014.110
Marr, K. A., Schlamm, H. T., Herbrecht, R., Rottinghaus, S. T., Bow, E. J., Cornely, O. A., et al. (2015). Combination antifungal therapy for invasive aspergillosis: a randomized trial. Ann. Intern Med. 162, 81–89. doi:10.7326/M13-2508
Mori, T., Kato, J., Yamane, A., Sakurai, M., Kohashi, S., Kikuchi, T., et al. (2012). Drug interaction between voriconazole and tacrolimus and its association with the bioavailability of oral voriconazole in recipients of allogeneic hematopoietic stem cell transplantation. Int. J. Hematol. 95, 564–569. doi:10.1007/s12185-012-1057-2
Naesens, M., Kuypers, D. R., and Sarwal, M. (2009). Calcineurin inhibitor nephrotoxicity. Clin. J. Am. Soc. Nephrol. 4, 481–508. doi:10.2215/CJN.04800908
Neofytos, D., Lombardi, L. R., Shields, R. K., Ostrander, D., Warren, L., Nguyen, M. H., et al. (2012). Administration of voriconazole in patients with renal dysfunction. Clin. Infect. Dis. 54, 913–921. doi:10.1093/cid/cir969
Ogasawara, K., Chitnis, S. D., Gohh, R. Y., Christians, U., and Akhlaghi, F. (2013). Multidrug resistance-associated protein 2 (MRP2/ABCC2) haplotypes significantly affect the pharmacokinetics of tacrolimus in kidney transplant recipients. Clin. Pharmacokinet. 52, 751–762. doi:10.1007/s40262-013-0069-2
Ota, R., Hirata, A., Noto, K., Yokoyama, S., Hosomi, K., Takada, M., et al. (2019). Relationship between the blood concentrations of tacrolimus and voriconazole in hematopoietic stem cell transplant recipients. Int. J. Clin. Pharmacol. Ther. 57, 561–566. doi:10.5414/CP203539
Package insert of tacrolimus (Prograf) (2015). Available at: https://dbyaozhcom/instruct/15883html.
Sharma, M., Rudramurthy, S. M., and Chakrabarti, A. (2022). Epidemiology of invasive fungal infections in solid organ transplant recipients: an Indian perspective. Curr. Fungal Infect. Rep. 16, 179–187. doi:10.1007/s12281-022-00446-w
Srinivas, L., Gracious, N., and Nair, R. R. (2021). Pharmacogenetics based dose prediction model for initial tacrolimus dosing in renal transplant recipients. Front. Pharmacol. 12, 726784. doi:10.3389/fphar.2021.726784
Staatz, C. E., and Tett, S. E. (2002). Comparison of two population pharmacokinetic programs, NONMEM and P-PHARM, for tacrolimus. Eur. J. Clin. Pharmacol. 58, 597–605. doi:10.1007/s00228-002-0517-7
Staatz, C. E., and Tett, S. E. (2004). Clinical pharmacokinetics and pharmacodynamics of tacrolimus in solid organ transplantation. Clin. Pharmacokinet. 43, 623–653. doi:10.2165/00003088-200443100-00001
Suetsugu, K., Mori, Y., Yamamoto, N., Shigematsu, T., Miyamoto, T., Egashira, N., et al. (2019). Impact of CYP3A5, POR, and CYP2C19 polymorphisms on trough concentration to dose ratio of tacrolimus in allogeneic hematopoietic stem cell transplantation. Int. J. Mol. Sci. 20, 2413. doi:10.3390/ijms20102413
Theuretzbacher, U., Ihle, F., and Derendorf, H. (2006). Pharmacokinetic/pharmacodynamic profile of voriconazole. Clin. Pharmacokinet. 45, 649–663. doi:10.2165/00003088-200645070-00002
Turcotte, J. G. (1979). Renal transplantation as the treatment of choice for terminal renal failure. Ann. Surg., 528.
Vaden, S. L. (1997). Cyclosporine and tacrolimus. Semin. Vet. Med. Surg. Small Anim. 12, 161–166. doi:10.1016/s1096-2867(97)80028-x
Van Delden, C., Stampf, S., Hirsch, H. H., Manuel, O., Meylan, P., Cusini, A., et al. (2020). Burden and timeline of infectious diseases in the first year after solid organ transplantation in the Swiss transplant cohort study. Clin. Infect. Dis. 71, e159–e169. doi:10.1093/cid/ciz1113
Vanhove, T., Bouwsma, H., Hilbrands, L., Swen, J. J., Spriet, I., Annaert, P., et al. (2017). Determinants of the magnitude of interaction between tacrolimus and voriconazole/posaconazole in solid organ recipients. Am. J. Transpl. 17, 2372–2380. doi:10.1111/ajt.14232
Venkataramanan, R., Swaminathan, A., Prasad, T., Jain, A., Zuckerman, S., Warty, V., et al. (1995). Clinical pharmacokinetics of tacrolimus. Clin. Pharmacokinet. 29, 404–430. doi:10.2165/00003088-199529060-00003
Vester, U., Offner, G., Hoyer, P. F., Oldhafer, K., Fangmann, J., Pichlmayr, R., et al. (1998). End-stage renal failure in children younger than 6 years: renal transplantation is the therapy of choice. Eur. J. Pediatr. 157, 239–242. doi:10.1007/s004310050803
Vrieze, S. I. (2012). Model selection and psychological theory: a discussion of the differences between the Akaike information criterion (AIC) and the Bayesian information criterion (BIC). Psychol. Methods 17, 228–243. doi:10.1037/a0027127
Wang, D., Lu, J., Li, Q., and Li, Z. (2019). Population pharmacokinetics of tacrolimus in pediatric refractory nephrotic syndrome and a summary of other pediatric disease models. Exp. Ther. Med. 17, 4023–4031. doi:10.3892/etm.2019.7446
Woodroffe, R., Yao, G. L., Meads, C., Bayliss, S., Ready, A., Raftery, J., et al. (2005). Clinical and cost-effectiveness of newer immunosuppressive regimens in renal transplantation: a systematic review and modelling study. Health Technol. Assess. 9 (1), 1–179. iii-iv. doi:10.3310/hta9210
Xu, X. S., Yuan, M., Karlsson, M. O., Dunne, A., Nandy, P., and Vermeulen, A. (2012). Shrinkage in nonlinear mixed-effects population models: quantification, influencing factors, and impact. Aaps J. 14, 927–936. doi:10.1208/s12248-012-9407-9
Yuan, Z. Q., Qiao, C., Yang, Z. C., Yu, L., Sun, L. N., Qian, Y., et al. (2020). The impact of plasma protein binding characteristics and unbound concentration of voriconazole on its adverse drug reactions. Front. Pharmacol. 11, 505. doi:10.3389/fphar.2020.00505
Zhao, Y.-C., Lin, X.-B., Zhang, B.-K., Xiao, Y.-W., Xu, P., Wang, F., et al. (2021). Predictors of adverse events and determinants of the voriconazole trough concentration in kidney transplantation recipients. Cts-Clinical Transl. Sci. 14, 702–711. doi:10.1111/cts.12932
Keywords: tacrolimus, population pharmacokinetics, voriconazole, renal transplantation, Monte Carlo simulations
Citation: Zhao Y-C, Sun Z-H, Li J-K, Liu H-Y, Zhang B-K, Xie X-B, Fang C-H, Sandaradura I, Peng F-H and Yan M (2024) Individualized dosing parameters for tacrolimus in the presence of voriconazole: a real-world PopPK study. Front. Pharmacol. 15:1439232. doi: 10.3389/fphar.2024.1439232
Received: 27 May 2024; Accepted: 26 August 2024;
Published: 10 September 2024.
Edited by:
Krishna M. Boini, University of Houston, United StatesReviewed by:
Yalin Dong, First Affiliated Hospital of Xi’an Jiaotong University, ChinaSriram Inavolu, Texas A&M University Kingsville, United States
Copyright © 2024 Zhao, Sun, Li, Liu, Zhang, Xie, Fang, Sandaradura, Peng and Yan. This is an open-access article distributed under the terms of the Creative Commons Attribution License (CC BY). The use, distribution or reproduction in other forums is permitted, provided the original author(s) and the copyright owner(s) are credited and that the original publication in this journal is cited, in accordance with accepted academic practice. No use, distribution or reproduction is permitted which does not comply with these terms.
*Correspondence: Miao Yan, eWFubWlhb0Bjc3UuZWR1LmNu; Feng-Hua Peng, cGZoMzMyN0Bjc3UuZWR1LmNu