 Abudukahaer Wubuli1†
 Junwei Chai2†Haoqiang Liu1Dilaram Nijat1Jianmin Li1Guoyu Xia1Qi Cao1Saidan Zhang1Weidong Huang3*
 Adila Aipire1*
 Jinyao Li1*
- 1Xinjiang Key Laboratory of Biological Resources and Genetic Engineering, College of Life Science and Technology, Xinjiang University, Urumqi, China
- 2Urumqi Xinze Ziqi Biotechnology Company, Limited, Urumqi, China
- 3Xinjiang Jiayin Hospital, Urumqi, China
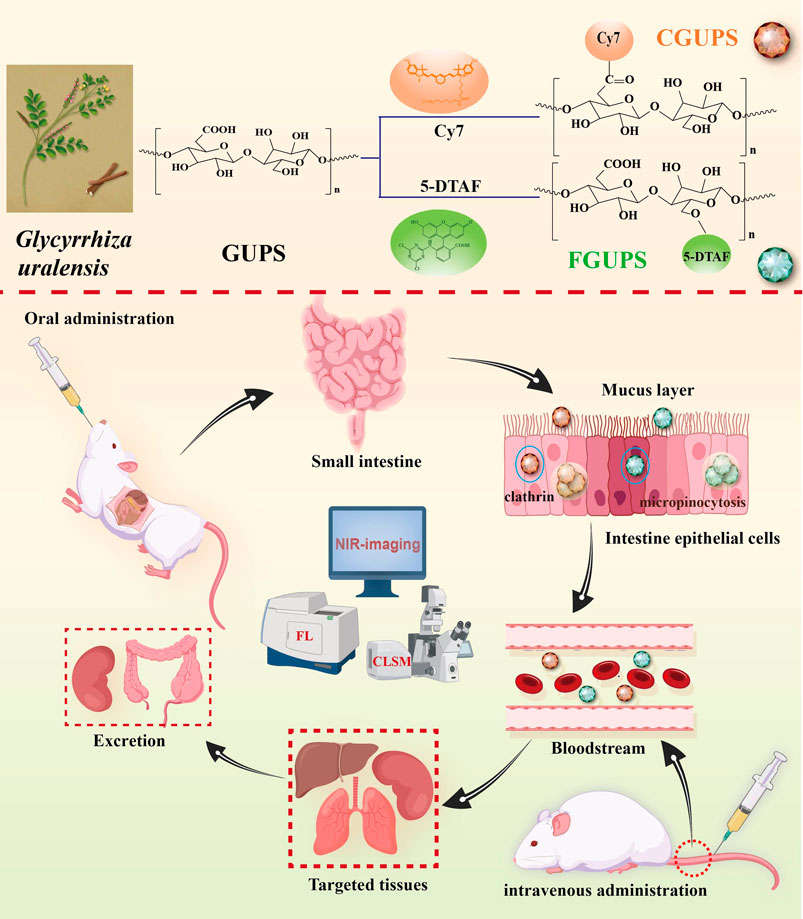
Glycyrrhiza uralensis polysaccharides (GUPS) are widely applied in biomedicine and functional food due to their multiple pharmacological activities and low toxicity. Despite their widespread use, the in vivo metabolic profile of GUPS remains poorly understood. To address this gap, we developed a quantitative analysis method that involves labeling GUPS with visible fluorescein (5-DTAF) and near-infrared (NIR) fluorescein (Cy7), resulting in stable conjugates with substitution degrees of 0.81% for 5-DTAF and 0.39% for Cy7. The pharmacokinetic studies showed a biphasic elimination pattern in the blood concentration-time curve following both intravenous and oral administration, consistent with a two-compartment model. Using fluorescence quantification and NIR imaging, we observed that GUPS was distributed to various tissues, exhibiting higher concentrations particularly in liver, kidney and lung. Excretion studies indicated that feces were the major excretion pathway of GUPS after oral administration (60.98%), whereas urine was the main pathway after intravenous administration (31.16%). Notably, GUPS could be absorbed rapidly by gut (Tmax 1 ± 0.61 h) and showed a biological half-time t1/2 26.4 ± 7.72 h after oral administration. Furthermore, the Caco-2 cells uptake studies illustrated that macropinocytosis and clathrin-mediated endocytosis were participated in the transport of GUPS in intestine epithelium. This comprehensive analysis of the in vivo pharmacokinetics of GUPS not only enhances our understanding of its metabolic pathways but also establishes a foundational basis for its clinical application, optimizing its therapeutic potential and safety profile.
1 Introduction
Glycyrrhiza uralensis (G. uralensis), commonly known in traditional Chinese medicine (TCM) as a potent herb, has been used for centuries to treat a variety of ailments. These include respiratory issues such as phlegm, cough, and dyspnea, as well as gastrointestinal diseases, inflammatory disorders, and liver and cardiovascular problems (Yang et al., 2016; Aipire et al., 2017; Wang et al., 2018; Shi et al., 2022). The primary bioactive components of G. uralensis, known as G. uralensis polysaccharides (GUPS), exhibit a wide range of pharmacological activities including immunomodulatory, antitumor, antioxidant, anti-inflammatory, antiviral effects, regulation of gut microbiota, and hepatoprotection (Zhang et al., 2015; Du et al., 2017; Zhang et al., 2018; Aipire et al., 2020a). Current research on GUPS predominantly focuses on their extraction and purification, structural analysis, chemical modification, pharmacological activity, and the synthesis of biomaterials (Lian et al., 2018; Aipire et al., 2020b; Wu et al., 2022). Despite these advances, there remains a significant gap in the study of their in vivo metabolic processes. This limitation substantially hinders the broader application and development of GUPS in fields such as pharmaceuticals, functional foods, and biomaterials (Xue et al., 2024).
GUPS present significant challenges for detection due to their large molecular weight (approximately 29 kDa) (Aipire et al., 2020b) and lack of UV absorption and fluorescent properties. Additionally, they are prone to interference from endogenous polysaccharides, complicating their analysis through traditional methods like mass spectrometry and spectroscopy. This has limited the qualitative and quantitative analysis of GUPS in in vivo. Current techniques for measuring polysaccharide include fluorescent labeling (Zheng Z. et al., 2020; Zhang et al., 2024), radioisotope labeling (Zhang et al., 2018b), immunoassay (Tokita et al., 2010; Nualnoi et al., 2016), biological assay (Pozharitskaya et al., 2018; Pozharitskaya et al., 2019), and chemical colorimetry (Ishizuka et al., 2004). Among these, fluorescent labeling stands out due to its high sensitivity, selectivity, convenience, safety, and lack of radiation. It also enables the detection of polysaccharides in cells, tissues, and in vivo settings (Roger et al., 2002; Zheng et al., 2020). Fluorescence-labeled polysaccharides can be detected by various techniques, such as fluorescence spectrophotometer, fluorescence microplate reader, fluorescence imaging, high-performance gel permeation chromatography with fluorescence detection (HPGPC-FLD), flow cytometry (FCM) and confocal laser scanning microscopy (CLSM) (Li et al., 2021b; Li et al., 2022). Fluorescent dyes used in labeling polysaccharides are generally divided into visible fluorescent dyes and near-infrared (NIR) fluorescent dyes. Visible fluorescent dyes have been widely used due to their long lifespan and good stability, facilitating the study of the pharmacokinetic characteristics and pharmacological mechanism of polysaccharides (Xia et al., 2021; Zhang et al., 2023). An example is 5-([4, 6-Dichlorotriazin-2-yl] amino) fluorescein (5-DTAF), a water-soluble fluorescein that reacts under mild conditions without the need for organic solvents, and, thus preserving the structural integrity and activity of polysaccharides (Zheng et al., 2022b). NIR fluorescent dyes like Cyanine7 cover a broad spectrum of wavelengths and possess extensive tissue penetration capabilities, which are effective in minimizing interference from spontaneous biomolecular fluorescence, making them ideal for in vivo imaging (Chen et al., 2021). Recent advancements include the conjugation of polysaccharides with NIR dyes to monitor their pharmacokinetic dynamics in vivo (Wu et al., 2022; Zhang et al., 2023). Sulfonation modification, which enhances the water solubility of NIR dyes, has proven to be an excellent method for labelling natural polysaccharides.
With the advancements in fluorescent labelling assays, significant progress has been made in understanding the mechanism of action of orally administered polysaccharides. These mechanisms include direct absorption in the gut, interactions with gut microbiota, and involvement with Peyer’s patches (PPs) and M cells (Han, 2018). Contemporary studies have primarily focused on the potential for direct absorption in the gut, exploring pathways such as paracellular transport and intestinal epithelial cell endocytosis mediated by clathrin, caveolin and micropinocytosis (Zheng et al., 2022a). Fluorescently labeled polysaccharides have demonstrated the capability to enter the bloodstream post-oral administration, subsequently distributing to various target tissues where they exert their biological effects (Zhang B. et al., 2021; Shao et al., 2022). This has provided valuable insights into their mechanisms of gut absorption. Recent evidences also suggest that the gut microbiome and/or PPs significantly influence the biological functions of orally dosed polysaccharides (Bao et al., 2021; Wu et al., 2023). For instance, after oral administration, Radix Astragali polysaccharides (RAP) are neither absorbed nor degraded but instead rapidly penetrate the PPs to initiate anti-tumor immune responses (Zhang et al., 2022). Conversely, Dendrobium officinale polysaccharide (DOP) after oral administration avoids absorption into the bloodstream or lymphatic circulation, potentially exerting its anti-tumor activity through modulation of the gut microbiota (Li et al., 2019). Given these findings, it is crucial to further investigate the specific mechanisms of action of GUPS following oral administration, particularly whether GUPS are directly absorbed. Understanding these mechanisms could enhance the therapeutic application and effectiveness of GUPS.
This study investigated the pharmacokinetic profile of GUPS through employing fluorescent labeling for tracking both in vivo and in vitro. GUPS was labeled with 5-DTAF and sulfo-Cyanine7 amine (Cy7), facilitating the subsequent measurement of the plasma levels, biodistribution, and excretion patterns following intravenous and oral administration. After intravenous administration, GUPS exhibited rapid elimination with a preferential accumulation in the liver, kidneys, and lungs, and was primarily excreted via urine. Interestingly, following oral administration, GUPS was observed entering the bloodstream and predominantly targeting the liver, lungs, and kidneys, with the majority being excreted through feces. Moreover, the intestinal absorption properties of GUPS were investigated using Caco-2 cells, unveiling a concentration- and time-dependent uptake mechanism. This uptake was facilitated by macropinocytosis and clathrin-mediated endocytosis, providing insights into the cellular entry pathways of GUPS. These findings are pivotal in elucidating the mechanism of action of GUPS, guiding their clinical application, and broadening the scope of pharmacokinetic studies on natural polysaccharides.
2 Materials and methods
2.1 Materials
GUPS (Purity > 93%) were prepared from Xinjiang Key Laboratory of Biological Resources and Genetic Engineering according to the method described in our previous study (Aipire et al., 2020b). 5-DTAF was purchased from MCE Biological Inc. (NJ, United States). Sephadex G50 was purchased by Shanghai Yuanye Biotechnology (Shanghai, China). MD34-3500 dialysis bag was purchased from Beijing Solarbio Science & Technology (Beijing, China). Sulfo-Cy7 amine was purchased from Duoflour Inc. (Wuhan, China). 1-Ethyl-3-(3-dimethylaminopropyl) carbodiimide hydrochloride (EDC⋅HCl), N-hydroxysulfosuccinimide (NHS), sodium azide, chloropromazine, methyl-β-cyclodextrin, and cytochalasin D were obtained from Aladdin Chemical Co. (Shanghai, China).
2.2 Fluorescence labeling of GUPS
GUPS were fluorescently labeled with 5-DTAF and Cy7 according to previous studies with minor adjustments (Zhang et al., 2021; Zheng et al., 2021). Initially, 500 mg of GUPS was dissolved in 200 mL of carbonate buffer. This buffer was prepared by dissolving 0.689 g of sodium carbonate and 1.554 g of sodium bicarbonate in 250 mL of distilled water, adjusted to a pH of 9.5. Meanwhile, 40 mg 5-DTAF was dissolved in 15 mL carbonate buffer through vortexing. The 5-DTAF solution was then combined with the GUPS solution and stirred for 24 h at 25°C and 4°C, respectively. Subsequently, the reaction mixtures were dialyzed against distilled water to eliminate any unbound 5-DTAF. After purification, the FGUPS samples were further refined using a Sephadex G-50 chromatography column, with elution performed using distilled water. The peaks of polysaccharides were identified via the phenol sulfuric acid method at 490 nm, while DTAF peaks were assessed at the same wavelength using a microplate reader. Following this, the samples were lyophilized and named FGUPS.
For the preparation of Cy7-labelled GUPS, 100 mg of GUPS, 30 mg of EDC, and 50 mg of NHS were dissolved in 5 mL of MES buffer. This buffer was prepared by dissolving 0.2439 g of MES in 50 mL of distilled water, adjusted to a pH of 5.5, and stirred for 2 h at 25°C. To remove any residual EDC and NHS, ethanol precipitation was employed. Subsequently, 5 mg sulfo-Cy7 amine was dissolved in 5 mL PBS and combined with the final precipitate, which was dissolved in 6 mL of PBS. This mixture was then stirred in darkness for 48 h at room temperature. For the elimination of unbound sulfo-Cy7 amine, the product underwent lyophilization followed by ethanol precipitation. The resultant precipitate was lyophilized again and named CGUPS. In this study, CGUPS was exclusively used for NIR imaging, whereas FGUPS was employed for other analytical purposes.
2.3 Characterization of FGUPS and CGUPS
The samples of GUPS, FGUPS and CGUPS were accurately weighed and dissolved in PBS to achieve a concentration of 100 μg/mL. UV-visible spectra ranging from 400 to 800 nm were measured using the SpectraMax iD5 multifunction microplate reader (Sunnyvale, CA, United States). The excitation (Ex) and emission (Em) wavelengths for these samples were determined with the F97PRO fluorescence spectrophotometer (Lengguang Technology, Shanghai, China). Specifically, the wavelength ranges for analysis were set between 450–650 nm for 5-DTAF and FGUPS, and between 650–850 nm for Cy7 and CGUPS. Fourier-transform infrared (FT-IR) spectra were examined using a VERTEX 70 FT-IR spectrometer (Bruker, Germany), spanning a wavelength range of 4,000–400 cm−1. Molecular weight distribution was assessed using HPGPC, employing a refractive index detector (RID, Waters, Japan). For this analysis, GUPS, FGUPS and CGUPS were dissolved in the mobile phase at a concentration of 2 mg/mL. The analysis was conducted on an Ultrahydrogel Linear column (7.8 × 300 mm, Waters) maintained at 35°C, with a mobile phase composed of a NaNO3 solution flowing at a rate of 0.5 mL/min. FGUPS and GUPS were analyzed using an Agilent-LC1100 system (Agilent, United States) equipped with an Agilent1260 FLD detector. In this setup, PBS was used as mobile phase. The excitation wavelength was set at 490 nm, while the emission wavelength was 521 nm.
2.4 Determination of the degree of fluorescence substitution
A stock solution of 5-DTAF and Cy7 at a concentration of 1 μg/mL was prepared in PBS. From this stock, dilutions were made to achieve concentrations ranging from 0.2 to 1 μg/mL, with an equal volume of PBS serving as the blank control. The fluorescence intensity for 5-DTAF (Ex = 490 nm, Em = 518 nm) and Cy7 (Ex = 740 nm, Em = 780 nm), was measured using a fluorescence spectrophotometer. Based on these measurements, a standard curve was constructed, and the regression equation was calculated to quantify the fluorescence. Additionally, 1 mg of FGUPS and CGUPS was precisely weighed and dissolved in 10 mL of PBS. From these solutions, 1.8 mL samples were analyzed using a fluorescence spectrophotometer to calculate the efficiency of polysaccharide fluorescence labeling, thereby assessing the effectiveness of the labeling process.
2.5 Establishment of quantitative analysis method of GUPS in vivo
Standard calibration samples were prepared by dissolving FGUPS at various concentrations in PBS, which were then mixing with blank plasma, tissue homogenate and fecal samples. This approach facilitated the construction of standard curves spanning a concentration range from 0.25 to 25 μg/mL for most samples, and an extended range of 0.25–500 μg/mL for fecal and urine samples. To evaluate the precision and accuracy of the method, Quality Control (QC) samples at low, medium, and high concentration levels were prepared. These QC samples utilized three distinct concentrations (0.25, 2.5, 25 μg/mL, n = 3) for plasma and tissue homogenates, and 0.25, 25, and 250 μg/mL for excretion samples (0.25, 25, 250 μg/mL, n = 3).
To evaluate the in vitro stability of FGUPS, 100 μL of a 50 μg/mL solution was mixed with 1.8 mL of PBS (pH = 7.2–7.4) and blank plasma, and then incubated at 37°C. The stability of each sample was assessed by comparing the fluorescence intensity measurements at 1, 2, 4, 6, 8, 12, and 24 h. Simulated gastric fluid (SGF) and small intestinal fluid (SIF) were prepared based on previous studies (Liu et al., 2021). The stability of the FGUPS in SGF and SIF was evaluated by measuring fluorescence intensity at 0, 1, 2, 4, and 6 h. This approach provided insights into the resilience of FGUPS under both physiological and simulated digestive conditions.
2.6 In vivo pharmacokinetic study
Female Sprague-Dawley (SD) rats, weighing 250 ± 20 g, and female BALB/c mice, weighing 20 ± 2 g, were obtained from the Animal Laboratory Center at Xinjiang Medical University (Urumqi, Xinjiang, China). These animals were housed in a temperature-controlled facility with regulated light cycles at Xinjiang University. The animal study was reviewed and approved by the Committee on the Ethics of Animal Experiments of Xinjiang Key Laboratory of Biological Resources and Genetic Engineering (BRGE-AE001). Prior to the start of the experiments, the animals were allowed unrestricted access to food and water for 1 week. Subsequently, they underwent a 12 h fasting period to prepare for the experimental procedures.
2.6.1 Collection and determination of biological samples
Excretion samples was collected using a metabolic cage. Urine samples were centrifuged at 4,000 rpm for 10 min and the supernatant was filtered through a 0.45 μm filter membrane. Fecal samples were air-dried and placed in an Eppendorf (EP) tube, mixed with a 3×PBS solution (v/w), vortexed for 5 min, and then centrifuged at 4,000 rpm for 10 min. Blood samples were collected from the orbital canthus after ether anesthesia, transferred to anticoagulant tube containing EDTA, and centrifuged at 4°C and 3,500 rpm for 10 min. The organs, including liver, kidney, spleen, lung, heart, stomach, small intestine and large intestine were all gathered, washed with PBS, weighed, and homogenized in 3×PBS using high throughput tissue grinder. The resulting homogenates were then centrifuged at 4,000 rpm for 10 min. Samples were either immediately tested or preserved in −80°C refrigerator for future testing. For the analysis, 20 μL of Urine and 150 μL each of fecal, plasma and tissue homogenates were mixed with 1.8 mL of PBS and centrifuged at 12,000 rpm for 10 min. The fluorescence intensity of the supernatant was determined under the conditions specific for FGUPS (Ex = 490 nm, Em = 521 nm).
2.6.2 Plasma level investigation
The SD rats were randomly divided into two groups, with each group containing five rats. The first group was subjected to intravenous administration, where each rat received a single dose of 25 mg/kg FGUPS intravenously. Blood samples were collected at specific time points (0.083, 0.167, 0.25, 0.5, 1, 2, 4, 6, 8, 10, 12, and 24 h) from the orbital canthus under anesthesia to measure fluorescence intensity. In the oral administration group, rats were given a single oral dose of 100 mg/kg FGUPS. Blood samples were obtained at predetermined intervals (0.5, 1, 2, 3, 4, 6, 8, 10, 12, and 24 h) following dosing. Subsequently, pharmacokinetic parameters for both groups were analyzed using the Drug and Statistics (DAS) software, Version 23.0. The absolute bioavailability was calculated by the following formula:
In the formula, AUCig represents the area under the concentration-time curve (AUC0-∞) of oral administration, Div represents the volume of intravenous injection, and AUCiv represents the AUC0-∞ of intravenous injection, and Dig represents the volume of oral administration.
2.6.3 Tissues distribution investigation
Rats in the intravenous and oral administration groups received a single dose of FGUPS at 25 and 100 mg/kg, respectively. After 4 h, the rats were euthanized, and various tissues including the liver, kidney, heart, lung, spleen, stomach, small intestine, and large intestine were harvested for analysis. Subsequently, the fluorescence intensity of each tissue was measured to assess the distribution of FGUPS. For histological examination, tissue specimens from the liver, kidney, and lung were placed in an EP tube containing 4% paraformaldehyde to ensure proper fixation. Following the fixation process, the tissues were embedded in optimal cutting temperature (OCT) compound and stored at −20°C to preserve their structural integrity. The tissue sections were prepared with a frozen section machine (Leica, Germany), followed by treated with anti-fluorescence quenching sealing tablets and then observed with CLSM (Nikon, Japan). This procedure allowed for detailed visualization of the fluorescence distribution within the tissues.
2.6.4 NIR fluorescence imaging
BALB/c mice received a single dose of CGUPS either via intravenous injection at 25 mg/kg or oral administration at 100 mg/kg. Subsequently, at 1, 4 and 12 h after administration, the mice were euthanized, and their vital organs were swiftly gathered and rinsed with PBS to remove any residual blood and debris. NIR fluorescence imaging of these organs was performed by a Fluorescence-labeled Organism Bioimaging Instrument (FOBI, Neoscience Co., Ltd., Suwon, Korea) using an NIR channel equipped with a red laser filter to capture the distribution of CGUPS within the tissues. The acquired fluorescent images were then analyzed using NEOimage software (NeoScience Co., Ltd.).
2.6.5 Excretion study
SD rats were individually placed in metabolic cages 1 day before the experiment to facilitate the collection of urine and feces. The rats were divided into two groups: one received a single intravenous dose of FGUPS at 25 mg/kg, and the other received a single oral dose at 100 mg/kg. Urine and fecal samples were collected at 6, 12, 24, 36, 48 and 72 h post-administration, and their fluorescence intensity was determined to assess the excretion pattern and bioavailability of FGUPS. This systematic collection and analysis provided valuable insights into the pharmacokinetic properties of FGUPS in the administered rats.
2.7 Caco-2 cells uptake of FGUPS
Caco-2 cells were cultured at 37°C under 5% CO2 in MEM supplemented with 20% FBS, 1% non-essential amino acids (NEAA), and 1% penicillin-streptomycin (PS). To assess the impact of FGUPS on Caco-2 cell viability, we employed the MTT assay. Cells were added in 96-well plates and treated with varying concentrations of FGUPS (50–500 μg/mL) for 24 h. Following incubation, the culture medium was replaced with MTT solution, and the cells were further incubated for 4 h. The MTT solution was then removed, DMSO was added and absorbance at 492 nm (A492 nm) was measured to determine cell viability. To investigate the cellular uptake of FGUPS, FCM and CLSM analyses were conducted. For FCM, Caco-2 cells were cultured in 12-well plates and categorized into control and FGUPS-treated groups. The FGUPS-treated groups were exposed to concentrations of 50, 100, and 200 μg/mL for 4 h, and to 200 μg/mL for 1, 2, and 4 h. After incubation, cells were washed with PBS, digested by trypsin-EDTA, and analyzed using FCM (Beckman, United States). For qualitative CLSM analysis, cells were initially seeded in confocal petri dish. Following treatment with FGUPS, cells were washed with PBS, fixed with 4% paraformaldehyde, stained, and mounted with an antifade mounting medium containing DAPI to counterstain the nuclei. Fluorescence images were captured using CLSM to visualize the uptake and intracellular localization of FGUPS.
To explore the endocytosis pathways involved in FGUPS uptake, Caco-2 cells were seeded in 12-well plates and categorized into control, 4°C, and endocytosis inhibitor groups. Cells in the 4°C group were incubated at 4°C to assess the impact of temperature on endocytosis. For the inhibitor groups, cells were pre-incubated with various endocytosis inhibitors for 1 h at 37°C to block specific pathways. The inhibitors used included sodium azide (NaN3, 1 mg/mL), chloropromazine (CPZ, 20 μM), methyl-β-cyclodextrin (M-β-CD, 100 μM), and cytochalasin D (CD, 10 μM). After pre-incubation with these inhibitors, the cells were exposed to 200 μg/mL of in the presence of the respective inhibitors for an additional 4 h. Subsequent to incubation, the cells were washed thoroughly and analyzed using FCM to determine the effects of these inhibitory treatments on the cellular uptake of FGUPS. This experimental setup was designed to elucidate the mechanisms by which FGUPS is internalized by Caco-2 cells.
2.8 Statistical analysis
The experimental data were presented as mean ± SD. Statistical differences were assessed using one-way analysis of variance (ANOVA). Graphs representations of the data were created using Origin and Prism software. Additionally, chemical reaction equations were drawn by ChemDraw 14.0 software.
3 Results and discussion
3.1 Characterization of fluorescence labeled GUPS
GUPS was successfully labeled with 5-DTAF and Cy7, as detailed in Figure 1A. The labeling process involved a nucleophilic reaction between the hydroxyl group of GUPS and 5-DTAF in a carbonate buffer at pH = 9.5 (Zheng et al., 2021). Additionally, under the catalysis of EDC and NHS, sulfo-Cy7 amine reacted with the carboxyl group of GUPS, leading to the formation of an amide bond (Zhang Y. et al., 2021). Fluorescence spectra, depicted in Figure 2B, indicated that the Ex and Em of FGUPS and 5-DTAF were 490 and 518 nm, and 490 and 521 nm, respectively. This demonstrates a slight redshift in Em after coupling 5-DTAF with GUPS. Similarly, a mild redshift in Em was observed for CGUPS (Figure 2C), implying the successful chemical bonding of 5-DTAF and Cy7 with GUPS. The UV spectra in Figure 1D revealed that FGUPS, and CGUPS appeared absorption peaks at 490 and 748 nm, respectively, distinct from the unmodified GUPS. These peaks correspond to the characteristic absorption of 5-DTAF and Cy7, respectively. The FT-IR spectra (Figure 1E) showed similar characteristic peaks for GUPS, FGUPS, and CGUPS, with additional peaks at 1,732 and 1,739 cm−1, attributed to C=O stretching vibrations in the DTAF and Cy7-modified structures. HPGPC-RID results indicated nearly identical peak shapes and retention times for GUPS, FGUPS, and CGUPS (Figure 1F). However, both CGUPS and FGUPS showed slightly delayed retention times, suggesting potential mild degradation of GUPS during the reaction (Yu-Hao et al., 2021). Moreover, HPGPC-FLD chromatograms in Figure 1G showed that the peak for FGUPS occurred at 19 min, whereas GUPS did not exhibit any peak within 30 min. These results collectively demonstrate the successful labeling of GUPS with 5-DTAF and Cy7, maintaining the structural integrity with minimal influence on the molecular framework.
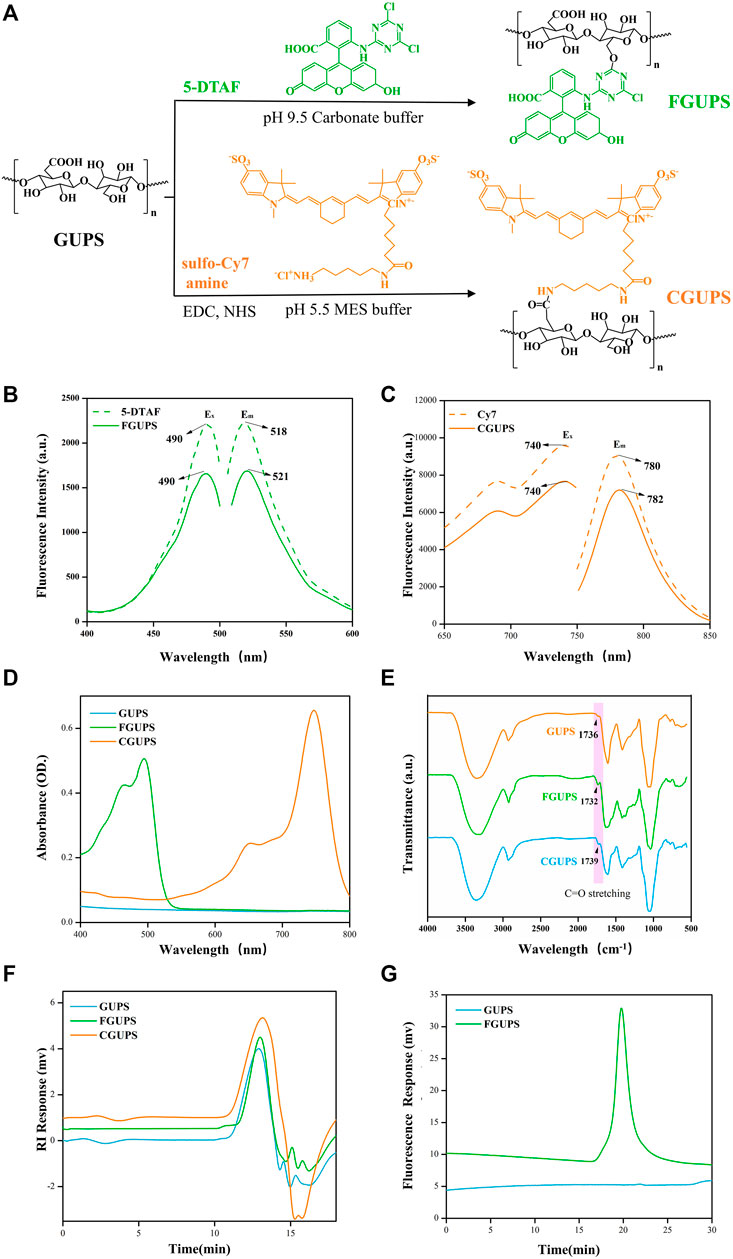
Figure 1. Characterization of fluorescence labeled GUPS. The labeling reaction schematic diagram (A), fluorescent spectra of DTAF and FGUPS (B), fluorescent spectra of Cy7 and CGUPS (C), UV spectra (D), FT-IR spectra (E), HPGPC-RID chromatograms (F) of GUPS, FGUPS and CGUPS, HPGPC-FLD chromatograms (G) of GUPS and FGUPS.
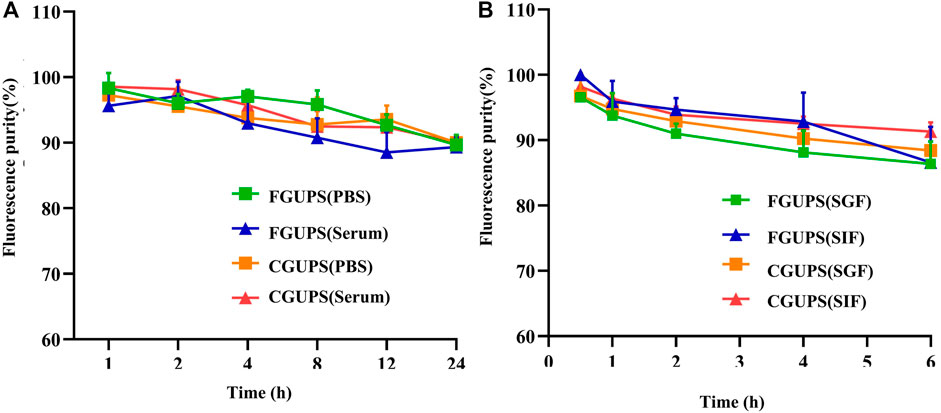
Figure 2. The stability of FGUPS and CGUPS in (A) PBS and serum, respectively, and and the stability in (B) the simulated digestive fluid.
The standard curves for 5-DTAF and Cy7 were established as y = 1844.5x + 36.124 and y = 1,463.6x − 5.9288, respectively (Supplementary Figure S1). From these curves, the substitution degree of DTAF and Cy7 were calculated to be 0.81% ± 0.09% and 0.39% ± 0.12%, respectively. These substitution levels are considered optimal; they are low enough to minimize the impact of fluorescent labeling on the polysaccharide structure, yet sufficient to ensure the detectability of the labeled molecules in analytical applications.
3.2 Verification of quantitative analysis method
The standard curve, as depicted in Table 1, was plotted with FGUPS concentration on the X-axis and fluorescence intensity on the Y-axis. The resulting R2 values for plasma, tissues, and excretion samples were all above 0.99, indicating an excellent linear correlation. The range of this correlation extends from 0.25 to 25 μg/mL for plasma and tissues, and broadens to 0.25–500 μg/mL for fecal and urine samples. This strong linearity underscores the reliability of the fluorescence measurement across various biological matrices within these specified concentration ranges.
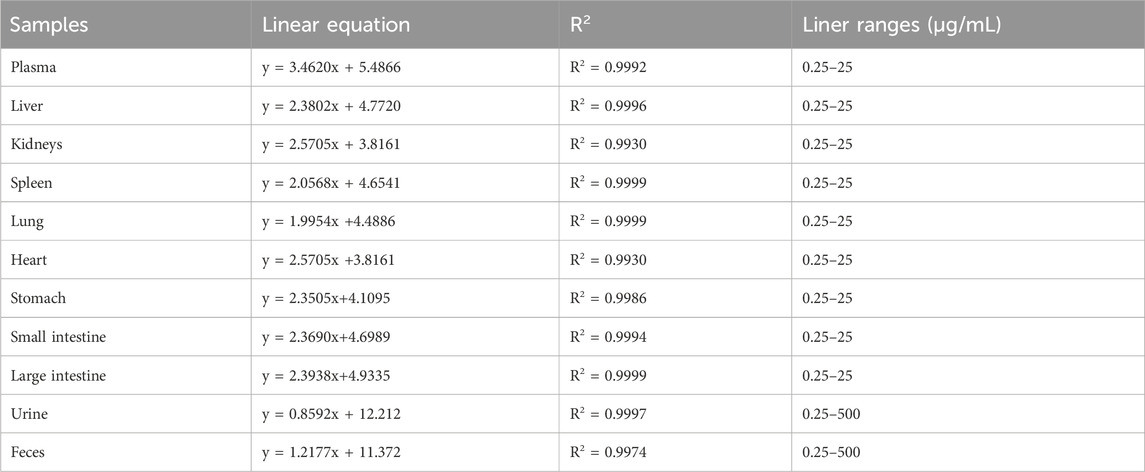
Table 1. Standard curves for FGUPS in different tissues of rat (n = 3).
The inter-day and intra-day precision for all QC biological samples was remained below 11.02%, and the recovery rate ranged from 95.28% to 106.72% (Supplementary Table S1). These findings demonstrate the method’s favorable precision and satisfactory recovery rates for FGUPS in various biological matrices. Importantly, there was no discernible matrix effect observed, ensuring reliable in vivo assessment of FGUPS concentration (Bi et al., 2022). These experimental findings underscore the robust stability, precision, and accuracy of the method used, fulfilling the essential criteria for conducting pharmacokinetic studies. Such consistent performance is critical for reliable pharmacokinetic profiling and further pharmacological evaluations.
The in vitro stability analysis of FGUPS and CGUPS (Figure 2) showed that their fluorescence purities remained above 90% (p > 0.1) when incubated in PBS solution, blank serum, and the simulated gastric and small intestinal medium at 37°C (Li et al., 2022). This high level of stability is consistent with findings from other studies on polysaccharides: Aloe polysaccharides showed no significant change in molecular weight in simulated digestive fluids (Liu et al., 2021), as did Coralline pilulifera crude polysaccharides (Wang et al., 2019), and Fuzhuan brick tea polysaccharides (Chen et al., 2018). These studies collectively indicate that these polysaccharides are not degraded in gastrointestinal fluids and exhibit general stability in vitro.
3.3 In vivo study
3.3.1 Plasma level of FGUPS
After administering a single intravenous dose of 25 mg/kg or a single oral dose of 100 mg/kg of FGUPS, the plasma concentration-time curve and relevant pharmacokinetic parameters obtained using a non-compartmental model and are displayed in Figure 3 and Table 2. Following the intravenous administration, FGUPS rapidly reached its peak plasma concentration and then gradually decreasing. Conversely, after oral administration, the maximum plasma concentration (Cmax) of 3.7 ± 2.04 μg/mL, achieved at 1 ± 0.61 h, with the concentration slowly declining but still detectable up to 24 h post-dosing. The key pharmacokinetic parameters after intravenous and oral administration included the elimination half-life (t1/2) of 6.28 ± 2.28 and 26.4 ± 7.72 h, area under the plasma concentration-time curve (AUC0-24) was 39.86 ± 3.62 and 28.92 ± 16.36 μg/mL × h, mean residence time (MRT) was 6.79 ± 2.7 and 38.81 ± 9.93 h, respectively. The absolute bioavailability was determined to be 11.3% using AUC0-∞, indicating poor absorption and low oral bioavailability. Similar studies on Polygonatum sibiricum polysaccharides (Bi et al., 2022) and Marine sulfated polysaccharides PS916 (Mingming et al., 2017) found absolute oral bioavailability of only 4.538% and 8.4% respectively. These results suggest that FGUPS exhibits characteristics of rapid absorption and prolonged elimination following oral administration, contrasted with its shorter retention time post intravenous administration. For comparison, FITC labeled Polygonatum sibiricum polysaccharides (PRP-TYR-FITC) reached the Cmax within 1–2 h after oral administration and were slowly cleared from plasma, exhibiting long half-lives (t1/2 31.39 h) (Bi et al., 2022). Conversely, PRP-TYR-FITC were rapidly eliminated after intravenous injection, with an MRT of 1.99 h and a t1/2 of 4.80 h. The slow elimination after intestinal absorption is attributed to the complex structure and large molecular weight of natural polysaccharides, which results in an extended metabolic process compared to small molecule drugs (Lin et al., 2005; Wang et al., 2019).
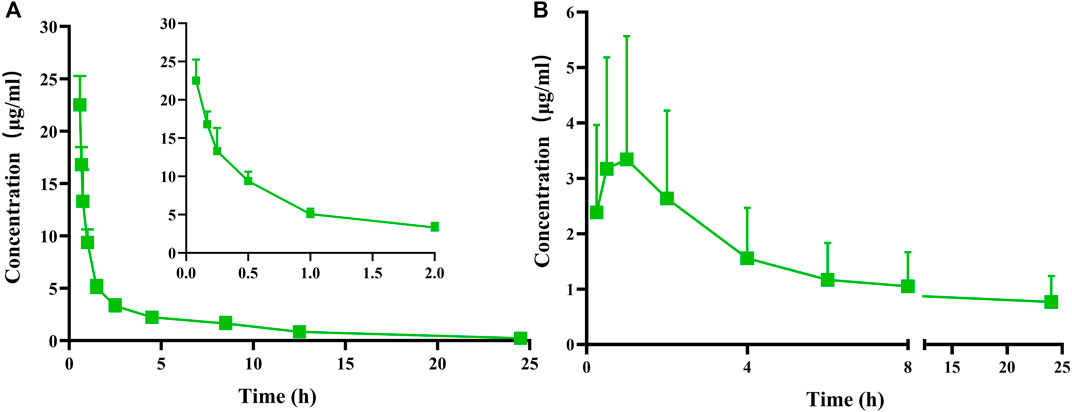
Figure 3. Plasma concentration versus time profiles of FGUPS after (A) intravenous (25 mg/kg) and (B) oral (100 mg/kg) administration in rats (n = 5).
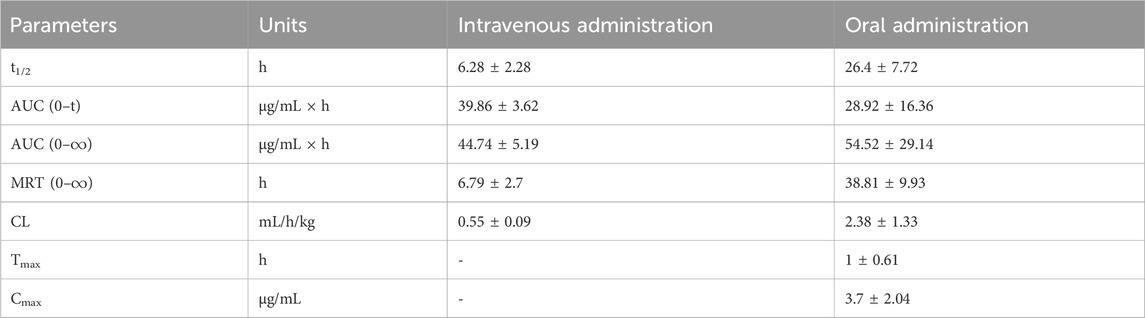
Table 2. Pharmacokinetic parameters of FGUPS after intravenous (25 mg/kg) and oral (100 mg/kg) administration in rats (n = 5).
Natural active polysaccharides, as polar macromolecules, have poor oral absorption and low in vivo exposure (oral bioavailability of most polysaccharides is less than 10%), yet have significant pharmacological effects when administered via the oral route (Xiang et al., 2023; Ye et al., 2023), making it difficult to elucidate the quantitative-affective relationship. Oral polysaccharides are not only directly intestinally absorbed and distributed to target organs, but also exert their activities by entering PPs or/and modulating the gut microbiota and their metabolites, which is a breakthrough in explaining the quantitative-effect relationship of polysaccharides (Zhang et al., 2022). In order to solve the problem of low oral bioavailability of polysaccharides, researchers are committed to constructing oral drug delivery systems based on natural polysaccharides (Li et al., 2017; Zheng et al., 2022a), such as liposomes, conjugates, in situ formation systems, and nanoparticles, which show promising results in improving polysaccharides delivery across the biological barriers and prolonging the cycling time of their targeted delivery, and are expected to provide support for the clinical application of natural polysaccharides (Wang et al., 2024).
3.3.2 Tissue distribution
Following both intravenous and intragastric administration, FGUPS was detected in all tissues examined after 4 h, showing higher concentrations in the liver, kidneys, and lungs (Figure 4A). The liver, a central organ for drug metabolism, is known to be rich in polysaccharide receptors. Hepatic parenchymal cells, hepatic nonparenchymal cells, and Kupffer cells (KC) have been specifically shown to uptake polysaccharides (Zheng et al., 2021). Similar to Angelica sinensis polysaccharide (ASP), which accumulates rapidly in the liver accumulation via asialoglycoprotein receptor (ASGPR)-mediated endocytosis by parenchymal cells (Wang et al., 2017; Zhang et al., 2018c), FGUPS likely engages in a comparable hepatic uptake mechanism, as evidenced by CLSM images (Figure 4B). The kidneys, vital for metabolism and excretion of substances, also showed significant distribution of FGUPS, suggesting potential excretion via this pathway (Yang et al., 2022). G. uralensisis known for its therapeutic effects on lung diseases; thus, the presence of FGUPS in the lungs may contribute to its efficacy. Additionally, the distribution in the lungs might be facilitated by passive targeting due to the organ’s rich vascularization, which enables the entry of drugs into the bloodstream and subsequent distribution to tissue. CLSM observations (Figure 4B) revealed green fluorescence indicative of FGUPS localized in the glomerular filtration membrane area of kidney and alveolar area of lung. While FGUPS is minimally distributed in the heart and spleen, the presence in the spleen is notable given its role as a major immune organ, where GUPS may exert its immune-modulating activity through direct interaction. Furthermore, following gavage administration, FGUPS was concentrated in the gastrointestinal (GI) tract. This localization is likely due to two factors: absorption from the intestines into the bloodstream after oral administration, and metabolism and degradation by gut microbiota (Zhang et al., 2022; Zhao et al., 2024). Studies have demonstrated that naturally active polysaccharides not only regulate the structure and abundance of intestinal microbiota, but are metabolized by it, generating metabolites like short-chain fatty acids (SCFA) that can enter the bloodstream and induce physiological effects (Dorrestein et al., 2014; Zheng et al., 2020). Interestingly, FGUPS was also detected in the GI tract following intravenous administration, suggesting hepatic metabolism and subsequent excretion into the intestine through bile. Further studies are needed to investigate the interaction between GUPS and the gut microbiota, enhancing our understanding of its metabolic pathways and effects within the body.
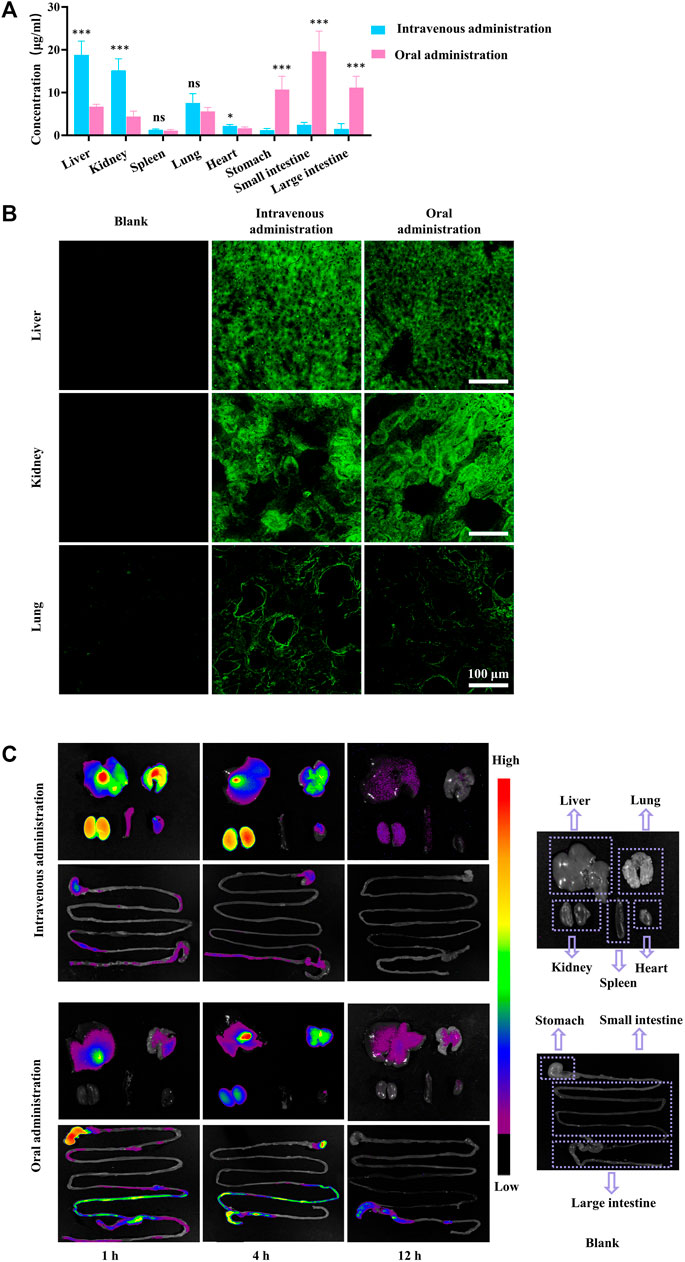
Figure 4. (A) The tissue concentration of FGUPS in rats, (B) CLSM fluorescence image of kidney, liver, and lung tissue, and (C) NIR fluorescence imaging of CGUPS (n = 5). (*p < 0.05, ***p < 0.001, comparison of intravenous and oral administration groups).
To better understand the biodistribution of GUPS biodistribution, NIR fluorescence imaging using Cy7 was employed. Figure 4C provides a visual representation of this analysis. After the intravenous injection of CGUPS, fluorescence signals were detected across major organs, with intensities gradually fading over time. After 12 h, signals in the liver and kidneys had become relatively faint, and those from the lungs, kidneys, spleen, and gastrointestinal tract were nearly imperceptible. Conversely, after intragastric administration, strong fluorescent signals were initially observed in the gastrointestinal tract just 1 h post-administration, with weaker signals detected in the liver and lungs. By the 4 h mark, fluorescence peaked in the liver, lungs, and kidneys, yet remained weak in the heart and spleen. Notably, the ileum shows a significant fluorescent signal, suggesting efficient absorption of GUPS at this site. By 12 h, CGUPS was almost entirely absorbed and metabolized, resulting in weak fluorescence in the liver and lungs, while signals in the gastrointestinal tract were mainly concentrated in the large intestines. This prolonged retention in the large intestines suggests potential for metabolism and degradation by gut microbiota. In conclusion, after intravenous administration, the concentration of CGUPS gradually decreased in various tissues. Following oral administration, however, CGUPS exhibited an initial rise followed by a reduction in tissue concentration, mirroring the profile observed in the blood concentration curve. These findings underscore the importance of biodistribution studies for GUPS, as the bioactivity of natural drugs in vivo is dependent on their concentration within the target organs. Such studies are crucial for uncovering new activities and potential mechanisms of action of GUPS.
3.3.3 Excretion of FGUPS
Urinary excretion accounted for 31.16% ± 4.65% of the intravenously administered dose of FGUPS, while only 4.07% ± 0.68% was recovered in feces (Figure 5A). The excretion rate in urine peaked within the first 0–6 h and then rapidly decreased over the next 6 h (Figure 5B). In contrast, fecal excretion rates reached their peak within 6–12 h post-administration and then gradually decreased. These results confirm that urinary excretion is the primary route of elimination following intravenous administration of FGUPS. After oral administration, a significant 60.98% ± 12.96% of the administered FGUPS dose was recovered in the feces by 72 h (Figure 5C). Conversely, only a minuscule 0.12% ± 0.04% of FGUPS was detected in the urine after the same duration. The highest rates of fecal and urinary excretion were observed within the 6–12 h and 0–6 h intervals, respectively. Subsequently, the rate of excretion gradually decreased (Figure 5D). The cumulative excretion of FGUPS through urine and feces amounted to 61.1%, indicating that 61.1% of the orally administered dose was eliminated from the body, and only 0.12% of the dose can be absorbed through oral administration. The findings suggest that fecal excretion is the primary pathway for FGUPS elimination following oral administration, indicating low oral bioavailability. This pattern is consistent with findings in similar studies, where a substantial proportion of Lycium barbarum polysaccharides (92.27%) (Xia et al., 2021) and marine sulfated polysaccharides PS916 (79.0%) (Mingming et al., 2017) were also predominantly excreted through feces after oral administration.
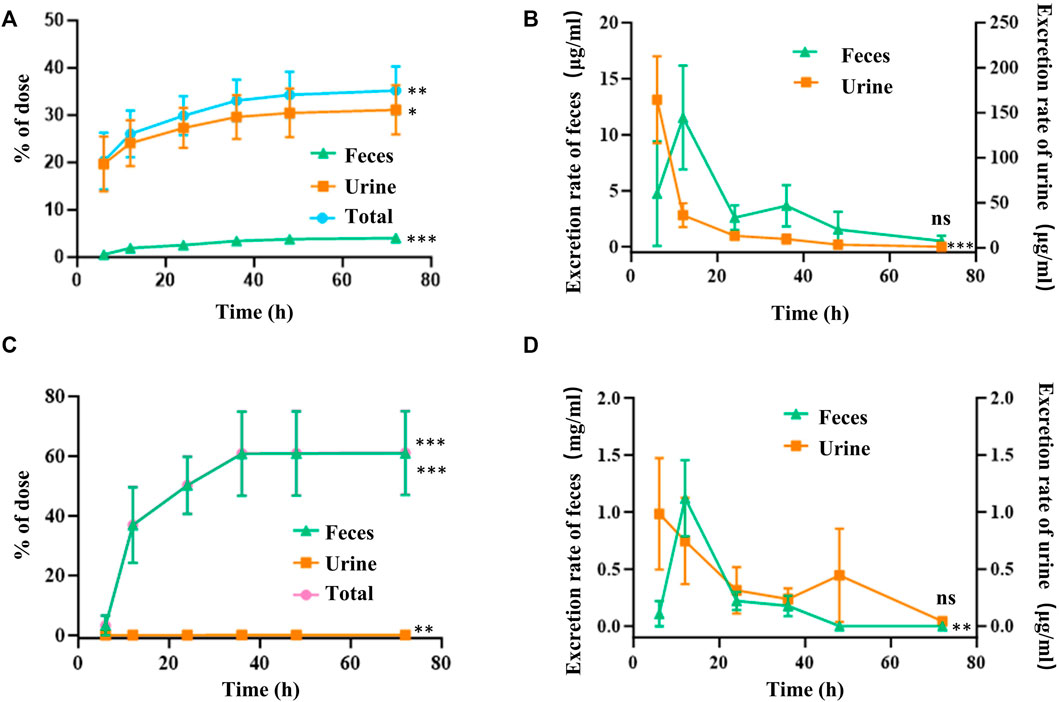
Figure 5. Cumulative amounts (A,C) and excretion rate (B,D) of FGUPS excreted in urine and feces after intravenous (A,B) and oral administration (C,D) in rats (n = 5). (*p < 0.05, **p < 0.01, ***p < 0.001, comparison of 6 and 72 h).
3.4 Caco-2 cells uptake of FGUPS
To further investigate the potential directed gut absorption of FGUPS, Caco-2 cells—a model widely used in studies of intestinal drug absorption (Panse and Gerk, 2022)—were used to determine the cellular uptake of FGUPS by FCM and CLSM. FGUPS and its counterpart GUPS were tested at concentrations ranging from 50–500 μg/mL, demonstrating no significant impact on cell viability over a 24-h period, thereby confirming the suitability of FGUPS for further examination. As shown in Figures 6B,C, the cellular uptake of FGUPS increased significantly with extended incubation periods and higher concentrations. CLSM images provided further insight, revealing that FGUPS was predominantly absorbed within the cytoplasm and, to a lesser extent, associated with the cell membrane, in a time-dependent manner (Figure 6D). Furthermore, both FCM and CLSM assays showed minimal fluorescence in cells treated with 5-DTAF, demonstrating that the observed fluorescence signals from FGUPS in these cellular uptake experiments were not originate from free 5-DTAF (Figures 6E,F). This evidence underscores the effective cellular internalization of FGUPS in Caco-2 cells and supports its potential for directed absorption in the gastrointestinal tract.
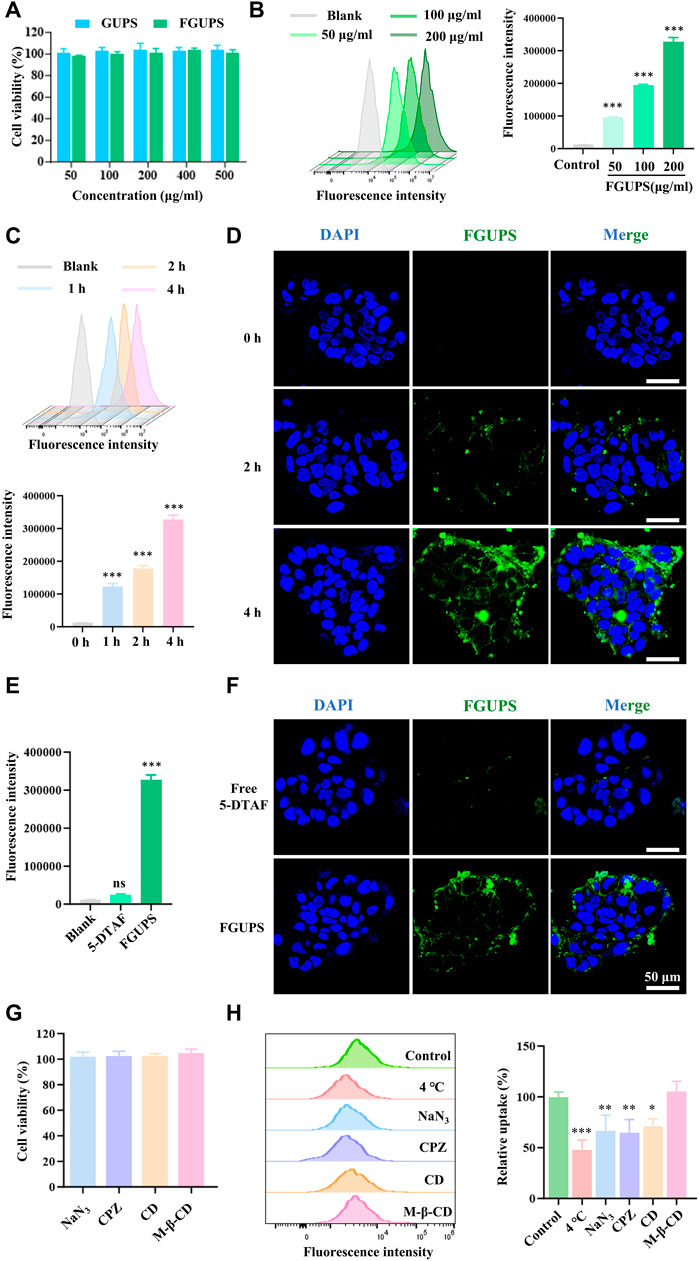
Figure 6. Caco-2 cells uptake of FGUPS. (A) Cytotoxicity assays of GUPS and FGUPS. (B,C) FCM analysis the effect of incubation time and concentration of FGUPS on the cellular uptake. (D) CLSM imaging of the cellular uptake of FGUPS for 0, 2 and 4 h, respectively. (E,F) FCM and CLSM analysis of the cellular uptake of FGUPS and free 5-DTAF for 4 h. (H) Cytotoxicity assays of various cellular inhibitors. (G) FCM analysis of uptake mechanisms. (*p < 0.05, **p < 0.01, ***p < 0.001 versus the blank/control group).
Polysaccharides are absorbed through the intestinal epithelium via two pathways: paracellular and transcellular pathways (Yeh et al., 2011). Transcellular transport is crucial for the passage of extracellular macromolecules through the intestinal epithelium, allowing them to be internalized by intestinal epithelial cells. This process of endocytosis in intestinal epithelial cells includes mechanisms such as clathrin- and/or caveolin-mediated endocytosis, clathrin/caveolin-independent endocytosis and micropinocytosis (Zheng et al., 2022a). To study the endocytosis process of FGUPS, the effect of active transport in cellular uptake was explored. As shown in Figure 6H, the uptake of FGUPS by cells significantly decreased under conditions of low temperature (4°C) or when treated with the metabolic inhibitor NaN3, indicating that FGUPS uptake is an energy-dependent process. Further exploration into the specific endocytosis pathways involved in FGUPS uptake by Caco-2 cells was investigated by various endocytosis pathway inhibitors. Initial MTT assays confirmed the non-toxicity of these inhibitors at the experimental concentration used (Figure 6G). The results showed that chloropromazine and cytochalasin D significantly reduced the cellular uptake of FGUPS compared to the control group, whereas methyl-β-cyclodextrin had no inhibitory effect on FGUPS endocytosis. Chlorpromazine disrupts clathrin-coated pit formation by inhibiting the assembly of clathrin on the cell membrane, effectively blocking clathrin-mediated endocytosis (Bai et al., 2020). Cytochalasin D interferes with actin-involved macropinocytosis by disrupting actin filaments (Nagai et al., 2018). In contrast, methyl-β-cyclodextrin, which inhibits caveolae-mediated endocytosis by suppressing cholesterol removal (Li et al., 2021a), did not influence FGUPS uptake, suggesting that this pathway is not primarily involved. In summary, the uptake of FGUPS by Caco-2 cells is both concentration- and time-dependent, predominantly facilitated through macropinocytosis and clathrin-mediated endocytosis. This detailed investigation highlights the mechanisms of FGUPS cellular internalization and underscores its potential for targeted intestinal absorption.
4 Conclusion
This study marks the first pharmacokinetics analysis of GUPS, employing a fluorescent labeling technique for enhanced precision. GUPS was successfully labelled with 5-DTAF and Cy7, ensuring good stability and biocompatibility, which facilitated both quantitative and qualitative analysis in vivo and in vitro. Throughout the investigation, a comprehensive analysis of the metabolic profile of GUPS was systematically investigated using a variety of assays. These included evaluations of plasma pharmacokinetics, tissue distribution, excretion patterns and rates, and mechanisms of intestinal absorption. The findings revealed that GUPS is rapidly cleared from the body after intravenous administration. Conversely, after oral administration, GUPS is absorbed by the gut, enters the blood circulation, and accumulates predominantly in the liver, kidneys, and lungs. Further insights were gained using the Caco-2 cell model, which reconfirmed that GUPS is absorbed by the small intestine epithelium predominantly through macropinocytosis and clathrin-mediated endocytosis. These findings not only expand our understanding of GUPS absorption and metabolism but also provide a robust theoretical foundation for the potential clinical application of GUPS and other natural polysaccharides. This study underscores the importance of detailed pharmacokinetic profiling in the development and utilization of natural compounds in medical treatments.
Data availability statement
The raw data supporting the conclusions of this article will be made available by the authors, without undue reservation.
Ethics statement
The animal study was approved by Committee on the Ethics of Animal Experiments of Xinjiang Key Laboratory of Biological Resources and Genetic Engineering (BRGE-AE001). The study was conducted in accordance with the local legislation and institutional requirements.
Author contributions
AW: Conceptualization, Data curation, Formal Analysis, Methodology, Validation, Writing–original draft. JC: Investigation, Project administration, Writing–review and editing. HL: Methodology, Validation, Writing–original draft. DN: Conceptualization, Writing–review and editing. JML: Conceptualization, Visualization, Writing–original draft. GX: Investigation, Software, Writing–original draft. QC: Formal Analysis, Investigation, Writing–original draft. SZ: Investigation, Formal analysis, Writing–original draft. WH: Conceptualization, Validation, Funding acquisition, Writing–review and editing. AA: Conceptualization, Funding acquisition, Supervision, Writing–review and editing, Validation. JYL: Conceptualization, Funding acquisition, Supervision, Writing–review and editing.
Funding
The author(s) declare that financial support was received for the research, authorship, and/or publication of this article. This work was supported by the Key research and development program in Xinjiang Uygur Autonomous Region (2022B03018-5) and the Natural Science Foundation of Xinjiang Uygur Autonomous Region (2022D01C97) to AA, and the Tianshan Talent Training Program (2023TSYCLJ0043) and the Jiayin Hospital Horizontal Project (No. 202306140004) to JYL.
Conflict of interest
Author JC was employed by Urumqi Xinze Ziqi Biotechnology Company, Limited.
The remaining authors declare that the research was conducted in the absence of any commercial or financial relationships that could be construed as a potential conflict of interest.
The author(s) declared that they were an editorial board member of Frontiers, at the time of submission. This had no impact on the peer review process and the final decision.
Publisher’s note
All claims expressed in this article are solely those of the authors and do not necessarily represent those of their affiliated organizations, or those of the publisher, the editors and the reviewers. Any product that may be evaluated in this article, or claim that may be made by its manufacturer, is not guaranteed or endorsed by the publisher.
Supplementary material
The Supplementary Material for this article can be found online at: https://www.frontiersin.org/articles/10.3389/fphar.2024.1431221/full#supplementary-material
References
Aipire, A., Li, J., Yuan, P., He, J., Hu, Y., Liu, L., et al. (2017). Glycyrrhiza uralensis water extract enhances dendritic cell maturation and antitumor efficacy of HPV dendritic cell-based vaccine. Sci. Rep. 7, 43796. doi:10.1038/srep43796
Aipire, A., Mahabati, M., Cai, S., Wei, X., Yuan, P., Aimaier, A., et al. (2020a). The immunostimulatory activity of polysaccharides from Glycyrrhiza uralensis. PeerJ 8, e8294. doi:10.7717/peerj.8294
Aipire, A., Yuan, P., Aimaier, A., Cai, S., Mahabati, M., Lu, J., et al. (2020b). Preparation, characterization, and immuno-enhancing activity of polysaccharides from Glycyrrhiza uralensis. Biomolecules 10 (1), 159. doi:10.3390/biom10010159
Bai, X., Zhang, E., Hu, B., Liang, H., Song, S., and Ji, A. (2020). Study on absorption mechanism and tissue distribution of fucoidan. Molecules 25 (5), 1087. doi:10.3390/molecules25051087
Bao, W., Zhang, Q., Zheng, H., Li, L., Liu, M., Cheng, H., et al. (2021). Radix Astragali polysaccharide RAP directly protects hematopoietic stem cells from chemotherapy-induced myelosuppression by increasing FOS expression. Int. J. Biol. Macromol. 183, 1715–1722. doi:10.1016/j.ijbiomac.2021.05.120
Bi, J., Zhao, C., Jin, W., Chen, Q., Fan, B., and Qian, C. (2022). Study on pharmacokinetics and tissue distribution of Polygonatum sibiricum polysaccharide in rats by fluorescence labeling. Int. J. Biol. Macromol. 215, 541–549. doi:10.1016/j.ijbiomac.2022.06.078
Chen, G., Li, C., Zhang, Y., and Wang, Q. (2021). Whole-body fluorescence imaging in the near-infrared window. Adv. Exp. Med. Biol. 3233, 83–108. doi:10.1007/978-981-15-7627-0_5
Chen, G., Xie, M., Wan, P., Chen, D., Ye, H., Chen, L., et al. (2018). Digestion under saliva, simulated gastric and small intestinal conditions and fermentation in vitro by human intestinal microbiota of polysaccharides from Fuzhuan brick tea. Food Chem. 244, 331–339. doi:10.1016/j.foodchem.2017.10.074
Dorrestein, P. C., Mazmanian, S. K., and Knight, R. (2014). Finding the missing links among metabolites, microbes, and the host. Immunity 40 (6), 824–832. doi:10.1016/j.immuni.2014.05.015
Du, J., Cao, L., Jia, R., and Yin, G. (2017). Hepatoprotective and antioxidant effects of dietary Glycyrrhiza polysaccharide against TCDD-induced hepatic injury and RT-PCR quantification of AHR2, ARNT2, CYP1A mRNA in Jian Carp (Cyprinus carpio var. Jian). J. Environ. Sci. 51, 181–190. doi:10.1016/j.jes.2016.06.026
Han, Q. B. (2018). Critical problems stalling progress in natural bioactive polysaccharide research and development. J. Agric. Food Chem. 66 (18), 4581–4583. doi:10.1021/acs.jafc.8b00493
Ishizuka, Y., Tsukada, H., and Gejyo, F. (2004). Interference of (1--> 3)-beta-D-glucan administration in the measurement of plasma (1--> 3)-beta-D-glucan. Intern Med. 43 (2), 97–101. doi:10.2169/internalmedicine.43.97
Li, F., Wei, Y., Zhao, J., Yu, G., Huang, L., and Li, Q. (2021a). Transport mechanism and subcellular localization of a polysaccharide from Cucurbia Moschata across Caco-2 cells model. Int. J. Biol. Macromol. 182, 1003–1014. doi:10.1016/j.ijbiomac.2021.04.107
Li, F., Wei, Y., Zhao, J., Yu, G., Huang, L., and Li, Q. (2021b). Transport mechanism and subcellular localization of a polysaccharide from Cucurbia Moschata across Caco-2 cells model. Int. J. Biol. Macromol. 182, 1003–1014. doi:10.1016/j.ijbiomac.2021.04.107
Li, F., Wei, Y., Zhao, J., Zhang, L., and Li, Q. (2022). In vivo pharmacokinetic study of a Cucurbita moschata polysaccharide after oral administration. Int. J. Biol. Macromol. 203, 19–28. doi:10.1016/j.ijbiomac.2022.01.111
Li, L., Yao, H., Li, X., Zhang, Q., Wu, X., Wong, T., et al. (2019). Destiny of Dendrobium officinale polysaccharide after oral administration: indigestible and nonabsorbing, ends in modulating gut microbiota. J. Agric. Food Chem. 67 (21), 5968–5977. doi:10.1021/acs.jafc.9b01489
Li, Z., Wang, L., Lin, X., Shen, L., and Feng, Y. (2017). Drug delivery for bioactive polysaccharides to improve their drug-like properties and curative efficacy. Drug Deliv. 24 (Suppl. 1), 70–80. doi:10.1080/10717544.2017.1396383
Lian, K.-X., Zhu, X.-Q., Chen, J., Liu, G., and Gu, X.-L. (2018). Selenylation modification: enhancement of the antioxidant activity of a Glycyrrhiza uralensis polysaccharide. Glycoconj. J. 35, 243–253. doi:10.1007/s10719-018-9817-8
Lin, X., Xu, D.-S., Feng, Y., and Shen, L. (2005). Determination of Ophiopogon japonicus polysaccharide in plasma by HPLC with modified postcolumn fluorescence derivatization. Anal. Biochem. 342, 179–185. doi:10.1016/j.ab.2005.04.025
Liu, C., Du, P., Cheng, Y., Guo, Y., Hu, B., Yao, W., et al. (2021). Study on fecal fermentation characteristics of aloe polysaccharides in vitro and their predictive modeling. Carbohydr. Polym. 256, 117571. doi:10.1016/j.carbpol.2020.117571
Mingming, Y., Yuanhong, W., Fugang, M., Weijie, Y., Tingfu, J., and Zhihua, L. V. (2017). Pharmacokinetics, tissue distribution and excretion study of fluoresceinlabeled PS916 in rats. Curr. Pharm. Biotechnol. 18 (5), 391–399. doi:10.2174/1389201018666170425120832
Nagai, N., Ogata, F., Ishii, M., Fukuoka, Y., Otake, H., Nakazawa, Y., et al. (2018). Involvement of endocytosis in the transdermal penetration mechanism of ketoprofen nanoparticles. Int. J. Mol. Sci. 19, 2138. doi:10.3390/ijms19072138
Nualnoi, T., Kirosingh, A., Pandit, S. G., Thorkildson, P., Brett, P. J., Burtnick, M. N., et al. (2016). In vivo distribution and clearance of purified capsular polysaccharide from burkholderia pseudomallei in a murine model. PLoS Negl. Trop. Dis. 10 (12), e0005217. doi:10.1371/journal.pntd.0005217
Panse, N., and Gerk, P. M. (2022). The Caco-2 Model: modifications and enhancements to improve efficiency and predictive performance. Int. J. Pharm. 624, 122004. doi:10.1016/j.ijpharm.2022.122004
Pozharitskaya, O. N., Shikov, A. N., Faustova, N. M., Obluchinskaya, E. D., Kosman, V. M., Vuorela, H., et al. (2018). Pharmacokinetic and tissue distribution of fucoidan from fucus vesiculosus after oral administration to rats. Mar. Drugs 16(4) 16, 132. doi:10.3390/md16040132
Pozharitskaya, O. N., Shikov, A. N., Obluchinskaya, E. D., and Vuorela, H. (2019). The pharmacokinetics of fucoidan after topical application to rats. Mar. Drugs 17(12), 687. doi:10.3390/md17120687
Roger, O., Colliec-Jouault, S., Ratiskol, J., Sinquin, C., Guezennec, J., Fischer, A. M., et al. (2002). Polysaccharide labelling: impact on structural and biological properties. Carbohydr. Polym. 50, 273–278. doi:10.1016/s0144-8617(02)00030-9
Shao, Y. Y., Zhao, Y. N., Sun, Y. F., Guo, Y., Zhang, X., Chang, Z. P., et al. (2022). Investigation of the internalization and transport mechanism of Codonopsis Radix polysaccharide both in mice and Caco-2 cells. Int. J. Biol. Macromol. 215, 23–35. doi:10.1016/j.ijbiomac.2022.06.104
Shi, G., Kong, J., Wang, Y., Xuan, Z., and Xu, F. (2022). Glycyrrhiza uralensis Fisch. alleviates dextran sulfate sodium-induced colitis in mice through inhibiting of NF-κB signaling pathways and modulating intestinal microbiota. J. Ethnopharmacol. 298 298, 115640. doi:10.1016/j.jep.2022.115640
Tokita, Y., Nakajima, K., Mochida, H., Iha, M., and Nagamine, T. (2010). Development of a fucoidan-specific antibody and measurement of fucoidan in serum and urine by sandwich ELISA. Biosci. Biotechnol. Biochem. 74 (2), 350–357. doi:10.1271/bbb.90705
Wang, J., Wu, X., Chen, J., Gao, T., Zhang, Y., and Yu, N. (2024). Traditional Chinese medicine polysaccharide in nano-drug delivery systems: current progress and future perspectives. Biomed. Pharmacother. 173, 116330. doi:10.1016/j.biopha.2024.116330
Wang, K., Cheng, F., Pan, X., Zhou, T., Liu, X., Zheng, Z., et al. (2017). Investigation of the transport and absorption of Angelica sinensis polysaccharide through gastrointestinal tract both in vitro and in vivo. Drug Deliv. 24 (1), 1360–1371. doi:10.1080/10717544.2017.1375576
Wang, Y., Chen, G., Peng, Y., Rui, Y., Zeng, X., and Ye, H. (2019a). Simulated digestion and fermentation in vitro with human gut microbiota of polysaccharides from Coralline pilulifera. LWT 100, 167–174. doi:10.1016/j.lwt.2018.10.028
Wang, Y., Li, Y., Ma, X., Ren, H., Fan, W., Leng, F., et al. (2018). Extraction, purification, and bioactivities analyses of polysaccharides from Glycyrrhiza uralensis. Industrial Crops Prod. 122, 596–608. doi:10.1016/j.indcrop.2018.06.011
Wang, Z., Gao, Z., Wang, A., Jia, L., Zhang, X., Fang, M., et al. (2019b). Comparative oral and intravenous pharmacokinetics of phlorizin in rats having type 2 diabetes and in normal rats based on phase II metabolism†. Food and Funct. 10, 1582–1594. doi:10.1039/c8fo02242a
Wu, X., Huang, X., Ma, W., Li, M., Wen, J., Chen, C., et al. (2023). Bioactive polysaccharides promote gut immunity via different ways. Food Funct. 14 (3), 1387–1400. doi:10.1039/d2fo03181g
Wu, Y., Zhou, H., Wei, K., Zhang, T., Che, Y., Nguyễn, A. D., et al. (2022a). Structure of a new glycyrrhiza polysaccharide and its immunomodulatory activity. Front. Immunol. 13, 1007186. doi:10.3389/fimmu.2022.1007186
Wu, Z., Zhang, Y., Nie, G., Liu, J., Mei, H., He, Z., et al. (2022b). Tracking the gastrointestinal digestive and metabolic behaviour of Dendrobium officinale polysaccharides by fluorescent labelling. Food Funct. 13 (13), 7274–7286. doi:10.1039/d2fo01506d
Xia, H., Yang, C., Zhou, B., Tang, H., Yang, L., Liao, W., et al. (2021). Pharmacokinetics and excretion study of Lycium barbarum polysaccharides in rats by FITC-fluorescence labeling. Foods 10(11) 10, 2851. doi:10.3390/foods10112851
Xiang, N., Zhao, J., Chang, S., Li, S., Liu, S., and Wang, C. (2023). In vitro fecal fermentation of Euphorbia humifusa-derived polysaccharides and their protective effect against ulcerative colitis in mice. Foods 12 (4), 751. doi:10.3390/foods12040751
Xue, H., Zhang, P., Zhang, C., Gao, Y., and Tan, J. (2024). Research progress in the preparation, structural characterization, and biological activities of polysaccharides from traditional Chinese medicine. Int. J. Biol. Macromol. 262 (Pt 1), 129923. doi:10.1016/j.ijbiomac.2024.129923
Yang, C., Xia, H., Tang, H., Yang, L., and Sun, G. (2022). Tissue distribution of Lycium barbarum polysaccharides in rat tissue by fluorescein isothiocyanate labeling. Food Sci. Hum. Wellness 11 (4), 837–844. doi:10.1016/j.fshw.2022.03.004
Yang, R., Yuan, B.-C., Ma, Y.-S., Zhou, S., and Liu, Y. (2016). The anti-inflammatory activity of licorice, a widely used Chinese herb. Pharm. Biol. 55, 5–18. doi:10.1080/13880209.2016.1225775
Ye, D., Zhao, Q., Ding, D., and Ma, B. L. (2023). Preclinical pharmacokinetics-related pharmacological effects of orally administered polysaccharides from traditional Chinese medicines: a review. Int. J. Biol. Macromol. 252, 126484. doi:10.1016/j.ijbiomac.2023.126484
Yeh, T.-H., Hsu, L.-W., Tseng, M. T., Lee, P.-L., Sonjae, K., Ho, Y.-C., et al. (2011). Mechanism and consequence of chitosan-mediated reversible epithelial tight junction opening. Biomaterials 32, 6164–6173. doi:10.1016/j.biomaterials.2011.03.056
Yu-Hao, D., Chun, C., Xiong, F., and Rui-Hai, L. (2021). Study on the pharmacokinetics of mulberry fruit polysaccharides through fluorescence labeling. Int. J. Biol. Macromol. 186, 462–471. doi:10.1016/j.ijbiomac.2021.07.075
Zhang, B., Liu, M., Liu, G., Li, D., and Zhou, B. (2021a). Oral absorption mechanism of the polysaccharides from Gastrodia elata Blume base on fluorescence labeling. Food Res. Int. 144, 110342. doi:10.1016/j.foodres.2021.110342
Zhang, C.-H., Yu, Y., Liang, Y.-Z., and Chen, X.-Q. (2015). Purification, partial characterization and antioxidant activity of polysaccharides from Glycyrrhiza uralensis. Int. J. Biol. Macromol. 79, 681–686. doi:10.1016/j.ijbiomac.2015.05.060
Zhang, D., Liu, J., Cheng, H., Wang, H., Tan, Y., Feng, W., et al. (2022a). Interactions between polysaccharides and gut microbiota: a metabolomic and microbial review. Food Res. Int. 160, 111653. doi:10.1016/j.foodres.2022.111653
Zhang, J., He, J., Huang, J., Li, X., Fan, X., Li, W., et al. (2023a). Pharmacokinetics, absorption and transport mechanism for ginseng polysaccharides. Biomed. Pharmacother. 162, 114610. doi:10.1016/j.biopha.2023.114610
Zhang, Q., Li, L., Hao, S., Liu, M., Huo, C., Wu, J., et al. (2022b). A lymphatic route for a hyperbranched heteroglycan from Radix Astragali to trigger immune responses after oral dosing. Carbohydr. Polym. 292, 119653. doi:10.1016/j.carbpol.2022.119653
Zhang, X., Zhao, S., Song, X., Jia, J., Zhang, Z., Zhou, H., et al. (2018a). Inhibition effect of glycyrrhiza polysaccharide (GCP) on tumor growth through regulation of the gut microbiota composition. J. Pharmacol. Sci. 137, 324–332. doi:10.1016/j.jphs.2018.03.006
Zhang, Y., Liu, J., Dou, P., Wu, Z., Zheng, Z., Pan, X., et al. (2021b). Oral absorption characteristics and mechanisms of a pectin-type polysaccharide from Smilax China L. across the intestinal epithelium. Carbohydr. Polym. 270, 118383. doi:10.1016/j.carbpol.2021.118383
Zhang, Y., Wang, H., Zheng, Y., Wu, Z., Liu, J., Cheng, F., et al. (2024). Degradation of Angelica sinensis polysaccharide: structures and protective activities against ethanol-induced acute liver injury. Carbohydr. Polym. 328, 121745. doi:10.1016/j.carbpol.2023.121745
Zhang, Y., Wu, N., Wang, J., Chen, Z., Wu, Z., Song, M., et al. (2023b). Gastrointestinal metabolism characteristics and mechanism of a polysaccharide from Grifola frondosa. Int. J. Biol. Macromol. 253, 126357. doi:10.1016/j.ijbiomac.2023.126357
Zhang, Y., Zheng, Z., Yang, X., Pan, X., Yin, L., Huang, X., et al. (2018b). A sensitive and rapid radiolabelling method for the in vivo pharmacokinetic study of lentinan. Food Funct. 9 (6), 3114–3125. doi:10.1039/c8fo00272j
Zhang, Y., Zhou, T., Luo, L., Cui, Z., Wang, N., Shu, Y., et al. (2018c). Pharmacokinetics, biodistribution and receptor mediated endocytosis of a natural Angelica sinensis polysaccharide. Artif. Cells Nanomed Biotechnol. 46 (Suppl. 1), 254–263. doi:10.1080/21691401.2017.1421210
Zhao, W. X., Wang, T., Zhang, Y. N., Chen, Q., Wang, Y., Xing, Y. Q., et al. (2024). Molecular mechanism of polysaccharides extracted from Chinese medicine targeting gut microbiota for promoting health. Chin. J. Integr. Med. 30 (2), 171–180. doi:10.1007/s11655-022-3522-y
Zheng, L., Luo, M., Kuang, G., Liu, Y., Liang, D., Huang, H., et al. (2020a). Capsular polysaccharide from Bacteroides fragilis protects against ulcerative colitis in an undegraded form. Front. Pharmacol. 11, 570476. doi:10.3389/fphar.2020.570476
Zheng, Z., Pan, X., Luo, L., Zhang, Q., Huang, X., Liu, Y., et al. (2022a). Advances in oral absorption of polysaccharides: mechanism, affecting factors, and improvement strategies. Carbohydr. Polym. 282, 119110. doi:10.1016/j.carbpol.2022.119110
Zheng, Z., Pan, X., Xu, J., Wu, Z., Zhang, Y., and Wang, K. (2020b). Advances in tracking of polysaccharides in vivo: labeling strategies, potential factors and applications based on pharmacokinetic characteristics. Int. J. Biol. Macromol. 163, 1403–1420. doi:10.1016/j.ijbiomac.2020.07.210
Zheng, Z., Tang, W., Lu, W., Mu, X., Liu, Y., Pan, X., et al. (2022b). Metabolism and biodegradation of β-glucan in vivo. Front. Vet. Sci. 9, 889586. doi:10.3389/fvets.2022.889586
Keywords: Glycyrrhiza uralensis polysaccharides, fluorescence labeling, pharmacokinetics, tissue distribution, gut absorption
Citation: Wubuli A, Chai J, Liu H, Nijat D, Li J, Xia G, Cao Q, Zhang S, Huang W, Aipire A and Li J (2024) In vivo pharmacokinetics of Glycyrrhiza uralensis polysaccharides. Front. Pharmacol. 15:1431221. doi: 10.3389/fphar.2024.1431221
Received: 11 May 2024; Accepted: 24 June 2024;
Published: 19 July 2024.
Edited by:
Xue LI, UMR8214 Institut des Sciences Moléculaires d’Orsay (ISMO), FranceReviewed by:
Claudia Finamore, University of Naples Federico II, ItalyVigyasa Singh, University of Arizona, United States
Copyright © 2024 Wubuli, Chai, Liu, Nijat, Li, Xia, Cao, Zhang, Huang, Aipire and Li. This is an open-access article distributed under the terms of the Creative Commons Attribution License (CC BY). The use, distribution or reproduction in other forums is permitted, provided the original author(s) and the copyright owner(s) are credited and that the original publication in this journal is cited, in accordance with accepted academic practice. No use, distribution or reproduction is permitted which does not comply with these terms.
*Correspondence: Weidong Huang, aHdkQGp5bmsuY29t; Adila Aipire, YWRpbGExNkB4anUuZWR1LmNu; Jinyao Li, bGp5eGp1QHhqdS5lZHUuY24=
†These authors have contributed equally to this work