
95% of researchers rate our articles as excellent or good
Learn more about the work of our research integrity team to safeguard the quality of each article we publish.
Find out more
ORIGINAL RESEARCH article
Front. Pharmacol. , 28 June 2024
Sec. Inflammation Pharmacology
Volume 15 - 2024 | https://doi.org/10.3389/fphar.2024.1399363
This article is part of the Research Topic Purinergic Signaling in Metabolic Diseases and Inflammation Pharmacology View all 6 articles
 Plinio Marcos Freire dos Santos1
 Chyntia Carolina Díaz Acosta1,2
 Thabatta Leal Silveira Andrezo Rosa1
 Michelle Harumi Ishiba1
 André Alves Dias1
 Antonio Marcos Rodrigues Pereira1Luísa Domingos Gutierres1Melissa Pontes Pereira1
 Matheus da Silva Rocha1
 Patrícia Sammarco Rosa3
 Daniele F. F. Bertoluci3,4
 José Roberto Meyer-Fernandes5
 Fabricio da Mota Ramalho Costa6
 Maria Angela M. Marques6
 John T. Belisle6
 Roberta Olmo Pinheiro7
 Luciana Silva Rodrigues8Maria Cristina Vidal Pessolani1
 Marcia Berrêdo-Pinho1*
Background: Leprosy is a chronic infectious disease caused by Mycobacterium leprae, which can lead to a disabling neurodegenerative condition. M. leprae preferentially infects skin macrophages and Schwann cells–glial cells of the peripheral nervous system. The infection modifies the host cell lipid metabolism, subverting it in favor of the formation of cholesterol-rich lipid droplets (LD) that are essential for bacterial survival. Although researchers have made progress in understanding leprosy pathogenesis, many aspects of the molecular and cellular mechanisms of host–pathogen interaction still require clarification. The purinergic system utilizes extracellular ATP and adenosine as critical signaling molecules and plays several roles in pathophysiological processes. Furthermore, nucleoside surface receptors such as the adenosine receptor A2AR involved in neuroimmune response, lipid metabolism, and neuron–glia interaction are targets for the treatment of different diseases. Despite the importance of this system, nothing has been described about its role in leprosy, particularly adenosinergic signaling (AdoS) during M. leprae–Schwann cell interaction.
Methods: M. leprae was purified from the hind footpad of athymic nu/nu mice. ST88-14 human cells were infected with M. leprae in the presence or absence of specific agonists or antagonists of AdoS. Enzymatic activity assays, fluorescence microscopy, Western blotting, and RT-qPCR analysis were performed. M. leprae viability was investigated by RT-qPCR, and cytokines were evaluated by enzyme-linked immunosorbent assay.
Results: We demonstrated that M. leprae-infected Schwann cells upregulated CD73 and ADA and downregulated A2AR expression and the phosphorylation of the transcription factor CREB (p-CREB). On the other hand, activation of A2AR with its selective agonist, CGS21680, resulted in: 1) reduced lipid droplets accumulation and pro-lipogenic gene expression; 2) reduced production of IL-6 and IL-8; 3) reduced intracellular M. leprae viability; 4) increased levels of p-CREB.
Conclusion: These findings suggest the involvement of the AdoS in leprosy neuropathogenesis and support the idea that M. leprae, by downmodulating the expression and activity of A2AR in Schwann cells, decreases A2AR downstream signaling, contributing to the maintenance of LD accumulation and intracellular viability of the bacillus.
Leprosy is a chronic infectious disease that can lead to severe peripheral neuropathy. The etiological agent of leprosy is M. leprae (Han et al., 2008; Sharma et al., 2013; Romero-Navarrete et al., 2022), although a possible second agent, M. lepromatosis, has been identified (Deps and Collin, 2021). M. leprae has been detected inside both non-myelinating and myelinated Schwann cells (SCs) in the nerves of leprosy patients (Scollard et al., 2015; Ma et al., 2023). The SCs are the glial cells of the peripheral nervous system (PNS) responsible for the maintenance of the myelin sheath and neuronal homeostasis and the plasticity of the PNS (Gomez-Sanchez et al., 2015). Literature shows that M. leprae is intimately related to the demyelinating phenotype associated with peripheral nerve injury, a hallmark symptom of leprosy patients that can be irreversible and results in physical deformities, disability, and stigmatization of patients (Lockwood, 2019). Despite the participation of immune cells in this phenotype (Masaki et al., 2015; Pinheiro et al., 2018), demyelination and axonal injury can occur at the onset of M. leprae infection, in the absence of immune cells (Rambukkana et al., 2002).
M. leprae actively modulates the SC metabolism to establish a safe intracellular niche for its survival (Ng et al., 2000; Rambukkana et al., 2002; Tapinos and Rambukkana, 2005; Ebenezer and Scollard, 2021). Several studies have shown that M. leprae subverts host metabolic pathways and cellular processes to ensure its survival and the establishment of the infection (Medeiros et al., 2016; de Macedo et al., 2020). Among the metabolic changes induced by M. leprae, the impact on the host’s lipid homeostasis is noteworthy. M. leprae increases the uptake of exogenous cholesterol in infected macrophages and SCs, leading to the accumulation of lipid droplets (LDs) (Mattos et al., 2011a; Mattos et al., 2011b; Mattos et al., 2014) Our group showed that cholesterol biosynthesis is higher in multibacillary leprosy skin biopsies than in paucibacillary lesions, and this phenotype is associated with higher levels of sterol regulatory element-binding protein (SREBP1/2) transcriptional factors—crucial regulators of genes involved in biosynthesis and uptake of cholesterol (Mattos et al., 2014). Furthermore, in vitro and in vivo studies show that statins and cholesterol synthesis inhibitors decrease intracellular bacterial viability (Mattos et al., 2014; Lobato et al., 2014). Another important regulator of lipid and glucose metabolism is the transcription factor peroxisome proliferator-activated receptor gamma (PPARγ), which is also upregulated both in macrophages and SCs infected by M. leprae (Mattos et al., 2012; Díaz Acosta et al., 2018).
The contribution of the purinergic system (PS) as a modulator of the peripheral glia functioning during both development and pathological conditions has been described and has provided targets for the treatment of various pathologies (Fredholm et al., 2011; Burnstock, 2017). The PS consists of ecto-nucleotidases, which regulate the extracellular levels of nucleotides and nucleosides such as adenosine triphosphate (eATP) and adenosine (eADO), the main mediators of this system that act on the purinergic receptors (Mello et al., 2014; Huang et al., 2021). ADO is an intracellular metabolite of purine metabolism; however, the extracellular levels can be increased under conditions such as infection, inflammation, and tissue damage (Antonioli et al., 2013; Morandi et al., 2018). In these circumstances, ATP is leaked out and sequentially metabolized to eADO by two ecto-nucleotidases: CD39 and an ecto-5′-nucleotidase (NT5E/CD73) (Antonioli et al., 2014; Giuliani et al., 2021). eADO can be further metabolized to extracellular inosine (eINO) by ecto-adenosine deaminase (ecto-ADA) (Cristalli et al., 2001). The activation of different biological effects by eADO occurs via the P1 receptors A1, A2A, A2B, and A3 (Sheth et al., 2014) coupled to G proteins, stimulatory (A2AR/A2BR) or inhibitory (A1R/A3R). A2AR stimulates the production of cyclic AMP (cAMP) (Borea et al., 2018; Huang et al., 2021) which, through protein kinase A (PKA) activation, modulates several downstream effectors such as the cAMP-responsive element binding protein (CREB), a transcriptional regulator of several target genes, among them, genes that encode cytokines and lipid metabolism proteins (Li et al., 2015; Giambelluca and Pouliot, 2017; Yoon et al., 2021). A2AR has a dual role in being associated with neuroinflammation (Ingwersen et al., 2016) and promyelinating phenotype (Welsh and Kucenas, 2018; De Nuccio et al., 2019). In addition, A2AR can modulate lipid metabolism by decreasing foam cell formation and by enhancing the cholesterol efflux via the upregulation of reverse cholesterol transporters (Bingham et al., 2010; Koupenova et al., 2012; Koupenova and Ravid, 2013). The involvement of this system has been extensively explored in the context of infectious diseases (Dubois-Colas et al., 2014; Petit-Jentreau et al., 2015; Basu et al., 2020; Pietrobon et al., 2022), although there are no studies in the context of leprosy.
In the present study, we show that M. leprae infection increases the expression and enzymatic activity of NT5E/CD73 and expression of ecto-ADA but it downregulates the expression and activity of A2AR in SCs. Interestingly, experimental A2AR activation reverses the accumulation of LDs induced by M. leprae by decreasing the expression of pro-lipogenic genes such as PPARγ and SREBF1 and increasing ABCA1, a gene that encodes reverse cholesterol transporter. Additionally, the activation of A2AR modulates the production of two inflammatory cytokines, IL-6 and IL-8, and decreases intracellular M. leprae viability. These observations provide the first evidence that AdoS components are relevant in the M. leprae-SCs interaction. They also increase our understanding of leprosy’s neuropathogenesis and may provide potential new targets for developing complementary therapeutic strategies for disease control.
Oil Red O (ORO/O0625), adenosine (ADO/A9251), adenosine 5′-(α,β-methylene) diphosphate (AMP-CP/M3763), adenosine 5′-monophosphate disodium salt (5′ AMP/01930), 8-[4-[((4-cyanophenyl)carbamoylmethyl)oxy]phenyl]-1,3-di (n-propyl)xanthine hydrate (MRS 1754/M6316), CGS21680 (ab120453), MRS1754 (264622-58-4), ZM 241385, Tris (hidroximetil)-aminometano (Tris-HCL/93363), NP-40 (492016), sodium deoxycholate (SDS/D6750) and [3-(4,5-dimethylthiazol-2-yl)-2,5-diphenyltetrazolium bromide] (MTT/M6494), TritonX-100 (HFH10), bovine serum albumin (BSA/Sigma A2153), trichloroacetic acid (TCA/ThermoFisher), and potassium phosphate (KH2PO4/P9791) were purchased from Sigma-Aldrich, USA. It was also purchased: cOmplete™ EDTA-free Protease Inhibitor Cocktail (04693132001) from Roche, United States; anti-ADA (sc-28346) and anti-GAPDH (sc-32233) from Santa-Cruz, USA; LIVE/DEAD™ Bac Light™ Bacterial Viability kit, Bicincichonic acid kit, 4′,6-Diamidino-2-fenilindol,2-(4-Amidinofenil)-6-indolecarbamidina (DAPI/D1306), Prolong Gold Antifade Mountant (36980), RPMI 1640 medium, (2-hydroxyethyl)-1-piperazineethanesulfonic acid (HEPES), L-Glutamine, MemCode™ Reversible Protein Stain Kit (24580), TRIzol®, SYBR Green® PCR master mix, and a DNA-free turbo kit from ThermoFisher Scientific, United States; fetal bovine serum (FBS 0010S/Cripion Biotecnology), anti-mouse CD73 (Ab-54217), anti-mouse Alexa Fluor®-488 (ab150117), and anti-rabbit Alexa Fluor®-594 (ab150080) from Abcam, United Kingdom; anti-rabbit A2A receptor (AAR002), anti-rabbit A2B (AAR-004), anti-rabbit A1 (AAR-006), and anti-rabbit A3 (AAR-004) from Alomone, anti-p-CREB (ab32096); anti-CREB (ab31387) from Abcam, United States; GoScript Master Mix from Promega.
The live M. leprae Thai-53 strain used throughout the study was isolated from the hind footpads of athymic nu/nu mice kindly provided by Dr. Patrícia Sammarco Rosa and Ms. Daniele Bertolucci of Instituto Lauro de Souza Lima, Bauru, SP, Brazil. Briefly, about 9 months after inoculation of the bacilli (with a bacillary load of about 109–1010/g of tissue), the mice were euthanized, and M. leprae was purified from their footpads (Trombone et al., 2014). Viability was checked by microscopy using LIVE/DEAD™ Bac Light™ Bacterial Viability Kit following the manufacturer’s guidelines, and the bacilli were quantified before in vitro experiments (Trombone et al., 2014). All procedures were conducted under the Laboratory Animals Welfare Act, CONCEA Guidelines, and Policies for Rodent experiments provided by Ministry of Science and Technology of Brazil and the Institutional Animal Care and Use Committee (Approval CEUA-ILSL 00).
Human Schwann cells (SCs) from the ST88-14 lineage were used in this study. This SC line was derived from patients with neurofibromatosis type 1 and was generously provided by Dr. Jonathan A. Fletcher from the Department of Pathology at Brigham and Women’s Hospital, Harvard Medical School, Boston, USA. ST88-14 cells were cultured in RPMI 1640 medium supplemented with 10% FBS, 10 mM HEPES, and 1 mM L-Glutamine, pH 7.4. Cultures were maintained at 37 °C with 5% CO2 in 150 cm2 flasks until they reached approximately 80% confluence.
SCs were suspended in RPMI 1640 culture medium in 2% FBS without antibiotics and seeded at a density of 5 × 10³ cell/well on 96-well plates for cell viability assays, 3 × 10⁵ cells/well on 6-well plates for RT-qPCR assays, and at 5 × 10⁴ cells/well on 24-well plates for enzymatic activity assays, fluorescence microscopy experiments, and Western blotting analysis. To investigate the desired outcomes, the cells were stimulated with different compounds 30 min prior to infection with live M. leprae. The compounds used were: 5′AMP (100 µM), a substrate of CD73 enzyme; AMP-CP (5 µM), a selective CD73 inhibitor; adenosine (100 µM) and CGS21680 (100 µM), non-selective and selective agonists of the A2AR, respectively; ZM132485 (1 µM) and MRS1754 (1 µM), non-selective and selective antagonists of A2AR and A2BR, respectively. Cells were subsequently infected with M. leprae at a multiplicity of infection (MOI) of 5:1 or 50:1 and incubated at 33 °C with 5% CO2. The biological responses were assessed at 12, 24, or 48 h post-infection according to the assay to be performed.
To evaluate drug toxicity in SCs in response to compounds used such as 5′AMP (100 µM), AMP-CP (5 µM), CGS21680 (100 µM), ZM132485 (1 µM), and MRS1754 (1 µM), the MTT assay was used. SCs were plated into 96-well plates (103 cells/well). After 48 h, MTT was added, and the formation of formazan was measured (Mosmann, 1983).
For immunofluorescence analysis, 4 × 10⁴ SCs were plated on glass coverslips in RPMI supplemented with 10% FBS and infected or not with live M. leprae (MOI 5:1) for 24 or 48 h. The cells then were fixed with 4% paraformaldehyde (PFA). They were subsequently incubated with a permeabilization solution composed of phosphate buffer saline (PBS) 1X, 10% FBS, and 0.001% Triton X-100 and were incubated with blocking solution containing 1% BSA diluted in PBS 1X with 0,001% Triton. The expression of CD73, ADA, and A2AR was evaluated using mouse monoclonal anti-CD73, rabbit polyclonal anti-ADA, and rabbit polyclonal anti-A2AR, all at a dilution of 1:250 and incubated overnight at 4 °C. The slides were washed thrice with PBS and incubated with Alexa Fluor® conjugated secondary antibodies (anti-mouse-Alexa Fluor®-488 or anti-rabbit-Alexa Fluor®-594) for 1 h at a dilution of 1:1000. Nuclear staining was done using DAPI labeling (1:100). Coverslips were mounted using prolong gold antifade mounting. Images were captured with a Zeiss Axio Observer inverted microscope using the Colibri illuminating system with Plan-Neofluar ×40 objectives (Zeiss, Oberkochen, Germany) equipped with AxioVision Rel. 4.8 software (Zeiss, Oberkochen, Germany). Quantification was performed using ImageJ software (Schneider et al., 2012) measuring the fluorescence area per cell number in each image.
To investigate LDs accumulation, SCs were plated in RPMI supplemented with 2% FBS. The cells were treated with ADO, CGS21680, ZM132485, or MRS1754 as described for the SC infection assays and infected or not with M. leprae (MOI 5:1) for 48 h. Cells were stained with Oil Red O (ORO) (Díaz Acosta et al., 2018). The coverslips were washed with distilled water, and the cells’ nuclei were labeled with DAPI. Coverslips were mounted using prolong gold antifade mounting. The images were observed under an Axio Observer Z1 fluorescence microscope equipped with the AxioVision Rel. 4.8 software. The images were made with a 40 × objective lens and at least ten fields per slide; a total of 200 cells per condition were photographed. The quantification of LDs was performed using ImageJ software, with the Macro Umbral plugin as previously described Díaz Acosta et al. (2018). Macro Umbral calculated the lipid droplet area which was divided by the number of cells present in the analyzed field to determine the LD quantification (LD area/cell). Graphs demonstrate the mean value of LD/cell per condition.
CD73 activity was measured by colorimetric method with malachite green by the rate of released inorganic phosphate (Pi) (Zanin et al., 2012; Allard et al., 2019). Specifically, 5 × 10⁴ SCs were plated on 24-well plates and infected or not with M. leprae (MOI 5:1 or 50:1) for 24 h at 33 °C with 5% CO2, in the presence or not of the CD73 inhibitor AMPCP (5 µM). The supernatant was discarded, and the wells were thrice washed with reaction medium (phosphate free). The reaction was started by the addition of 500 µL of reaction medium containing 2 mM of CaCl2, 120 mM NaCl, 5mM KCl, 10 mM glucose, 20 mM Hepes, pH 7.4 pH, and 5 mM 5′AMP, and they were incubated for 1 h at 25 °C. The cell incubation medium (500 μL) was removed and centrifuged at 5,000 × g for 5 min. The supernatant was transferred to a tube containing 500 µL of 5% (w/v) trichloroacetic acid (TCA) on ice. Inorganic phosphate (Pi) production was measured by absorbance of the phosphomolybdate-malachite at 630 nm. The standard curve of Pi was made with a solution of KH2PO4, and CD73 activity was calculated by subtracting the nonspecific 5′-AMP hydrolysis measured in the absence of cells. The concentration of Pi released in the reaction was determined by comparison with a standard curve. All samples were taken in biological triplicates, and the CD73 activity was expressed as pmol Pi × min-1× 10⁻⁴ cells (Zanin et al., 2012; Allard et al., 2019).
To evaluate protein expression, SCs were plated as described for the SC infection assays, treated or not with CGS21680 and infected or not with M. leprae (MOI 50:1) for 48 h. The cells were lysed using a RIPA buffer (50 mM TRIS pH 7.5, 1% NP-40, 0.25% sodium deoxycholate, 0.1% SDS) supplemented with protease inhibitors. Protein concentrations were determined using the BCA Kit. For SDS-PAGE electrophoresis, 20 µg of protein was loaded onto a 12% polyacrylamide gel, and the efficiency of the transfer was confirmed by staining the nitrocellulose membrane with MemCode™ Reversible Protein Stain Kit. The primary antibodies used were anti-A2AR, (dilution 1:500) and anti-p-CREB (1:500 dilution). Anti-GAPDH (dilution 1:1000) was used as the loading control. Primary antibodies were incubated overnight at 4 °C. After three sequential washes with TBS-Tween and TBS 5 min each, the HRP-conjugated secondary antibodies were incubated 1 h. Chemiluminescence detection was performed using the iBright™ CL1500 Imaging System (A44114), and the relative protein levels were determined using ImageJ software.
SCs were infected with M. leprae (MOI 5:1) overnight at 33 °C in the presence or absence of CGS21680 (100 µM); the mRNA was isolated using TRIzol® according to the manufacturer’s instructions. Briefly, the nucleic acid content was separated, followed by precipitation of RNA and subsequent production of cDNA. To assess the integrity of the RNA samples, a 1.2% agarose gel electrophoresis technique was employed. Samples showing two corresponding distinct bands without any signs of degradation were considered suited for subsequent analysis. The RT-qPCR was performed to analyze differential gene expression. The sequences of primers are available in Supplementary Table S1. Reverse transcription was performed using GoScript Master Mix. The RT-qPCR reactions were performed in duplicates on a ViiA7 Real-Time PCR System (Applied Biosystems, USA) using Power SYBR Green Master Mix. For this, the cDNA samples were diluted to a concentration of 5 ng/μL, and PCR mix was prepared for application in a 384-well plate. The relative gene expression analysis was performed using adjusted efficiency. Briefly, raw data were exported from ViiA7 software and imported into LinRegPCR v.2022 (Ramakers et al., 2003). Data analysis was carried out using the comparative method ΔΔCT (Livak and Schmittgen, 2001) after normalization with the endogenous housekeeping gene RPL13. Normalized expression values were presented as Fold Change (FC). To take into account differences between biological replicates of NI samples, the mean of all biological replicates was determined along with the ratio between each biological replicate and this mean. Therefore, the NI condition is represented as a mean ± SD.
M. leprae viability was investigated by RT-qPCR as described by Martinez et al. (2009). Briefly, SCs pre-treated or not with CGS21680 (100 µM) were infected with M. leprae for 48 h. RNA was extracted as described in Section 2.10, and DNA was extracted as described in Ramakers et al. (2003). DNA was removed from the RNA samples using DNA-free turbo kit, and the RNA reverse transcription was performed using GoScript Master Mix according to the manufacturer’s instructions. The levels of 16S rRNA were calculated against 16S DNA. LinRegPCR software was used to calculate the PCR efficiency for each biological experiment (Martinez et al., 2009), and the normalization was made considering the efficiency corrections. The primers for the rRNA 16S were used for both cDNA and DNA: sense 5′-GAA ACT GCG AAT GGC TCA TTA AAT CA-3’ and antisense 5’- CCC GTC GGC ATG TAT TAG CTC T-3’. Both cDNA and DNA were measured by TaqMan real-time PCR assay (TaqMan probe 16S 5’-TGG TTC CTT TGG TCG CTC GCT CC-3’). M. leprae viability was determined by the comparative Ct method described by Martinez et al. (2009), and viability was calculated as described by Díaz Acosta et al. (2018). Cycling and plate reading were conducted using the Viia7 machine with Real-Time PCR System software.
SCs cultures were infected by M. leprae (MOI 5:1), and the supernatants were collected after 48 h infection for ELISA analysis. The levels of interleukin 6 and 8 (IL-6 and IL-8) were assessed using ELISA with respective Duo-Set human ELISA kits (R&D Systems) following the manufacturer’s guidelines. Optical densities were measured by an Absorbance microplate reader (EON BioTek Instruments), and the data were analyzed using SoftMax R Pro Software version 5.3 (ThermoFisher).
The protein interactome network was generated used STRING (https://string-db.og) version 12.0. The search was done by multiple proteins using Homo sapiens databank. A full STRING network was selected as the network type, with a required score of medium confidence (0.400), and medium false discovery ratio (FDR) stringency corresponding to 5%. Markov clustering (MCL) was applied—a clustering algorithm for graphs that assigns proteins into families based on sequence similarity information with 3.0 of inflation parameters.
Data statistical analysis was conducted using Graph Prism software version 9.0.0, and statistical significance was determined by a two-tailed unpaired t-test for single comparisons or one-way ANOVA tests for multiple comparisons, followed by Bonferroni corrections. The statistical differences between the groups were inferred to be significant when *p < 0.05, **p < 0.01, and ***p < 0.001.
Extracellular ADO (eADO) signaling is regulated through different mechanisms, including CD73 and ecto-ADA, that convert extracellular 5′AMP to eADO and eINO, respectively (Huang et al., 2021). To investigate the impact of M. leprae infection on AdoS, 5′ AMP hydrolysis, the levels of Pi were measured via colorimetric assay (Zanin et al., 2012; Allard et al., 2019). Initially three multiplicity-of-infection (MOI) ratios (5:1, 10:1, and 50:1) were assayed. The results revealed a significant increase in extracellular 5′AMP hydrolysis in infected SCs (Figure 1A) regardless of MOI. M. leprae-infected SCs were 52.21 ± 8.553 pmol Pi × min-1×10⁻⁴cells (MOI 5:1/p = 0.0004), 49.09 ± 25.27 pmol Pi × min-1×10⁻⁴cells (MOI 10:1/p = 0.0422), and 60.02 ± 23.27 pmol Pi × min-1×10⁻⁴cells (MOI 50:1/p = 0.0004) —about three to four times more than the not infected (NI) SCs (Figure 1A). Since no statistical difference was observed in the extracellular hydrolysis of 5′AMP between the different MOIs, the ratio 5:1 was adopted in the remaining experiments. To confirm that hydrolysis of extracellular 5′ AMP resulted from CD73 activity, a non-hydrolysable 5′AMP analogue, adenosine-5'-(α, β-methylene) diphosphate (AMP-CP) —a selective CD73 inhibitor—was used. When applied to the infected cells, it reduced Pi production by 46.8% (p = 0.019) (Figure 1B). AMP-CP’s cytotoxicity was evaluated by MTT assay and did not affect the viability of SCs (data not shown). In addition to CD73 activity, we also analyzed the impact of M. leprae infection on NT5E gene expression which encodes CD73, and we observed a 1.18 log2 fold change compared to the NI condition (FC = 1.000 ± 0.3681 and M. leprae FC = 1.532 ± 0.3677) (p = 0.0074) (Figure 1C). Immunofluorescence showed diffuse immunostaining of CD73 on M. leprae-infected cells (MIF = 821.3 ± 250.9) with a 1.470-fold change compared to the NI condition (MIF = 555.8 ± 478.7) (p = 0.0170) (Figures 1D, E).
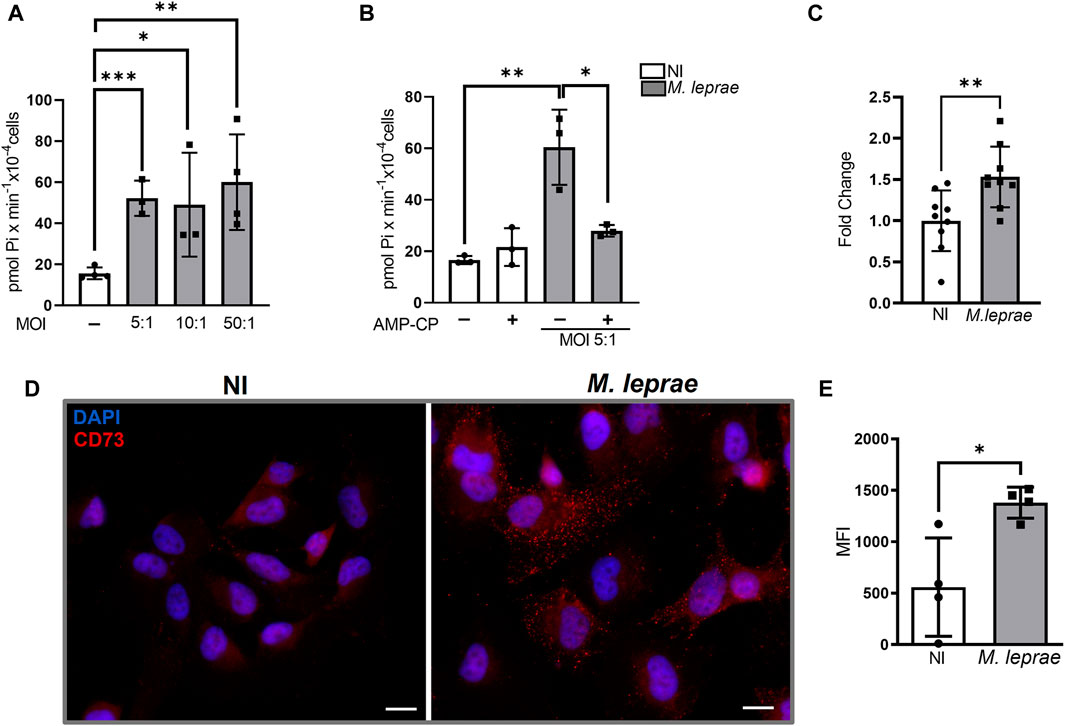
Figure 1. Ecto-5′ nucleotidase-CD73 is upregulated in Schwann cells infected with Mycobacterium leprae. (A,B) 5 × 10⁴ SCs were infected with M. leprae for 24 h. 5′AMP (5 mM) was added and incubated for 1 h at 25°C. Ecto-5′nucleotidase activity was measured through Pi release using a malachite green colorimetric assay and expressed as pmol Pi x min-1x 10⁻⁴ cells. (A) M. leprae increased the 5′AMP hydrolysis at different MOIs (5:1, 10:1, and 50:1). (B) AMP-CP (5 µM), a specific CD73 inhibitor, reversed the effect of M. leprae (MOI 5:1) on the 5′AMP hydrolysis in infected SCs. (C) M. leprae-infected SCs, 16 h post-infection, increased expression of NT5E mRNA, normalized by RPL13, measured by RT-qPCR. (D,E) Immunofluorescence assay showing increased expression of CD73 enzyme in SCs 24 h post-infection. SCs infected with M. leprae (MOI 5:1) were treated with anti-CD73 antibodies (red). DAPI used for nuclear staining (blue). Scale bar: 20 µm. (E) Mean fluorescence intensity (MFI) quantified using ImageJ software. NI = not infected. All data mean ± SD. Statistical significance determined using parametric Student’s t-test: *p < 0.05, **p < 0.01, and ***p < 0.001.
We also analyzed the impact of M. leprae infection on ADA gene expression. Figure 2A shows that infected SCs exhibited an increase of 20.9% in ADA gene expression (FC 1.714 ± 0.5254) in comparison to NI SCs (FC = 1.140 ± 0.3081) (p = 0.0436). ADA protein was analyzed by immunofluorescence 24 and 48 h post-infection (Figures 2B–F). No statistical difference at 24 h infection was found due to the variability between biological replicates. However, the estimation plot (Figure 2D) revealed that all M. leprae-infected biological replicates exhibited higher ADA levels than NI SCs (Figures 2B–D). At 48 h post cellular infection, ADA levels increased with a fold change of 3.37 (MIF = 1001 ± 381.1) compared to the NI condition (MIF = 296.3 ± 206.1) (p = 0.0480) (Figures 2E–G). Taken together, these data indicate that M. leprae infection upregulates both CD73 and ADA, responsible for metabolizing extracellular eAMP to eINO, potentially contributing to the reduction of eADO levels in infected SCs (Supplementary Tables S2–S4 compiles the data presented in this section).
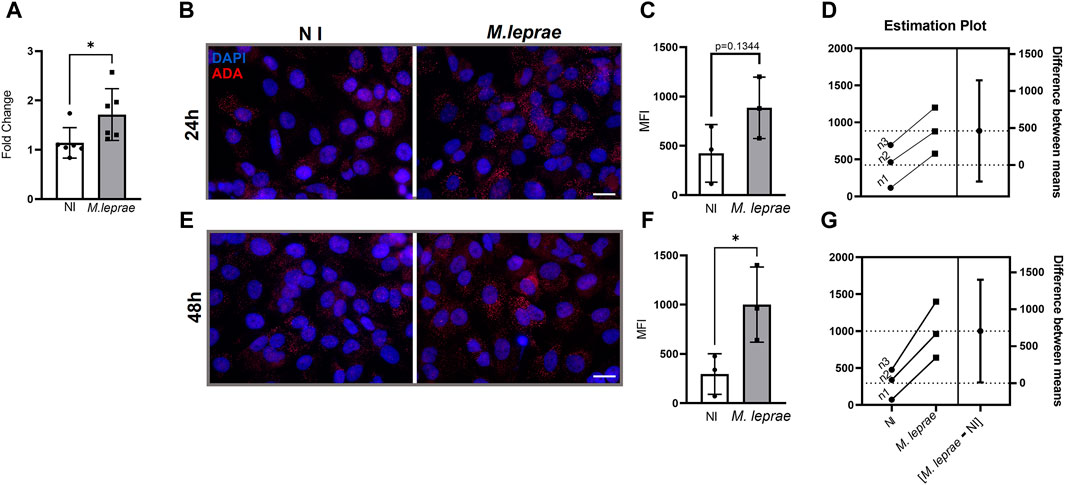
Figure 2. Mycobacterium leprae induces expression of the enzyme adenosine deaminase (ADA) in Schwann cells. (A–C) SCs were infected with M. leprae at a MOI of 5:1. (A) M. leprae increased ADA mRNA expression levels in SCs after 16 h of infection. For this, 3 × 10⁵ SCs were infected, and gene expression was assessed via RT-qPCR. The RPL13 gene was used as the endogenous control gene. (B–G) Immunofluorescence analysis and quantification of ADA expression. 4 × 10⁴ SCs infected with M. leprae for 24 h (B–D) or 48 h (E–G) were stained with antibody against ADA (red) and DAPI as nuclear stain (blue). Scale bar: 20 µm. (C,F) Mean fluorescence intensity (MFI) was quantified using ImageJ software. (D,G) Estimation plot showing that M. leprae induced ADA expression in SCs 24 h and 48 h post-infection in the three biological replicates; however, in (C) the statistical difference was not reached. (E) M. leprae significantly increased the expression of the ADA enzyme in SCs 48 h post-infection. NI = not infected. All data mean ± SD. Statistical significance determined using parametric Student’s t-test: *p < 0.05.
Extracellular ADO activates a family of P1 receptors, such as A1R, A2AR, A2BR, and A3R, which have different affinity to eADO (Patritti-Cram et al., 2021). To understand the role of eADO during M. leprae infection, we compared the expression profile of these receptors in infected versus NI SCs. The experimental data showed that the ST88-14 SC lineage expresses the genes ADORA1, ADORA2A, and ADORA2B. However, there was no significant modulation of the genes ADORA1 and ADORA2B with M. leprae infection (Figures 3A, C). In contrast, ADORA2A gene expression was downregulated (Figure 3B). The difference between the means of NI versus M. leprae-infected SC was −0.3448 ± 0.1464, which represents a reduction of 34.5% (p = 0.0336) in ADORA2A gene expression in M. leprae-infected SCs (Figure 3C) (Supplementary Table S3). The gene ADORA3 was not detected in this cell line; to confirm this data, we used two primer pairs indicated in Supplementary Table S1. To confirm that M. leprae infection reduces A2AR levels, immunofluorescence was performed 24 and 48 h post-infection. Consistent with the PCR assay, infection decreased cellular A2AR by 55.19% (p = 0.0056) and 77.32% (p = 0.0098) at 24 and 48 h, respectively (Figures 4A–D). Western blotting analysis confirmed the downregulation by 63.98% of A2AR expression 48 h post-infection in SCs, corroborating the PCR and immunofluorescence results (Figures 4E, F).
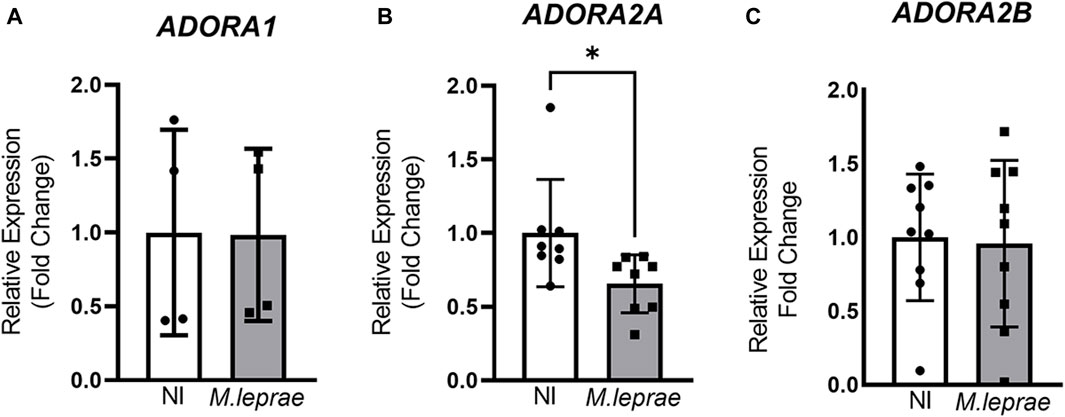
Figure 3. Downregulation of ADORA2A gene expression in M. leprae-infected Schwann cells; 3 × 10⁵ SCs were infected with M. leprae at MOI 5:1, and the expression of the genes (A) ADORA1, (B) ADORA2A, and (C) ADORA2B was assessed via RT-qPCR after 16 h of infection. RPL13 was used as endogenous control gene. All data are mean ± SD. Statistical significance determined using parametric Student’s t-test: *p < 0.05.
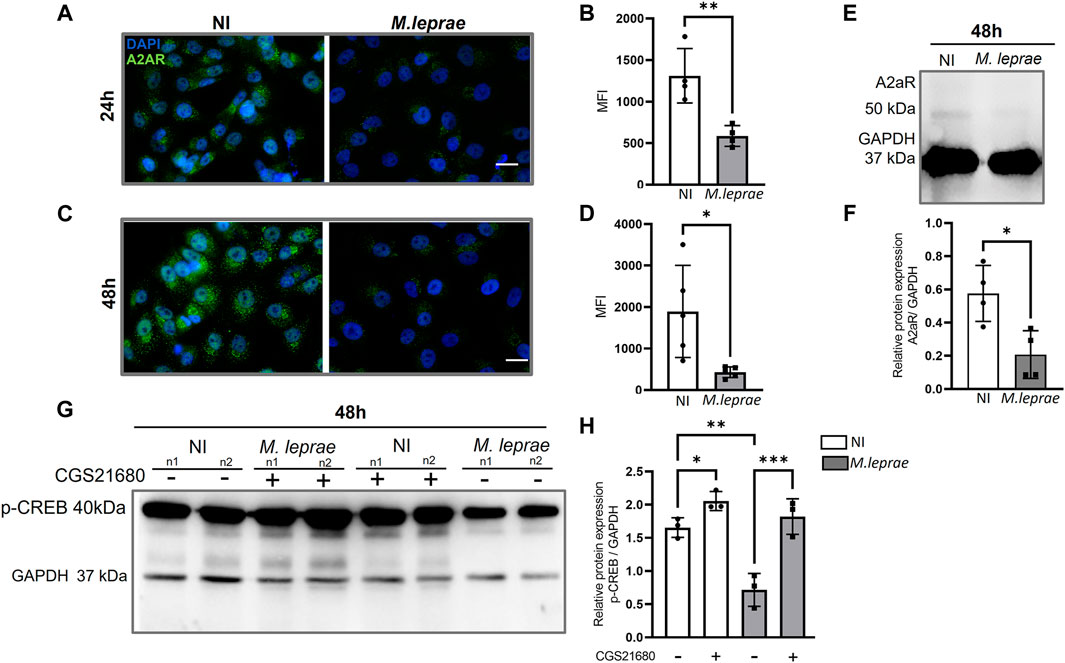
Figure 4. A2A receptor downregulated in Mycobacterium leprae-infected Schwann cells. (A,C) 4 × 10⁴ SCs infected with M. leprae (MOI 5:1) for 24 and 48 h respectively. Significant reduction in the expression of the A2A was observed. Protein expression of A2AR (green) visualized using immunofluorescence. DAPI nuclear staining in blue. Scale bar: 20 μm. (B,D) Mean fluorescence intensity (MFI) quantified using ImageJ software. (E) 1.5 × 10⁵ SCs infected with M. leprae (MOI 5:1) for 48 h, A2AR protein expression analyzed by Western blot. (F) Relative densitometry values for A2AR expression. (G) SCs infected with M. leprae (MOI 5:1) for 48 h, p-CREB protein expression analyzed by Western blot and the A2AR specific agonist, CGS21680 (100 μM) was used to evaluate the impact of A2AR activation on p-CREB expression. (H) Densitometry values of p-CREB protein expression normalized using endogenous GAPDH. NI = not infected. All data mean ± SD. Statistical significance was determined using parametric Student’s t-test: *p < 0.05 and **p < 0.01.
When activated A2AR triggers cAMP-PKA-CREB signaling, it results in the phosphorylation of CREB (p-CREB). To investigate whether A2AR could be active despite its downregulation by M. leprae infection, we used a specific A2AR agonist, CGS21680, to elevate the level of p-CREB. Figures 4G and H show the results of two biological replicates 48 h post-infection; the expression of p-CREB decreased by 56.77% compared to NI (p = 0.048) (Supplementary Table S5). Nevertheless, when it was preincubated with CGS21680, that effect was reversed to the level of the NI condition.
A2AR can influence cellular cholesterol homeostasis, decreasing LD formation and exhibiting an antiatherosclerosis role (Reiss et al., 2004; Bingham et al., 2010). We thus investigated the possibility that decreased A2AR expression induced by M. leprae infection was related to the foamy phenotype observed in infected cells. In this context, the impact of A2AR on the capacity of M. leprae to induce LD formation in SCs was measured. A2AR was activated with eADO, and LD formation was measured 48 h post-infection. As expected, M. leprae increased LD accumulation with a 3.96-fold change (p = 0.0153) versus NI SCs. However, when the SCs were treated with eADO, M. leprae-induced LD accumulation was significantly inhibited by 73.9% (p = 0.0257) (Figures 5A, B). To certify that eADO was activating A2AR, a synthetic A2AR agonist, CGS21680, was used instead, and this inhibited M. leprae-induced LD accumulation at a similar level as eADO (61.40%, p = 0.0428). In contrast, a synthetic A2AR antagonist, ZM241385, increased the levels of LDs induced by M. leprae infection by 78.62% (p = 0.0044) compared with M. leprae infected and untreated SC cultures. Furthermore, ZM241385 reversed the inhibitory effect of CGS21680 in M. leprae-infected cells, (Figures 6A, B). Considering that the EC50 of the compound CGS21680, determined in different studies, is in the nM range (Kull et al., 2000; Gao et al., 2020), we also evaluated the effect of CGS21680 at 50 nM on LDs accumulation induced by M. leprae. The result showed that 50 nM CGS21680 continues to inhibit the formation of LDs induced by M. leprae in infected SC and that ZM241385 also reversed this phenotype (Supplementary Figures S1A, B). To rule out a possible interference caused by a high concentration of CGS21680 on the A2B receptor, we analyzed the effects of a specific A2BR antagonist, MRS1754, on LD formation induced by M. leprae. However, we firstly checked the expression of A2BR in M. leprae-infected SCs and confirmed that infection does not change A2BR expression (Supplementary Figures S2A, B). Nonetheless, despite A2BR not having its expression modulated by infection, RT-qPCR and immunofluorescence analysis revealed that this receptor is much more abundant in SCs infected by M. leprae than A2AR, (Figures 3B, C, 4C, D; Supplementary Figures S3A, B). Despite its abundance, we found that MRS1754, unlike ZM241385, did not increase LD formation and was unable to reverse the inhibitory effect of CGS21680 on LD accumulation in M. leprae-infected SCs (Supplementary Figures S2A, B). Overall, this analysis provides valuable insights into the participation of A2AR as a negative modulator of LD formation in M. leprae-infected SCs (Supplementary Table S6 compiles the data presented in this section).
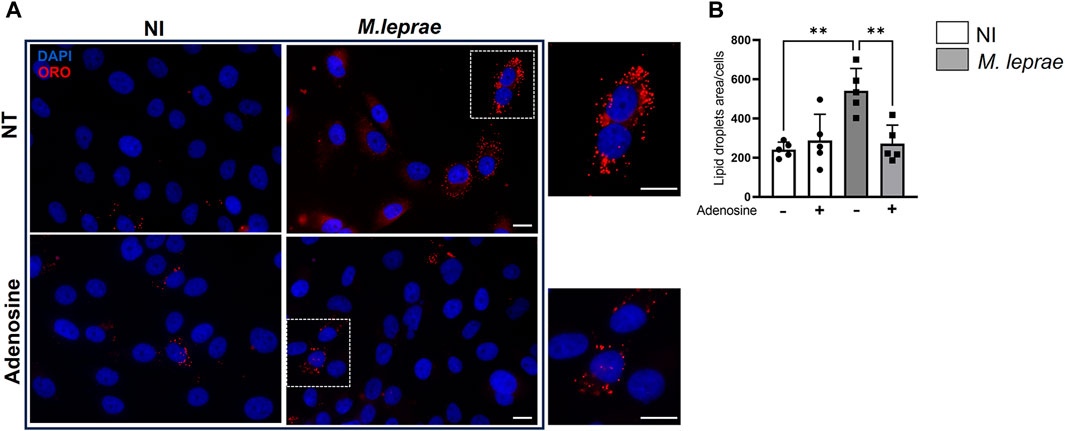
Figure 5. Adenosine decreases Mycobacterium leprae-induced lipid droplets accumulation in Schwann cells. 4 × 10⁴ SCs were infected with M. leprae (MOI 5:1) for 48 h and LDs were visualized by fluorescence microscopy using Oil Red O (ORO) staining. The quantification of ORO-stained LDs was plotted as measurement of LD area/cell. A total of 200 cells for each condition were analyzed. (A) Pretreatment with 100 µM adenosine reduced LD formation induced by M. leprae. Scale bar 20 μm (white line). (B) LDs quantification by ImageJ software. NT = not treated. Data are shown as mean ± SD of at least three different experiments performed in triplicate. Statistics used the not infected (NI) condition as reference. Data evaluated via parametric Student’s t-test, *p < 0.05, *p < 0.01.
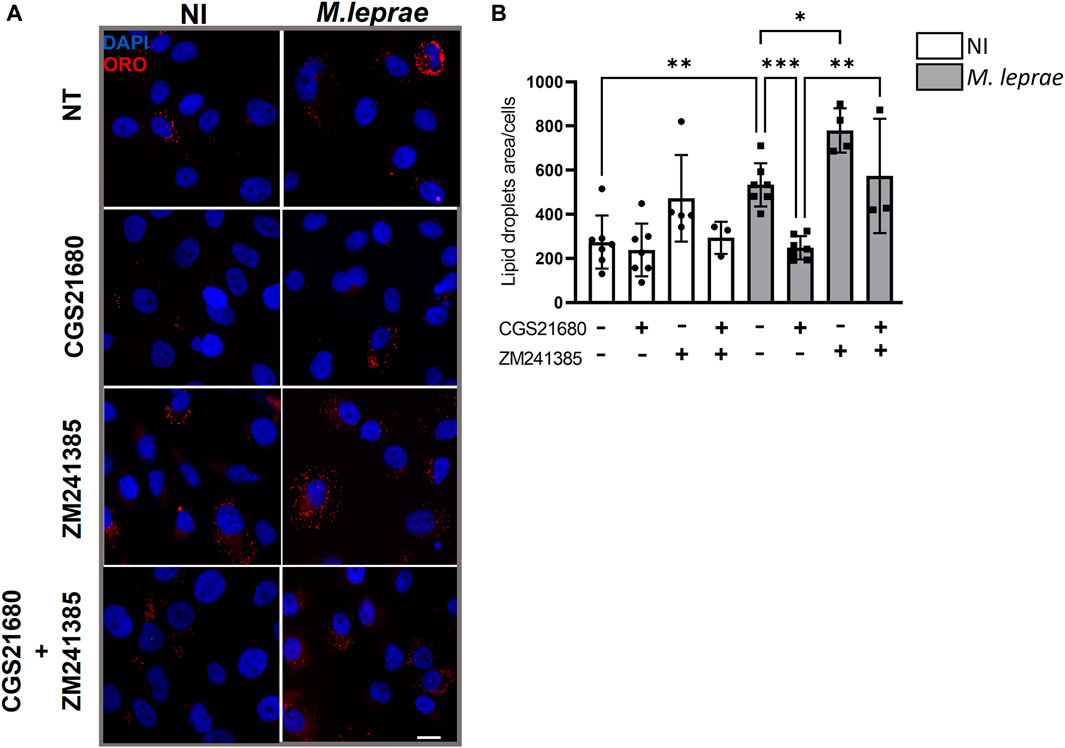
Figure 6. A2A receptor negatively modulates lipid droplet formation in Mycobacterium leprae-infected Schwann cells. 4 × 10⁴ SCs were infected with M. leprae (MOI 5:1) for 48 h, and LDs were visualized by fluorescence microscopy using ORO staining. The quantification of ORO-stained LDs was plotted as measurement of LD area/cell for a total of 200 cells for each condition. (A) Pretreatment with CGS21680 (100 µM) reduced LD formation induced by M. leprae. The use of the specific A2AR antagonist ZM241385 (1 µM), per se, increased the formation of LDs and reversed the effect of CGS21680 in inhibiting M. leprae-induced LD. Scale bar 20 μm (white line). (B) LDs quantification by ImageJ software. NI = not infected. NT = not treated. Data shown as mean ± SD of at least three different experiments performed in triplicate. Statistical differences evaluated via one-way ANOVA with Bonferroni’s multiple comparisons test, *p < 0.05, *p < 0.01.
Our research investigated the crucial role of the A2AR receptor in the molecular mechanisms of M. leprae infection. This receptor, when activated, reverses the formation of LDs induced by M. leprae in infected SCs. To explore this, we focused on lipid metabolism genes upregulated by M. leprae infection and genes involved in cholesterol efflux upregulated by A2AR. Before solidifying our hypothesis, we constructed an interaction network using STRING to assess the interconnection between these genes. We included the cytokines IL-6 and IL-8, modulated by M. leprae infection and also involved in lipid homeostasis (Supplementary Figures S4A–C).
The A2AR receptor, as we anticipated, interacts with CD73 and ADA enzymes, both of which also interact with IL-6. This cytokine, in turn, interconnects with several targets of lipid metabolism, illustrating the intricate web of molecular interactions. We also highlight the direct connection between A2AR and CREB1, which interacts with transcription factors that modulate lipid metabolism, PPARγ, SREBF1, and SREBF2. Furthermore, CREB1 interacts with the cytokines IL-6 and IL-8, which interact with IL-6, PPARγ, and CD36, a gene regulated by PPARγ (Supplementary Figure S4A). Our network’s green and red nodes represent clustered proteins, each with their cellular processes, as shown in color and indicated in Supplementary Figures S4B, C. The green nodes highlight the processes involved in the negative regulation of the inflammatory response and the metabolic process of adenosine, further emphasizing the complexity of the molecular mechanisms at play. The cellular processes selected to red nodes accentuate the regulation of lipid localization and cholesterol storage, lipid metabolic processes, and the cell-surface receptor signaling pathway. Additional information is compiled in Supplementary Table S7.
This interaction network analysis has shed light on potential molecular mechanisms up- or downregulated by A2AR that could contribute to decreasing LD accumulation. Importantly, our hypothesis was not just a theoretical construct but was confirmed by rigorous RT-qPCR analysis, adding a layer of confidence to our findings.
Our data showed that M. leprae infection upregulated the expression of pro-lipogenic genes, confirming previous results (Mattos et al., 2011a; Mattos et al., 2011b; Mattos et al., 2012; Mattos et al., 2014), while the activation of A2AR with CGS21680 reversed this effect (Figure 7). The genes selected for analysis were PLIN3, an LD marker; PPARγ (peroxisome proliferator-activated receptor gamma), a transcription factor that regulates both adipogenic and lipogenic genes; CD36, a cholesterol scavenger receptor, also upregulated by M. leprae infection (Figures 7A–C). Moreover, SREBF1, which encodes the sterol regulatory-element binding proteins 1, a transcription factor that regulates genes of de novo fatty acid synthesis, was also downregulated by CGS21680 (Figure 7D). We did not observe any modulation on the SREBF2 (Figure 7E); however, HMGCR, which encodes 3-hydroxy-3-methylglutaryl CoA reductase, a rate-limiting step in the cholesterol biosynthesis pathway, was also downregulated by CGS21680 (Figure 7F). As well as pro-lipogenic genes, we analyzed the ABCA1 gene, which is regulated by LXR (liver X receptor) and encodes the ATP-binding cassette protein involved in the elimination of excess cholesterol from the cells. The CYP27A1 gene, which encodes a sterol 27-hydroxylase that catalyzes the formation of 27-hydroxycholesterol—an oxysterol activator of LXR—was also investigated. The results presented in Figures 7G and H show that M. leprae increased the expression of ABCA1 and CYP27A1 in infected SCs and that CGS21680 induced a significant increase in the expression of the ABCA1 gene. Regarding CYP27A1, we did not observe any modification when comparing M. leprae to M. leprae + CGS21680. Supplementary Table S9 summarizes the statistical data and the fold change effects of CGS21680. These findings propose a potential molecular mechanism by which the activation of A2AR can reverse the LD accumulation induced by M. leprae infection.
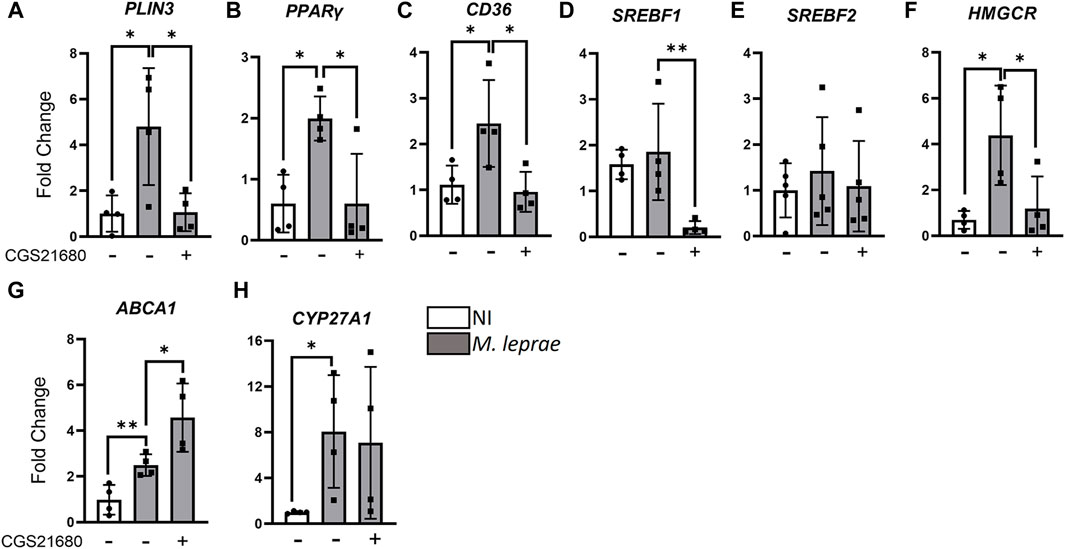
Figure 7. Activation of A2AR downregulates expression of pro-lipogenic genes and upregulates genes involved in the cholesterol efflux in Mycobacterium leprae-infected Schwann cells. 3 × 10⁵ SCs were infected with M. leprae (MOI 5:1) and pre-treated or not with CGS21680 (100 µM). Gene expression was assessed via RT-qPCR after 48 h of infection. The RPL13 gene was used as the endogenous control. NI = not infected. Data shown as mean ± SD of at least three different experiments performed in triplicate. Statistical significance determined using parametric Student’s t-test: *p < 0.05. Differences assessed by comparing NI vs M. leprae and M. leprae vs M. leprae + CGS21680 groups. Target genes: (A) PLIN3; (B) PPARy; (C) CD36; (D) SREBPF1; (E) SREPBF2; (F) HMGCR; (G) ABCA1; (H) CYP27A1.
P1 receptors have been associated both with a pro-inflammatory response (Csóka et al., 2007) and pro-resolving and anti-inflammatory effects (Alam et al., 2009). IL-8 is a cytokine that is positively modulated by M. leprae infection, both in macrophages (Mattos et al., 2009) and Schwann cells (Souza et al., 2022), while IL-6 is downregulated in M. leprae-infected macrophages (Polycarpou et al., 2016). The literature has shown that A2AR regulates the production of both IL-6 and IL-8 in different study models (Köröskényi et al., 2016; Colombini et al., 2020). We wondered whether A2AR could affect the production of these cytokines modulated by M. leprae infection. Thus, SCs were infected with M. leprae and treated with CGS21680. The results revealed that M. leprae slightly decreased, with statistically significance, the extracellular levels of IL-6 and increased the production of IL-8—the latter already described in the literature (Díaz Acosta et al., 2018)—compared with the NI SCs (Figures 8A, B). Interestingly, the addition of CGS21680 increased the extracellular levels of IL-6 but inhibited the levels of IL-8 both in NI and M. leprae-infected SCs (Figures 8A, B) suggesting that the downregulation of A2AR in infected SCs contributes to the maintenance of the extracellular levels of both IL-6 and IL-8 produced by M. leprae-infected SCs. These statistical data are summarized in Supplementary Table S7. Finally, we assessed through RT-qPCR whether the activation of A2AR could impact M. leprae intracellular viability. We observed that the addition of CGS21680 significantly reduced M. leprae viability in comparison with untreated SCs (Figure 8C). Overall, the observed data suggests that M. leprae, by downmodulating the expression of A2AR, leads to decreased downstream signaling from this receptor, which contributes to the maintenance of the LD accumulation and intracellular viability of the bacilli. These results are schematically summarized in Figure 9.
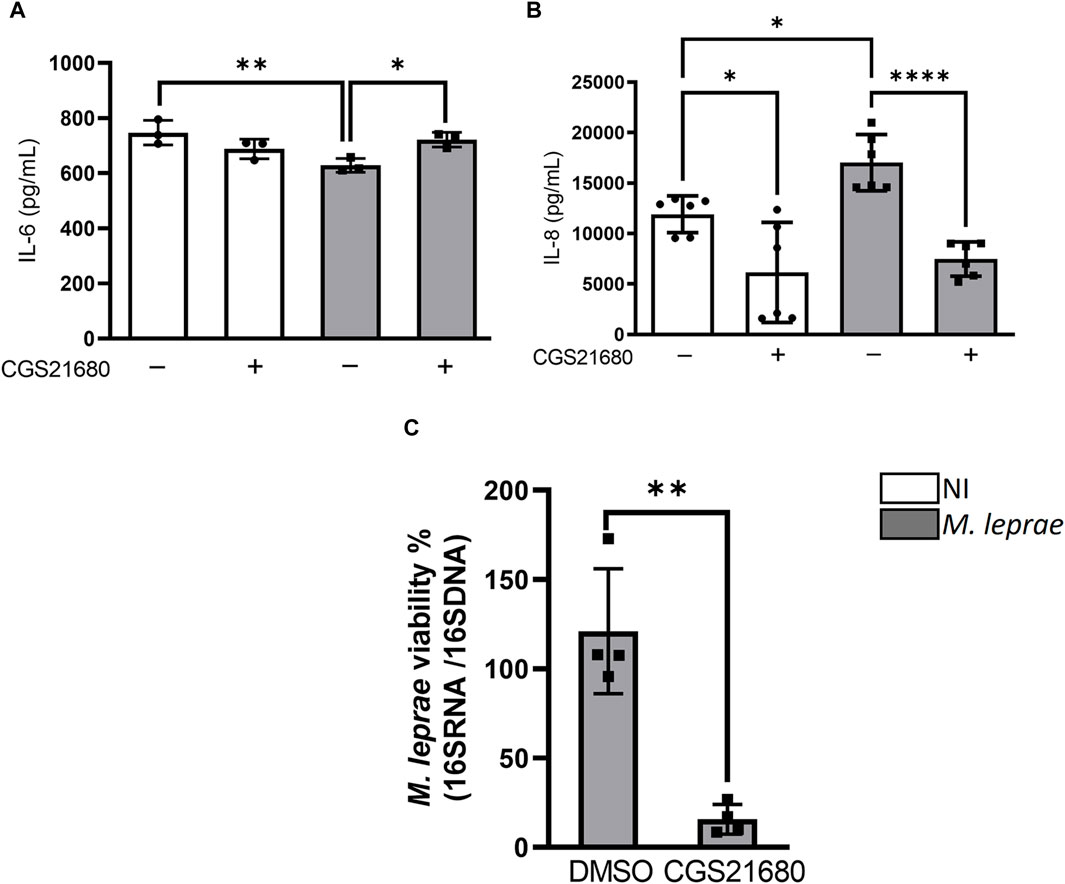
Figure 8. A2AR agonist treatment reverses production of IL-6 and IL-8 cytokines and decreases intracellular Mycobacterium leprae viability. (A,B) 4 × 10⁴ SCs treated (gray) or not (white) with A2A agonists CGS2168 (100 µM) and infected with M. leprae (MOI 5:1) for 48 h. Supernatant collected and cytokines (A) IL-6 and (B) IL-8 were quantified by ELISA. Statistical differences evaluated via one-way ANOVA with Bonferroni’s multiple comparisons test (C). M. leprae viability measured by RT-qPCR using ratio of 16S cDNA/16S DNA 48 h after infection of SCs pre-treated or not with 100 μM CGS21680. Differences between groups assessed using parametric Student’s t-test. *p < 0.05, **p < 0.01 and ****p < 0.0001.
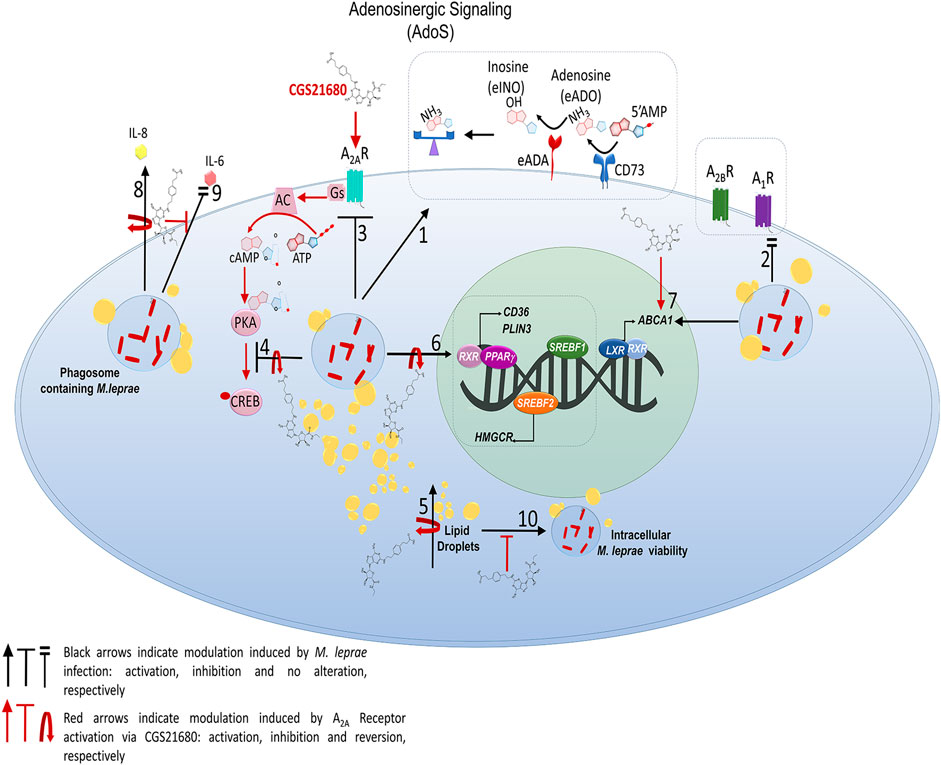
Figure 9. Schematic representation of impact of A2AR signaling on lipid metabolism in Mycobacterium leprae-infected Schwann cells 1. M. leprae increases the expression and activity of the enzyme CD73 and increases the expression of ADA, that regulation potentially decreasing the e-ADO level in the extracellular environment; 2. M. leprae does not affect expression of A2B and A1 receptors; however, 3. M. leprae infection inhibits expression of A2AR and, 4. decreases phosphorylation of transcription factor CREB whose effect is reversed with CGS21680, the agonist of A2AR, 5. CGS21680 reverses LDs accumulation induced by M. leprae due: 6. downregulation of the expression of lipogenic genes such as CD36, PLIN3, PPARy, SREBF1 and HMGCR, already known to be upregulated during M. leprae infection (Mattos et al., 2014). 7–8. A2AR when activated by CGS21680 upregulates gene ABCA1 involved in cholesterol efflux. 9. CGS21680 inhibits IL-8 cytokine production induced by M. leprae, and 10. reduces the extracellular levels of IL-6 which were maintained at the level of control by M. leprae infection. Finally, 11. CGS21680 when activating A2Ar potentially decreases intracellular M. leprae viability by reversing the molecular mechanisms essential for its maintenance and persistence in SCs, thus contributing to the establishment of the infection.
This work demonstrated for the first time the role of the AdoS—precisely, the CD73-ADA-A2AR axis—in the interaction of M. leprae-SCs. We showed that the ectoenzyme CD73 is upregulated whereas the ADA enzyme is downregulated in M. leprae-infected Schwann cells. These findings imply that the precise regulation of eADO levels is necessary. Furthermore, we show that ST88-14 SCs express the A1, A2A, and A2B receptors; the infection only downmodulates A2AR, which is essential to maintaining the LDs accumulation and M. leprae intracellular viability.
AdoS acts as a target for many disorders in various models of inflammation and in neurodegenerative and infectious disease (Eckle et al., 2008; Visentin et al., 2013; Li et al., 2015; Eberhardt et al., 2022). Leprosy is a long-lasting infectious peripheral neuropathy that can manifest in various clinical forms and is directly linked to the patient’s immune response. As a result, researching the effect of AdoS on this disease could provide valuable insights into the pathogenesis, tolerance, and survival mechanisms triggered by M. leprae infection.
Here, we focused on the CD73-A2AR-ADA axis as a starting point for investigating the involvement of the purinergic system in leprosy pathogenesis. CD73 hydrolyzes extracellular 5′AMP to eADO, which, once outside of cells, can activate specific G protein-coupled receptors (Huang et al., 2021). In addition, eADO can be converted into eINO by ecto-ADA or taken back up by equilibrative nucleoside transporters (ENTs) (Alarcón et al., 2020). Here, we show that CD73 is upregulated in M. leprae-infected SCs. CD73 is a pivotal enzyme in eADO production and plays an essential role in maintaining equilibrium by converting eATP-induced immune stimulation into eADO-induced immunosuppression (Shao et al., 2023). Previous studies have demonstrated that CD73 is associated with bacterial escape, enhancing neutrophil recruitment during Mycobacterium tuberculosis infection (Dubois-Colas et al., 2014; Petit-Jentreau et al., 2015). CD73 is crucial for reducing tissue damage and controlling Toxoplasma gondii infection (Yilmaz et al., 2017), and it increases L. amazonensis survival via immunomodulatory effects activated by adenosine receptors (Basu et al., 2020; Bajracharya et al., 2022).
Although eADO is an immunosuppressor molecule, its effects—depending on the adenosine receptor—as a signaling molecule can be pro- or anti-inflammatory, and the enzyme ADA plays an essential role in this context (Bhagavatham et al., 2021). We showed that SCs infected with M. leprae increased ADA expression. Since previous studies demonstrated that ADA could lead to impaired immune functions, we can hypothesize that the bacilli may modulate it to maintain pathogen survival inside host cells. However, it is crucial to consider the possible effects of INO on leprosy due to its anti-inflammatory and antinociceptive properties (Nascimento et al., 2010; Nascimento et al., 2015).
Research in pharmacology and expression of receptors has revealed a wide range of purinergic receptors in all major glial classes, including SCs (Welihinda et al., 2016), suggesting an intercellular communication route to establish a functional connection between neurons and glia. Additionally, research has revealed the elevated expression of A2AR and A2BR in non-myelinating SCs (Fields and Burnstock, 2006; Patritti-Cram et al., 2021). According to Patritti-Cram et al. (2021), mouse SCs exhibit considerable expression of the A1R, A2AR, and A2BR but low expression of the A3R. Interestingly, the primary receptors involved in neuroinflammation modulation are A1R and A2AR (Martí Navia et al., 2020).
A2AR and A2BR interact with stimulatory GTP-binding protein (Gs), resulting in increased intracellular cAMP levels that activate the cAMP-dependent protein kinase (PKA), which phosphorylates cAMP response element-binding protein (CREB) at Ser133 (p-CREB) (Darashchonak et al., 2014; Yang et al., 2015). p-CREB regulates the transcription of several genes related to various physiological conditions, such as cell immune responses, lipid metabolism, cellular survival, proliferation, and differentiation (Wen et al., 2010; Darashchonak et al., 2014; Yang et al., 2015). Plenty of genes involved in the immune system contain this cAMP-responsive element, including IL-6, IL-10, and TNF-α coding genes (Wen et al., 2010). Additionally, p-CREB suppresses the NF-κB, controlling the inflammatory responses by reducing IL-8, which contains functional binding sites for NF-kB in its promoter region (Shaywitz and Greenberg, 1999; Wen et al., 2010; Bezzerri et al., 2011; Iizuka et al., 2020).
Our data have shown that M. leprae-infected SCs downregulate the expression of A2AR; additionally, the p-CREB level is significantly reduced compared to non-infected cells. Nevertheless, adding a specific A2AR agonist increased p-CREB expression in non-infected cells and reversed the effect of M. leprae in the infected SCs, showing that A2AR is functional. Recently, CREB was shown to play a role in M. tuberculosis-infected human macrophages (Leopold Wager et al., 2023). In this study, M. tuberculosis-induced p-CREB was independent of cAMP but dependent on the p38/MAPK pathway. In our model, M. leprae downregulates the levels of p-CREB, which reinforces CREB involvement in mycobacterial infections.
The canonical pathway activated by A2AR is known to involve the cAMP-PKA-CREB axis (Fields and Burnstock, 2006). Nevertheless, CREB can be phosphorylated by alternative enzymes such as protein kinase C (PKC), pp90 ribosomal S6 kinase, calmodulin kinases, and p38-MAPK (Brindle et al., 1993; Wong and Sakamoto, 1995; Shaywitz and Greenberg, 1999; Gubina et al., 2001; Gee et al., 2006; Gee et al., 2007). Therefore, understanding how M. leprae downregulates A2AR and how this receptor is connected to the CREB pathway will reveal new insights into their role in leprosy pathogenesis.
The impact of A2AR in producing two cytokines by SCs, IL-6, and IL-8 was also investigated. The results have shown that M. leprae lowers the extracellular levels of IL-6, which supports previous research on infected macrophages (Csóka et al., 2007; Mattos et al., 2009; Mattos et al., 2014) but that it increases IL-8 secretion, as also shown by Díaz Acosta et al. (2018). However, CGS21680 treatment has reversed both effects caused by M. leprae infection. These findings suggest that the decreased expression and activity of A2AR participate in the maintenance of low levels of IL-6 and high levels of IL-8. Even though the involvement of CREB in this response induced by CGS21680 has yet to be studied, we could suggest that increasing p-CREB could elevate IL-6 through binding to the IL-6 promoter region (Wen et al., 2010). On the other hand, the inhibition of IL-8 production may result from the suppression of NF-kB, which regulates IL-8 transcription. An elevated level of IL-8 in the infected cell has been considered a possible neuroinflammatory mechanism triggered by M. leprae, which can be involved in the demyelinating phenotype in leprosy neural injury (Díaz Acosta et al., 2018). The literature indicates that A2AR has a neuroprotective and promyelinating role (Melani et al., 2006; Shen et al., 2018). Therefore, our findings may open new perspectives into the role of A2AR in leprosy; perhaps the downregulation of A2AR is a mechanism used by M. leprae that may contribute to leprosy neural injury?
Recently, several studies have focused on the role of A2AR in the atherosclerotic process, which involves both lipid accumulation and the activation of inflammatory pathways (Voloshyna et al., 2013). ARs regulate cellular cholesterol homeostasis by modulating intracellular cholesterol trafficking. Niemann–Pick type C1 (NPC1) is a membrane protein expressed on endosomes and lysosomes that mediates intracellular cholesterol trafficking. A2AR agonist CGS 21680 significantly decreases intracellular cholesterol accumulation and increases lysosomal calcium and subsequent mitochondrial function in a fibroblast cell line derived from NPC1 patients. The beneficial effects of A2AR agonists were blocked by the A2AR antagonist ZM241385, suggesting that this activity is dependent on the activation of A2AR (Colombini et al., 2020).
The concentration of CGS21680 chosen for this study was based on data from the literature, including Yasuda et al. (2003), showing a potency rank order for A2BR in hepatocytes using 100 μM NECA (N-ethylcarboxamidoadenosine), a non-selective agonist of adenosine receptors, as well as adenosine and CGS21680. They describe a potency rank of NECA > adenosine > CGS21680 in the accumulation of cAMP and stimulation of glycogenolysis and gluconeogenesis in rat hepatocytes. Another study that gave us support to test CGS21680 at a concentration of 100 μM was Lebon et al. (2015), where the molecular determinants of the human A2AR were analyzed using a thermostabilized construction of the conformational structure of the A2AR, bound to the agonist CGS21680 at a concentration of 100μM. This revealed the high selectivity of CGS21680 for A2AR compared to A2BR. Their results also showed that differences in the amino acid sequence of the extracellular loop 2 of these receptors were responsible for this phenotype (Lebon et al., 2015). Our findings indicate that M. leprae infection significantly decreases the expression and activity of A2AR, as measured by CREB phosphorylation. Additionally, we observed that the A2B receptor is more abundant in M. leprae-infected SCs than A2AR, as confirmed by RT-qPCR and immunofluorescence analysis. Based on these results, we decided to use a high concentration of both adenosine and CGS21680 to test our hypothesis that the downregulation of A2AR by M. leprae may be important for infection to be established.
We showed that 100 µM extracellular adenosine reversed the formation of M. leprae-induced LDs in SCs. Since A2AR is described as an anti-lipogenic receptor, we investigated whether M. leprae reduces the expression and activity of A2AR as a protective mechanism that assists in the establishment of infection, the maintenance of high levels of CLs and ultimately, the viability of the bacillus. For this, we maintained the excess from CGS21680 (100 μM) to assess nonspecific binding, and we used specific antagonists for A2AR and A2BR. The results confirmed that the LD’s reduction was related to the A2AR and not to A2BR. To investigate whether lipogenic molecular mechanisms were downregulated or upregulated by A2AR activation in M. leprae-infected SCs, RT-qPCR analysis was carried out. One of the genes analyzed in our study was PPARγ, which encodes a key transcription activator that regulates several lipid metabolism genes, including CD36 and PLIN3, which respectively encode a scavenger receptor for oxidized low-density lipoprotein and LD-associated proteins from perilipin family (Shi et al., 2013; Ferrante et al., 2016). CD36 was already observed by RT-qPCR and Western blotting analysis (Mattos et al., 2014). Recently, we showed that M. leprae-infected SCs display increased uptake of LDL-cholesterol (Maréchal et al., 2018). Here, we show that M. leprae increases the expression of CD36, which may contribute to the LDL-cholesterol uptake previously observed (De Nuccio et al., 2019), and that treatment with CGS21680 reverses this effect. This result suggests that the downregulation of A2AR can also be a mechanism contributing to the uptake of exogenous cholesterol by M. leprae infection. The effect of A2AR on CD36 downregulation has already been described (Desai et al., 2005), corroborating the data obtained in this work. Furthermore, we observed an upregulation of PLIN3 by infection and a downregulation by CGS21680.
We investigated the impact on PPARγ gene expression. As already described, SCs infected by M. leprae increase the expression of PPARγ (Mattos et al., 2014; Rosa et al., 2021); however, we show that CGS21680 treatment reverses this effect. Based on these results, we suggested that the lower level of LD in infected SCs treated with CGS21680 may be due to the downregulation of PPARγ and CD36, which affects PLIN3. Interestingly, feedback between PPARγ and A2AR has already been described in lung damage in acute lung injury (Díaz Acosta et al., 2018) and a vascular response model (He et al., 2013). Therefore, exploring the PPARγ -A2AR axis in leprosy may provide relevant information about this disease.
It is known that inflammation, a process usually inhibited by adenosine (mainly by action on A2AR and A2BR), is an essential factor in promoting foam cell formation and atherosclerosis (Koupenova et al., 2012; Nayeem et al., 2013). Here, we investigated two inflammatory cytokines modulated by M. leprae infection (Mattos et al., 2014): IL-6 and IL-8. Johnston-Cox et al. (2012) showed the involvement of IL-8 in hyperlipidemia and coronary disease. We already showed a cross-talk between the cytokine IL-8 and PPARγ (Díaz Acosta et al., 2018), and this cross-talk had previously been described in M. tuberculosis-infected macrophages (Shen et al., 2018). We confirmed that M. leprae increased IL-8 production but that CGS21680 treatment decreased this effect, which may suggest that A2AR could down-modulate IL-8 and, consequently, PPARγ, or vice versa. However, further research is necessary to determine the actual impact of this cross-talk on LD accumulation and how A2AR affects this axis.
The SREBF1 and SREBF2 genes were also included in this analysis, and both were already identified as upregulated in skin biopsies of multibacillary (MB) patients compared to PB (Mattos et al., 2014). The proteins encoded by these genes, SREBP1 and SREBP2, regulate fatty acid and de novo cholesterol biosynthesis, respectively. In this same work, a gene regulated by SREBF2, such as 3-hydroxy-3-methyl-glutaryl-coenzyme A reductase (HMGCR) that encodes the enzyme HMGCR that catalyzes the rate-limiting step in cholesterol biosynthesis, was also upregulated in an LL patient (Mattos et al., 2014). Our work showed that M. leprae upregulated SREBF1 in infected SCs and that CGS21680 inhibited this phenotype. The SREBF2, which regulates de novo cholesterol synthesis genes, was not modulated either by M. leprae infection or A2AR activation. However, the gene HMGCR, whose transcription is regulated by SREBF2, was upregulated by M. leprae infection, and the A2AR activation inhibited this effect. This suggests that despite gene expression not being altered, SREBF1 is functional.
Besides the genes involved in lipid synthesis, we also investigated the impact of CGS21680 on the genes involved in cholesterol efflux, such as ABCA1 and CYP27A1. The results obtained here corroborate previous data from the literature, where activation of A2AR increased cholesterol efflux by enhancing the expression of the reverse cholesterol transporter ABCA1. Nonetheless, although M. leprae infection increased the expression of CYP27A1 in our study, CGS21680 did not reverse it. It is essential to highlight that ABCA1 is regulated by the transcription factor LXR, which regulates the transcription of other genes such as CH25H (Dechkhajorn et al., 2020), which encodes cholesterol 25-hydroxylase (CH25H) that produces 25-OH-cholesterol (25-HC), another LXR activator (Akiyama et al., 2002; Liu et al., 2018; Matsuo, 2022). Several studies have investigated the regulatory mechanisms of CH25H expression. It was observed that 25-HC could activate its expression, forming a positive feedback loop, and this effect was dependent on LXR activation [18]. Furthermore, inflammatory cytokines such as IL-6 can promote CH25H expression (Magoro et al., 2019). Therefore, other enzymes from the CYP450 family, such as CH25H, could further activate LXR via A2AR, increasing the transcription of ABCA1. For example, the increase in IL-6 induced by CGS21680 could be one of these factors.
Therefore, our study model suggests that A2AR decreased LD accumulation by preventing lipogenesis and inducing cholesterol efflux in infected SCs. Nevertheless, we must not discard the importance of both A1R and A2BR in M. leprae infection since the literature shows they both control lipolysis and lipogenesis (Johansson et al., 2008; Koupenova and Ravid, 2013; Leiva et al., 2017).
Many studies have demonstrated the relevance of the purinergic system during various infectious, inflammatory, and neurodegenerative diseases, focusing on the P2-receptors—mainly P2X7 (Jacob et al., 2013; Di Virgilio et al., 2017). Souza et al. (2021) recently reported that the P2X7 receptor may exert a vital role in the death of M. leprae, which is necessary to control the disease. Consequently, the significance of investigating the influence of the purinergic signaling through P2 receptors in leprosy is also mandatory, primarily because the equilibrium between eATP and eADO is crucial for avoiding unregulated tissue harm caused by exacerbated inflammatory reactions. This duality in the purinergic system in a complex disease such as leprosy, which presents itself in diverse clinical manifestations primarily because of the host’s immune reaction, might provide extremely significant perspectives on its progression.
The evidence presented here shows that the activation of A2AR reverses both the host cell lipid metabolism subverted by M. leprae in infected SCs and the levels of IL-6 and IL-8 produced by infected SCs; this may be involved directly in the effects produced by A2AR activation on the LD accumulation. Overall, our results show for the first time that the modulation of the CD73-ADA-A2A axis by M. leprae infection helps maintain a functional strategy to ensure bacilli survival in SCs. Our findings also present innovative data introducing new perspectives for exploring leprosy neuropathogenesis and can offer new targets to develop complementary therapies for the treatment of this disease.
The original contributions presented in the study are included in the article/Supplementary Material; further inquiries can be directed to the corresponding author.
Ethical approval was not required for the studies on humans in accordance with local legislation and institutional requirements because only commercially available established cell lines were used.
PS: Formal Analysis, Investigation, Methodology, Writing–original draft, Validation, Writing–review and editing. CD: Writing–original draft, Writing–review and editing, Formal Analysis, Investigation, Methodology. TR: Methodology, Writing–review and editing, Formal Analysis, Investigation. MI: Writing–review and editing, Investigation. AD: Methodology, Writing–review and editing, Investigation. AP: Methodology, Writing–review and editing, Investigation. LG: Writing–review and editing, Investigation. MP: Writing–review and editing, Project administration. MD: Writing–review and editing, Investigation. PR: Methodology, Resources, Writing–review and editing. DB: Methodology, Writing–review and editing, Resources. JM-F: Writing–review and editing, Methodology, Supervision. FM: Writing – review and editing, Investigation. MM: Writing–review and editing, Resources, Funding acquisition. JB: Writing–review and editing, Funding acquisition, Resources. RP: Conceptualization, Methodology, Writing–review and editing, Resources, Formal Analysis. LR: Formal Analysis, Methodology, Writing–review and editing, Visualization. MP: Writing–review and editing, Conceptualization, Funding acquisition, Methodology, Resources, Supervision. MB-P: Investigation, Writing–review and editing, Conceptualization, Funding acquisition, Methodology, Project administration, Resources, Supervision, Validation, Writing–original draft.
The author(s) declare that financial support was received for the research, authorship, and/or publication of this article. This study was supported by the Oswaldo Cruz Foundation (FIOCRUZ) and by grants awarded to MCP and JB by the National Institute of Allergy and Infectious Diseases of the National Institutes of Health: R01AI141526-01A1, MCP and MB by the Conselho Nacional de Desenvolvimento Científico e Tecnológico (CNPq; 432434/2018-6), and MB by the Fundaçao Carlos Chagas Filho de Amparo a Pesquisa do Estado do Rio de Janeiro (FAPERJ; E26/111.493/2013). PS was a recipient of a fellowship from Coordenação de Aperfeiçoamento de Pessoal de Nível Superior - Brasil (CAPES) – Finance Code 001.
The authors extend their gratitude to Dr Daniela Cosentino-Gomes for providing the protocol and assistance in enzymatic activity assay. The entire team from the Research and Teaching Division of the Instituto Lauro de Souza Lima de Bauru is also appreciated for providing the animal facility, infection, and supplying M. leprae to perform this work.
The authors declare that the research was conducted in the absence of any commercial or financial relationships that could be construed as a potential conflict of interest.
All claims expressed in this article are solely those of the authors and do not necessarily represent those of their affiliated organizations, or those of the publisher, the editors and the reviewers. Any product that may be evaluated in this article, or claim that may be made by its manufacturer, is not guaranteed or endorsed by the publisher.
The Supplementary Material for this article can be found online at: https://www.frontiersin.org/articles/10.3389/fphar.2024.1399363/full#supplementary-material
SUPPLEMENTARY FIGURE S1 | CGS21680 50 nM decreases M. leprae-induced lipid droplets accumulation in Schwann cells. 4 × 10⁴ SCs were infected with M. leprae (MOI 5:1) for 48 h, and LDs were visualized by fluorescence microscopy using Oil Red O (ORO) staining. The quantification of ORO-stained LDs was plotted as measurement of LD area/cell. A total of 100 cells for each condition was analyzed. (A) The pretreatment with 50 nM CGS21680 reduced the LD formation induced by M. leprae, and the specific A2AR antagonist ZM241385 (1 µM) reversed the inhibitory effect of CGS21680 in M. leprae induced LD. Scale bar 10 μm (white line). (B) LDs quantification by Image J software. NI= not infected. Data are shown as mean± SD of at least three different experiments performed in triplicate. Statistics used the NI condition as a reference. Data were evaluated via parametric student t-test, *p < 0.05, *p < 0.01.
SUPPLEMENTARY FIGURE S2 | A2B receptor inhibition does not affect the inhibitory effect of CGS21680 on lipid droplet formation in M. leprae-infected Schwann cells. 4 × 10⁴ SCs were infected with M. leprae (MOI 5:1) for 48 h. LDs were visualized by fluorescence microscopy using Oil Red O (ORO) staining. The quantification of ORO-stained LDs was plotted as measurement of LD area/cell for a total of 200 cells for each condition. (A,B) The use of the specific A2BR antagonist MRS1754 (1 µM) does not per se affect the formation of LDs and does not reverse the effect of CGS21680 (100 µM) in inhibiting LD induced by M. leprae infection. Scale bar 20 μm (white line). (B) LDs quantification by Image J software. NI= not infected. NT= not treated. Data are shown as mean± SD of at least three different experiments performed in triplicate. Statistical differences were evaluated via one-way ANOVA with Bonferroni’s multiple comparisons test, *p < 0.05, **p < 0.01, and ***p < 0.0001.
SUPPLEMENTARY FIGURE S3 | A2B receptor expression is not modulated by M. leprae-infected Schwann cells. 4 × 10⁴ SCs were infected with M. leprae (MOI 5:1) for 48 h. The expression of the A2B receptor was analyzed. (A) Protein expression of A2BR (red) was visualized using immunofluorescence. DAPI nuclear staining in blue. Scale bar: 20 µm. (B) Mean fluorescence intensity (MFI) quantified using ImageJ software. NI= not infected. All data are mean ± SD. Statistical significance was determined using Student parametric t-test.
SUPPLEMENTARY FIGURE S4 | Schematic representation of an interactome between the adenosinergic proteins and of the lipid homeostasis analyzed in M. leprae-infected Schwann cells The interactome represents all the proteins or genes analyzed in this work: ADORA2A, NT5E, ADA, IL-6; IL-8 (CXCL8) PLIN3; PPARy; CD36; SREBPF1; SREPBF2; HMGCR; ABCA1; CYP27A1. Interactome was built using network STRING version 12.0 (https://string-db.org/). Each node represents the proteins with predicted 3D structures presented within the nodes. (A) Interactome showing in gray lines the degree of confidence of association defined by their thickness, indicating the strength of data support. Green and red nodes represent MCL clustering of these proteins. (B) Interactome of each cluster presented in Figure A. The color lines show how these proteins are connected: blue lines indicate curated database, purple lines were experimentally determined, yellow lines indicate information from text mining, black lines indicate co-expression, dark blue gene co-occurrence, and light blue indicates protein homology. The color inside the nodes represents the associated cellular processes based on gene ontology.
Akiyama, T. E., Sakai, S., Lambert, G., Nicol, C. J., Matsusue, K., Pimprale, S., et al. (2002). Conditional disruption of the peroxisome proliferator-activated receptor gamma gene in mice results in lowered expression of ABCA1, ABCG1, and apoE in macrophages and reduced cholesterol efflux. Mol. Cell Biol. 22 (8), 2607–2619. doi:10.1128/mcb.22.8.2607-2619.2002
Alam, M. S., Kurtz, C. C., Wilson, J. M., Burnette, B. R., Wiznerowicz, E. B., Ross, W. G., et al. (2009). A2A adenosine receptor (AR) activation inhibits pro-inflammatory cytokine production by human CD4+ helper T cells and regulates Helicobacter-induced gastritis and bacterial persistence. Mucosal Immunol. 2 (3), 232–242. doi:10.1038/mi.2009.4
Alarcón, S., Toro, M. de L. Á., Villarreal, C., Melo, R., Fernández, R., Ayuso Sacido, A., et al. (2020). Decreased equilibrative nucleoside transporter 1 (ENT1) activity contributes to the high extracellular adenosine levels in mesenchymal glioblastoma stem-like cells. Cells 9 (8), 1914. doi:10.3390/cells9081914
Allard, B., Cousineau, I., Spring, K., and Stagg, J. (2019). Measurement of CD73 enzymatic activity using luminescence-based and colorimetric assays. Methods Enzymol. 629, 269–289. doi:10.1016/bs.mie.2019.10.007
Antonioli, L., Csóka, B., Fornai, M., Colucci, R., Kókai, E., Blandizzi, C., et al. (2014). Adenosine and inflammation: what’s new on the horizon? Drug Discov. Today 19, 1051–1068. Elsevier Ltd. doi:10.1016/j.drudis.2014.02.010
Antonioli, L., Pacher, P., Sylvester Vizi, E., and rgy Haskó, G. (2013). CD39 and CD73 in immunity and inflammation. Trends Mol. Med. 19, 355–367. doi:10.1016/j.molmed.2013.03.005
Bajracharya, B., Shrestha, D., Talvani, A., Gonçalves, R., and Afonso, L. C. C. (2022). The ecto-5’nucleotidase/CD73 mediates leishmania amazonensis survival in macrophages. Biomed. Res. Int. 2022, 9928362. doi:10.1155/2022/9928362
Basu, M., Gupta, P., Dutta, A., Jana, K., and Ukil, A. (2020). Increased host ATP efflux and its conversion to extracellular adenosine is crucial for establishing Leishmania infection. J. Cell Sci. 133 (7), jcs239939. doi:10.1242/jcs.239939
Bezzerri, V., Borgatti, M., Finotti, A., Tamanini, A., Gambari, R., and Cabrini, G. (2011). Mapping the transcriptional machinery of the IL-8 gene in human bronchial epithelial cells. J. Immunol. 187 (11), 6069–6081. doi:10.4049/jimmunol.1100821
Bhagavatham, S. K. S., Khanchandani, P., Kannan, V., Potikuri, D., Sridharan, D., Pulukool, S. K., et al. (2021). Adenosine deaminase modulates metabolic remodeling and orchestrates joint destruction in rheumatoid arthritis. Sci. Rep. 11 (1), 15129. doi:10.1038/s41598-021-94607-5
Bingham, T. C., Fisher, E. A., Parathath, S., Reiss, A. B., Chan, E. S., and Cronstein, B. N. (2010). A2A adenosine receptor stimulation decreases foam cell formation by enhancing ABCA1-dependent cholesterol efflux. J. Leukoc. Biol. 87 (4), 683–690. doi:10.1189/jlb.0709513
Borea, P. A., Gessi, S., Merighi, S., Vincenzi, F., and Varani, K. (2018). Pharmacology of adenosine receptors: the state of the art. Physiol. Rev. 98, 1591–1625. doi:10.1152/physrev.00049.2017
Borhani, S., Corciulo, C., Larranaga-Vera, A., and Cronstein, B. N. (2019). Adenosine A2A receptor (A2AR) activation triggers Akt signaling and enhances nuclear localization of β-catenin in osteoblasts. FASEB J. 33 (6), 7555–7562. doi:10.1096/fj.201900014R
Brindle, P., Linke, S., and Montminy, M. (1993). Protein-kinase-A-dependent activator in transcription factor CREB reveals new role for CREM repressors. Nature 364 (6440), 821–824. doi:10.1038/364821a0
Burnstock, G. (2017). Purinergic signalling: therapeutic developments. Front. Pharmacol. Front. Media S.A. 8, 661. doi:10.3389/fphar.2017.00661
Colombini, A., Orfei, C. P., Vincenzi, F., de Luca, P., Ragni, E., Viganò, M., et al. (2020). A2A adenosine receptors are involved in the reparative response of tendon cells to pulsed electromagnetic fields. PLoS One 15, e0239807. 9 September. doi:10.1371/journal.pone.0239807
Cristalli, G., Costanzi, S., Lambertucci, C., Lupidi, G., Vittori, S., Volpini, R., et al. (2001). Adenosine deaminase: functional implications and different classes of inhibitors. Med. Res. Rev. 21, 105–128. John Wiley and Sons, Inc. doi:10.1002/1098-1128(200103)21:2<105::aid-med1002>3.0.co;2-u
Csóka, B., Németh, Z. H., Virág, L., Gergely, P., Leibovich, S. J., Pacher, P., et al. (2007). A2A adenosine receptors and C/EBPbeta are crucially required for IL-10 production by macrophages exposed to Escherichia coli. Blood 110 (7), 2685–2695. doi:10.1182/blood-2007-01-065870
Darashchonak, N., Koepsell, B., Bogdanova, N., and Von Versen-Höynck, F. (2014). Adenosine A 2B receptors induce proliferation, invasion and activation of cAMP response element binding protein (CREB) in trophoblast cells. BMC Pregnancy Childbirth 14, 2. doi:10.1186/1471-2393-14-2
Dechkhajorn, W., Maneerat, Y., Prasongsukarn, K., Kanchanaphum, P., and Kumsiri, R. (2020). Interleukin-8 in hyperlipidemia and coronary heart disease in Thai patients taking statin cholesterol-lowering medication while undergoing coronary artery bypass grafting treatment. Sci. Cairo 2020, 5843958. doi:10.1155/2020/5843958
de Macedo, C. S., Lara, F. A., Pinheiro, R. O., Schmitz, V., de Berrêdo-Pinho, M., Pereira, G. M., et al. (2020). New insights into the pathogenesis of leprosy: contribution of subversion of host cell metabolism to bacterial persistence, disease progression, and transmission. F1000Research 9, F1000 Research Ltd. doi:10.12688/f1000research.21383.1
De Nuccio, C., Bernardo, A., Ferrante, A., Pepponi, R., Martire, A., Falchi, M., et al. (2019). Adenosine A2A receptor stimulation restores cell functions and differentiation in Niemann-Pick type C-like oligodendrocytes. Sci. Rep. 9 (1), 9782. doi:10.1038/s41598-019-46268-8
De Ponti, C., Carini, R., Alchera, E., Nitti, M. P., Locati, M., Albano, E., et al. (2007). Adenosine A2a receptor-mediated, normoxic induction of HIF-1 through PKC and PI-3K-dependent pathways in macrophages. J. Leukoc. Biol. 82 (2), 392–402. doi:10.1189/jlb.0107060
Deps, P., and Collin, S. M. (2021). Mycobacterium lepromatosis as a second agent of hansen’s disease. Front. Microbiol. 12, 698588. Available from:/pmc/articles/PMC8461103/. doi:10.3389/fmicb.2021.698588
Desai, A., Victor-Vega, C., Gadangi, S., Montesinos, M. C., Chu, C. C., and Cronstein, B. N. (2005). Adenosine A2A receptor stimulation increases angiogenesis by down-regulating production of the antiangiogenic matrix protein thrombospondin 1. Mol. Pharmacol. 67 (5), 1406–1413. doi:10.1124/mol.104.007807
Díaz Acosta, C. C., Dias, A. A., Rosa, TLSA, Batista-Silva, L. R., Rosa, P. S., Toledo-Pinto, T. G., et al. (2018). PGL I expression in live bacteria allows activation of a CD206/PPARγ cross-talk that may contribute to successful Mycobacterium leprae colonization of peripheral nerves. PLoS Pathog. 14 (7), e1007151. doi:10.1371/journal.ppat.1007151
Di Virgilio, F., Dal Ben, D., Sarti, A. C., Giuliani, A. L., and Falzoni, S. (2017). The P2X7 receptor in infection and inflammation. Immunity 47 (1), 15–31. doi:10.1016/j.immuni.2017.06.020
Dubois-Colas, N., Petit-Jentreau, L., Barreiro, L. B., Durand, S., Soubigou, G., Lecointe, C., et al. (2014). Extracellular adenosine triphosphate affects the response of human macrophages infected with mycobacterium tuberculosis. J. Infect. Dis. 210 (5), 824–833. doi:10.1093/infdis/jiu135
Ebenezer, G. J., and Scollard, D. M. (2021). Treatment and evaluation advances in leprosy neuropathy. Neurotherapeutics 18, 2337–2350. Springer Science and Business Media Deutschland GmbH. doi:10.1007/s13311-021-01153-z
Eberhardt, N., Bergero, G., Mazzocco Mariotta, Y. L., and Aoki, M. P. (2022). Purinergic modulation of the immune response to infections. Purinergic Signal. 18, 93–113. Springer Science and Business Media B.V. doi:10.1007/s11302-021-09838-y
Eckle, T., Faigle, M., Grenz, A., Laucher, S., Thompson, L. F., and Eltzschig, H. K. (2008). A2B adenosine receptor dampens hypoxia-induced vascular leak. Blood 111 (4), 2024–2035. doi:10.1182/blood-2007-10-117044
Ferrante, A., De Nuccio, C., Pepponi, R., Visentin, S., Martire, A., Bernardo, A., et al. (2016). Stimulation of adenosine A2A receptors reduces intracellular cholesterol accumulation and rescues mitochondrial abnormalities in human neural cell models of Niemann-Pick C1. Neuropharmacology 103, 155–162. doi:10.1016/j.neuropharm.2015.11.022
Fields, R. D., and Burnstock, G. (2006). Purinergic signalling in neuron-glia interactions. Nat. Rev. Neurosci. 7 (6), 423–436. doi:10.1038/nrn1928
Fredholm, B. B., Ijzerman, A. P., Jacobson, K. A., Linden, J., and Müller, C. E. (2011). International union of basic and clinical pharmacology LXXXI nomenclature and classification of adenosine receptors--an update. Pharmacol. Rev. 63 (1), 1–34. doi:10.1124/pr.110.003285
Gao, Z. G., Toti, K. S., Campbell, R., Suresh, R. R., Yang, H., and Jacobson, K. A. (2020). Allosteric antagonism of the A2A adenosine receptor by a series of bitopic ligands. Cells 9 (5), 1200. doi:10.3390/cells9051200
Gee, K., Angel, J. B., Ma, W., Mishra, S., Gajanayaka, N., Parato, K., et al. (2006). Intracellular HIV-Tat expression induces IL-10 synthesis by the CREB-1 transcription factor through Ser133 phosphorylation and its regulation by the ERK1/2 MAPK in human monocytic cells. J. Biol. Chem. 281 (42), 31647–31658. doi:10.1074/jbc.M512109200
Gee, K., Angel, J. B., Mishra, S., Blahoianu, M. A., and Kumar, A. (2007). IL-10 regulation by HIV-Tat in primary human monocytic cells: involvement of calmodulin/calmodulin-dependent protein kinase-activated p38 MAPK and Sp-1 and CREB-1 transcription factors. J. Immunol. 178 (2), 798–807. doi:10.4049/jimmunol.178.2.798
Giambelluca, M. S., and Pouliot, M. (2017). Early tyrosine phosphorylation events following adenosine A2A receptor in human neutrophils: identification of regulated pathways. J. Leukoc. Biol. 102 (3), 829–836. doi:10.1189/jlb.2VMA1216-517R
Giuliani, A. L., Sarti, A. C., and Di Virgilio, F. (2021). Ectonucleotidases in acute and chronic inflammation. Front. Pharmacol. 11, 619458. Frontiers Media S.A. doi:10.3389/fphar.2020.619458
Gomez-Sanchez, J. A., Carty, L., Iruarrizaga-Lejarreta, M., Palomo-Irigoyen, M., Varela-Rey, M., Griffith, M., et al. (2015). Schwann cell autophagy, myelinophagy, initiates myelin clearance from injured nerves. J. Cell Biol. 210 (1), 153–168. doi:10.1083/jcb.201503019
Gubina, E., Luo, X., Kwon, E., Sakamoto, K., Shi, Y. F., and Mufson, R. A. (2001). Betac cytokine receptor-induced stimulation of cAMP response element binding protein phosphorylation requires protein kinase C in myeloid cells: a novel cytokine signal transduction cascade. J. Immunol. 167 (8), 4303–4310. doi:10.4049/jimmunol.167.8.4303
Han, X. Y., Seo, Y. H., Sizer, K. C., Schoberle, T., May, G. S., Spencer, J. S., et al. (2008). A new Mycobacterium species causing diffuse lepromatous leprosy. Am. J. Clin. Pathol. 130 (6), 856–864. doi:10.1309/AJCPP72FJZZRRVMM
He, X., Hu, J. L., Li, J., Zhao, L., Zhang, Y., Zeng, Y. J., et al. (2013). A feedback loop in PPARγ-adenosine A2A receptor signaling inhibits inflammation and attenuates lung damages in a mouse model of LPS-induced acute lung injury. Cell Signal 25 (9), 1913–1923. doi:10.1016/j.cellsig.2013.05.024
Huang, Z., Xie, N., Illes, P., Di Virgilio, F., Ulrich, H., Semyanov, A., et al. (2021). From purines to purinergic signalling: molecular functions and human diseases. Signal Transduct. Target. Ther. Springer Nat. 6, 162. doi:10.1038/s41392-021-00553-z
Iizuka, K., Takao, K., and Yabe, D. (2020). ChREBP-Mediated regulation of lipid metabolism: involvement of the gut microbiota, liver, and adipose tissue. Front. Endocrinol. Lausanne 11, 587189. doi:10.3389/fendo.2020.587189
Ingwersen, J., Wingerath, B., Graf, J., Lepka, K., Hofrichter, M., Schröter, F., et al. (2016). Dual roles of the adenosine A2a receptor in autoimmune neuroinflammation. J. Neuroinflammation 13 (1), 48. doi:10.1186/s12974-016-0512-z
Jacob, F., Pérez Novo, C., Bachert, C., and Van Crombruggen, K. (2013). Purinergic signaling in inflammatory cells: P2 receptor expression, functional effects, and modulation of inflammatory responses. Purinergic Signal. 9 (3), 285–306. doi:10.1007/s11302-013-9357-4
Johansson, S. M., Lindgren, E., Yang, J. N., Herling, A. W., and Fredholm, B. B. (2008). Adenosine A1 receptors regulate lipolysis and lipogenesis in mouse adipose tissue-interactions with insulin. Eur. J. Pharmacol. 597 (1–3), 92–101. doi:10.1016/j.ejphar.2008.08.022
Johnston-Cox, H. A., Koupenova, M., and Ravid, K. (2012). A2 adenosine receptors and vascular pathologies. Arterioscler. Thromb. Vasc. Biol. 32 (4), 870–878. doi:10.1161/ATVBAHA.112.246181
Köröskényi, K., Kiss, B., and Szondy, Z. (2016). Adenosine A2A receptor signaling attenuates LPS-induced pro-inflammatory cytokine formation of mouse macrophages by inducing the expression of DUSP1. Biochim. Biophys. Acta Mol. Cell Res. 1863 (7), 1461–1471. doi:10.1016/j.bbamcr.2016.04.003
Koupenova, M., Johnston-Cox, H., and Ravid, K. (2012). Regulation of atherosclerosis and associated risk factors by adenosine and adenosine receptors. Curr. Atheroscler. Rep. 14, 460–468. doi:10.1007/s11883-012-0263-y
Koupenova, M., and Ravid, K. (2013). Adenosine, adenosine receptors and their role in glucose homeostasis and lipid metabolism. J. Cell Physiol. doi:10.1002/jcp.24352
Kull, B., Svenningsson, P., and Fredholm, B. B. (2000). Adenosine A(2A) receptors are colocalized with and activate g(olf) in rat striatum. Mol. Pharmacol. 58 (4), 771–777. doi:10.1124/mol.58.4.771
Lebon, G., Edwards, P. C., Leslie, A. G., and Tate, C. G. (2015). Molecular determinants of CGS21680 binding to the human adenosine A2A receptor. Mol. Pharmacol. 87 (6), 907–915. doi:10.1124/mol.114.097360
Leiva, A., Guzmán-Gutiérrez, E., Contreras-Duarte, S., Fuenzalida, B., Cantin, C., Carvajal, L., et al. (2017). Adenosine receptors: modulators of lipid availability that are controlled by lipid levels. Mol. Asp. Med. 55, 26–44. doi:10.1016/j.mam.2017.01.007
Leopold Wager, C. M., Bonifacio, J. R., Simper, J., Naoun, A. A., Arnett, E., and Schlesinger, L. S. (2023). Activation of transcription factor CREB in human macrophages by Mycobacterium tuberculosis promotes bacterial survival, reduces NF-kB nuclear transit and limits phagolysosome fusion by reduced necroptotic signaling. PLoS Pathog. 19 (3), e1011297. doi:10.1371/journal.ppat.1011297
Li, P., Rial, D., Canas, P. M., Yoo, J. H., Li, W., Zhou, X., et al. (2015). Optogenetic activation of intracellular adenosine A2A receptor signaling in the hippocampus is sufficient to trigger CREB phosphorylation and impair memory. Mol. Psychiatry 20 (11), 1339–1349. doi:10.1038/mp.2014.182
Liu, Y., Wei, Z., Ma, X., Yang, X., Chen, Y., Sun, L., et al. (2018). 25-Hydroxycholesterol activates the expression of cholesterol 25-hydroxylase in an LXR-dependent mechanism. J. Lipid Res. 59 (3), 439–451. doi:10.1194/jlr.M080440
Livak, K. J., and Schmittgen, T. D. (2001). Analysis of relative gene expression data using real-time quantitative PCR and the 2(-Delta Delta C(T)) Method. Methods 25 (4), 402–408. doi:10.1006/meth.2001.1262
Lobato, L. S., Rosa, P. S., Da Silva Ferreira, J., Da Silva Neumann, A., Da Silva, M. G., Nascimento, D. C., et al. (2014). Statins increase rifampin mycobactericidal effect. Antimicrob. Agents Chemother. 58 (10), 5766–5774. doi:10.1128/AAC.01826-13
Lockwood, D. N. J. (2019). Chronic aspects of leprosy-neglected but important. Trans. R. Soc. Trop. Med. Hyg. 113, 813–817. Oxford University Press. doi:10.1093/trstmh/try131
Ma, S., Mi, Z., Wang, Z., Sun, L., Liu, T., Shi, P., et al. (2023). Single-cell sequencing analysis reveals development and differentiation trajectory of Schwann cells manipulated by M. leprae. PLoS Negl. Trop. Dis. 17 (7), e0011477. doi:10.1371/journal.pntd.0011477
Magoro, T., Dandekar, A., Jennelle, L. T., Bajaj, R., Lipkowitz, G., Angelucci, A. R., et al. (2019). IL-1β/TNF-α/IL-6 inflammatory cytokines promote STAT1-dependent induction of CH25H in Zika virus-infected human macrophages. J. Biol. Chem. 294 (40), 14591–14602. doi:10.1074/jbc.RA119.007555
Maréchal, L., Laviolette, M., Rodrigue-Way, A., Sow, B., Brochu, M., Caron, V., et al. (2018). The CD36-pparγ pathway in metabolic disorders. Int. J. Mol. Sci. 19 (5), 1529. doi:10.3390/ijms19051529
Martí Navia, A., Dal Ben, D., Lambertucci, C., Spinaci, A., Volpini, R., Marques-Morgado, I., et al. (2020). Adenosine receptors as neuroinflammation modulators: role of A1 agonists and A2A antagonists. Cells 9 (7), 1739. doi:10.3390/cells9071739
Martinez, A. N., Lahiri, R., Pittman, T. L., Scollard, D., Truman, R., Moraes, M. O., et al. (2009). Molecular determination of Mycobacterium leprae viability by use of real-time PCR. J. Clin. Microbiol. 47 (7), 2124–2130. doi:10.1128/JCM.00512-09
Masaki, T., Qu, J., Cholewa-Waclaw, J., Burr, K., Raaum, R. R. A., and Rambukkana, A. (2015). Reprogramming adult Schwann cells to stem cell-like cells by leprosy bacilli promotes dissemination of infection. Cell 152 (0), 51–67. doi:10.1016/j.cell.2012.12.014
Matsuo, M. (2022). ABCA1 and ABCG1 as potential therapeutic targets for the prevention of atherosclerosis. J. Pharmacol. Sci. 148 (2), 197–203. doi:10.1016/j.jphs.2021.11.005
Mattos, K. A., D’Avila, H., Rodrigues, L. S., Oliveira, V. G. C., Sarno, E. N., Atella, G. C., et al. (2009). Lipid droplet formation in leprosy: toll-like receptor-regulated organelles involved in eicosanoid formation and Mycobacterium leprae pathogenesis. J. Leukoc. Biol. 87 (3), 371–384. doi:10.1189/jlb.0609433
Mattos, K. A., Lara, F. A., Oliveira, V. G. C., Rodrigues, L. S., D’Avila, H., Melo, R. C. N., et al. (2011b). Modulation of lipid droplets by Mycobacterium leprae in Schwann cells: a putative mechanism for host lipid acquisition and bacterial survival in phagosomes. Cell Microbiol. 13 (2), 259–273. doi:10.1111/j.1462-5822.2010.01533.x
Mattos, K. A., Oliveira, V. C. G., Berrêdo-Pinho, M., Amaral, J. J., Antunes, L. C. M., Melo, R. C. N., et al. (2014). Mycobacterium leprae intracellular survival relies on cholesterol accumulation in infected macrophages: a potential target for new drugs for leprosy treatment. Cell Microbiol. 16 (6), 797–815. doi:10.1111/cmi.12279
Mattos, K. A., Oliveira, V. G. C., D’Avila, H., Rodrigues, L. S., Pinheiro, R. O., Sarno, E. N., et al. (2011a). TLR6-Driven lipid droplets in Mycobacterium leprae- infected schwann cells: immunoinflammatory platforms associated with bacterial persistence. J. Immunol. 187 (5), 2548–2558. doi:10.4049/jimmunol.1101344
Mattos, K. A., Sarno, E. N., Pessolani, M. C. V., and Bozza, P. T. (2012). Deciphering the contribution of lipid droplets in leprosy: multifunctional organelles with roles in Mycobacterium leprae pathogenesis. Mem. Inst. Oswaldo. Cruz. Suppl 1, 156–166. doi:10.1590/s0074-02762012000900023
Medeiros, R. C. A., De Vasconcelos Girardi, K. D. C., Cardoso, F. K. L., De Siqueira, M. B., De Toledo Pinto, T. G., Gomez, L. S., et al. (2016). Subversion of schwann cell glucose metabolism by Mycobacterium leprae. J. Biol. Chem. 291 (41), 24803–24887. doi:10.1074/jbc.A116.725283
Melani, A., Gianfriddo, M., Vannucchi, M. G., Cipriani, S., Baraldi, P. G., Giovannini, M. G., et al. (2006). The selective A2A receptor antagonist SCH 58261 protects from neurological deficit, brain damage and activation of p38 MAPK in rat focal cerebral ischemia. Brain Res. 1073–1074 (1), 470–480. doi:10.1016/j.brainres.2005.12.010
Mello, P. D. A., Filippi-Chiela, E. C., Nascimento, J., Beckenkamp, A., Santana, D. B., Kipper, F., et al. (2014). Adenosine uptake is the major effector of extracellular ATP toxicity in human cervical cancer cells. Mol. Biol. Cell 25 (19), 2905–2918. doi:10.1091/mbc.E14-01-0042
Morandi, F., Horenstein, A. L., Rizzo, R., and Malavasi, F. (2018). The role of extracellular adenosine generation in the development of autoimmune diseases. Mediat. Inflamm. 2018, 7019398. Hindawi Limited. doi:10.1155/2018/7019398
Mosmann, T. (1983). Rapid colorimetric assay for cellular growth and survival: application to proliferation and cytotoxicity assays. J. Immunol. Methods 65, 55–63. doi:10.1016/0022-1759(83)90303-4
Nascimento, F. P., Figueredo, S. M., Marcon, R., Martins, D. F., Macedo, S. J., Lima, D. A. N., et al. (2010). Inosine reduces pain-related behavior in mice: involvement of adenosine A1 and A2A receptor subtypes and protein kinase C pathways. J. Pharmacol. Exp. Ther. 334 (2), 590–598. doi:10.1124/jpet.110.166058
Nascimento, F. P., Macedo-Júnior, S. J., Pamplona, F. A., Luiz-Cerutti, M., Córdova, M. M., Constantino, L., et al. (2015). Adenosine A1 receptor-dependent antinociception induced by inosine in mice: pharmacological, genetic and biochemical aspects. Mol. Neurobiol. 51 (3), 1368–1378. doi:10.1007/s12035-014-8815-5
Nayeem, M. A., Pradhan, I., Mustafa, S. J., Morisseau, C., Falck, J. R., and Zeldin, D. C. (2013). Adenosine A2A receptor modulates vascular response in soluble epoxide hydrolase-null mice through CYP-epoxygenases and PPARγ. Am. J. Physiol. Regul. Integr. Comp. Physiol. 304 (1), R23–R32. doi:10.1152/ajpregu.00213.2012
Ng, V., Zanazzi, G., Timpl, R., Talts, J. F., Salzer, J. L., Brennan, P. J., et al. (2000). Role of the cell wall phenolic glycolipid-1 in the peripheral nerve predilection of Mycobacterium leprae. Cell 103 (3), 511–524. doi:10.1016/s0092-8674(00)00142-2
Patritti-Cram, J., Coover, R. A., Jankowski, M. P., and Ratner, N. (2021). Purinergic signaling in peripheral nervous system glial cells. GLIA 69, 1837–1851. John Wiley and Sons Inc. doi:10.1002/glia.23969
Petit-Jentreau, L., Jouvion, G., Charles, P., Majlessi, L., Gicquel, B., and Tailleux, L. (2015). Ecto-5’-nucleotidase (CD73) deficiency in Mycobacterium tuberculosisinfected mice enhances neutrophil recruitment. Infect. Immun. 83 (9), 3666–3674. doi:10.1128/IAI.00418-15
Pietrobon, A. J., Andrejew, R., Custódio, R. W. A., Oliveira, L. de M., Scholl, J. N., Teixeira, F. M. E., et al. (2022). Dysfunctional purinergic signaling correlates with disease severity in COVID-19 patients. Front. Immunol. 13, 13. doi:10.3389/fimmu.2022.1012027
Pinheiro, R. O., Schmitz, V., de Andrade Silva, B. J., Dias, A. A., de Souza, B. J., de Mattos Barbosa, M. G., et al. (2018). Innate immune responses in leprosy. Front. Immunol. Front. Media S.A. 9, 518. doi:10.3389/fimmu.2018.00518
Polycarpou, A., Holland, M. J., Karageorgiou, I., Eddaoudi, A., Walker, S. L., Willcocks, S., et al. (2016). Mycobacterium leprae activates toll-like receptor-4 signaling and expression on macrophages depending on previous bacillus Calmette-Guerin vaccination. Front. Cell Infect. Microbiol. 6, 72. JUL. doi:10.3389/fcimb.2016.00072
Ramakers, C., Ruijter, J. M., Lekanne Deprez, R. H., and Moorman, A. F. M. (2003). Assumption-free analysis of quantitative real-time polymerase chain reaction (PCR) data. Neurosci. Lett. 339 (1), 62–66. doi:10.1016/s0304-3940(02)01423-4
Rambukkana, A., Zanazzi, G., Tapinos, N., and Salzer, J. L. (2002). Contact-dependent demyelination by Mycobacterium leprae in the absence of immune cells. Science 296 (5569), 927–931. doi:10.1126/science.1067631
Reiss, A. B., Rahman, M. M., Chan, E. S. L., Montesinos, M. C., Awadallah, N. W., and Cronstein, B. N. (2004). Adenosine A2A receptor occupancy stimulates expression of proteins involved in reverse cholesterol transport and inhibits foam cell formation in macrophages. J. Leukoc. Biol. 76 (3), 727–734. doi:10.1189/jlb.0204107
Romero-Navarrete, M., Arenas, R., Han, X. Y., Vega-Memije, M. E., and Castillo-Solana, A. D. (2022). Leprosy caused by Mycobacterium lepromatosis. Am. J. Clin. Pathol. 158 (6), 678–686. doi:10.1093/ajcp/aqac110
Rosa, TLSA, Marques, M. A. M., DeBoard, Z., Hutchins, K., Silva, C. A. A., Montague, C. R., et al. (2021). Reductive power generated by Mycobacterium leprae through cholesterol oxidation contributes to lipid and ATP synthesis. Front. Cell Infect. Microbiol. 11, 709972. doi:10.3389/fcimb.2021.709972
Schneider, C. A., Rasband, W. S., and Eliceiri, K. W. (2012). NIH Image to ImageJ: 25 years of image analysis. Nat. Methods 9 (7), 671–675. doi:10.1038/nmeth.2089
Scollard, D. M., Truman, R. W., and Ebenezer, G. J. (2015). Mechanisms of nerve injury in leprosy. Clin. Dermatol 33 (1), 46–54. doi:10.1016/j.clindermatol.2014.07.008
Shao, B., Ren, S. H., Wang, Z. B., Wang, H. Da, Zhang, J. Y., Qin, H., et al. (2023). CD73 mediated host purinergic metabolism in intestine contributes to the therapeutic efficacy of a novel mesenchymal-like endometrial regenerative cells against experimental colitis. Front. Immunol. 14, 1155090. doi:10.3389/fimmu.2023.1155090
Sharma, R., Lahiri, R., Scollard, D. M., Pena, M., Williams, D. L., Adams, L. B., et al. (2013). The armadillo: a model for the neuropathy of leprosy and potentially other neurodegenerative diseases. DMM Dis. Models Mech. 6, 19–24. doi:10.1242/dmm.010215
Shaywitz, A. J., and Greenberg, M. E. (1999). CREB: a stimulus-induced transcription factor activated by a diverse array of extracellular signals. Annu. Rev. Biochem. Internet 68, 821–861. doi:10.1146/annurev.biochem.68.1.821
Shen, H. Y., Huang, N., Reemmer, J., and Xiao, L. (2018). Adenosine actions on oligodendroglia and myelination in autism spectrum disorder. Front. Cell. Neurosci. 12, 482. Frontiers Media S.A. doi:10.3389/fncel.2018.00482
Sheth, S., Brito, R., Mukherjea, D., Rybak, L. P., and Ramkumar, V. (2014). Adenosine receptors: expression, function and regulation. Int. J. Mol. Sci. 15, 2024–2052. doi:10.3390/ijms15022024
Shi, H., Luo, J., Zhu, J., Li, J., Sun, Y., Lin, X., et al. (2013). PPAR γ regulates genes involved in triacylglycerol synthesis and secretion in mammary gland epithelial cells of dairy goats. PPAR Res. 2013, 310948. doi:10.1155/2013/310948
Souza, B. J. de, Mendes, M. A., Sperandio, da S. G. M., Sammarco-Rosa, P., Moraes, M. O. de, Jardim, M. R., et al. (2022). Gene expression profile of Mycobacterium leprae contribution in the Pathology of leprosy neuropathy. Front. Med. (Lausanne) 9, 861586. doi:10.3389/fmed.2022.861586
Souza, R. da C., Louvain de Souza, T., Ferreira, C. dos S., Nascimento, L. S., Nahn, E. P., and Peixoto-Rangel, A. L. (2021). Associations between the purinergic receptor P2X7 and leprosy disease. Front. Genet. 12, 730991. doi:10.3389/fgene.2021.730991
Tapinos, N., and Rambukkana, A. (2005). Insights into regulation of human Schwann cell proliferation by Erk12 via a MEK-independent and p56Lck-dependent pathway from leprosy bacilli. PNAS 102, 9188–9193. doi:10.1073/pnas.0501196102
Trombone, A. P. F., Pedrini, S. C. B., Diório, S. M., Belone, A. de F. F., Fachin, L. R. V., do Nascimento, D. C., et al. (2014). Optimized protocols for Mycobacterium leprae strain management: frozen stock preservation and maintenance in athymic nude mice. J. Vis. Exp. (85), 50620. doi:10.3791/50620
Visentin, S., De Nuccio, C., Bernardo, A., Pepponi, R., Ferrante, A., Minghetti, L., et al. (2013). The stimulation of adenosine A2A receptors ameliorates the pathological phenotype of fibroblasts from Niemann-Pick type C patients. J. Neurosci. 33 (39), 15388–15393. doi:10.1523/JNEUROSCI.0558-13.2013
Voloshyna, I., Carsons, S., Littlefield, M. J., Rieger, J. M., Figler, R., and Reiss, A. B. (2013). Adenosine A(2A) receptor activation supports an atheroprotective cholesterol balance in human macrophages and endothelial cells. Biochim. Biophys. Acta 1831 (2), 407–416. doi:10.1016/j.bbalip.2012.11.005
Welihinda, A. A., Kaur, M., Greene, K., Zhai, Y., and Amento, E. P. (2016). The adenosine metabolite inosine is a functional agonist of the adenosine A2A receptor with a unique signaling bias. Cell Signal 28 (6), 552–560. doi:10.1016/j.cellsig.2016.02.010
Welsh, T. G., and Kucenas, S. (2018). Purinergic signaling in oligodendrocyte development and function. J. Neurochem. 145, 6–18. Blackwell Publishing Ltd. doi:10.1111/jnc.14315
Wen, A. Y., Sakamoto, K. M., and Miller, L. S. (2010). The role of the transcription factor CREB in immune function. J. Immunol. 185 (11), 6413–6419. doi:10.4049/jimmunol.1001829
Wong, A., and Sakamoto, K. M. (1995). Granulocyte-macrophage colony-stimulating factor induces the transcriptional activation of egr-1 through a protein kinase A-independent signaling pathway. J. Biol. Chem. 270 (51), 30271–30273. doi:10.1074/jbc.270.51.30271
Yang, Y., Wang, H., Lv, X., Wang, Q., Zhao, H., Yang, F., et al. (2015). Involvement of cAMP-PKA pathway in adenosine A1 and A2A receptor-mediated regulation of acetaldehyde-induced activation of HSCs. Biochimie 115, 59–70. doi:10.1016/j.biochi.2015.04.019
Yasuda, N., Inoue, T., Horizoe, T., Nagata, K., Minami, H., Kawata, T., et al. (2003). Functional characterization of the adenosine receptor contributing to glycogenolysis and gluconeogenesis in rat hepatocytes. Eur. J. Pharmacol. 459 (2-3), 159–166. doi:10.1016/s0014-2999(02)02832-7
Yilmaz, Ö., Morandini, A. C., Dugoni, A. A., Sater, A. A., Petit-Jentreau, L., Tailleux, L., et al. (2017). Purinergic signaling: a common path in the macrophage response against Mycobacterium tuberculosis and Toxoplasma gondii. Front. Cell. Infect. Microbiol. 1, 347. doi:10.3389/fcimb.2017.00347
Yoon, Y. S., Liu, W., Van de Velde, S., Matsumura, S., Wiater, E., Huang, L., et al. (2021). Activation of the adipocyte CREB/CRTC pathway in obesity. Commun. Biol. 4 (1), 1214. doi:10.1038/s42003-021-02735-5
Keywords: Leprosy, schwann cell, M. leprae, adenosinergic system, A2A receptor, lipid droplet, bacterial viability
Citation: dos Santos PMF, Díaz Acosta CC, Rosa TLSA, Ishiba MH, Dias AA, Pereira AMR, Gutierres LD, Pereira MP, da Silva Rocha M, Rosa PS, Bertoluci DFF, Meyer-Fernandes JR, da Mota Ramalho Costa F, Marques MAM, Belisle JT, Pinheiro RO, Rodrigues LS, Pessolani MCV and Berrêdo-Pinho M (2024) Adenosine A2A receptor as a potential regulator of Mycobacterium leprae survival mechanisms: new insights into leprosy neural damage. Front. Pharmacol. 15:1399363. doi: 10.3389/fphar.2024.1399363
Received: 11 March 2024; Accepted: 15 May 2024;
Published: 28 June 2024.
Edited by:
Anna Lisa Giuliani, University of Ferrara, ItalyReviewed by:
Shanu Jain, Indian Institute of Technology Kanpur, IndiaCopyright © 2024 dos Santos, Díaz Acosta, Rosa, Ishiba, Dias, Pereira, Gutierres, Pereira, da Silva Rocha, Rosa, Bertoluci, Meyer-Fernandes, da Mota Ramalho Costa, Marques, Belisle, Pinheiro, Rodrigues, Pessolani and Berrêdo-Pinho. This is an open-access article distributed under the terms of the Creative Commons Attribution License (CC BY). The use, distribution or reproduction in other forums is permitted, provided the original author(s) and the copyright owner(s) are credited and that the original publication in this journal is cited, in accordance with accepted academic practice. No use, distribution or reproduction is permitted which does not comply with these terms.
*Correspondence: Marcia Berrêdo-Pinho, bWJlcnJlZG9AaW9jLmZpb2NydXouYnI=
Disclaimer: All claims expressed in this article are solely those of the authors and do not necessarily represent those of their affiliated organizations, or those of the publisher, the editors and the reviewers. Any product that may be evaluated in this article or claim that may be made by its manufacturer is not guaranteed or endorsed by the publisher.
Research integrity at Frontiers
Learn more about the work of our research integrity team to safeguard the quality of each article we publish.