
95% of researchers rate our articles as excellent or good
Learn more about the work of our research integrity team to safeguard the quality of each article we publish.
Find out more
ORIGINAL RESEARCH article
Front. Pharmacol. , 17 April 2024
Sec. Translational Pharmacology
Volume 15 - 2024 | https://doi.org/10.3389/fphar.2024.1378034
 Kun Mi1,2
 Lei Sun1,2
 Lan Zhang1,3Aoran Tang2,3Xiaoyuan Tian1,3Yixuan Hou2,3Lingling Sun3
 Lingli Huang1,2,3*
Introduction: Streptococcus suis (S. suis) is a zoonotic pathogen threatening public health. Aditoprim (ADP), a novel veterinary medicine, exhibits an antibacterial effect against S. suis. In this study, a physiologically based pharmacokinetic/pharmacodynamic (PBPK/PD) model was used to determine the dosage regimens of ADP against S. suis and withdrawal intervals.
Methods: The PBPK model of ADP injection can predict drug concentrations in plasma, liver, kidney, muscle, and fat. A semi-mechanistic pharmacodynamic (PD) model, including susceptible subpopulation and resistant subpopulation, is successfully developed by a nonlinear mixed-effect model to evaluate antibacterial effects. An integrated PBPK/PD model is conducted to predict the time-course of bacterial count change and resistance development under different ADP dosages.
Results: ADP injection, administrated at 20 mg/kg with 12 intervals for 3 consecutive days, can exert an excellent antibacterial effect while avoiding resistance emergence. The withdrawal interval at the recommended dosage regimen is determined as 18 days to ensure food safety.
Discussion: This study suggests that the PBPK/PD model can be applied as an effective tool for the antibacterial effect and safety evaluation of novel veterinary drugs.
Aditoprim {ADP, 5-[(4-dimethylamino-3,5-dimethoxy-phenyl)methyl] pyrimidine -2,4-diamine}, belonging to diaminopyrimidines, can perform excellent antibacterial effects on Gram-positive and Gram-negative pathogens of swines (Cheng et al., 2017; Wang et al., 2022). The antimicrobial mechanism of ADP is the same as its structural analogs, such as trimethoprim (TMP) and diaveridine (DVD), which can block the folic acid synthesis of sensitive bacteria, inhibit bacterial growth, and enhance the antibacterial spectrum and antibacterial activity of sulfonamide drugs (Gleckman et al., 1981). ADP has demonstrated efficacy against S. suis (Cheng et al., 2017), a pivotal zoonotic pathogen in China, which has resulted in bacterial meningitis affecting thousands of humans (Feng et al., 2010). An empirical pharmacokinetic/pharmacodynamic (PK/PD) model of ADP against S. suis has been developed for the preclinical application (Qu et al., 2022). Nevertheless, limitations in the empirical PK/PD model have hindered its precision in designing dosage regimens.
(1) The empirical PK model, such as the compartmental model, represents the body as a system of one or more virtual compartments that do not correspond to the physiological and anatomical mechanisms (Fan and de Lannoy, 2014). It cannot extrapolate dose and simulate concentration–time curves in different tissues.
(2) PK/PD parameters played important roles in the determination of dosage regimens in veterinary medicine. The ratio of the area under the curve of plasma concentration to minimum inhibitory concentration (AUC/MIC) and the proportion of time that plasma concentration exceeds the MIC over the dosing interval (T > MIC) are routinely used in the empirical PK/PD model (Toutain et al., 2021). They highly rely on MIC. Measured error and subjective error could induce substantial uncertainty and variability in MIC, and the PK/PD parameter value would also be influenced (Nielsen et al., 2007). Additionally, PK/PD parameters only reflect a point estimate of the effect that ignores the time courses of drug concentration and antibacterial effect.
(3) Lacked evaluation of the safety. The empirical PK/PD model is not available for the assessment of antimicrobial resistance and drug residues.
A physiologically based pharmacokinetic (PBPK) model is characterized by anatomical and biochemical factors, which is a mechanistic approach to simulate the absorption, distribution, metabolism, and elimination of chemicals in the body. It has been applied for dose optimization (Zhou et al., 2021; Mi et al., 2022), food safety assessment of animal-derived food products (Lin et al., 2016; Henri et al., 2017), and chemical risk assessment (Chou and Lin, 2019). The semi-mechanistic PD model can quantify resistance development and bacterial regrowth under drug exposure. The PBPK/PD model, integrated PBPK model, and semi-mechanistic PD model can overcome the shortcomings of the empirical PK/PD model. By sets of mathematical equations, the PBPK/PD model can capture the time course of bacterial count under drug exposure and weaken the influence of MIC and PK/PD parameters. It can simulate the time course of bacterial count change and drug concentration.
The objective of this study is to establish a PBPK/PD model to describe the time course of bacterial count change under drug exposure and determine the preclinical dosage regimen of ADP against S. suis. A populational PBPK model was developed to determine the withdrawal intervals of the preclinical dosages to avoid residue violations and ensure food safety.
The physiological parameters (organ volumes and blood flow rates) of 25 kg of pigs were from the reported literature (Upton, 2008). The pharmacokinetic data used in the calibration and validation of the PBPK model are summarized in Table 1. Two different datasets were used to perform model calibration and validation. The graphic pharmacokinetic data were extracted from selected studies using WebPlotDigitizer (version 3.10, https://automeris.io/WebPlotDigitizer/).
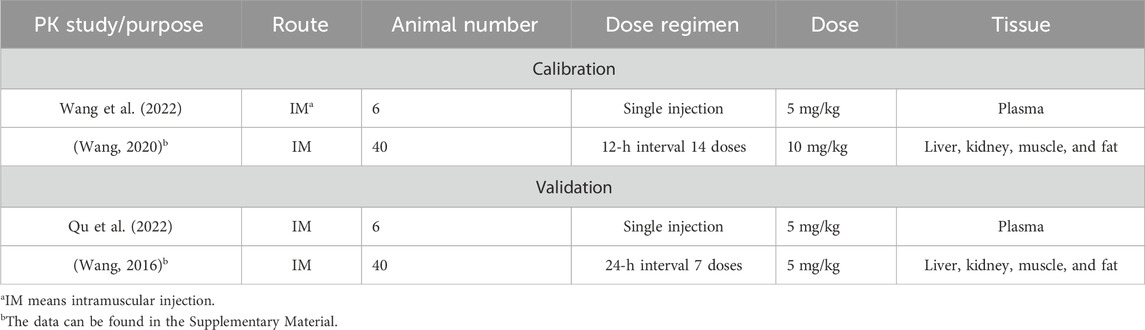
Table 1. Data on ADP pharmacokinetic studies used for the calibration and validation of the PBPK model.
A seven-compartment PBPK model was structured and connected by the blood circulation system (venous blood and arterial blood) (Figure 1A). For food safety assessment, the major edible tissues, including the liver, kidney, muscle, and fat, were modeled as individual compartments. To simplify the model structure, the rest of the body was considered a pooled compartment.
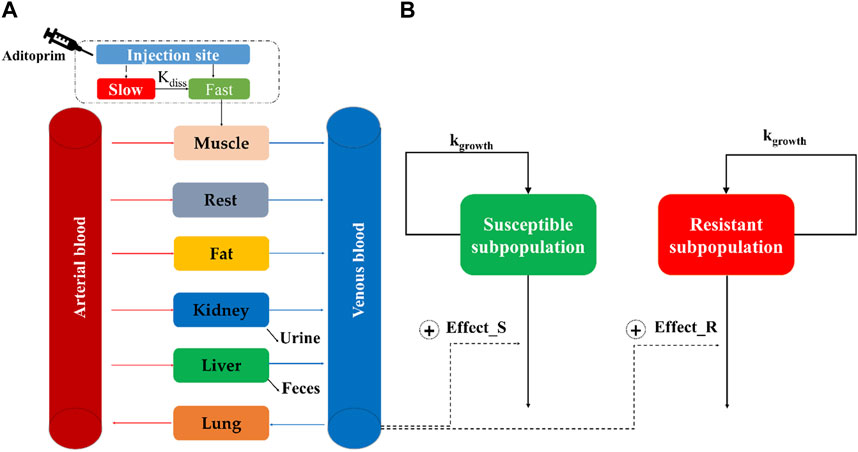
Figure 1. Schematic diagram of the physiologically based pharmacokinetic/pharmacodynamic model for aditoprim against S. suis in swines. The structure of the PBPK model and semi-mechanistic PD model is, respectively, described in (A,B).
A two-compartment model is used to describe the drug absorption into muscle after intramuscular injection (Lin et al., 2017). It was divided into slow absorption and fast absorption at the injection site. As shown in Figure 1A, the injection bolus was assumed to have two steps, namely, fast and slow absorption. Fast absorption was assumed to be homogeneously mixed at the injection site and instantaneously available for absorption into the venous compartment with a first-order process (kim) (Riad et al., 2021). Slow absorption was described as releasing ADP from the injection site at a first-order rate (kdiss) and entering the venous compartment as a fast phase. The excreted tissue is the kidney, and the metabolized tissue is the liver. N-Monodesmethyl-ADP and N-didesmethyl-ADP were found in the tissue; ADP has the highest concentration and the longest duration in tissues, which is regarded as the marker residue. The PBPK model did not describe the metabolism process. Berkeley Madonna (version 8.3.23.0; University of California at Berkeley, CA, United States) was used to develop the PBPK model and run all simulations.
The PBPK model includes two types of PBPK parameters, namely, physiological and chemical-specific parameters. As for chemical-specific parameters, partition coefficients (PCs) in edible tissues were calculated using the AUC method, as AUCtissue/AUCplasma, based on the previous study (Wang et al., 2016). These initial PCs were optimized by the residual data. After the model calibration of ADP in tissues, the initial PCs would adjust to more suitable values.
The excreted rate in the kidney and the metabolized rate in the liver were assumed as a first-order constant rate. The urine elimination and liver metabolism rates were assumed as KurineC and KML, respectively. For intramuscular administration, ADP was absorbed into the blood at a first-order constant rate (Kim) under injection dose (doseim). Drugs were distributed into fast absorption (Frac*doseim) and slow absorption [(1-Frac) *doseim]. In slow absorption, the drug transferred to the state of fast absorption at a constant rate (Kdiss) (Riad et al., 2021). All the initial chemical-specific parameter values were calibrated by the curve fitting module in Berkeley Madonna and further optimized (Xu et al., 2020).
The validation dataset is listed in Table 1. All parameters were not changed from those determined by model calibration. Based on the World Health Organization guidelines (WHO, 2010), if the predictive results matched the kinetic profile of the experimental data and were generally within a two-fold difference of the experimental data, then the model could be successfully established. The goodness of fit between observation and simulation was analyzed by linear regression. The determination coefficient (R2) values were derived from regression analysis, and the model simulation was acceptable if the value of R2 was equal to or higher than 0.75 (Lin et al., 2017). The performance of the PBPK model was assessed by the mean absolute percentage error (MAPE) value, which was less than 50% and considered an acceptable prediction (Yang et al., 2022).
Sensitivity analysis was performed to determine which parameters were important in the selected key model outputs. Each parameter was increased by 10%, and the corresponding AUC24h values of ADP in the liver, kidney, plasma, muscle, and fat were computed. A normalized sensitivity coefficient (NSC) was used to evaluate sensitive parameters, as described in Eq. 1 (Mirfazaelian et al., 2006; Lin et al., 2011).
where r is the response variable (AUCs of ADP in plasma and tissues), Δr is the change in the response variable, p is the original value of the model parameter, and Δp is the 10% change in the parameter value. A parameter was considered sensitive when at least one of the absolute values of the NSCs was greater than or equal to 0.25 (Leavens et al., 2014).
Considering the population variability of model parameters, a populational (pop) PBPK model was established by integrating the PBPK model and Monte Carlo analysis. Only sensitive parameters were subject to Monte Carlo analysis. Log-normal distributions of model parameters were assumed for chemical-specific parameters, such as tissue partition coefficients. Normal distributions were assumed for physiological parameters, such as bodyweight. The distributions within the lower bound (2.5%) and upper bound (97.5%) were described by the model code, as previously introduced (Li et al., 2018). The coefficients of variance (CVs) for chemical-specific parameters and physiological parameters were defined as default values, 30% and 40%, respectively. Monte Carlo analysis was conducted for 1,000 iterations by bath runs in Berkeley Madonna.
The minimum inhibitory concentration of ADP was determined against ATCC 49619, followed by CLSI documents. Time-killing curves of ADP against ATCC 49619 were conducted in triplicate, as previously described (Mi et al., 2022). These datasets were applied to build a semi-mechanistic PD model. Because of bacterial regrowth under ADP exposure, a two-compartment semi-mechanistic PD model was developed, as shown in Figure 1B (Jacobs et al., 2016). This model includes susceptible subpopulation (Eq. 2) and resistant subpopulation (Eq. 3), which are assumed to be regulated by the natural growth rate and kill rate of an antimicrobial drug. The antibacterial effect was modeled by the Emax equation.
where S (CFU/mL) is the bacterial concentration in the susceptible subpopulation; kgrowth, a first-order constant, is described as the bacterial net growth rate. Bmax is the maximum amount of bacteria in the system; Emax (1/h) is the maximum bacteria killed by ADP representing drug efficacy, EC50_S (mg/L) is the concentration of ADP that produces half of the maximum effect of a susceptible subpopulation, γ is a sigmoid coefficient expressing the slope of antimicrobial effect curves and presenting drug sensitivity, and Cstastic is the concentration of ADP at time (t).
where R (CFU/mL) is the bacterial concentration in the resistant subpopulation. EC50_R is assumed as the antibacterial effect on the resistant subpopulation.
The estimations of semi-mechanistic PD parameters were operated by the non-linear mixed-effect analysis (Monolix, version 2018R1, Lixofit, France). Diagnostic plots, such as goodness fit of prediction versus observation, residuals of IPRED (individual prediction) versus the dependent variables, and time, were adopted to determine whether the model is adequate. In addition, visual predictive check (VPC) was used to validate the prediction of the model.
Integrated with the PBPK model and semi-mechanistic PD model to build a PBPK/PD model in Mlxplore (Lixoft version 2018a, France), the predicted dynamic concentrations from the PBPK model replace the static ADP concentration (Cstastic) in the semi-mechanistic PD model. Thereby, time courses of the bacterial count and drug concentration under a variety of drug exposures can be simulated. The efficacy of dosage and the best PK/PD parameters related to bacterial response were assessed by the PBPK/PD model. For food safety, a withdrawal interval is determined by the pop-PBPK model.
PK/PD parameters, which enable a description of the whole-time course of bacterial kill and growth, can be determined in an in silico model (Nielsen and Friberg, 2013). Dose fractions of 0, 2.5, 5, 10, 15, 20, and 25 mg/kg for single administration and twice-daily administration were inputted in the PBPK/PD model. Concentration–time curves of ADP and bacterial count–time curves can be simulated. PK/PD parameters (AUC/MIC and %T > MIC) are directly calculated by the PBPK model (Mi et al., 2023). The cumulative area under the curve of the total bacterial count over 24 h (AUC0-24h (Bacterial count)) was used as a bacteriological effect (Pelligand et al., 2019; Ronaghinia et al., 2021). PK/PD parameters (AUC/MIC and %T > MIC) versus the bacteriological effect, AUC0-24h (Bacterial count), were fitted with an inhibitory sigmoid model (Eq. 4). Curve fitting was performed in Phoenix (version 8.3, Certara, United States), and the best PK/PD parameter related to bacteriological effect was selected.
where E0 was the effect under a drug concentration of zero. The maximum possible observed effect is Imax. INDEX was the value of the PK/PD parameters (AUC24h/MIC or %T > MIC). INDEX50 was the value of AUC24h/MIC or %T > MIC, producing a 50% reduction in Imax, and N was the Hill coefficient that described the steepness of the curve.
By the PBPK/PD model, the time courses of bacterial count can be, respectively, simulated under the dosages of 5, 12.5, 15, and 20 mg/kg twice a day. The bacterial count change curves of the susceptible subpopulation, the resistant subpopulation, and the total are presented. Based on the antibacterial effect, the dosage can be determined.
For food safety assessment, the withdrawal interval needs to be determined. The datasets of 1,000 iterations are simulated by the pop-PBPK model. The concentration–time curves of the 1st percentile, median, and 99th percentile in the liver and kidney were presented. The MRL of ADP in the liver is 0.303 ug/g and in the kidney is 0.084 ug/g (Wang et al., 2016). The 99th percentile curve is used to compare with the maximum residue limits to determine the withdrawal intervals. The time point when the ADP concentration falls under the MRL is selected to determine the withdrawal interval (Li et al., 2017).
Model predictions of ADP concentrations in plasma and edible tissues at different time points after the administration were compared with the observed concentrations for different dosage regimens, as shown in Figure 2.
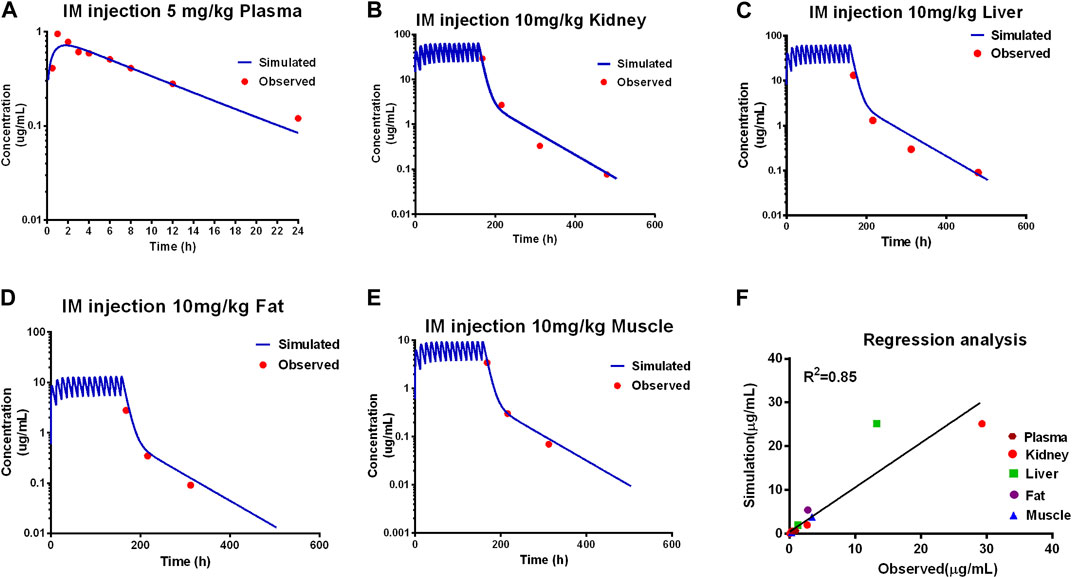
Figure 2. Calibration of the PBPK model. Comparison of model prediction (blue line) and observed data (red dot) in plasma (A) via 5 mg/kg, and in the kidney (B), liver (C), fat (D), and muscle (E) via IM repeated 14 doses at 10 mg/kg. The R2 value was 0.86 of the regression analysis (F).
Comparing the observed concentration of ADP in the plasma, liver, kidney, muscle, and fat with the model prediction from the validation dataset, good consistency between the observed data with model prediction is shown in Figure 3. The goodness of fit was evaluated using the determination coefficients (R2). The value of R2 between measured and simulated concentrations of ADP in edible tissues and plasma was 0.81 for the PBPK model. Except for the predicted concentration at the first time point of fat (6 h after administration) being out of the two-fold difference of observed data, all are within the two-fold difference. For the determination of withdrawal intervals, at the later time points, simulated versus measured concentrations for ADP need to be similar. The liver and kidney are assumed as residual target tissues, and the elimination of ADP in the liver or kidney is slower than that in other tissues (Wang et al., 2016). If the model can accurately predict the ADP concentration in the liver and kidney, it can be used in the prediction of withdrawal intervals. The results of MAPE show that the prediction of ADP in plasma and edible tissues, in addition to fat, is acceptable (Supplementary Figure S1).
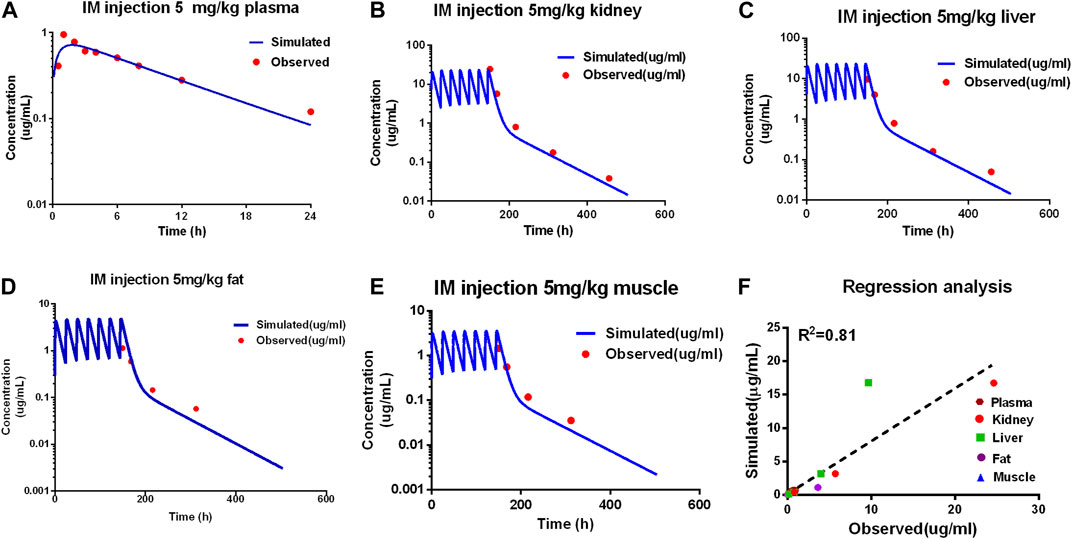
Figure 3. Evaluation of the PBPK model. Comparison of model prediction (blue line) and observed data (red dot) in plasma (A) via 5 mg/kg, and in the kidney (B), liver (C), fat (D), and muscle (E) via IM repeated 7 doses at 5 mg/kg. The R2 value was 0.81 of the regression analysis (F).
Overall, the PBPK model can accurately describe the kinetic of ADP concentrations in tissues and plasma. The PBPK parameters are shown in Table 2.
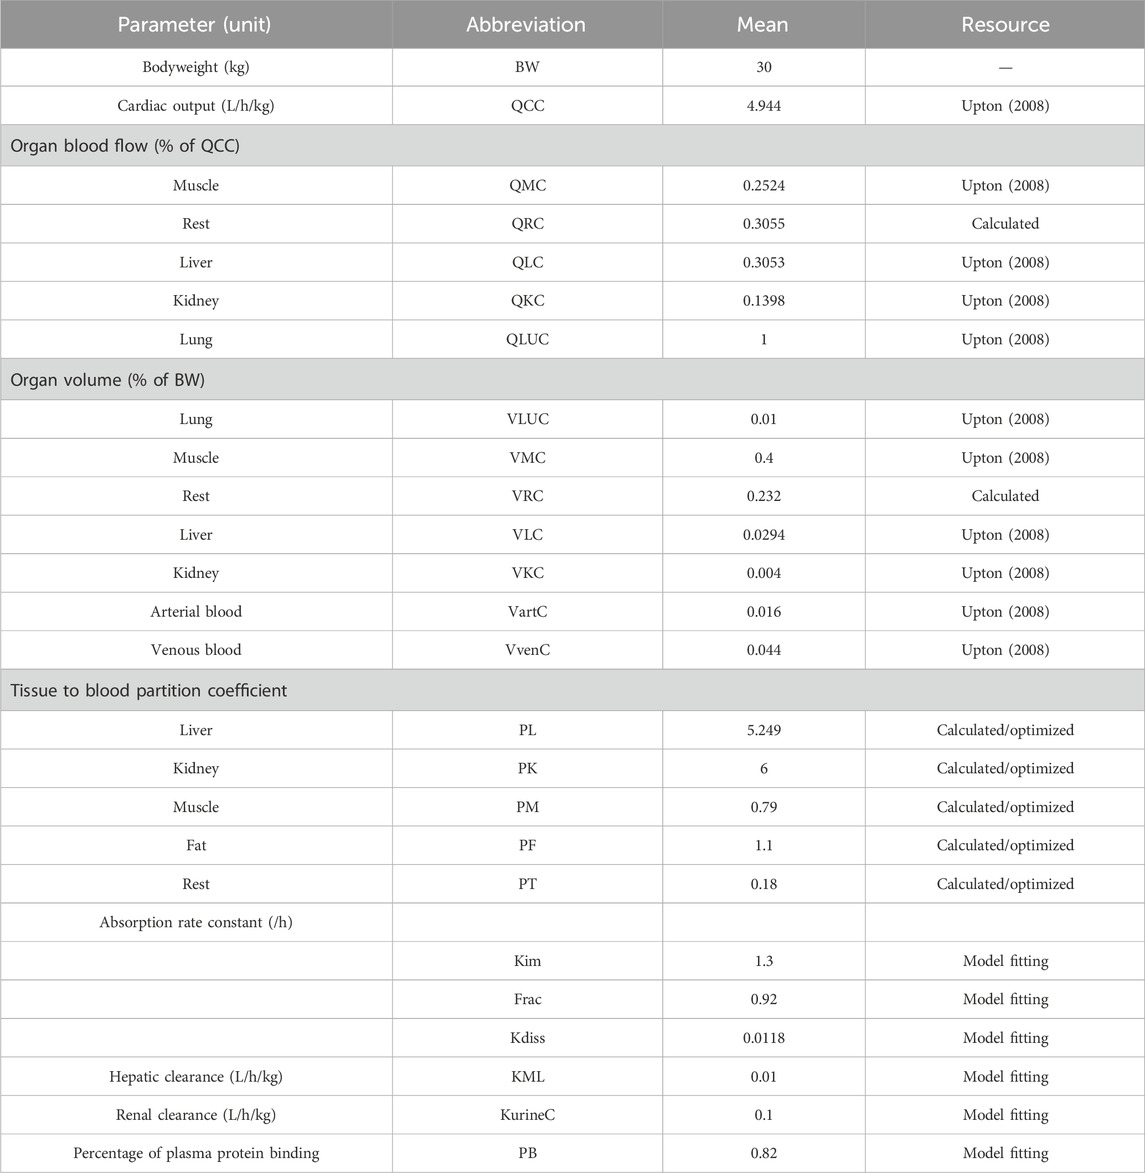
Table 2. Physiological parameters of swines and chemical-specific parameters of ADP used in the PBPK model.
The AUCs were insensitive to all physiological parameters. The AUCs of ADP in four edible tissues were positively related to partition coefficients with NSC values of 1. The renal clearance rate (KurineC) and the fraction of the dose allocated to fast absorption (Frac) influence the AUC24h in all edible tissues and plasma. The protein-binding rate only influences the AUC in plasma. All the sensitive parameters described above were included in the Monte Carlo analysis. The values and distributions of parameters used in Monte Carlo analysis are provided in Table 3.
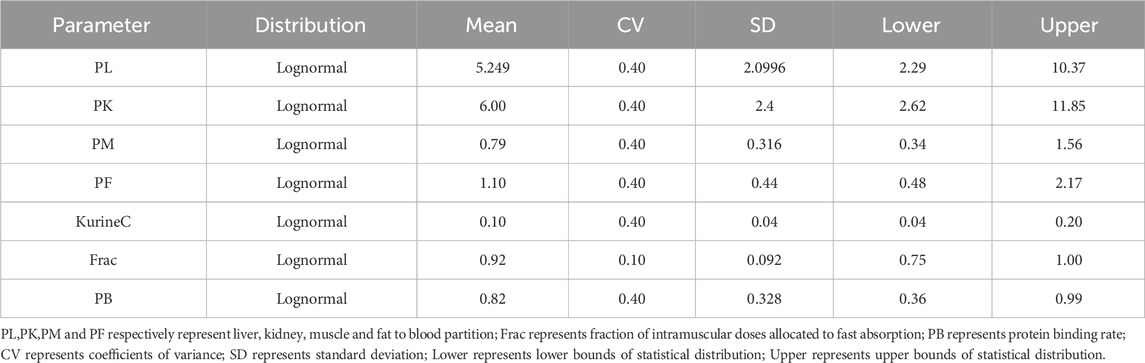
Table 3. Values and distributions of parameters used in Monte Carlo analysis for the PBPK model.
The MIC of ADP against ATCC 49619 is 0.5 ug/mL, followed by CLSI documents (CLSI, 2018). The parameters of the semi-mechanistic PD model are shown in Table 4. The maximum effect of ADP was 1.45 h−1, which was 1.74 folds of the net bacterial growth rate of 0.833 h−1. To achieve half of the maximum effect for the susceptible subpopulation (EC50_S), the ADP concentration needs to reach 0.685 ug/mL. In addition, to achieve half of the maximum effect for the resistant subpopulation (EC50_R), the ADP concentration needs to reach 1.63 ug/mL, which was about 2.5-fold to EC50_S. Model fits for bacterial time courses are shown in Figure 4. For the model evaluation, a core set of diagnostic plots is shown in Supplementary Material.
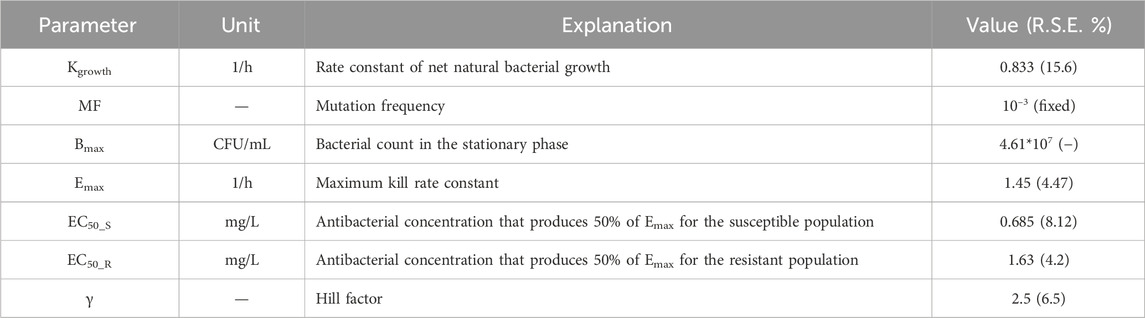
Table 4. Parameters for the semi-mechanistic PD from the time-killing curves of ADP against S. suis.
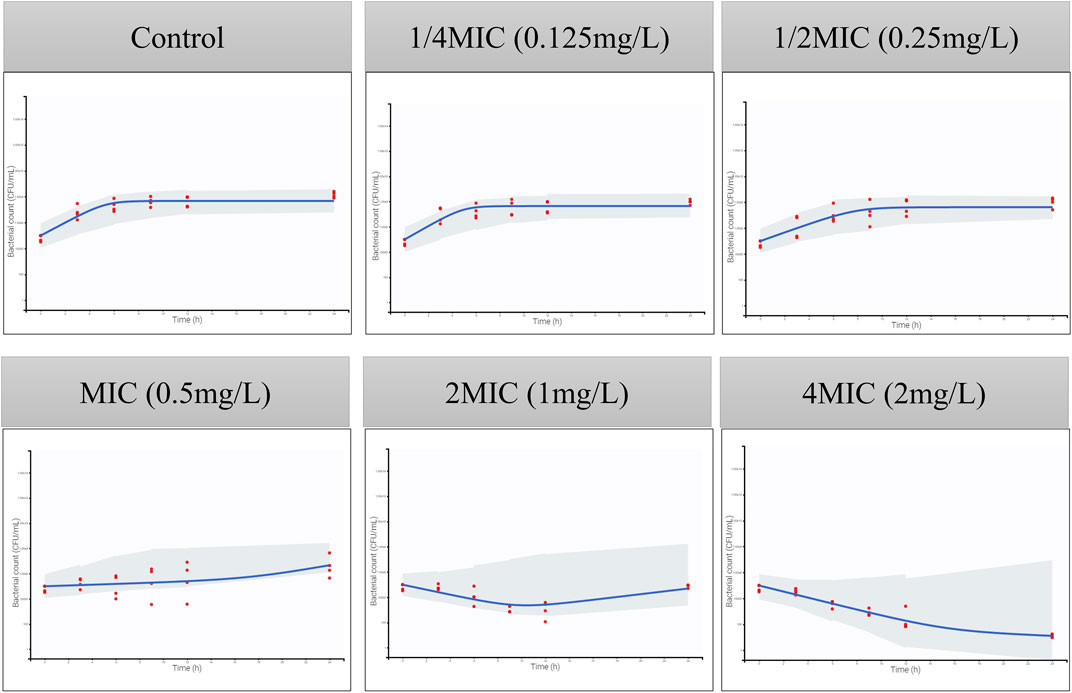
Figure 4. Visual predictive checks for the bacterial count in time-killing curves. The red circles correspond to the observed data, while the blue lines correspond to the median simulated data. The shaded area corresponds to the 95% confidence interval (CI) around the simulated median data. The y-axis represents the Log10 bacterial count (CFU/mL), and the x-axis represents time (h).
The PBPK/PD model is applied to simulate the time courses of the bacterial count under different dosages, which are shown in Supplementary Result. T > MIC and AUC/MIC of different dosage regimens were calculated by the PBPK model. The PK/PD relationship between PK/PD parameters and AUC0-24h (Bacterial count) was conducted in Phoenix, and the PK/PD relationships are shown in Figure 5. The goodness-of-fit values were better for fAUC/MIC (r2 = 0.99) than for f T > MIC (r2 = 0.98). Similar to the result of the empirical PK/PD model (Qu et al., 2022), AUC/MIC is also the best PK/PD parameter.
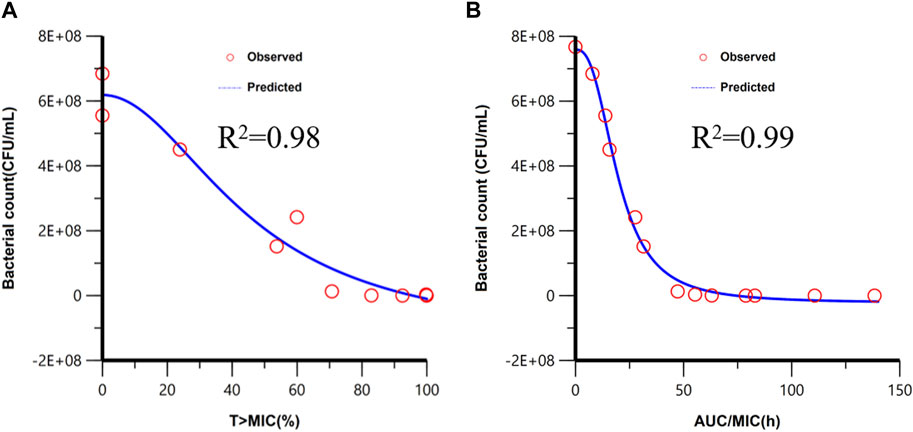
Figure 5. Fitting of the Imax sigmoid model for the bacteriological effect [AUC0-24h (bacterial count)] with T > MIC (A) and AUC/MIC (B). Red circles are the AUC0-24h (bacterial count) values under different dose exposure.
The time courses of different bacterial subpopulations, total, susceptible subpopulation, and resistant subpopulation were simulated under different dosage regimens. As shown in Figure 6, while the dose was 5 mg/kg, the susceptible subpopulation gradually decreased and the resistant subpopulation increased, after 48-h time points, almost a resistant subpopulation in the total bacterial system. The dose of 12.5 mg/kg can accomplish the bacteriostat action. The dose of 15 mg/kg can reach the bacterial reduction of approximately 3-log10 CFU/mL and inhibit the growth of resistant subpopulations. At an ADP dose of 20 mg/kg, the susceptible and resistant subpopulations rapidly declined after being twice administered, and bacteria were eliminated.
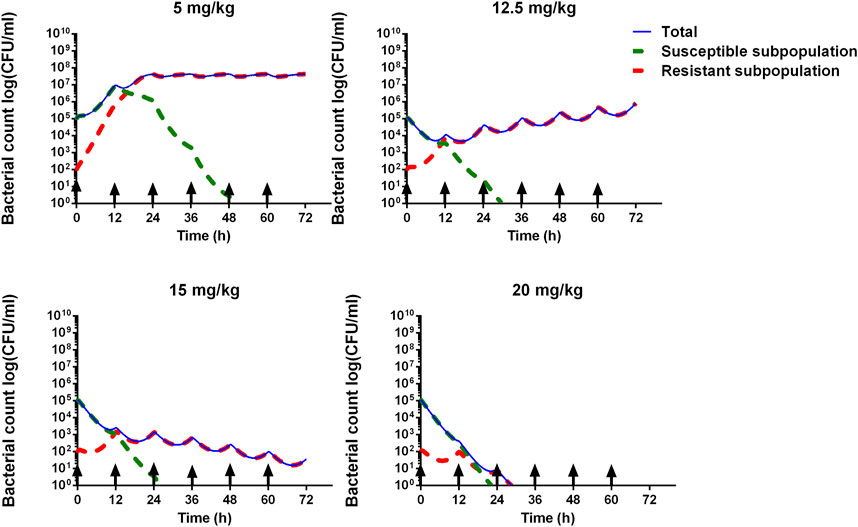
Figure 6. Model prediction of S. suis for different ADP doses (5, 12.5, 15, and 20 mg/kg) with 12 administrated intervals for 3 consecutive days. The blue line represents the total bacterial count. The green dashed line represents the susceptible subpopulation. The red dashed line represents the resistant subpopulation. The black arrow means administered time.
The residual depletion rates in the kidney and liver are the slowest, and they are selected as target residual tissues. Concentration–time curves of 1,000 iterations in the kidney and liver were simulated. The median and 1st and 99th percentiles of 1,000 iterations were selected and are shown in Figure 7. The MRL of ADP in swine has been investigated previously (Wang et al., 2016); in the liver it is 0.303 ug/g, and in the kidney, it is 0.084 ug/g. Compared with MRL, the WDI is conservatively determined to be 12.6 days in the liver and 17.4 days in the kidney. Note that if the estimated WDI was a fraction of a day, it was rounded up to the next whole day. Therefore, the WDI after 20 mg/kg with 12 intervals for 3 consecutive days is 18 days.
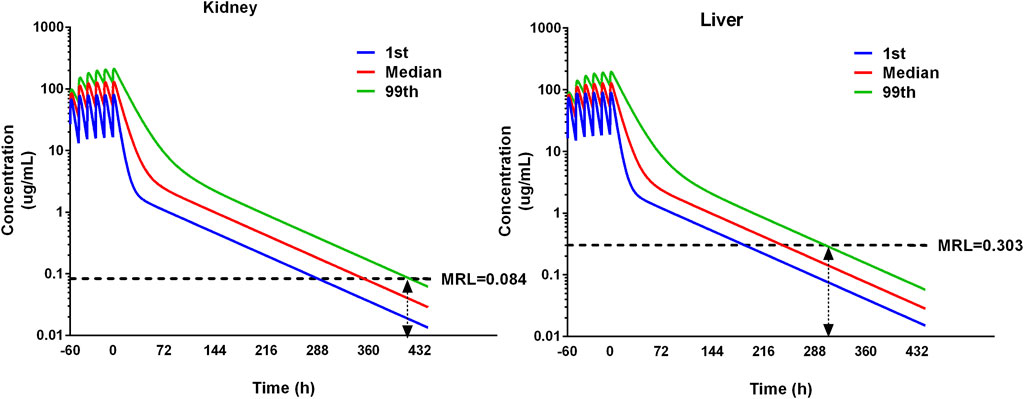
Figure 7. Simulation of ADP concentrations in the kidney and liver using the pop-PBPK model. The dose regimen is 20 mg/kg with 12 intervals for 3 consecutive days. The median and 1st and 99th percentiles of simulated results were plotted. The maximum residual limitation (MRL) is shown on each tissue using black dash lines. The withdrawal intervals were determined when the concentration in different tissues is below MRL for the 99th percentile of the population. The double arrow means the concentration at that time point is below the MRL.
S. suis is the highest isolated common bacterial pathogen in Chinese pig farms (Zhang et al., 2019). Given its virulence in humans and animals, it poses a significant threat to public health. Our group has successfully developed an empirical PK/PD model to determine PK/PD parameters for various antibacterial effects and dosage regimens of ADP injection against S. suis. However, the empirical PK/PD model exhibited several limitations, as mentioned above. In this manuscript, we have further adopted a PBPK/PD model to determine an optimized dosage of ADP and a withdrawal interval.
The PBPK model is a mechanism-based simulation process that describes the absorption, distribution, metabolism, and elimination of drugs in the body by considering the relationship among physiological, biochemistry, anatomical, and compound properties. In recent years, PBPK models have been widely used in various fields, including drug discovery and development (Rowland et al., 2011; Jones et al., 2015), risk assessment of environmental chemicals (Lu et al., 2016; Tan et al., 2018), safety assessment of animal-derived food products (Lin et al., 2016; Henri et al., 2017), and residue prediction of veterinary drugs in various edible tissues (Viel et al., 2023). The advantages of PBPK models in the prediction of drug residues in edible tissues in a diverse population of food animals make them an ideal tool in veterinary drug residue monitoring. In the current study, the PBPK model is calibrated and validated with two independent datasets. Based on the result of model evaluation including the visual comparison between the observed and predicted data, R2, and RMSE, the prediction of the PBPK model is acceptable and reliable. By inserting Monte Carlo analysis into the PBPK model, a pop-PBPK model can be developed and applied to predict the drug concentration in 1,000 virtual animals, and the withdrawal interval can be determined.
The semi-mechanistic PD model was established by mathematical equations to capture the time-killing curves and elucidate bacterial growth, bacterial death, and antibacterial effects under antibiotic exposure. It can integrate with the PBPK model to develop the PBPK/PD model. A PBPK/PD model of ceftiofur against Pasteurella multocida was established to validate the dosage regimen (Mi et al., 2022). A whole-body PBPK/PD model of ciprofloxacin was developed to predict the antibacterial effect in different tissues (Sadiq et al., 2017). In addition, it was also applied to the definition of the PK/PD breakpoint (Iqbal et al., 2020). Upon examining the time-killing curves of ADP against S. suis, bacterial regrowth was observed (Figure 4). A model consisting of susceptible and resistant subpopulations was adopted. The value of EC50 is used to describe the sensitivity of different subpopulations to ADP. The EC50_S is smaller than EC50_R, which means it is more easily killed by antimicrobial agents. Based on the goodness of fit, residual plots, and VPC, the semi-mechanistic PD model can describe the time courses of bacterial growth under ADP exposure.
The PBPK/PD model was integrated with the PBPK model and semi-mechanistic PD model, and it can simulate bacterial growth under ADP exposure. ADP was determined at a dose of 4.1 mg/kg against S. suis by the empirical PK/PD model. However, in our paper, by the PBPK/PD model, S. suis cannot be eradicated, and the resistant subpopulation is still alive under a dose of 5 mg/kg/12 h (Figure 6). The dose of 20 mg/kg is much better because it can perform antibacterial effects and inhibit resistance. ADP has turned out to be less toxic and not mutagenic (Wang et al., 2015a; Wang et al., 2015b). The preclinical study has stated that ADP can perform an antibacterial effect on swine Streptococcus (Cheng et al., 2017). Given its status as a novel veterinary drug, further clinical development, specifically in phases II and III, is imperative.
In this study, we adopt a model-informed drug development (MIDD) approach to determine the dose that was employed in the clinical trial. In addition, it is expected to apply the hollow fiber infectious model to monitor the resistance change under drug exposure, which can support clinical usage.
The original contributions presented in the study are included in the article/Supplementary Material; further inquiries can be directed to the corresponding author.
KM: conceptualization, methodology, writing–review and editing, software, and writing–original draft. LS: methodology, writing–review and editing, and data curation. LZ: data curation, methodology, and writing–review and editing. AT: methodology and writing–review and editing. XT: writing–review and editing and software. YH: writing–review and editing, data curation, and formal analysis. LS: data curation, formal analysis, and writing–review and editing. LH: writing–review and editing, conceptualization, methodology, and project administration.
The author(s) declare that financial support was received for the research, authorship, and/or publication of this article. LH received funding from the National Key Research and Development Program (2023YFD180090104) and the National Natural Science Foundation of China (32273063).
The authors declare that the research was conducted in the absence of any commercial or financial relationships that could be construed as a potential conflict of interest.
All claims expressed in this article are solely those of the authors and do not necessarily represent those of their affiliated organizations, or those of the publisher, the editors, and the reviewers. Any product that may be evaluated in this article, or claim that may be made by its manufacturer, is not guaranteed or endorsed by the publisher.
The Supplementary Material for this article can be found online at: https://www.frontiersin.org/articles/10.3389/fphar.2024.1378034/full#supplementary-material
Cheng, G., Xu, Y., Zhu, X., Xie, S., Wang, L., Huang, L., et al. (2017). The antibacterial activities of aditoprim and its efficacy in the treatment of swine streptococcosis. Sci. Rep. 7, 41370. doi:10.1038/srep41370
Chou, W. C., and Lin, Z. (2019). Bayesian evaluation of a physiologically based pharmacokinetic (PBPK) model for perfluorooctane sulfonate (PFOS) to characterize the interspecies uncertainty between mice, rats, monkeys, and humans: development and performance verification. Environ. Int. 129, 408–422. doi:10.1016/j.envint.2019.03.058
CLSI (2018). Performance standards for antimicrobial disk and dilution susceptibility tests for bacteria isolated from animals. 4th Edn. Dubai, United Arab Emirates: Clinical and Laboratory Standards Institute.
Fan, J., and De Lannoy, I. A. (2014). Pharmacokinetics. Biochem. Pharmacol. 87, 93–120. doi:10.1016/j.bcp.2013.09.007
Feng, Y., Zhang, H., Ma, Y., and Gao, G. F. (2010). Uncovering newly emerging variants of Streptococcus suis, an important zoonotic agent. Trends Microbiol. 18, 124–131. doi:10.1016/j.tim.2009.12.003
Gleckman, R., Blagg, N., and Joubert, D. W. (1981). Trimethoprim: mechanisms of action, antimicrobial activity, bacterial resistance, pharmacokinetics, adverse reactions, and therapeutic indications. Pharmacotherapy 1, 14–20. doi:10.1002/j.1875-9114.1981.tb03548.x
Henri, J., Carrez, R., Meda, B., Laurentie, M., and Sanders, P. (2017). A physiologically based pharmacokinetic model for chickens exposed to feed supplemented with monensin during their lifetime. J. Vet. Pharmacol. Ther. 40, 370–382. doi:10.1111/jvp.12370
Iqbal, K., Broeker, A., Nowak, H., Rahmel, T., Nussbaumer-Pröll, A., Österreicher, Z., et al. (2020). A pharmacometric approach to define target site-specific breakpoints for bacterial killing and resistance suppression integrating microdialysis, time-kill curves and heteroresistance data: a case study with moxifloxacin. Clin. Microbiol. Infect. 26, 1255.e1251–1255. doi:10.1016/j.cmi.2020.02.013
Jacobs, M., Grégoire, N., Couet, W., and Bulitta, J. B. (2016). Distinguishing antimicrobial models with different resistance mechanisms via population pharmacodynamic modeling. PLoS Comput. Biol. 12, e1004782. doi:10.1371/journal.pcbi.1004782
Jones, H. M., Chen, Y., Gibson, C., Heimbach, T., Parrott, N., Peters, S. A., et al. (2015). Physiologically based pharmacokinetic modeling in renal and hepatic impairment populations: a pharmaceutical industry perspective. Clin. Pharmacol. Ther. 97, 297–310. doi:10.1002/cpt.2125
Leavens, T. L., Tell, L. A., Kissell, L. W., Smith, G. W., Smith, D. J., Wagner, S. A., et al. (2014). Development of a physiologically based pharmacokinetic model for flunixin in cattle (Bos taurus). Food Addit. Contam. Part A 31, 1506–1521. doi:10.1080/19440049.2014.938363
Li, M., Gehring, R., Riviere, J. E., and Lin, Z. (2017). Development and application of a population physiologically based pharmacokinetic model for penicillin G in swine and cattle for food safety assessment. Food Chem. Toxicol. 107, 74–87. doi:10.1016/j.fct.2017.06.023
Li, M., Gehring, R., Riviere, J. E., and Lin, Z. (2018). Probabilistic physiologically based pharmacokinetic model for penicillin G in milk from dairy cows following intramammary or intramuscular administrations. Toxicol. Sci. 164, 85–100. doi:10.1093/toxsci/kfy067
Lin, Z., Fisher, J. W., Ross, M. K., and Filipov, N. M. (2011). A physiologically based pharmacokinetic model for atrazine and its main metabolites in the adult male C57BL/6 mouse. Toxicol. Appl. Pharmacol. 251, 16–31. doi:10.1016/j.taap.2010.11.009
Lin, Z., Gehring, R., Mochel, J. P., Lave, T., and Riviere, J. E. (2016). Mathematical modeling and simulation in animal health - Part II: principles, methods, applications, and value of physiologically based pharmacokinetic modeling in veterinary medicine and food safety assessment. J. Vet. Pharmacol. Ther. 39, 421–438. doi:10.1111/jvp.12311
Lin, Z., Jaberi-Douraki, M., He, C., Jin, S., Yang, R. S. H., Fisher, J. W., et al. (2017). Performance assessment and translation of physiologically based pharmacokinetic models from acslX to Berkeley Madonna, MATLAB, and R language: oxytetracycline and gold nanoparticles as case examples. Toxicol. Sci. 158, 23–35. doi:10.1093/toxsci/kfx070
Lu, J., Goldsmith, M. R., Grulke, C. M., Chang, D. T., Brooks, R. D., Leonard, J. A., et al. (2016). Developing a physiologically-based pharmacokinetic model knowledgebase in support of provisional model construction. Plos Comput. Biol. 12, e1004495. doi:10.1371/journal.pcbi.1004495
Mi, K., Pu, S., Hou, Y., Sun, L., Zhou, K., Ma, W., et al. (2022). Optimization and validation of dosage regimen for ceftiofur against Pasteurella multocida in swine by physiological based pharmacokinetic-pharmacodynamic model. Int. J. Mol. Sci. 23, 3722. doi:10.3390/ijms23073722
Mi, K., Sun, L., Hou, Y., Cai, X., Zhou, K., Ma, W., et al. (2023). A physiologically based pharmacokinetic model to optimize the dosage regimen and withdrawal time of cefquinome in pigs. PLoS Comput. Biol. 19, e1011331. doi:10.1371/journal.pcbi.1011331
Mirfazaelian, A., Kim, K. B., Anand, S. S., Kim, H. J., Tornero-Velez, R., Bruckner, J. V., et al. (2006). Development of a physiologically based pharmacokinetic model for deltamethrin in the adult male Sprague-Dawley rat. Toxicol. Sci. 93, 432–442. doi:10.1093/toxsci/kfl056
Nielsen, E. I., and Friberg, L. E. (2013). Pharmacokinetic-pharmacodynamic modeling of antibacterial drugs. Pharmacol. Rev. 65, 1053–1090. doi:10.1124/pr.111.005769
Nielsen, E. I., Viberg, A., Löwdin, E., Cars, O., Karlsson, M. O., and Sandström, M. (2007). Semimechanistic pharmacokinetic/pharmacodynamic model for assessment of activity of antibacterial agents from time-kill curve experiments. Antimicrob. Agents Chemother. 51, 128–136. doi:10.1128/AAC.00604-06
Pelligand, L., Lees, P., Sidhu, P. K., and Toutain, P. L. (2019). Semi-mechanistic modeling of florfenicol time-kill curves and in silico dose fractionation for calf respiratory pathogens. Front. Microbiol. 10, 1237. doi:10.3389/fmicb.2019.01237
Qu, W., Dong, M., Pan, Y., Xie, S., Yuan, Z., and Huang, L. (2022). Preparation of aditoprim injection against Streptococcus suis in pigs and a dose regimen based on pharmacokinetic-pharmacodynamic modeling. Pharmaceutics 14, 730. doi:10.3390/pharmaceutics14040730
Riad, M. H., Baynes, R. E., Tell, L. A., Davis, J. L., Maunsell, F. P., Riviere, J. E., et al. (2021). Development and application of an interactive physiologically based pharmacokinetic (iPBPK) model to predict oxytetracycline tissue distribution and withdrawal intervals in market-age sheep and goats. Toxicol. Sci. 183, 253–268. doi:10.1093/toxsci/kfab095
Ronaghinia, A. A., Birch, J. M., Frandsen, H. L., Toutain, P. L., Damborg, P., and Struve, T. (2021). Evaluating a tylosin dosage regimen for treatment of Staphylococcus delphini infection in mink (Neovison vison): a pharmacokinetic-pharmacodynamic approach. Vet. Res. 52, 34. doi:10.1186/s13567-021-00906-0
Rowland, M., Peck, C., and Tucker, G. (2011). Physiologically-based pharmacokinetics in drug development and regulatory science. Annu. Rev. Pharmacol. 51, 45–73. doi:10.1146/annurev-pharmtox-010510-100540
Sadiq, M. W., Nielsen, E. I., Khachman, D., Conil, J. M., Georges, B., Houin, G., et al. (2017). A whole-body physiologically based pharmacokinetic (WB-PBPK) model of ciprofloxacin: a step towards predicting bacterial killing at sites of infection. J. Pharmacokinet. Pharmacodyn. 44, 69–79. doi:10.1007/s10928-016-9486-9
Tan, Y. M., Worley, R., Leonard, J. A., and Fisher, J. (2018). Challenges associated with applying physiologically based pharmacokinetic modeling for public health decision-making. Toxicol. Sci. 162, 341–348. doi:10.1093/toxsci/kfy010
Toutain, P. L., Pelligand, L., Lees, P., Bousquet-Mélou, A., Ferran, A. A., and Turnidge, J. D. (2021). The pharmacokinetic/pharmacodynamic paradigm for antimicrobial drugs in veterinary medicine: recent advances and critical appraisal. J. Vet. Pharmacol. Ther. 44, 172–200. doi:10.1111/jvp.12917
Upton, R. N. (2008). Organ weights and blood flows of sheep and pig for physiological pharmacokinetic modelling. J. Pharmacol. Toxicol. Methods 58, 198–205. doi:10.1016/j.vascn.2008.08.001
Viel, A., Nouichi, A., Le Van Suu, M., Rolland, J. G., Sanders, P., Laurentie, M., et al. (2023). PBPK model to predict marbofloxacin distribution in edible tissues and intestinal exposure in pigs. J. Agric. Food Chem. 71, 4358–4370. doi:10.1021/acs.jafc.2c06561
Wang, F., Luo, W., Pan, Y., Qu, W., Xie, S., Huang, L., et al. (2022). Antibacterial activity of combined aditoprim and sulfamethoxazole against Escherichia coli from swine and a dose regimen based on pharmacokinetic-pharmacodynamic modeling. J. Vet. Pharmacol. Ther. 45, 133–145. doi:10.1111/jvp.13006
Wang, L. (2016). Disposition and residue depletion of aditoprim in pig,chickne,carp and rat. Wuhan, China: Huazhong argicultural university.
Wang, L., Huang, L., Pan, Y., Wu, Q., Xie, S., and Yuan, Z. (2016). Simultaneous determination of aditoprim and its three major metabolites in pigs, broilers and carp tissues, and its application in tissue distribution and depletion studies. Food Addit. Contam. Part A Chem. Anal. Control Expo. Risk Assess. 33, 1299–1311. doi:10.1080/19440049.2016.1200751
Wang, X., Tan, Z., Cheng, G., Awais, I., Huang, L., Chen, D., et al. (2015a). Two-generation reproduction and teratology studies of feeding aditoprim in Wistar rats. J. Appl. Toxicol. 35, 1531–1538. doi:10.1002/jat.3121
Wang, X., Tan, Z., Pan, Y., Ihsan, A., Liu, Q., Huang, L., et al. (2015b). Safety assessment of aditoprim acute, subchronic toxicity and mutagenicity studies. J. Appl. Toxicol. 35, 1415–1426. doi:10.1002/jat.3107
Wang, Y. (2020). The research of residue eliminition and target animal safety for aditoprim unilateral and compound injection in swine. Wuhan, China: Huazhong argicultural university.
WHO (2010). Characterization and application of physiologically based phar-macokinetic models in risk assessment. Geneva, Switzerland: World Health Organization, 1–97.
Xu, N., Li, M., Chou, W. C., and Lin, Z. (2020). A physiologically based pharmacokinetic model of doxycycline for predicting tissue residues and withdrawal intervals in grass carp (Ctenopharyngodon idella). Food Chem. Toxicol. 137, 111127. doi:10.1016/j.fct.2020.111127
Yang, F., Liu, D., Yang, C., Song, Z. W., Shao, H. T., Zhang, M., et al. (2022). Development and application of a physiologically based pharmacokinetic model for orbifloxacin in crucian carp (Carassius auratus). J. Vet. Pharmacol. Ther. 45, 311–319. doi:10.1111/jvp.13049
Zhang, B., Ku, X., Yu, X., Sun, Q., Wu, H., Chen, F., et al. (2019). Prevalence and antimicrobial susceptibilities of bacterial pathogens in Chinese pig farms from 2013 to 2017. Sci. Rep. 9, 9908. doi:10.1038/s41598-019-45482-8
Keywords: PBPK model, semi-mechanistic PD model, aditoprim, Streptococcus suis, dosage regimen, withdrawal interval
Citation: Mi K, Sun L, Zhang L, Tang A, Tian X, Hou Y, Sun L and Huang L (2024) A physiologically based pharmacokinetic/pharmacodynamic model to determine dosage regimens and withdrawal intervals of aditoprim against Streptococcus suis. Front. Pharmacol. 15:1378034. doi: 10.3389/fphar.2024.1378034
Received: 29 January 2024; Accepted: 26 March 2024;
Published: 17 April 2024.
Edited by:
Yurong Lai, Gilead, United StatesReviewed by:
Marios Spanakis, University of Crete, GreeceCopyright © 2024 Mi, Sun, Zhang, Tang, Tian, Hou, Sun and Huang. This is an open-access article distributed under the terms of the Creative Commons Attribution License (CC BY). The use, distribution or reproduction in other forums is permitted, provided the original author(s) and the copyright owner(s) are credited and that the original publication in this journal is cited, in accordance with accepted academic practice. No use, distribution or reproduction is permitted which does not comply with these terms.
*Correspondence: Lingli Huang, aHVhbmdsaW5nbGlAbWFpbC5oemF1LmVkdS5jbg==
Disclaimer: All claims expressed in this article are solely those of the authors and do not necessarily represent those of their affiliated organizations, or those of the publisher, the editors and the reviewers. Any product that may be evaluated in this article or claim that may be made by its manufacturer is not guaranteed or endorsed by the publisher.
Research integrity at Frontiers
Learn more about the work of our research integrity team to safeguard the quality of each article we publish.