 Yang Songtao
 Li Fangyu†
95% of researchers rate our articles as excellent or good
Learn more about the work of our research integrity team to safeguard the quality of each article we publish.
Find out more
ORIGINAL RESEARCH article
Front. Pharmacol. , 15 February 2024
Sec. Experimental Pharmacology and Drug Discovery
Volume 15 - 2024 | https://doi.org/10.3389/fphar.2024.1370708
This article is part of the Research Topic Cellular and Molecular Mechanisms in Metabolic Disorders: Role of Inflammation and Oxidative Stress View all 9 articles
Introduction: Pre-diabetes, a high-risk metabolic state, is situated between normal glucose homeostasis and diabetes. Early identification of pre-diabetes offers opportunities for intervention and diabetes reversal, highlighting the crucial need to investigate reliable biomarkers for this condition.
Methods: We conducted an in-depth bioinformatics analysis of clinical samples from non-diabetic (ND), impaired glucose tolerance (IGT), and type 2 diabetes mellitus (T2DM) categories within the GSE164416 dataset. Thereafter the HFD and STZ treated mice were used for validation.
Results: This analysis identified several codifferentially expressed genes (Co-DEGs) for IGT and T2DM, including CFB, TSHR, VNN2, APOC1, CLDN2, SLPI, LCN2, CXCL17, FAIM2, and REG3A. Validation of these genes and the determination of ROC curves were performed using the GSE76895 dataset. Thereafter, CLDN2 was selected for further verification. Gene expression analysis and immunofluorescence analysis revealed a significant upregulation of CLDN2 expression in the pancreas islets of mice in the high-fat diet and T2DM groups compared to the control group. Similarly, serum level of CLDN2 in patients with IGT and T2DM were significantly higher than those in the healthy group.
Discussion: These results suggest that CLDN2 can serve as a novel biomarker for pre-diabetes, providing a new direction for future research in the prevention of type 2 diabetes.
The incidence of metabolic syndrome and diabetes has been steadily increasing over the years, imposing significant economic burdens, with a notable trend of affecting younger individuals (Rooney et al., 2023). Which causing the prevalence of pre-diabetes has reached alarming levels, thereby affecting a substantial portion of the global population. Pre-diabetes is a condition where the blood glucose levels are higher than normal but not yet high enough for a diabetes diagnosis. This phase led to an increased risk of developing type 2 diabetes and cardiovascular diseases. Pre-diabetes carries a lifetime risk of conversion to T2DM, reaching up to 70%, and is linked to increased risks of cardiovascular disease and all-cause mortality (Cai et al., 2021). Early identification and targeted interventions during the pre-diabetic phase can significantly reduce the risk of diabetes and its associated comorbidities. However, this condition often goes undetected as individuals may not experience noticeable symptoms. While inflammatory factors, metabolic byproducts, non-coding RNAs have laid the foundation for novel pathophysiological hypotheses and treatments for pre-diabetes, no biomarkers have yet been incorporated into routine screening. In this backdrop, the quest for early biomarkers that can reliably signify the onset of pre-diabetes has gained prominence in biomedical research.
By collecting and analyzing GEO data from normal, pre-diabetic, and diabetic patients, we screened out many different genes. Amidst the myriad candidates under scrutiny, one gene that has emerged as a potential biomarker is Claudin-2 (CLDN2). CLDN2 is a member of tight junctions transmembrane proteins family (Ganapathy et al., 2022). Normally, CLDN2 mRNA is enriched in the kidney, gastrointestinal tract, liver, gall bladder, and pancreas (Venugopal et al., 2019). And it is mainly reported the permeability function of CLDN2 in intestinal diseases and cancer (Zeisel et al., 2019). CLDN2 plays an important role in inflammatory diseases. It has reported that CLDN2 expression was elevated in active inflammatory bowel disease (IBD), adenomas, and IBD-associated dysplasia (Weber et al., 2008). In addition, Claudin-2 protein abundance is thought to correlate with pancreatic tissue inflammation (Whitcomb et al., 2012), supporting a role in pancreatic inflammation. Recent findings have expanded our understanding of CLDN2, revealing its role in signal modulation, including the regulation of cell proliferation, migration, signaling pathways, and transcription factors (Venugopal et al., 2019). Besides, the role of CLDN2 in T1DM nephropathy and its impact on the pancreas have further strengthened the association between CLDN2 and diabetes (Molina-Jijon et al., 2014; Aghdassi et al., 2015). However, the exact relationship between CLDN2 and pre-diabetes is unclear.
The early and effective identification of pre-diabetic conditions is crucial for preventing the progression from pre-diabetes to diabetes and potentially reversing the pre-diabetic state. Here, We identified that CLDN2 is a potential biomarkers for early diagnosis of pre-diabetes through bioinformatics. Further validation revealed that CLDN2 is upregulated both in mice fed a high-fat diet (HFD) with or without STZ treatment, while with a higher ratio in STZ mice. The serum of volunteers in impaired glucose tolerance (IGT) group and diabetes mellitus (DM) group also showed higher CLDN2 level. In this study, we attempt to identify the promising biomarkers for the recognition of pre-diabetic states at an early stage. Which serves as a critical stone in the broader context of diabetes prevention and management. Efforts directed towards early identification and intervention strategies are pivotal for mitigating the escalating global burden of diabetes. Our findings have offered valuable assistance in delving deeper into the research on pre-diabetes biomarkers, presenting new insights into the study of pre-diabetes molecular complexity.
The clinical samples involved in the experiment were all from our previous studies (Yang et al., 2023) and the study was conducted according to the guidelines of the Declaration of Helsinki, and approved by The Ethics Committee of Tongji Medical College, Huazhong University of Science and Technology (IORG No: IORG0003571).
The expression profiling of GSE164416, which is based on the GPL16791 platform [Illumina HiSeq 2,500 (Homo sapiens), United States], was downloaded from the GEO database. The dataset contains pancreatic tissue samples from 15 non-diabetic (ND) patients, 13 patients with T2DM, and 18 patients with impaired glucose tolerance (IGT). Only patients with the age between 30–70 years old and BMI between 20–28 kg/m2 were recruited.
DEGs were screened between the ND and IGT groups and between the ND and T2DM groups, respectively, using the “limma” package in the R software, with parameters set to adj.p-value <0.05 and |log2FC| ≥ 0. Next, we plotted volcano maps and heat maps using the “ggplot2” and “heat map” packages.
Gene Ontology (GO) enrichment analysis was carried out on the webpage using the Database for Annotation, Visualization, and Integrated Discovery (DAVID; https://davi.ncifcrf.gov) online tools, including molecular functions (MFs), cellular components (CCs), and biological processes (BPs). Kyoto Encyclopedia of Genes and Genomes (KEGG) pathways for functional annotation and pathway enrichment analysis of the DEGs.
Pancreatic tissue gene expression profiles from the GSE76895 dataset were used to validate hub genes. The microarray data were based on the GPL570 (HG-U133_Plus_2) Affymetrix Human Genome U133 Plus 2.0 array (Affymetrix, Santa Clara, CA, United States). Twenty-five patients with T2DM and 25 patients with ND were selected from the GSE76895 dataset, and the differences in the expression of hub genes in GSE76895 were plotted as box plots using the draw_boxplot function of the online tool BioLadder (https://www.bioladder.cn/). ROC curves for the selected genes were also calculated using BioLadder to assess the ability of the hub genes to diagnose T2DM.
6-week-old male C57BL/6J mice were obtained from Beijing HFK Biotechnology Co., Ltd. The standard-diet (SD) group was fed a standard chow diet (SD, 20% protein, 70% carbohydrates, and 10% fat). The high-fat diet (HFD) group was fed a high-fat diet (HFD; Research Diets, D12492, 20% protein, 20% carbohydrates, and 60% fat) for 3 months to induce insulin resistance. The streptozotocin (STZ) group was fed a HFD and treated with STZ (30 mg/kg intraperitoneally injection) to establish STZ-induced diabetic mouse. The mice in the SD and the HFD group were intraperitoneally injected with PBS. The mice were sacrificed at the week 16. All mice were housed in a specific pathogen-free animal laboratory in a 12-h light and 12-h darkness cycle at room temperature. The body weight, food intake, and fasting blood glucose (FBG) of mice were measured every 2 weeks. All of the experiments were performed according to procedures approved by the Animal Research Committee of Tongji Medical College, Huazhong University of Science and Technology, Hubei Province, China. (IACUC Number: 3417).
Mice fasting blood glucose (FBG) was measured using a blood glucose meter (LifeScan) after mice were fasted overnight. The intraperitoneal insulin tolerance tests (IPITT) were performed in mice by the injection of insulin (0.75 U/kg, i.p.) after mice were fasted overnight, and the intraperitoneal glucose tolerance tests (IPGTT) were performed by injecting glucose (2 g/kg, i.p.) after mice were fasted overnight; plasma glucose was measured at different time points.
Protein from cells or pancreatic tissue was extracted in RIPA lysis buffer (NCE Biotech, China) with protease and phosphatase inhibitors. Protein samples were separated by SDS-PAGE and transferred to a PVDF membrane (Millipore, United States). The membrane was incubated with primary antibodies (Rabbit Anti-CLDN2, diluted 1:1,000, Proteintech, 26912-1-AP, China; Mouse anti-β-actin, diluted 1:2000, 66009-1-lg, Proteintech, China) overnight at 4°C and were incubated in secondary antibodies (diluted 1:3,000) for 1 h at room temperature. Finally, the membranes were visualized with an ECL reagent (NCE Biotech, China) and measured. The Protein Marker was 180 kDa Plus Prestained Protein Marker (MP102, Vazyme, China).
Total RNA from pancreas tissue was extracted using TRIzol reagent (Takara Shuzo Co., Ltd., Kyoto, Japan), and the cDNA was synthesized using a Prime Script RT reagent kit (Takara Biotechnology Co. Ltd., Japan). Then qPCR was performed in a LightCycler480-PCR system (Roche Diagnostics, Mannheim). The relative transcript levels of the objective gene were normalized to β-actin and calculated by the 2−ΔΔCT method. The primer sequences are listed as follows: CLDN2- Forward sequence (5′–3′) catcacccagtgcgatatctaca, CLDN2- Reverse sequence (5′–3′) gagataatacaagccagcgagga. β-actin-Forward sequence (5′–3′) attgttaccaactgggacg, β-actin-Reverse sequence (5′–3′) ctgggtcatcttttcacg.
The paraffin sections of pancreas were deparaffinized with xylene and then dehydrated in 100%, 95%, 85%, 70% ethanol for 5 min, respectively. The sections were incubated with primary antibodies overnight at 4°C (Rabbit Anti-CLDN2, diluted 1:100, Proteintech, 26912-1-AP, China; Mouse anti-insulin, diluted 1:100, 66198-1-Ig, proteintech; Rabbit anti-glucagon, diluted 1:100, Ab92517, Abcam). After PBS washing, the sections were incubated with secondary antibody (FITC, CY3, Servicebio) for 1 h and nuclei were stained with DAPI (Servicebio, Wuhan, China) at room in the dark. The images were analyzed by a confocal microscope (Nikon, Tokyo, Japan).
The CLDN2 levels were measured using a commercial ELISA kit (HM12058, Bioswamp Life Science Lab, Wuhan, China) following the manufacturer’s instructions. The IL1β and TNFα levels were measured using a commercial ELISA kit (KE10003, KE20018, Proteintech, Wuhan, China) following the manufacturer’s instructions. The absorbance at 450 nm was detected using a microplate reader (PerkinElmer, Waltham, MA, United States).
The data was analyzed and processed by GraphPad Prism 9.5 software. Differences in numeric parameters between two groups were assessed with an unpaired two-tailed t-test, and one-way or two-way ANOVA was used for comparison among multiple groups. All data were presented as the mean ± standard deviation, and p <0.05 was considered statistically significant. The entirety of the experiments was repeated at least three times.
Using the R package “limma,” we identified 737 upregulated genes and 595 downregulated genes in the GSE164416 dataset for IGT samples compared to ND samples. Volcano diagram, heat map of DEGs in IGT shown in Figures 1A, B.
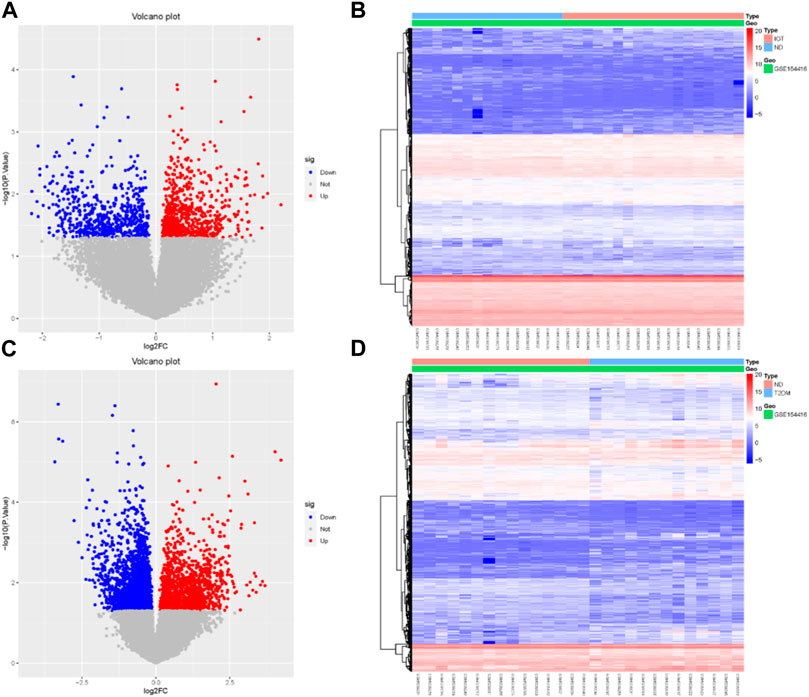
FIGURE 1. Volcano map (A, C) and heat map (B, D) of DEGs for IGT and T2DM.
The same method was used to analyze the DEGs in the T2DM samples, and we found that there were 3590 DEGs, including 1,399 upregulated genes and 2,191 downregulated genes. The results were mapped as a volcano map (Figure 1C) and a heat map (Figure 1D).
We select the differential genes from T2DM with |log2FC| ≥ 1.5 and take the intersection of the differential genes from IGT with |log2FC| ≥ 0 to obtain the Co-DEGs, namely, CFB, TSHR, VNN2, APOC1, CLDN2, SLPI, LCN2, CXCL17, FAIM2, REG3A.
We performed enrichment analysis of the GO terms and KEGG pathways of differential genes for IGT. In the biological process (BP), the DEGs were mainly enriched in the thrombopoietin-mediated signaling pathway and the protein refolding and positive regulation of interferon-gamma production. As for the cellular component (CC) group, DEGs were mainly enriched in peroxisome, membrane and cytosol. In molecular function (MF), DEGs were mainly enriched in protein binding involved inchaperone binding, cadherin binding and protein folding (Figure 2A). KEGG pathway enrichment analysis suggested that the DEGs mainly played key roles in metabolic pathways, protein processing in endoplasmic reticulum, fatty acid metabolism (Figure 2B).
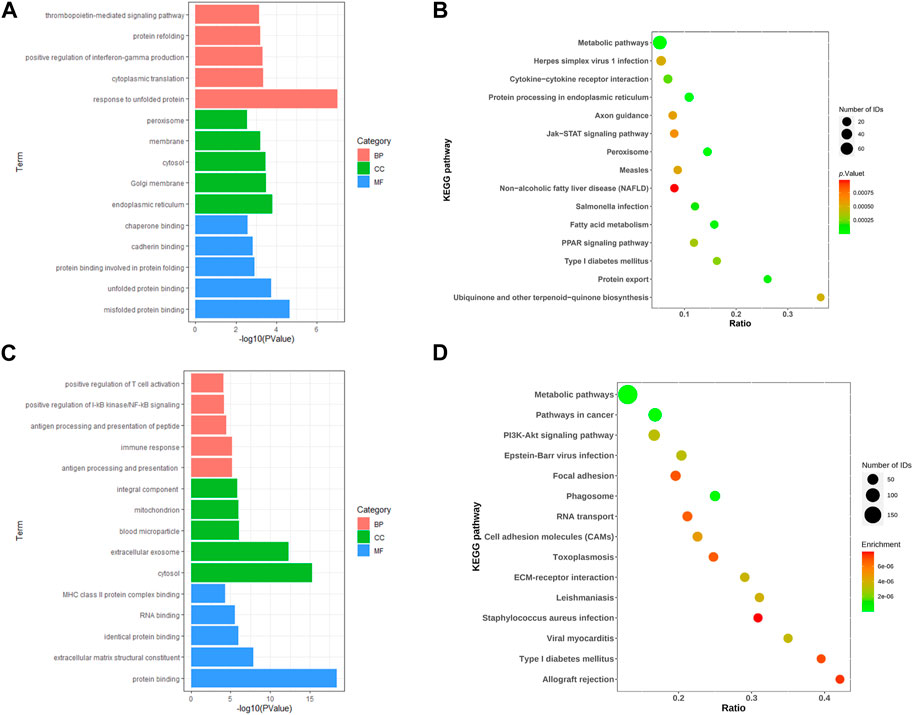
FIGURE 2. Go of DEGs (A, C) and KEGG of DEGs (B, D) for IGT and T2DM.
Similarly, GO enrichment analyses and KEGG pathway for T2DM DEGs. The BPs were mainly focused on positive regulation of T cell activation, positive regulation of I-κB kinase/NF-κB signaling and antigen processing and presentation of peptide; CCs were mainly focused on the integral component, mitochondrion and blood microparticle; and MFs were mainly focused on class II protein complex binding, RNA binding an MHC identical protein binding (Figure 2C). In addition, the KEGG pathway analysis showed that the DEGs were closely related to the metabolic pathways, pathways in cancer and PI3K-Akt signaling pathway (Figure 2D).
To validate the screened genes, we analyzed the expression of the pivotal genes in the gene expression profiles of pancreatic tissues in the GSE76895 dataset (comprising 25 ND and 25 T2DM). We performed enrichment analyses of ND and T2DM differential genes in GES76895, and the results obtained were highly consistent with GSE164416, with the top 5 ranked overlaps including: antigen processing and presentation of exogenous peptide antigen via MHC class II in the BPs; cytosol, mitochondrion, extracellular exosome in the CCs; protein binding, identical protein binding, extracellular matrix structural constituent in the MFs (Figure 3A). Similarly, 8 of the top 15 KEGG pathways were consistent between GES76895 and GSE164416, including, Metabolic pathways, Phagosome, Pathways in cancer, Epstein-Barr virus infection, Staphylococcus aureus infection, ECM-receptor interaction, Focal adhesion, PI3K-Akt signaling pathway (Figure 3B). As shown in Figure 3C, CLDN2 expression was significantly upregulated in pancreatic islets from T2DM patients compared to controls (p < 0.05). In addition, we plotted ROC curves for the central genes and calculated the area under the curve (AUC) to differentiate between the T2DM and controls. The diagnostic value AUC for the CLDN2 gene in GSE76895 was 0.742 (Figure 3D).
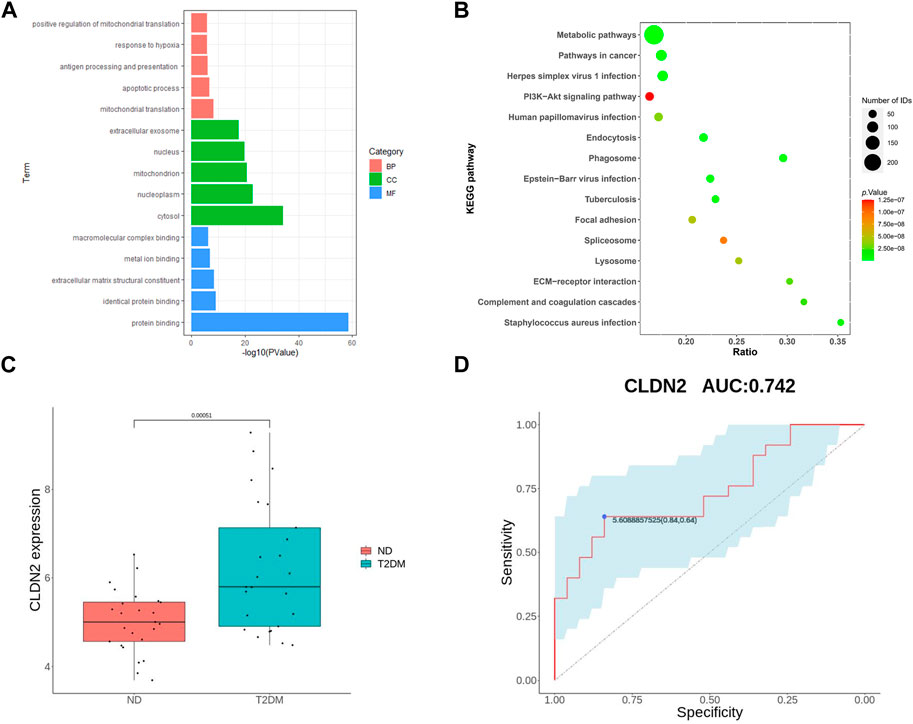
FIGURE 3. Validation of hub genes: GO of DEGs (A) and KEGG of DEGs (B) for T2DM; (C) CLDN2 expression in GSE76895; and (D) ROC curves of the CLDN2 gene in GSE76895.
Following the bioinformatics analysis, we observed a significant upregulation of CLDN2 expression in the pancreas of volunteers with IGT and T2DM. To further validate the alterations of CLDN2 in pre-diabetes and T2DM, we initially established the metabolic stress model of mice to create pre-diabetic conditions. Also, STZ mice were used to assess the diabetic state. We observed that mice fed a HFD and STZ mice exhibited significantly higher body weights and fasting blood glucose levels compared to the SD group (Figures 4A, D). As anticipated, these mice displayed evident impairments in glucose tolerance and insulin resistance (Figures 4B, C). Thereafter, immunofluorescence results revealed an increase in pancreatic islets α-cell numbers and a substantial loss of β-cells in the HFD group, with a more pronounced effect observed in STZ mice, leading to a dysregulation in the α/β-cell ratio (Figure 4E). These findings indicate the successful establishment of mouse models for pre-diabetes and diabetes.
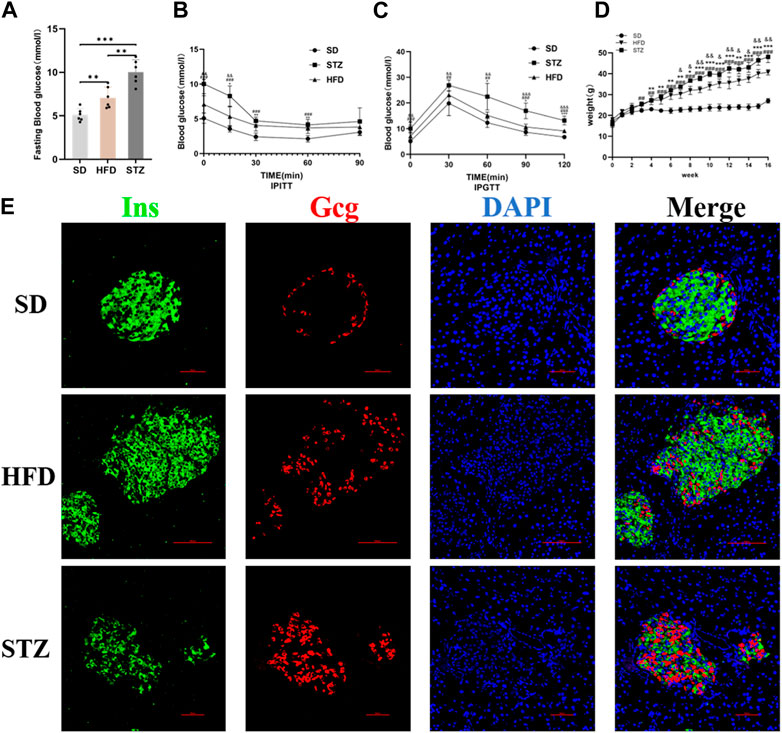
FIGURE 4. Validation of the Establishment of Mouse Models of Pre-diabetes and T2DM. Fasting blood glucose (A), IPITT (B), IPGTT (C) and Body weight (D) of mice in SD, HFD and STZ group. (B, C) *p < 0.05, **p < 0.01, ***p < 0.001 in SD vs. HFD; #p < 0.05, ##p < 0.01, ###p < 0.001 in SD vs. STZ; &p < 0.05, &&p < 0.01, &&&p < 0.001 in HFD vs. STZ. (E) Representative immunofluorescent images of insulin and glucagon in the pancreatic islets. Bar = 50 nm.
To validate alterations of CLDN2 in pre-diabetes and T2DM, we assessed the expression levels of CLDN2 in the pancreas of mice. Transcriptional level verification indicated a significant increase in CLDN2 mRNA in both the HFD and STZ mice, with a more remarkable increase observed in STZ mice (Figure 5A). Western blot showed the same results, revealing a substantial increase in CLDN2 protein expression in both the HFD and STZ groups compared to the SD group, with a particularly notable elevation in the STZ group (Figure 5B). To investigate whether CLDN2 is upregulated within the pancreatic islets, we conducted immunofluorescence staining of the islets. Confocal microscopy observations revealed that, under normal conditions, CLDN2 is predominantly expressed in pancreatic tissue but exhibits almost expressionless within the islets. However, with changes in metabolic conditions, not only did CLDN2 expression significantly increase in the peripheral regions of the islets, but expression within the islets themselves was also evident (Figure 5C). Notably, within the islets of STZ mice, CLDN2 expression was significantly elevated, suggesting a compensatory increase possibly associated with excessive loss or fibrosis of islet cells (Figure 5C).
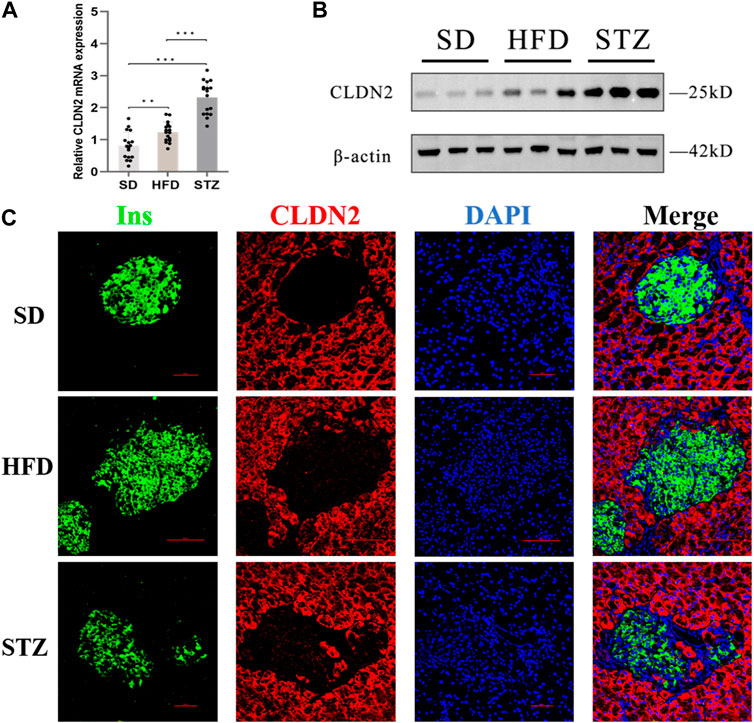
FIGURE 5. The expression level of CLDN2 in pancreatic islets of pre-diabetes and T2DM mouse models. (A) CLDN2 expression was determined using real-time quantitative RT-PCR (***p < 0.001) (B) Western blot showing the overexpression of CLDN2 in both HFD and STZ mice. (C) Representative immunofluorescent images of insulin and CLDN2 in the pancreatic islets. Bar = 50 nm.
To validate the clinical utility potential of the CLDN2 gene, we used ELISA to assess the protein levels encoded by the CLDN2 gene in clinical serum samples. Blood glucose and HbA1C level in both the IGT and T2DM groups were significantly higher than those in the control group, and these differences were statistically significant (Table 1). The serum expression levels of CLDN2 in both the IGT and T2DM groups were markedly elevated compared to the control group, with statistically significant differences. These findings indicate that the expression of CLDN2 have changed in the early stages of metabolic stress. The identified CLDN2 gene holds promise as a potential biomarker for early diagnosis and prognosis prediction in pre-diabetes. Besides, the association between CLDN2 level and clinical parameters was investigated by Pearson correlation coefficient test, the results were shown in Table 2. We found that FBG in the IGT group was correlated with CLDN2 level. But HbA1C were not correlated with clinical features. We think this may be due to some patients consistently taking antidiabetic medication before admission, and since HbA1C represents a 3-month average, there might be a certain lag, resulting in a weak correlation between the two. Therefore, it is necessary to expand the sample size and include patients who have not taken any medication for further correlation experiments. Further, we assessed the expression levels of serum IL1b and TNFα (Figure 6). We observed a significant upregulation of these cytokines in populations from the Impaired IGT and DM groups. Previous studies have indicated that the elevation of IL1b and TNFα can upregulate the expression of CLDN2 (Yamamoto et al., 2004; Menta et al., 2022; Wu et al., 2022). Therefore, the upregulation of CLDN2 expression in our study may be regulated by the increased levels of these inflammatory factors.
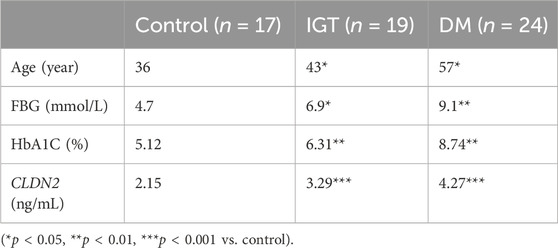
TABLE 1. Comparison of data of volunteers in three groups.

TABLE 2. Correlation of CLDN2 level with clinical parameters.
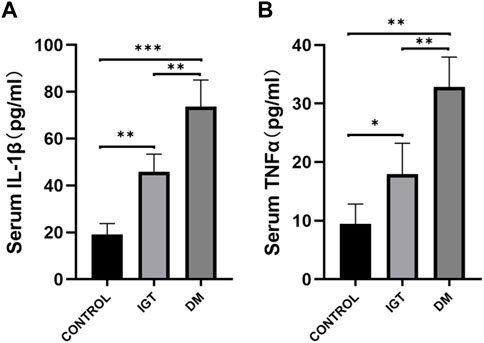
FIGURE 6. Comparison of serum IL1β (A) and TNFα (B) level among the IGT group, the T2DM group, and the control (*p < 0.05, **p < 0.01, ***p < 0.001).
The early identification and targeted intervention of pre-diabetes can significantly reduce the risk of diabetes and its associated complications, such as cardiovascular diseases and all-cause mortality. Therefore, the investigation for early biomarkers that can conveniently and reliably indicate the onset of pre-diabetes is crucial. In this study, we obtained the GSE164416 dataset from GEO and identified 737 upregulated genes and 595 downregulated genes in IGT, as well as 1,399 upregulated genes and 2,191 downregulated genes in T2DM through differential expression analysis. Further analysis led to the identification of 10 candidate genes, namely, CFB, TSHR, VNN2, APOC1, CLDN2, SLPI, LCN2, CXCL17, FAIM2, and REG3A. Subsequently, we validated the expression and diagnostic value of these key genes using the GSE76895 dataset. Finally, we determined that CLDN2 is the most promising gene in terms of diagnostic potential in the GSE164416 and GSE76895 datasets.
Research on CLDN2 has primarily focused on gastrointestinal diseases, due to its role as a member of the tight junction protein family, prompting extensive investigation into its role about the intestinal barrier (Beggs et al., 2023; Ganapathy et al., 2023; Rini et al., 2023). Numerous studies have progressively affirmed its association with inflammatory bowel diseases (Raju et al., 2020; Ahmad et al., 2023; Alghamdi and Al-Zahrani, 2023). Besides, researches on the association between CLDN2 and cancer has been steadily increasing (Piontek et al., 2020), with a growing evidence elucidating its involvement in tumor growth, metastasis, and metabolism (Eguchi et al., 2021; Hirota et al., 2021; Tabaries et al., 2021; Wei et al., 2021). However, although several studies have explored the possible role of CLDN2 in T1DM (Sapone et al., 2006; Visser et al., 2010; Molina-Jijon et al., 2014), the relationship between CLDN2 and diabetes remained unclear. Recent studies have gradually revealed that CLDN2, distinct from its conventional permeability function, may also regulate biological activities and play a role in signal transduction, such as proliferation, migration and signal-modulating (Ikari et al., 2012; Zhang et al., 2018; Venugopal et al., 2019; Wang et al., 2019). Combined with our bioinformatics analysis, we considered that CLDN2 has the potential of a pre-diabetes biomarker. We established mouse models for both pre-diabetes and diabetes, validating a significant upregulation of CLDN2 expression in both disease models, with higher expression levels in the diabetes group. This indicates an intricate association between CLDN2 and the onset and progression of diabetes, indicating that the CLDN2 expression has altered during metabolic stress in the pre-diabetic period.
Another important aspect is evident in our immunofluorescence results, revealing that in physiological conditions, CLDN2 primarily localizes to the peripheral tissue surrounding the pancreatic islets. This may reflect its role in barrier function or permeability. However, under metabolic stress, CLDN2 not only exhibits a significant increase in expression around the islets but also appears within the islets. In the period of diabetes, there is a dramatic increase in CLDN2 expression within the islets. This suggests that under normal conditions, CLDN2 in the pancreas may primarily contribute to maintaining normal physiological function through its tight junction-related role. The excessive expression of CLDN2 within the islets of STZ mice during diabetes state may function as a protective barrier to prevent further damage to islet cells or play a compensatory regulatory role, such as signaling pathways related to islet cell proliferation. However, the mechanisms underlying this phenomenon require further research.
To validate the clinical application potential of CLDN2, we conducted ELISA to measure serum CLDN2 protein levels in volunteers with IGT and T2DM. Our results confirmed the potential of CLDN2 as a pre-diabetes biomarker and indicated its potential involvement in the pathogenesis of diabetes. Therefore, we believe that assessing CLDN2 levels may valuable in the diagnosis and assessment of pre-diabetes, which is also the clinical significance of this study. The primary limitations of this study are as follows: 1. The limited size of the clinical sample may introduce potential biases to the results. We intend to expand the sample size to mitigate this limitation in the future. 2. The role of CLDN2 in IGT and diabetes requires further elucidation, particularly beyond its functions related to barrier and permeability. 3. Additional genes identified through bioinformatics analysis need further exploration to understand their potential connections with diabetes. In summary, this study introduces novel biomarkers for pre-diabetes diagnosis and opens new horizon for research into the prevention of type 2 diabetes.
The raw data supporting the conclusion of this article will be made available by the authors, without undue reservation.
The studies involving humans were approved by the Ethics Committee of Tongji Medical College, Huazhong University of Science and Technology (IORG No: IORG0003571). The studies were conducted in accordance with the local legislation and institutional requirements. The participants provided their written informed consent to participate in this study. The animal study was approved by Animal Research Committee of Tongji Medical College, Huazhong University of Science and Technology, Hubei Province, China. (IACUC Number: 3417). The study was conducted in accordance with the local legislation and institutional requirements.
YS: Conceptualization, Data curation, Formal Analysis, Methodology, Writing–original draft. LF: Conceptualization, Formal Analysis, Methodology, Writing–original draft. CJ: Data curation, Methodology, Writing–original draft. YL: Funding acquisition, Project administration, Supervision, Writing–review and editing.
The author(s) declare financial support was received for the research, authorship, and/or publication of this article. This research was funded by Natural Science Foundation of China, grant number 82170812 and 81974104.
The authors declare that the research was conducted in the absence of any commercial or financial relationships that could be construed as a potential conflict of interest.
All claims expressed in this article are solely those of the authors and do not necessarily represent those of their affiliated organizations, or those of the publisher, the editors and the reviewers. Any product that may be evaluated in this article, or claim that may be made by its manufacturer, is not guaranteed or endorsed by the publisher.
The Supplementary Material for this article can be found online at: https://www.frontiersin.org/articles/10.3389/fphar.2024.1370708/full#supplementary-material
Aghdassi, A. A., Weiss, F. U., Mayerle, J., Lerch, M. M., and Simon, P. (2015). Genetic susceptibility factors for alcohol-induced chronic pancreatitis. Pancreatology 15 (4 Suppl. l), S23–S31. doi:10.1016/j.pan.2015.05.476
Ahmad, R., Kumar, B., Thapa, I., Tamang, R. L., Yadav, S. K., Washington, M. K., et al. (2023). Claudin-2 protects against colitis-associated cancer by promoting colitis-associated mucosal healing. J. Clin. Invest. 133 (23), e170771. doi:10.1172/JCI170771
Alghamdi, R. A., and Al-Zahrani, M. H. (2023). Identification of key claudin genes associated with survival prognosis and diagnosis in colon cancer through integrated bioinformatic analysis. Front. Genet. 14, 1221815. doi:10.3389/fgene.2023.1221815
Beggs, M. R., Young, K., Plain, A., O’Neill, D. D., Raza, A., Flockerzi, V., et al. (2023). Maternal epidermal growth factor promotes neonatal claudin-2 dependent increases in small intestinal calcium permeability. Funct. (Oxf). 4 (5), zqad033. doi:10.1093/function/zqad033
Cai, X., Liu, X., Sun, L., He, Y., Zheng, S., Zhang, Y., et al. (2021). Prediabetes and the risk of heart failure: a meta-analysis. Diabetes Obes. Metab. 23 (8), 1746–1753. doi:10.1111/dom.14388
Eguchi, H., Matsunaga, H., Onuma, S., Yoshino, Y., Matsunaga, T., and Ikari, A. (2021). Down-regulation of claudin-2 expression by cyanidin-3-glucoside enhances sensitivity to anticancer drugs in the spheroid of human lung adenocarcinoma A549 cells. Int. J. Mol. Sci. 22 (2), 499. doi:10.3390/ijms22020499
Ganapathy, A. S., Saha, K., Suchanec, E., Singh, V., Verma, A., Yochum, G., et al. (2022). AP2M1 mediates autophagy-induced CLDN2 (claudin 2) degradation through endocytosis and interaction with LC3 and reduces intestinal epithelial tight junction permeability. Autophagy 18 (9), 2086–2103. doi:10.1080/15548627.2021.2016233
Ganapathy, A. S., Saha, K., Wang, A., Arumugam, P., Dharmaprakash, V., Yochum, G., et al. (2023). Alpha-tocopherylquinone differentially modulates claudins to enhance intestinal epithelial tight junction barrier via AhR and Nrf2 pathways. Cell Rep. 42 (7), 112705. doi:10.1016/j.celrep.2023.112705
Hirota, C., Takashina, Y., Ikumi, N., Ishizuka, N., Hayashi, H., Tabuchi, Y., et al. (2021). Inverse regulation of claudin-2 and -7 expression by p53 and hepatocyte nuclear factor 4α in colonic MCE301 cells. Tissue Barriers 9 (1), 1860409. doi:10.1080/21688370.2020.1860409
Ikari, A., Sato, T., Watanabe, R., Yamazaki, Y., and Sugatani, J. (2012). Increase in claudin-2 expression by an EGFR/MEK/ERK/c-Fos pathway in lung adenocarcinoma A549 cells. Biochim. Biophys. Acta 1823 (6), 1110–1118. doi:10.1016/j.bbamcr.2012.04.005
Menta, P. L. R., Andrade, M. E. R., de Castro, L. F., Trindade, L. M., Dias, M. T. S., Miyamoto, J. E., et al. (2022). Interesterified palm oil increases intestinal permeability, promotes bacterial translocation, alters inflammatory parameters and tight-junction protein genic expression in Swiss mice. Food Res. Int. 151, 110897. doi:10.1016/j.foodres.2021.110897
Molina-Jijon, E., Rodriguez-Munoz, R., Namorado Mdel, C., Pedraza-Chaverri, J., and Reyes, J. L. (2014). Oxidative stress induces claudin-2 nitration in experimental type 1 diabetic nephropathy. Free Radic. Biol. Med. 72, 162–175. doi:10.1016/j.freeradbiomed.2014.03.040
Piontek, A., Eichner, M., Zwanziger, D., Beier, L. S., Protze, J., Walther, W., et al. (2020). Targeting claudin-overexpressing thyroid and lung cancer by modified Clostridium perfringens enterotoxin. Mol. Oncol. 14 (2), 261–276. doi:10.1002/1878-0261.12615
Raju, P., Shashikanth, N., Tsai, P. Y., Pongkorpsakol, P., Chanez-Paredes, S., Steinhagen, P. R., et al. (2020). Inactivation of paracellular cation-selective claudin-2 channels attenuates immune-mediated experimental colitis in mice. J. Clin. Invest. 130 (10), 5197–5208. doi:10.1172/JCI138697
Rini, D. M., Nakamichi, Y., Morita, T., Inoue, H., Mizukami, Y., Yamamoto, Y., et al. (2023). Xylobiose treatment strengthens intestinal barrier function by regulating claudin 2 and heat shock protein 27 expression in human Caco-2 cells. J. Sci. Food Agric. 104 (4), 2518–2525. doi:10.1002/jsfa.13111
Rooney, M. R., Fang, M., Ogurtsova, K., Ozkan, B., Echouffo-Tcheugui, J. B., Boyko, E. J., et al. (2023). Global prevalence of prediabetes. Diabetes Care 46 (7), 1388–1394. doi:10.2337/dc22-2376
Sapone, A., de Magistris, L., Pietzak, M., Clemente, M. G., Tripathi, A., Cucca, F., et al. (2006). Zonulin upregulation is associated with increased gut permeability in subjects with type 1 diabetes and their relatives. Diabetes 55 (5), 1443–1449. doi:10.2337/db05-1593
Tabaries, S., Annis, M. G., Lazaris, A., Petrillo, S. K., Huxham, J., Abdellatif, A., et al. (2021). Claudin-2 promotes colorectal cancer liver metastasis and is a biomarker of the replacement type growth pattern. Commun. Biol. 4 (1), 657. doi:10.1038/s42003-021-02189-9
Venugopal, S., Anwer, S., and Szaszi, K. (2019). Claudin-2: roles beyond permeability functions. Int. J. Mol. Sci. 20 (22), 5655. doi:10.3390/ijms20225655
Visser, J. T., Lammers, K., Hoogendijk, A., Boer, M. W., Brugman, S., Beijer-Liefers, S., et al. (2010). Restoration of impaired intestinal barrier function by the hydrolysed casein diet contributes to the prevention of type 1 diabetes in the diabetes-prone BioBreeding rat. Diabetologia 53 (12), 2621–2628. doi:10.1007/s00125-010-1903-9
Wang, Y. B., Shi, Q., Li, G., Zheng, J. H., Lin, J., and Qiu, W. (2019). MicroRNA-488 inhibits progression of colorectal cancer via inhibition of the mitogen-activated protein kinase pathway by targeting claudin-2. Am. J. Physiol. Cell Physiol. 316 (1), C33–C47. doi:10.1152/ajpcell.00047.2018
Weber, C. R., Nalle, S. C., Tretiakova, M., Rubin, D. T., and Turner, J. R. (2008). Claudin-1 and claudin-2 expression is elevated in inflammatory bowel disease and may contribute to early neoplastic transformation. Laboratory Investigation; a J. Tech. Methods Pathology 88 (10), 1110–1120. doi:10.1038/labinvest.2008.78
Wei, M., Zhang, Y., Yang, X., Ma, P., Li, Y., Wu, Y., et al. (2021). Claudin-2 promotes colorectal cancer growth and metastasis by suppressing NDRG1 transcription. Clin. Transl. Med. 11 (12), e667. doi:10.1002/ctm2.667
Whitcomb, D. C., LaRusch, J., Krasinskas, A. M., Klei, L., Smith, J. P., Brand, R. E., et al. (2012). Common genetic variants in the CLDN2 and PRSS1-PRSS2 loci alter risk for alcohol-related and sporadic pancreatitis. Nat. Genet. 44 (12), 1349–1354. doi:10.1038/ng.2466
Wu, C., Zheng, T., Chen, H., Zou, P., Zhang, M., Wang, J., et al. (2022). Effect and mechanism of pharmaceutical excipients on berberine to alleviate ulcerative colitis via regulating gut microbiota. Molecules 27 (18), 5997. doi:10.3390/molecules27185997
Yamamoto, T., Kojima, T., Murata, M., Takano, K., Go, M., Chiba, H., et al. (2004). IL-1beta regulates expression of Cx32, occludin, and claudin-2 of rat hepatocytes via distinct signal transduction pathways. Exp. Cell Res. 299 (2), 427–441. doi:10.1016/j.yexcr.2004.06.011
Yang, S., Zhang, J., Zeng, T., Zheng, J., Min, J., and Chen, L. (2023). Role of circulating exosomal miRNA-3976 in early diabetic retinopathy. Int. J. Nanomedicine 18, 3695–3709. doi:10.2147/IJN.S414393
Zeisel, M. B., Dhawan, P., and Baumert, T. F. (2019). Tight junction proteins in gastrointestinal and liver disease. Gut 68 (3), 547–561. doi:10.1136/gutjnl-2018-316906
Keywords: claudin-2, diabetes, impaired glucose tolerance, biomarker, pre diabetes
Citation: Songtao Y, Fangyu L, Jie C and Li Y (2024) Identification of claudin-2 as a promising biomarker for early diagnosis of pre-diabetes. Front. Pharmacol. 15:1370708. doi: 10.3389/fphar.2024.1370708
Received: 15 January 2024; Accepted: 05 February 2024;
Published: 15 February 2024.
Edited by:
Syed Anees Ahmed, East Carolina University, United StatesReviewed by:
Rizwan Ahmad, University of Nebraska Medical Center, United StatesCopyright © 2024 Songtao, Fangyu, Jie and Li. This is an open-access article distributed under the terms of the Creative Commons Attribution License (CC BY). The use, distribution or reproduction in other forums is permitted, provided the original author(s) and the copyright owner(s) are credited and that the original publication in this journal is cited, in accordance with accepted academic practice. No use, distribution or reproduction is permitted which does not comply with these terms.
*Correspondence: Yuan Li, eXVhbmxpMThjbkAxMjYuY29t
†These authors have contributed equally to this work and share first authorship
Disclaimer: All claims expressed in this article are solely those of the authors and do not necessarily represent those of their affiliated organizations, or those of the publisher, the editors and the reviewers. Any product that may be evaluated in this article or claim that may be made by its manufacturer is not guaranteed or endorsed by the publisher.
Research integrity at Frontiers
Learn more about the work of our research integrity team to safeguard the quality of each article we publish.