 Mengdi He
 Zhipeng Hu
 Maoyi Yang
94% of researchers rate our articles as excellent or good
Learn more about the work of our research integrity team to safeguard the quality of each article we publish.
Find out more
SYSTEMATIC REVIEW article
Front. Pharmacol. , 25 March 2024
Sec. Ethnopharmacology
Volume 15 - 2024 | https://doi.org/10.3389/fphar.2024.1349259
Background: Rheumatoid arthritis (RA) is an autoimmune disease characterized by chronic synovitis of the affected joints. Total glucosides of paeony (TGP) capsules have been widely used clinically for the treatment of RA with good efficacy and safety. However, its effect on inflammatory cytokines remains unclear.
Objectives: This study aimed to summarize the effect of TGP on the expression level of serum inflammatory cytokines in RA animal models and its potential mechanisms.
Methods: Six databases were searched up to 14 August 2023, relevant animal experiment studies were screened, data were extracted, and the SYRCLE animal experiment bias risk assessment tool was used for risk assessment.
Results: A total of 24 studies were included, including 581 animals. Results showed that compared with the model control group, TGP decreased the levels of TNF-α, IL-1β, IL-6, and PGE2 and increased the levels of TGF-β1 after 1–2 weeks of intervention, decreased the levels of TNF-α, IL-1β, IL-6, IL-2, IL-17, IL-17α, IL-21, VEGF, IFN-γ and PGE2 and increased the levels of IL-10 and IL-4 after 3–4 weeks of intervention, decreased the levels of TNF-α, IL-6, IL-17α and increased the level of IL-10 after 8 weeks of intervention. There was no significant difference in the effects of TGP on the levels of IL-10, IL-17, and IFN-γ after 1–2 weeks of intervention and IL-1 and TGF-β1 after 3–4 weeks of intervention.
Conclusion: In summary, based on the existing studies, this study found that compared with the control group of the RA animal model, TGP can reduce the levels of serum pro-inflammatory cytokines such as TNF-α, IL-1β, and IL-6 and increase the levels of serum anti-inflammatory cytokines such as IL-10, exerting an anti-inflammatory effect by regulating and improving the levels of inflammatory cytokines, and thus alleviating the disease. Given the low quality of the included studies and the lack of sufficient evidence, more high-quality studies are still needed to validate the results of this study.
Rheumatoid arthritis (RA) is an autoimmune disease characterized by chronic synovitis of the affected joints, which can lead to progressive cartilage and bone damage as well as disability (Smolen et al., 2016). The most prominent clinical feature of the disease is symmetric, polyarticular pain and swelling, mainly involving the hands, wrists, feet, and knees (Sparks, 2019). The prevalence of RA is about 0.5%–1% and it is higher in some populations. For example, the prevalence is higher in the Northern Hemisphere and urban areas than in the Southern Hemisphere and rural areas, which in women is 2–3 times higher than that in men globally (Smolen et al., 2016; Gravallese and Firestein, 2023). Interactions among cells within joint synovium are a key part of RA pathogenesis. Specifically, B cells, dendritic cells, and macrophages can present antigens to T cells to activate these cells and induce their differentiation, leading to the production of cytokines, which in turn activate other neighboring cells to produce more pro-inflammatory cytokines and factors (Gravallese and Firestein, 2023). Thus, as signaling mediators both among immune cells as well as between immune cells and tissue cells, cytokines (such as inflammatory cytokines) have an important role in the establishment and perpetuation of inflammation in RA (Lin et al., 2020).
Total glucosides of paeony (TGP) capsules, also known as Pafulin, extracted from the dry roots of the traditional Chinese medicine plant Paeonia lactiflora, have been developed as a drug for the treatment of RA and are widely used in the clinic in China (Jiang et al., 2020). A meta-analysis found that compared with methotrexate and leflunomide, TGP combined with the above therapy for RA significantly decreased the disease activity score in 28 joints and the occurrence of liver dysfunction, leukopenia, diarrhea, nausea, and vomiting, which has a favorable efficacy and safety (Yang et al., 2023). Existing studies have shown that TGP and its main active ingredient, paeoniflorin, can exert anti-inflammatory and immunomodulatory effects by regulating the function and activation of immune cells, reducing the production of inflammatory mediators, and restoring abnormal signaling pathways (Zhang and Wei, 2020).
Animal models of RA are used to study the pathogenesis of RA and to identify therapeutic targets of drugs (McNamee et al., 2015). They are classified into induced and genetic models, and among the former, adjuvant-induced arthritis (AIA) and collagen-induced arthritis (CIA) models are most commonly used because of the advantages of simple operation and fast modeling (Choudhary et al., 2018). The AIA model mainly shows a T cell-mediated cellular immune response, whereas the CIA model shows both cellular and humoral immunity co-mediated by T and B cells, and the immunological characteristics are more similar to those of humans (Hegen et al., 2008; Asquith et al., 2009).
Although there are many studies on the effects of TGP on inflammatory cytokines, the outcomes reported vary greatly, resulting in no unified understanding, which is the starting point of this study.
Given the above-mentioned situation, this study aims to conduct a systematic review and meta-analysis of relevant in vivo animal experiments, to explore the effects of TGP on the expression level of inflammatory cytokines in serum during the pathogenesis of RA. In addition, potential mechanisms of TGP on RA in the included studies were summarized, to provide some basis for clinical research.
Chinese databases of China National Knowledge Infrastructure (CNKI), Wanfang, VIP, and English databases of PubMed, Embase, and Cochrane Library were retrieved from inception to 14 August 2023. The basic search framework was: (“total glucosides of paeony”) and (“rheumatoid arthritis” or “experimental arthritis”). Moreover, retrieve references cited by the included studies and include them if they met the inclusion criteria. The previous step was repeated for that included reference until no references met the inclusion criteria. This is to minimize the rate of missed detections. Detailed search strategies can be found in Supplementary Material S1.
1) Study Types: In vivo animal experiments.
2) Participants: No limitations on animal model type, species, strain, sex, weight, or age.
3) Interventions: The experimental group is given TGP, and the control group is given drug solvents or no treatment. The intervention time and manufacturer of TGP are not limited. In relevant studies, the drug administration route was mainly gavage (i.g.), and a few were intraperitoneal injections. There are two reasons for limiting the route of administration to gavage. First, intraperitoneal injection has no gastrointestinal first-pass metabolism, its bioavailability of drugs is higher than that of the gavage. So there is a fundamental difference between these two routes of administration. Second, clinical administration of TGP is oral, which is more closely related to gavage. Thus, gavage has a better clinical representation. The intervention dose of TGP is limited from the clinical reality, the standard dose used in adult patients with RA (70 kg) is 0.6 g Tid (Yang et al., 2023). Equivalent doses are converted according to the body surface area coefficients of different experimental animals and humans (The formula is shown below.), such as the equivalent dose for rats (200 g) is 163 mg·kg-1·day-1, and the equivalent dose for mice (20 g) is 234 mg·kg-1·day-1 (Huang et al., 2004). Based on the above criteria, the intervention dose is limited to not exceeding two times the equivalent dose, for example, the dose of rats is less than or equal to 326 mg·kg-1·day-1, and the dose of mice is less than or equal to 468 mg·kg-1·day-1.
In the formula, ED is the equivalent dose for animals (mg·kg-1·day-1) and HD is the standard dose for humans (assuming a constant human body weight of 70 kg, HD = 1800/70 mg·kg-1·day-1). Ka and Kh are constants, representing the body size coefficients of animals and humans respectively. Ka is 0.06 in mice and 0.09 in rats. Kh is 0.1. Wa and Wh are the animal and human body weight (kg). The calculation results are retained in whole numbers.
4) Outcomes: Serum inflammatory cytokines (such as TNF-α, IL-1, IL-2, IL-1β, IL-4, IL-6, IL-10, IL-17, IL-17α, IL-21, VEGF, IFN-γ, PGE2, TGF-β1). The main outcomes are TNF-α, IL-1β, IL-6 and IL-10. As long as any outcome is reported in the study, it can be included. If the study reports multiple time points, the results are all extracted.
(1) The same study with duplicate publications (retaining the one with more complete data); (2) Reviews; (3) Clinical studies and case reports; (4) Conference literature, scientific and technological achievements, and guidelines; (5) Cell experiments; (6) Interventions using paeoniflorin or other components of TGP; (7) Studies that do not report data.
Two researchers (Mengdi He and Zhipeng Hu) independently screened the literature by reading the title, abstract, and full text to obtain the literature that met the inclusion criteria. Disagreements were resolved by consulting a third researcher (Maoyi Yang). Two researchers (Mengdi He and Zhipeng Hu) independently extracted data in Excel, including literature author, publication year, country, sex ratio, animal species and strains, age, body weight, equivalent dose, type of animal model, sample size, co-intervention, interventions in experimental versus control groups, route of administration, intervention time, manufacturer of TGP, paeoniflorin content, measurement specimens, outcomes and their detection methods. Then cross-check to reduce the error rate. Outcome data were recorded as mean and standard deviation. If the literature provided standard error, the data were transformed. If the literature presented data only in the form of images, data were extracted three times using WebPlotDigitizer and averaged. If the literature lacked relevant data, Mengdi He attempted to contact the authors and excluded the literature when no response resulted in incomplete key data.
Two investigators (Mengdi He and Zhipeng Hu) used the SYRCLE tool to assess the risk of bias in animal experiments (Zeng et al., 2015), which included the following 10 perspectives: (1) sequence generation; (2) baseline characteristics; (3) allocation concealment; (4) random housing; (5) blinding of animal keepers and investigators; (6) assessment of randomization outcomes; (7) blinding of outcome evaluators; (8) reporting of incomplete data; (9) selective reporting of outcomes; (10) other sources of bias. Each included study was classified as Yes (low risk of bias), No (high risk of bias), or Uncertain (uncertain risk of bias). Disagreements were resolved by consulting a third researcher (Maoyi Yang).
Meta-analysis was performed using RevMan 5.4 provided by the Cochrane Collaboration and Stata 12.0 software. When multiple intervention groups were included in a study, the common control group was evenly divided into several small sample groups (Control group sample size divided by the number of doses in the intervention group), and then all pairwise comparison combinations were included in the meta-analysis to avoid artificially expanding the sample size (Higgins et al., 2023). For example, in a study with three doses of TGP intervention groups (n = 10) and a control group (n = 10), the sample size of the control group was split into 3, 3, and 4, which were combined with the intervention groups into the 3–10, 3–10, 4–10 comparison combinations.
All outcomes were continuous variables. If the effect size units and measurement methods were the same among studies, effect sizes were represented by weighted mean difference (WMD) and 95% confidence interval (CI). Conversely, standardized mean difference (SMD) and 95% CI were used. Combined effect sizes were considered statistically significant at p < 0.05. I2 and Q-test were used to assess the heterogeneity of the studies. If I2 ≤ 50% or p ≥ 0.1, the heterogeneity among the studies was small, and the fixed-effects model was used. If I2 > 50% or p < 0.1, the heterogeneity among the studies was large, and leave-one-out sensitivity analysis was performed first to explore the source of heterogeneity and judge the stability of the results. If the source could not be found, the random-effects model was used and subgroup analysis was performed.
Subgroup analysis was performed from five perspectives: dose and manufacturer of TGP, model type (CIA or AIA), animal species (such as rat or mouse), and animal strain [such as Wistar or Sprague Dawley (SD) rat, DBA/1 mouse]. Subgroup analysis for each perspective was carried out when the number of subgroups was less than or equal to 3. The dose subgroup analysis was based on 1/2 of the equivalent dose, the equivalent dose, and two times the equivalent dose as the division points (Tang, 2020). Specifically, in rats (200 g), 0 < low dose (LD) group ≤81.5 mg·kg-1·day-1, 81.5 mg·kg-1·day-1< medium dose (MD) group ≤163 mg·kg-1·day-1, 163 mg·kg-1·day-1 < high dose (HD) group ≤326 mg·kg-1·day-1; in mice (20 g), 0< LD ≤ 117 mg·kg-1·day-1, 117 mg·kg-1·day-1 < MD ≤ 234 mg·kg-1·day-1, 234 mg·kg-1·day-1 < HD ≤ 468 mg·kg-1·day-1. Although the equivalent doses for 200 g rats and 20 g mice obtained by conversion from the standard dose for a 70 kg human are acceptable within a certain body weight range, large conversion errors occur when the actual body weights of the rats or mice are outside that range (Xia et al., 2021). Therefore, in the dose subgroup analysis, we convert the equivalent dose and adjust the low, medium, and high dose ranges one by one according to the mean of the actual body weight of the animals in each study.
When there were ten or more comparison groups for the same outcome, publication bias was assessed by plotting a funnel plot or performing an Egger’s test (with p < 0.05 as the presence of publication bias).
A total of 1478 studies were retrieved from the databases (CNKI, 545; Wanfang, 462; VIP, 295; PubMed, 86; Embase, 77; Cochrane Library, 13). First, 743 studies were excluded due to duplication, and then 693 studies were excluded by reading the title and abstract. 20 studies were excluded by reading the full text and one of them was categorized as unclassified because the measurement specimen was unknown (Fu et al., 2022), and then 22 studies were included. By searching the references of the included studies, two additional studies were included (Chang et al., 2016; Asenso et al., 2019), and finally, 24 studies were included (Asenso et al., 2019; Chang et al., 2016; Jia, 2015; Li et al., 2019; Li, 2012; Li et al., 2011; Li et al., 2010; Liu et al., 2010; Liu et al., 2012; Peng et al., 2012; Qin, 2008; Qu et al., 2022; Shen et al., 2019; Wang et al., 2013a; Wang et al., 2013b; Wang, 2019; Xie, 2019; Yan et al., 2021; Yao, 2007; Yuan, 2013; Zhou et al., 2019; Zhou et al., 2018; Zhou et al., 2012; Zhou et al., 2009). It should be noted that during the screening process, regarding characteristics and outcome data, study (Chang et al., 2012a) is similar to study (Li et al., 2010), and study (Chang et al., 2012b) is similar to study (Li et al., 2011), and there was a great possibility of duplicated reporting. So Mengdi He tried to contact the authors for more detailed information, but the authors did not respond, and out of an abundance of caution, we excluded two studies by Jingzhi Chang (Chang et al., 2012a; Chang et al., 2012b). The specific literature screening flow chart is shown in Figure 1.
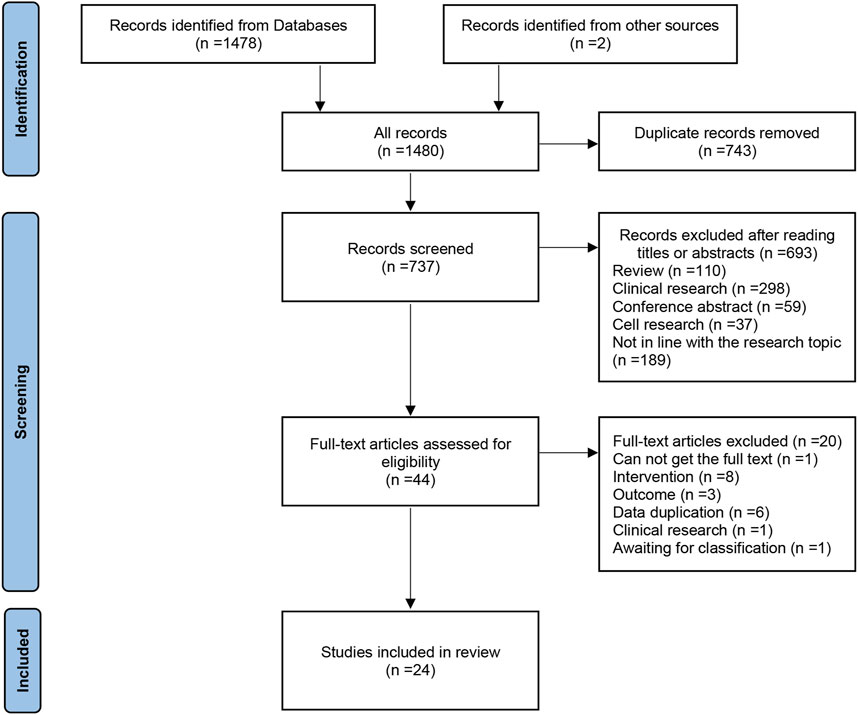
Figure 1. The flow chart of literature screening.
The meta-analysis included a total of 41 independent comparison groups, 581 experimental and control animals, all of which were rodents, including 510 rats (392 SD rats, 98 Wistar rats, 20 Lewis rats) and 71 mice (31 DBA/1 mice, 40 C57BL/6J mice). Fifteen studies used SD rats, five studies used Wistar rats, one study used Lewis rats, two studies used DBA/1 mice, and one study used C57BL/6J mice. In terms of model types, 12 studies used the AIA model, and 12 studies used the CIA model.
The dose range of TGP was 25–370 mg·kg-1·day-1, with six studies involving three doses, one study involving two doses, and 17 studies involving one dose. The intervention time of TGP ranged from 1 to 8 weeks, with 23 studies for 1–4 weeks and one study for 8 weeks. Regarding the reported time points of outcomes, only two studies reported multiple time points. TGP originated from six different manufacturers: (1) Institute of Clinical Pharmacology, Anhui Medical University. (2) Anhui Bozhou Chinese herbal medicine market (self-made purification). (3) Ningbo Lihua Pharmaceutical Co., Ltd. (4) Shanxi Weikangtang Chinese Herbal Pieces Co., Ltd. (5) Sanjiu Pharmaceutical Co., Ltd. (6) Ningbo Yicuijian Biological Technology Co., Ltd. Among them, the first two are self-made purification, and the last four are proprietary Chinese medicine. The specific basic characteristics are shown in Table 1.

Table 1. Characteristics of the included studies.
Only one study described the specific method of random sequence generation, one study had an incorrect method of sequence generation, and the rest mentioned randomization. The baseline characteristic of only one study was rated as low risk because it described serum cytokine levels after modeling. This phenomenon may be caused by the fact that existing studies were still accustomed to using outcomes such as paw swelling and arthritis index to measure baseline characteristics, and the topic of some studies was not that type of outcome, so it was not paid attention to before intervention of TGP. None of the studies described allocation concealment or blinding of animal keepers and investigators. Seven studies were rated as unclear risk in random outcome assessment. One study stated blinding of outcome evaluators. 13 studies mentioned randomization of animal placement. One study had incomplete data reporting. Two studies were rated as high risk for selective reporting of outcomes, one of which had multiple time points but reported only one, the other described measurement of serum IL-10 levels in the experimental method, but the results were not reported. All other sources of bias were low risk. The risk of bias summary and risk of bias graph are shown in Figure 2 and Figure 3.

Figure 2. Risk of bias summary.

Figure 3. Risk of bias graph.
1) TNF-α (Intervention time is 1–2 weeks).
Six studies including 124 animals reported the effect of TGP on serum TNF-α after 1–2 weeks of intervention (Chang et al., 2016; Jia, 2015; Peng et al., 2012; Wang et al., 2013b; Xie, 2019; Yao, 2007). The combined results showed that TGP could reduce TNF-α levels, but the heterogeneity between studies was high (SMD = −2.29, 95% CI [-3.55, −1.03], p = 0.0004, I2 = 85%) (Figure 4A; Supplementary Material S2.1). Sensitivity analysis showed that the result was robust (Supplementary Material S2.2). Subgroup analyses showed that dose, model type, and TGP’s manufacturer were not sources of heterogeneity (p = 0.06, 0.54, 0.05) (Supplementary Material S2.3–2.5). There were significant statistical differences among the subgroups of animal strains (SD rat, Wistar rat, Lewis rat) (p < 0.0001) (Supplementary Material S2.6), but both the Wistar and Lewis strains only had one entry.
2) TNF-α (Intervention time is 3–4 weeks).
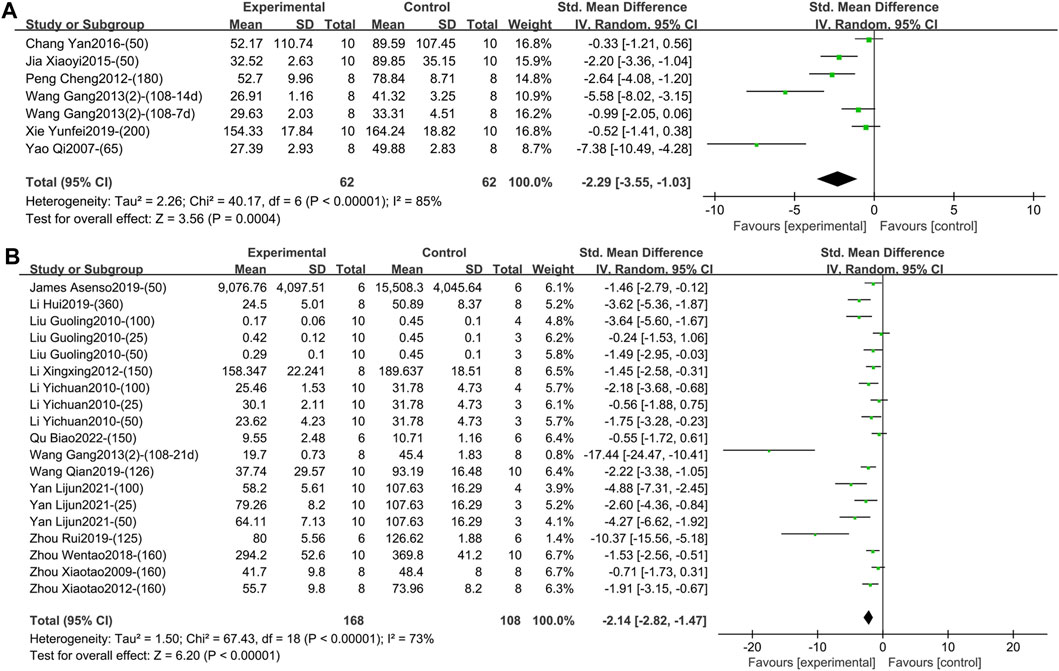
Figure 4. (A) Forest plot of TNF-α after 1–2 weeks of TGP intervention. (B) Forest plot of TNF-α after 3–4 weeks of TGP intervention.
Thirteen studies containing 276 animals reported the effect of TGP on serum TNF-α after 3–4 weeks of intervention (Asenso et al., 2019; Li et al., 2019; Li, 2012; Li et al., 2010; Liu et al., 2010; Qu et al., 2022; Wang et al., 2013b; Wang, 2019; Yan et al., 2021; Zhou et al., 2019; Zhou et al., 2018; Zhou et al., 2012; Zhou et al., 2009). TGP reduced TNF-α levels compared to model controls with high inter-study heterogeneity (SMD = −2.14, 95% CI [-2.82, −1.47], p < 0.00001, I2 = 73%) (Figure 4B; Supplementary Material S2.7). Sensitivity analysis indicated that the result was robust (Supplementary Material S2.8). Subsequent subgroup analyses were performed, and dose, model type, and animal species were not sources of heterogeneity (p = 0.07, 0.16, 0.10) (Supplementary Material S2.9–2.11). Subgroup analysis based on different animal strains (SD rat, Wistar rat, DBA/1 mice) was statistically different (p = 0.03), and the heterogeneity in the first two groups was 76% and 17%, respectively (Supplementary Material S2.12). In addition, the funnel plot (Supplementary Material S2.13) and Egger’s test (p < 0.001) indicated publication bias.
3) TNF-α (Intervention time is 8 weeks).
One study reported the effect of TGP on serum TNF-α after 8 weeks of intervention (Shen et al., 2019). Only descriptive analysis was performed, TGP reduced TNF-α levels compared with the model control group (SMD = −4.43, 95% CI [-6.53, −2.32], p < 0.0001) (Supplementary Material S2.14).
1) IL-1β (Intervention time is 1–2 weeks).
Five studies containing 87 animals reported the effect of TGP intervention for 1–2 weeks on serum IL-1β (Yao, 2007; Qin, 2008; Peng et al., 2012; Chang et al., 2016; Xie, 2019). The combined results showed that TGP reduced IL-1β levels, but heterogeneity between studies was high (SMD = −2.94, 95% CI [-4.76, −1.11], p = 0.002, I2 = 83%) (Figure 5A; Supplementary Material S2.15). Sensitivity analysis indicated that the result was robust (Supplementary Material S2.16). Subgroup analyses based on dose, model type, and TGP’s manufacturer indicated that these perspectives were not sources of heterogeneity (p = 0.29, 0.06, 0.08) (Supplementary Material S2.17–S2.19). Animal strain (SD rat, Wistar rat, Lewis rat) was a source of heterogeneity (p < 0.00001), and the heterogeneity disappeared in the subgroups of SD rat and Wistar rat (I2 = 0) (Supplementary Material S2.20).
2) IL-1β (Intervention time is 3–4 weeks).
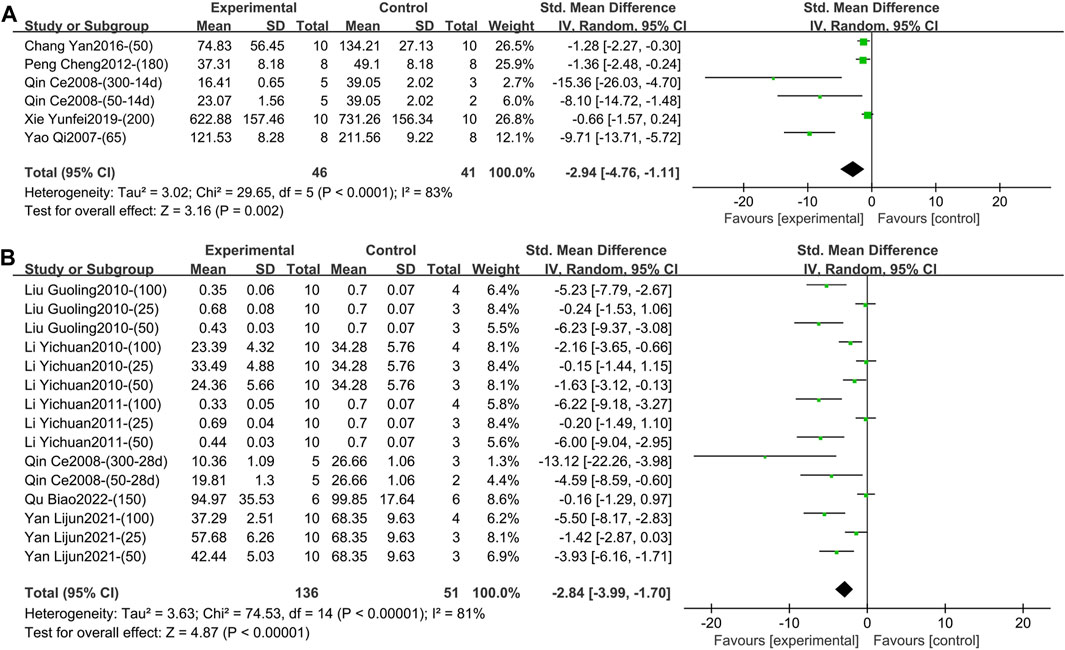
Figure 5. (A) Forest plot of IL-1β after 1–2 weeks of TGP intervention. (B) Forest plot of IL-1β after 3–4 weeks of TGP intervention.
Six studies involving 187 animals reported the effect of TGP intervention for 3–4 weeks on serum IL-1β (Qin, 2008; Li et al., 2010; Liu et al., 2010; Li et al., 2011; Yan et al., 2021; Qu et al., 2022). The combined results showed that TGP significantly reduced IL-1β levels, while heterogeneity between studies was large (SMD = −2.84, 95% CI [-3.99, −1.70], p < 0.00001, I2 = 81%) (Figure 5B; Supplementary Material S2.21). Sensitivity analysis showed that the result was robust (Supplementary Material S2.22). Subgroup analyses indicated that model type and animal strain were not sources of heterogeneity (p = 0.60, 0.21) (Supplementary Material S2.23, S2.24). Dose and TGP’s manufacturer (Institute of Clinical Pharmacology, Anhui Medical University, Ningbo Lihua Pharmaceutical Co., Ltd. and Ningbo Yicuijian Biological Technology Co., Ltd.) were sources of heterogeneity (p = 0.04, 0.002) (Supplementary Material S2.25, S2.26). The funnel plot (Supplementary Material S2.27) and Egger’s test (p < 0.001) indicated publication bias.
1) IL-6 (Intervention time is 1–2 weeks).
Two studies containing 40 animals reported the effect of TGP intervention for 1–2 weeks (specifically 2 weeks) on serum IL-6 (Chang et al., 2016; Xie, 2019). Compared with the control group, TGP reduced IL-6 levels with low heterogeneity, so a fixed-effects model was used (SMD = −0.80, 95% CI [-1.46, −0.15], p = 0.02, I2 = 34%) (Figure 6A; Supplementary Material S2.28).
2) IL-6 (Intervention time is 3–4 weeks).
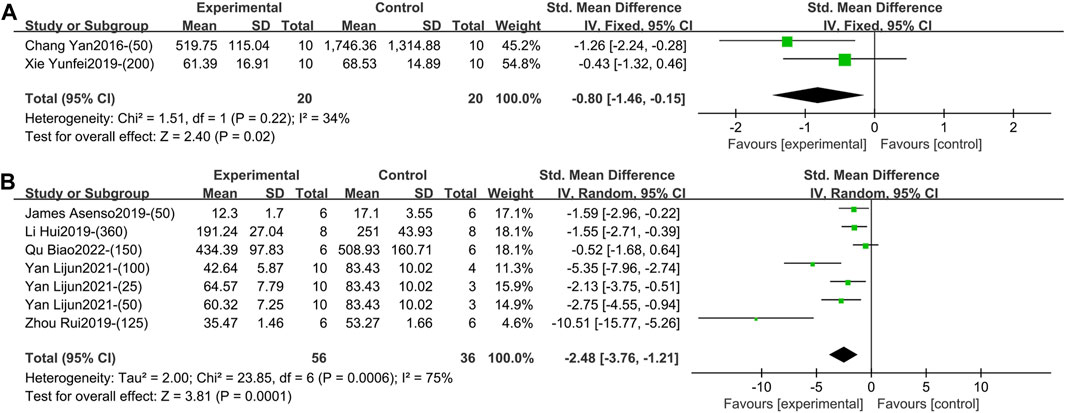
Figure 6. (A) Forest plot of IL-6 after 1–2 weeks of TGP intervention. (B) Forest plot of IL-6 after 3–4 weeks of TGP intervention.
Five studies involving 92 animals reported the effect of TGP on serum IL-6 after 3–4 weeks of intervention (Asenso et al., 2019; Li et al., 2019; Zhou et al., 2019; Yan et al., 2021; Qu et al., 2022). The combined results showed that TGP caused a significant reduction in IL-6 levels, but the heterogeneity was large (SMD = −2.48, 95% CI [-3.76, −1.21], p = 0.0001, I2 = 75%) (Figure 6B; Supplementary Material S2.29). Sensitivity analysis showed that this result was robust (Supplementary Material S2.30). Subgroup analyses suggested that dose, model type, animal species, and strain were not sources of heterogeneity (p = 0.40, 0.95, 0.21, 0.21) (Supplementary Material S2.31–S2.34). However, TGP’s manufacturer (Institute of Clinical Pharmacology, Anhui Medical University, Ningbo Yicuijian Biological Technology Co., Ltd. and Ningbo Lihua Pharmaceutical Co., Ltd.) was a source of heterogeneity (p = 0.03) (Supplementary Material S2.35).
3) IL-6 (Intervention time is 8 weeks).
One study reported the effect of TGP intervention for 8 weeks on serum IL-6 (Shen et al., 2019). Only descriptive analysis was performed, TGP significantly reduced IL-6 levels compared with controls (SMD = −3.38, 95% CI [-5.12, −1.64], p = 0.0001) (Supplementary Material S2.36).
1) IL-10 (Intervention time is 1–2 weeks).
One study reported the effect of TGP intervention for 1–2 weeks (specifically 2 weeks) on serum IL-10 (Xie, 2019). Only descriptive analysis was performed, TGP tended to increase IL-10 levels compared with the control group, but the difference was not statistically significant (SMD = 0.64, 95% CI [-0.27, 1.54], p = 0.17) (Supplementary Material S2.37).
2) IL-10 (Intervention time is 3–4 weeks).
Three studies containing 120 animals reported the effect of TGP on serum IL-10 after 3–4 weeks (specifically 3 weeks) of intervention (Li et al., 2010; Liu et al., 2010; Yuan, 2013). The combined results showed that TGP elevated IL-10 levels, but heterogeneity between studies was large (SMD = 1.44, 95% CI [0.16, 2.73], p = 0.03, I2 = 83%) (Figure 7; Supplementary Material S2.38). Sensitivity analysis indicated that the results were robust (Supplementary Material S2.39). Dose, animal species, and strain were not sources of heterogeneity (p = 0.39, 0.90, 0.90) (Supplementary Material S2.40–S2.42).
2) IL-10 (Intervention time is 8 weeks)
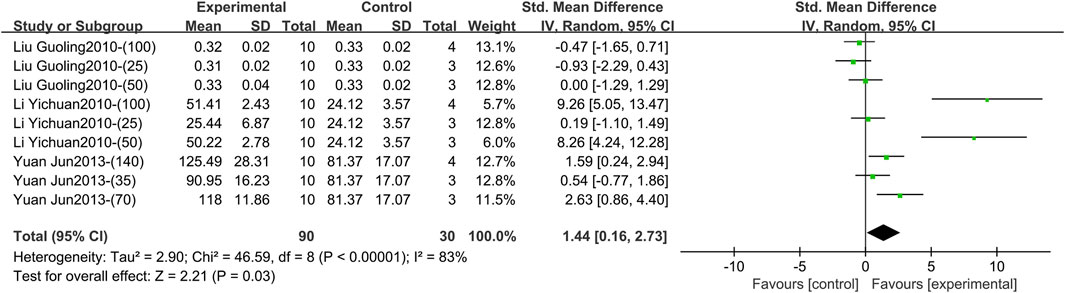
Figure 7. Forest plot of IL-10 after 3–4 weeks of TGP intervention.
One study reported the effect of TGP on serum IL-10 after 8 weeks of intervention (Shen et al., 2019). Only descriptive analysis was performed, TGP could increase IL-10 levels compared with the control group, and the difference was statistically significant (SMD = 1.86, 95% CI [0.58, 3.13], p = 0.004) (Supplementary Material S2.43).
1) IL-1 (Intervention time is 3–4 weeks)
Two studies containing 28 animals reported the effect of TGP intervention for 3–4 weeks (specifically 4 weeks) on serum IL-1 (Li, 2012; Zhou et al., 2019). The combined results showed that TGP failed to reduce IL-1 levels with a high degree of heterogeneity (SMD = −4.13, 95% CI [-9.48, 1.22], p = 0.13, I2 = 87%) (Figure 8; Supplementary Material S2.44). The animal strains, model types, and manufacturers of TGP were the same in both studies, so the heterogeneity may be caused by different intervention times and doses.
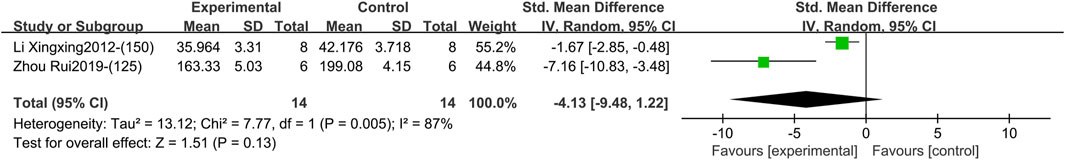
Figure 8. Forest plot of IL-1 after 3–4 weeks of TGP intervention.
1) IL-2 (Intervention time is 3–4 weeks)
One study containing three comparison groups reported the effect of TGP intervention for 3–4 weeks (specifically 3 weeks) on serum IL-2 (Yuan, 2013). The combined results indicated that IL-2 levels were significantly reduced, but the heterogeneity was large (SMD = −4.52, 95% CI [-7.37, −1.68], p = 0.002, I2 = 75%) (Figure 9; Supplementary Material S2.45). Sensitivity analysis indicated that the result was robust (Supplementary Material S2.46). Subgroup analysis based on dose showed it was a source of heterogeneity (p = 0.01) (Supplementary Material S2.47).
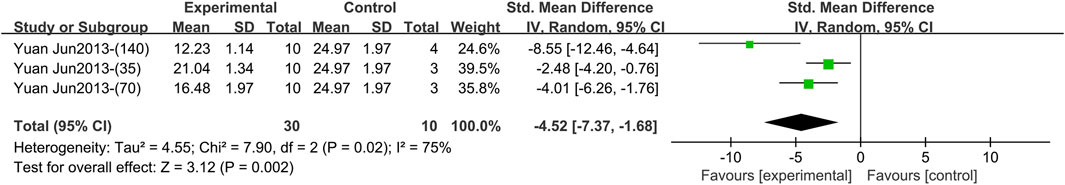
Figure 9. Forest plot of IL-2 after 3–4 weeks of TGP intervention.
1) IL-4 (Intervention time is 3–4 weeks).
Three studies including 96 animals reported the effect of TGP intervention for 3–4 weeks (specifically 3 weeks) on serum IL-4 (Li et al., 2010; Wang et al., 2013a; Yuan, 2013). The pooled results indicated that IL-4 levels were markedly elevated after TGP was used, but with great heterogeneity (SMD = 2.91, 95% CI [1.20, 4.62], p = 0.0009, I2 = 84%) (Figure 10; Supplementary Material S2.48). The robustness of the result is proved by sensitivity analysis (Supplementary Material S2.49). Subgroup analyses found that dose, animal species and strain, and TGP’s manufacturer were not sources of heterogeneity (p = 0.18, 0.06, 0.06, 0.21) (Supplementary Material S2.50–S2.53).

Figure 10. Forest plot of IL-4 after 3–4 weeks of TGP intervention.
1) IL-17 (Intervention time is 1–2 weeks).
One study reported the effect of TGP on serum IL-17 after 1–2 weeks (specifically 2 weeks) of intervention (Chang et al., 2016). Only descriptive analysis was performed, TGP tended to reduce IL-17 levels compared with model controls, but the difference was not statistically significant (SMD = −0.36, 95% CI [-1.25, 0.52], p = 0.42) (Supplementary Material S2.54).
2) IL-17 (Intervention time is 3–4 weeks).
Three studies containing 92 animals reported the effect of TGP intervention for 3–4 weeks (specifically 3 weeks) on serum IL-17 (Liu et al., 2012; Yuan, 2013; Asenso et al., 2019). The pooled results showed that TGP reduced IL-17 levels but with large heterogeneity (SMD = −2.02, 95% CI [-3.26, −0.78], p = 0.001, I2 = 75%) (Figure 11; Supplementary Material S2.55). Sensitivity analysis indicated that the result was robust (Supplementary Material S2.56). Dose, model type, animal species, and strain were not sources of heterogeneity (p = 0.15, 0.05, 0.53, 0.53) (Supplementary Material S2.57–S2.60).
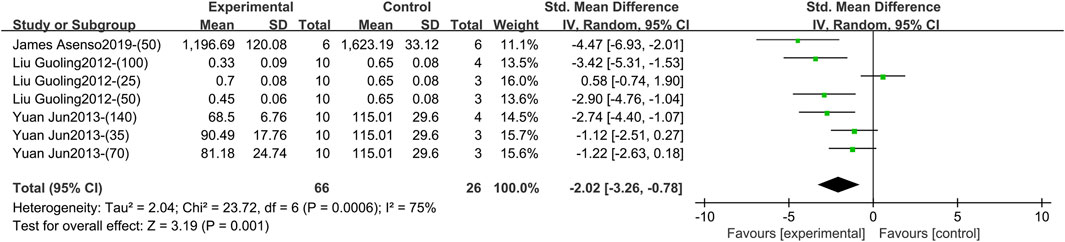
Figure 11. Forest plot of IL-17 after 3–4 weeks of TGP intervention.
1) IL-17α (Intervention time is 3–4 weeks).
One study reported the effect of TGP intervention for 3–4 weeks (specifically 4 weeks) on serum IL-17α (Zhou et al., 2018). Only descriptive analysis was performed, IL-17α levels were significantly lower in the experimental group than in the model control group (SMD = −2.27, 95% CI [-3.44, −1.09], p = 0.0002) (Supplementary Material S2.61).
2) IL-17α (Intervention time is 8 weeks).
One study reported the effect of TGP intervention for 8 weeks on serum IL-17α (Shen et al., 2019). Only descriptive analysis was performed, TGP markedly decreased IL- 17α levels versus controls (SMD = −4.47, 95% CI [-6.60, −2.35], p < 0.0001) (Supplementary Material S2.62).
1) IL-21 (Intervention time is 3–4 weeks)
One study reported the effect of TGP on serum IL-21 after 3–4 weeks (specifically 3 weeks) of intervention (Li et al., 2019). Only descriptive analysis was performed, the level of IL-21 was decreased after the use of TGP compared to controls (SMD = −3.26, 95% CI [-4.89, −1.63], p < 0.0001) (Supplementary Material S2.63).
1) VEGF (Intervention time is 3–4 weeks)
Two studies involving six comparison groups reported the effect of TGP intervention for 3–4 weeks on serum VEGF (Li et al., 2011; Liu et al., 2012). The pooled results showed that TGP resulted in a reduction in VEGF levels but with large heterogeneity (SMD = −2.64, 95% CI [-4.40, −0.88], p = 0.003, I2 = 83%) (Figure 12; Supplementary Material S2.64). Sensitivity analysis indicated that this result was robust (Supplementary Material S2.65). Dose subgroup analysis indicated that it was not a source of heterogeneity (p = 0.06) (Supplementary Material S2.66).
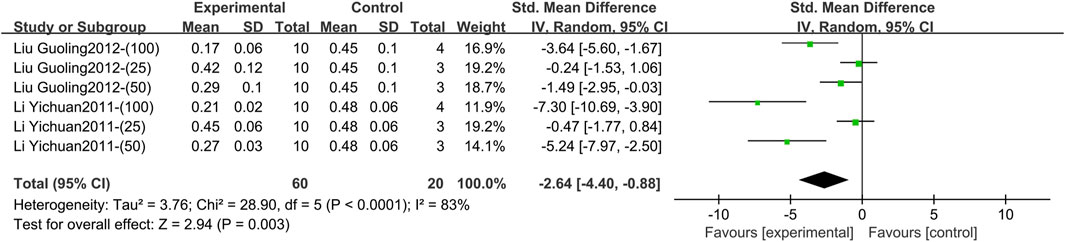
Figure 12. Forest plot of VEGF after 3–4 weeks of TGP intervention.
1) IFN-γ (Intervention time is 1–2 weeks)
Two studies containing 35 animals reported the effect of TGP intervention for 1–2 weeks on serum IFN-γ (Qin, 2008; Xie, 2019). The pooled results showed that the difference in IFN-γ between the two groups was not statistically significant and the heterogeneity was large (SMD = −6.40, 95% CI [-13.38, 0.58], p = 0.07, I2 = 79%) (Figure 13A; Supplementary Material S2.67). Sensitivity analysis showed that the result was robust (Supplementary Material S2.68). Subgroup analyses suggested that dose was not a source of heterogeneity (p = 0.32) (Supplementary Material S2.69), but animal strain (SD rat, Wistar rat) and TGP’s manufacturer [Ningbo Lihua Pharmaceutical Co., Ltd. and Anhui Bozhou Chinese herbal medicine market (self-made purification)] were sources of heterogeneity (p = 0.002, 0.002) (Supplementary Material S2.70, S2.71).
2) IFN-γ (Intervention time is 3–4 weeks).
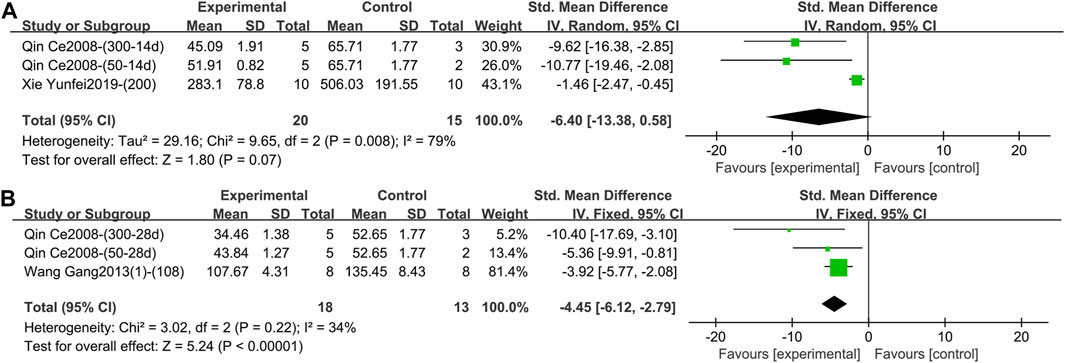
Figure 13. (A) Forest plot of IFN-γ after 1–2 weeks of TGP intervention. (B) Forest plot of IFN-γ after 3–4 weeks of TGP intervention.
Two studies containing three comparison groups reported the effect of TGP intervention for 3–4 weeks on serum IFN-γ (Qin, 2008; Wang et al., 2013a). The pooled results showed that TGP dramatically decreased IFN-γ levels with low heterogeneity (SMD = −4.45, 95% CI [-6.12, −2.79], p < 0.00001, I2 = 34%), so a fixed-effects model was used (Figure 13B; Supplementary Material S2.72).
1) PGE2 (Intervention time is 1–2 weeks).
One study reported the effect of TGP on serum PGE2 after 1–2 weeks (specifically 2 weeks) of intervention (Jia, 2015). Only descriptive analysis was performed, TGP could reduce PGE2 levels compared with the control group, and the variance was statistically significant (SMD = −8.03, 95% CI [-10.94, −5.12], p < 0.00001) (Supplementary Material S2.73).
2) PGE2 (Intervention time is 3–4 weeks)
One study reported the effect of TGP intervention for 3–4 weeks (specifically 4 weeks) on serum PGE2 (Zhou et al., 2019). Only descriptive analysis was performed, TGP dramatically lowered PGE2 levels compared with controls (SMD = −12.77, 95% CI [-19.11, −6.44], p < 0.0001) (Supplementary Material S2.74).
1) TGF-β1 (Intervention time is 1–2 weeks).
One study reported the effect of TGP on serum TGF-β1 after 1–2 weeks (specifically 2 weeks) of intervention (Chang et al., 2016). Only descriptive analysis was performed, TGP increased TGF-β1 levels compared with no TGP, and the difference was statistically significant (SMD = 1.29, 95% CI [0.31, 2.28], p = 0.01) (Supplementary Material S2.75).
2) TGF-β1 (Intervention time is 3–4 weeks).
One study involving three comparison groups reported the effect of TGP on serum TGF-β1 after 3–4 weeks (specifically 4 weeks) of intervention (Yuan, 2013). The pooled results suggested that TGP tended to increase TGF-β1 levels, but the difference was not statistically significant and heterogeneity was high (SMD = 2.28, 95% CI [-0.01, 4.58], p = 0.05, I2 = 81%) (Figure 14; Supplementary Material S2.76). The robustness of the result was demonstrated by sensitivity analysis (Supplementary Material S2.77). Subgroup analysis showed that dose was not a source of heterogeneity (p = 0.34) (Supplementary Material S2.78).
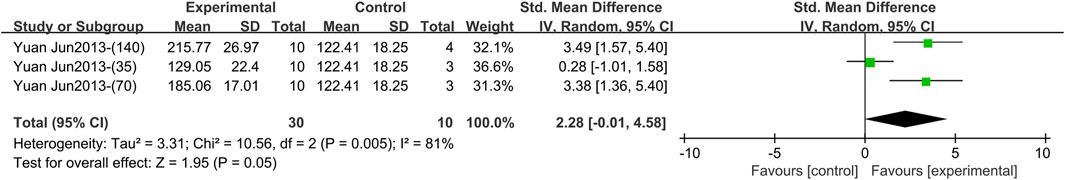
Figure 14. Forest plot of TGF-β1 after 3–4 weeks of TGP intervention.
This study summarized potential mechanisms of TGP on RA in the included studies, which were mainly divided into four aspects: regulating inflammatory cytokines, inhibiting synoviocyte proliferation and promoting synoviocyte apoptosis, inhibiting bone destruction, and regulating immune function. The specific mechanisms are shown in Table 2.
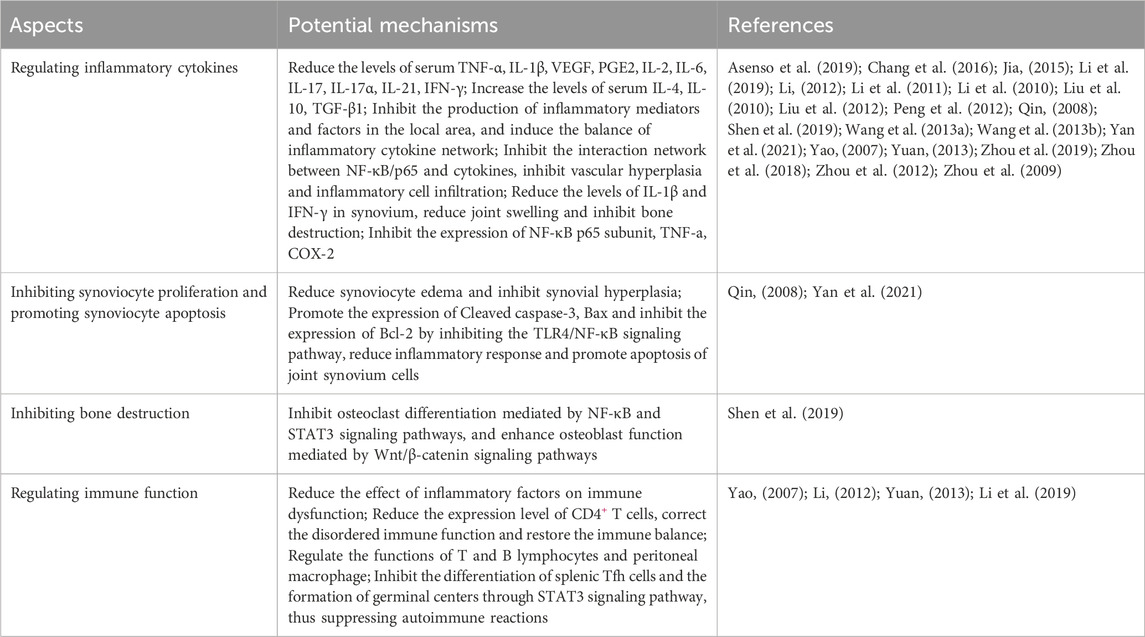
Table 2. Table of potential mechanisms of TGP on RA in the included studies.
By combining 24 studies, this article found that compared to the model control group, TGP decreased the levels of TNF-α, IL-1β, IL-6, and PGE2 and increased the levels of TGF-β1 after 1–2 weeks of intervention. After 3–4 weeks of intervention, the levels of TNF-α, IL-1β, IL-6, and so on were decreased and the levels of IL-10 and IL-4 were increased. After 8 weeks of intervention, the levels of TNF-α, IL-6, and IL-17α were decreased and the level of IL-10 was increased. There was no significant difference in the effects of TGP on the levels of IL-10, IL-17, and IFN-γ after 1–2 weeks of intervention and IL-1 and TGF-β1 after 3–4 weeks of intervention. The specific results are summarized in Table 3.
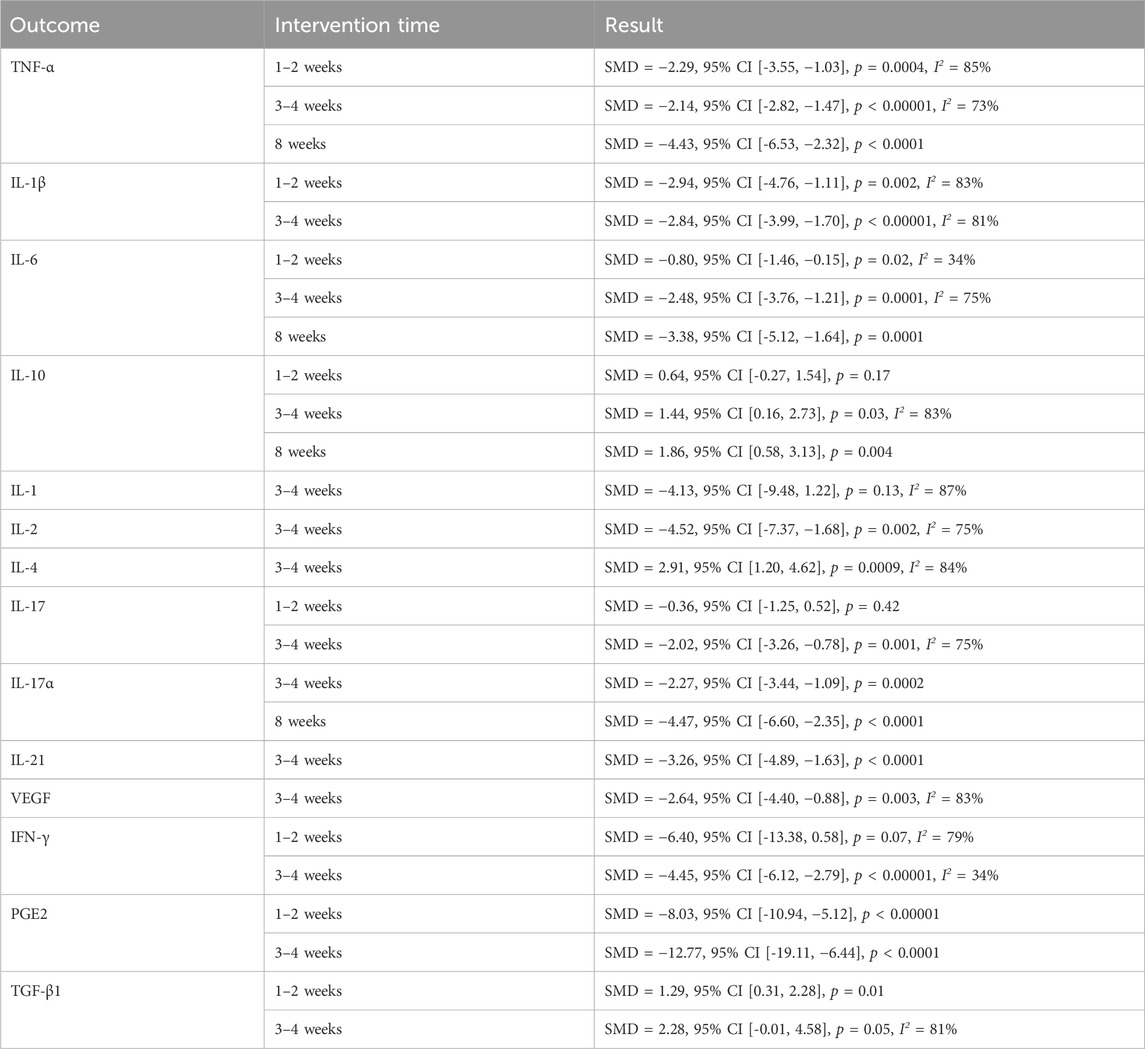
Table 3. Summary of results.
Due to the differences in animal species, strain, model type, TGP’s dose and manufacturer, intervention time, and other factors, clinical heterogeneity may be caused. Therefore, we reduced the possible clinical heterogeneity from two perspectives. First, before including the studies, we limited the dose to no more than twice the standard dose of the corresponding species. And the route of administration is limited to gavage. Second, before the results were combined, they were divided into 1–2 weeks, 2–4 weeks, and 8 weeks according to the different intervention times of the included studies.
After combining the results, this study found that the heterogeneity of most results was generally high. For this reason, the sensitivity analyses performed first proved that the results were all robust, and the subgroup analyses performed later found that the heterogeneity mainly originated from the animal strain, TGP’s manufacturer, and dose, while the animal species and model type were not the sources of heterogeneity. In terms of model types, neither AIA nor CIA can fully imitate human RA and can only reflect the nature of the disease from some aspects. Although there may be clinical heterogeneity between them, the results of this study showed that the model type was not the source of heterogeneity.
Although many studies were included in this study, most of them reported fewer outcomes, resulting in fewer comparison groups included in some outcomes. Moreover, the sources of heterogeneity are not consistent across outcomes, so sources of heterogeneity obtained through subgroup analyses need to be viewed with caution (Sun et al., 2010).
This study has five implications for future research. First of all, there may be some methodological heterogeneity in the included studies. There were deficiencies or lack of relevant instructions in random sequence generation, baseline characteristics, allocation concealment, blinding of animal keepers and investigators, and blinding of outcome evaluators, so it is hoped that future researchers will be more rigorous in designing and executing their experimental protocols, and more standardized in writing their manuscripts.
Secondly, the outcomes vary greatly among the included studies, and core outcome sets need to be studied and popularized (Kirkham et al., 2017). And then, at present, the experimental animals used in the relevant studies are mainly in the lower age stages, and there is a lack of studies in the higher age stages. It is hoped that future researchers can consider that the main incidence population of RA is in the high age stage, and supplement the research of related age stages.
Next, the intervention time of TGP was obviously discontinuous, and there was a lack of studies on corresponding intervention time (5–7 weeks or even longer). It is not difficult to find that the low, medium, and high dosages in some studies were 25, 50, and 100 mg·kg-1·day-1, respectively (Li et al., 2010; Liu et al., 2010; Li et al., 2011; Liu et al., 2012; Yan et al., 2021), which were different from the pre-designed dose subgroup analysis. This may be due to the fact that researchers are not starting from a clinical reality. Therefore, the intervention time and dose of TGP need to be reported more comprehensively, the minimum intervention time and dose that begin to take effect should reach a consensus, and the maximum intervention time and dose that stop increasing effect remain to be investigated. More high-quality animal studies are expected to emerge as a reference for clinical research. Finally, funnel plots of TNF-α (Intervention time is 3–4 weeks) and IL-1β (Intervention time is 3–4 weeks) suggest publication bias, so negative results need to be encouraged for publication.
This study is the first systematic review and meta-analysis of the effects of TGP on serum inflammatory cytokines in animal models of RA, with a complete set of outcomes included. There is a comprehensive study in this aspect. However, some studies have also reported local-level outcomes such as inflammatory factors and protein molecules in foot and claw synovial tissues, articular cartilage, and joint fluids. For example, TGP may exert anti-inflammatory effects by regulating the balance between Gαi and Gαs and decreasing the expression of β-arrestins (Wang et al., 2011; Jia et al., 2014). This aspect is not covered in this study, mainly due to the difference in measurement specimens and the lack of relevant studies. This perspective is expected to serve as an entry point for future systematic reviews and Meta-analyses to further evaluate the improvement of localized lesions in RA after drug administration, which will help to uncover and summarize the mechanism of TGP in the treatment of RA.
In summary, based on the existing studies, this study found that compared with the control group of the RA animal model, TGP can reduce the levels of serum pro-inflammatory cytokines such as TNF-α, IL-1β, and IL-6 and increase the levels of serum anti-inflammatory cytokines such as IL-10, exerting an anti-inflammatory effect by regulating and improving the levels of inflammatory cytokines and thus alleviating the disease. Given the low quality of the included studies and the lack of sufficient evidence, more high-quality studies are still needed to validate the results of this study.
The original contributions presented in the study are included in the article/Supplementary Material, further inquiries can be directed to the corresponding author.
MH: Data curation, Formal Analysis, Methodology, Software, Writing–original draft. ZH: Data curation, Formal Analysis, Methodology, Software, Writing–review and editing. MY: Data curation, Formal Analysis, Writing–review and editing.
The author(s) declare that financial support was received for the research, authorship, and/or publication of this article. This project was supported by the “One Hundred Talents” project to Enhance Scientific Research Ability in Hospital of Chengdu University of Traditional Chinese Medicine.
The authors declare that the research was conducted in the absence of any commercial or financial relationships that could be construed as a potential conflict of interest.
All claims expressed in this article are solely those of the authors and do not necessarily represent those of their affiliated organizations, or those of the publisher, the editors and the reviewers. Any product that may be evaluated in this article, or claim that may be made by its manufacturer, is not guaranteed or endorsed by the publisher.
The Supplementary Material for this article can be found online at: https://www.frontiersin.org/articles/10.3389/fphar.2024.1349259/full#supplementary-material
AIA, adjuvant-induced arthritis; CI, confidence interval; CIA, collagen-induced arthritis; CNKI, China National Knowledge Infrastructure; IFN-γ, interferon-γ; i. g., gavage; IL-1, interleukin-1; IL-1β, interleukin-1β; IL-2, interleukin-2; IL-4, interleukin-4; IL-6, interleukin-6; IL-10, interleukin-10; IL-17, interleukin-17; IL-17α, interleukin-17α; IL-21, interleukin-21; PGE2, prostaglandin E2; RA, rheumatoid arthritis; SD, Sprague Dawley; SMD, standardized mean difference; TGF-β1, transforming growth factor-β1; TGP, total glucosides of paeony; TNF-α, tumor necrosis factor-α; VEGF, vascular endothelial growth factor; WMD, weighted mean difference.
Asenso, J., Yu, J., Xiao, F., Zhao, M., Wang, J., Wu, Y., et al. (2019). Methotrexate improves the anti-arthritic effects of Paeoniflorin-6'-O-benzene sulfonate by enhancing its pharmacokinetic properties in adjuvant-induced arthritis rats. Biomed. Pharmacother. 112, 108644. doi:10.1016/j.biopha.2019.108644
Asquith, D. L., Miller, A. M., McInnes, I. B., and Liew, F. Y. (2009). Animal models of rheumatoid arthritis. Eur. J. Immunol. 39 (8), 2040–2044. doi:10.1002/eji.200939578
Chang, J., Wang, C., Chen, J., and Xu, Y. (2012a). Effects of total glucosides of paeony on the expression of matrix metalloproteinase-9 in paw tissue and inflammatory cytokines IL-1β and TNF-α in serum of rats with collagen-induced arthritis. Lishizhen Med. Materia Medica Res. 23 (09), 2187–2189.
Chang, J., You, L., and Hu, L. (2012b). Effect of total glucosides of paeony on the expression of inflammatory cytokines IL-1β and VEGF in serum of rats with collagen-induced rheumatoid arthritis. J. Community Med. 10 (16), 34–35.
Chang, Y., Jia, X., Wei, F., Wang, C., Sun, X., Xu, S., et al. (2016). CP-25, a novel compound, protects against autoimmune arthritis by modulating immune mediators of inflammation and bone damage. Sci. Rep. 6, 26239. doi:10.1038/srep26239
Choudhary, N., Bhatt, L. K., and Prabhavalkar, K. S. (2018). Experimental animal models for rheumatoid arthritis. Immunopharmacol. Immunotoxicol. 40 (3), 193–200. doi:10.1080/08923973.2018.1434793
Fu, M., Sang, X., and Cheng, H. (2022). Total glucosides of peony induce fibroblast-like synovial apoptosis, and ameliorate cartilage injury via blocking the NF-κB/STAT3 pathway. Ann. Transl. Med. 10 (2), 51. doi:10.21037/atm-21-6187
Gravallese, E. M., and Firestein, G. S. (2023). Rheumatoid arthritis - common origins, divergent mechanisms. N. Engl. J. Med. 388 (6), 529–542. doi:10.1056/NEJMra2103726
Hegen, M., Keith, J. C., Collins, M., and Nickerson-Nutter, C. L. (2008). Utility of animal models for identification of potential therapeutics for rheumatoid arthritis. Ann. Rheum. Dis. 67 (11), 1505–1515. doi:10.1136/ard.2007.076430
Higgins, J., Thomas, J., Chandler, J., Cumpston, M., Li, T., Page, M., et al. (2023). Cochrane handbook for systematic reviews of interventions version 6.4 (updated August 2023). Cochrane. Available at: https://training.cochrane.org/handbook.
Huang, J., Huang, X., Chen, Z., Zheng, Q., and Sun, R. (2004). Dose conversion among different animals and healthy volunteers in pharmacological study. Chin. J. Clin. Pharmacol. Ther. 9 (9), 1069–1072. Available at: https://manu41.magtech.com.cn/Jweb_clyl/EN/abstract/article_13208.shtml.
Jia, X. Y. (2015). The effects of PGE2 and receptors signal on dendritic cells and fibroblast-like synoviocytes in adjuvant-arthritis rats and the therapeutic effects of CP-25. Doctor thesis (Hefei: Anhui Medical University).
Jia, X. Y., Chang, Y., Sun, X. J., Wu, H. X., Wang, C., Xu, H. M., et al. (2014). Total glucosides of paeony inhibit the proliferation of fibroblast-like synoviocytes through the regulation of G proteins in rats with collagen-induced arthritis. Int. Immunopharmacol. 18 (1), 1–6. doi:10.1016/j.intimp.2013.09.007
Jiang, H., Li, J., Wang, L., Wang, S., Nie, X., Chen, Y., et al. (2020). Total glucosides of paeony: a review of its phytochemistry, role in autoimmune diseases, and mechanisms of action. J. Ethnopharmacol. 258, 112913. doi:10.1016/j.jep.2020.112913
Kirkham, J. J., Davis, K., Altman, D. G., Blazeby, J. M., Clarke, M., Tunis, S., et al. (2017). Core outcome set-STAndards for development: the COS-STAD recommendations. PLoS Med. 14 (11), e1002447. doi:10.1371/journal.pmed.1002447
Li, H., Cao, X. Y., Dang, W. Z., Jiang, B., Zou, J., and Shen, X. Y. (2019). Total Glucosides of Paeony protects against collagen-induced mouse arthritis via inhibiting follicular helper T cell differentiation. Phytomedicine 65, 153091. doi:10.1016/j.phymed.2019.153091
Li, X. X. (2012). Experimental study of WanBi qing pill treatment rats adjuvant arthritis. Master thesis. (Zhengzhou: Henan University of Chinese Medicine). Available at: https://d.wanfangdata.com.cn/thesis/ChJUaGVzaXNOZXdTMjAyMzA5MDESB0Q0jkwNTQaCG5kd29yZm1k.
Li, Y., Liu, G., Lu, K., Hu, L., and Guo, H. (2011). Experimental study on the effect of total gluscosides of paeony on the type II collagen-induced arthritis in rats. Chin. J. Clin. Pharmacol. 27 (11), 871–873. doi:10.13699/j.cnki.1001-6821.2011.11.003
Li, Y., Zhang, Y., Liu, G., Gao, M., Chang, J., Shen, Y., et al. (2010). Effect of total glucosides of paeony on serum LI-1β, TNF-α, IL-4 and IL-10 and joint immersion fluid NO and PGE2 in collagen-induced arthritis rats. Shaanxi J. Traditional Chin. Med. 31 (09), 1253–1255.
Lin, Y. J., Anzaghe, M., and Schülke, S. (2020). Update on the pathomechanism, diagnosis, and treatment options for rheumatoid arthritis. Cells 9 (4), 880. doi:10.3390/cells9040880
Liu, G., Li, Y., and Shen, Y. (2010). Inhibitory effect of total glucosides of paeonia on the NF-κB/p65 protein expression in paws of RA rats. Chin. J. Cell. Mol. Immunol. 26 (11), 1082–1084. doi:10.13423/j.cnki.cjcmi.005688
Liu, G., Zhang, Y., Lu, K., Li, Y., and Hu, L. (2012). The anti-inflammatory effects and mechanisms study of total glucosides of paeonia on adjuvant arthritis rats. Mod. Prev. Med. 39 (20), 5348–5350+5352.
McNamee, K., Williams, R., and Seed, M. (2015). Animal models of rheumatoid arthritis: how informative are they? Eur. J. Pharmacol. 759, 278–286. doi:10.1016/j.ejphar.2015.03.047
Peng, C., Perera, P. K., Li, Y. M., Fang, W. R., Liu, L. F., and Li, F. W. (2012). Anti-inflammatory effects of Clematis chinensis Osbeck extract(AR-6) may be associated with NF-κB, TNF-α, and COX-2 in collagen-induced arthritis in rat. Rheumatol. Int. 32 (10), 3119–3125. doi:10.1007/s00296-011-2083-8
Qin, C. (2008). The effect of total glucosides of paeony on IL-1β and IFN-γ in blood plasm and synovium of rats with adjuvant arthritis. Master thesis (Shijiazhuang: Hebei Medical University).
Qu, B., Wang, X. L., Zheng, D. C., Mai, C. T., Liu, Z. Q., Zhou, H., et al. (2022). Novel treatment for refractory rheumatoid arthritis with total glucosides of paeony and nobiletin codelivered in a self-nanoemulsifying drug delivery system. Acta Pharmacol. Sin. 43 (8), 2094–2108. doi:10.1038/s41401-021-00801-6
Shen, W., Guan, Y. Y., Wu, R. M., Liu, L. X., Li, H. D., Bao, W. L., et al. (2019). Protective effects of Wang-Bi tablet on bone destruction in collagen-induced arthritis by regulating osteoclast-osteoblast functions. J. Ethnopharmacol. 238, 111861. doi:10.1016/j.jep.2019.111861
Smolen, J. S., Aletaha, D., and McInnes, I. B. (2016). Rheumatoid arthritis. Lancet 388 (10055), 2023–2038. doi:10.1016/s0140-6736(16)30173-8
Sparks, J. A. (2019). Rheumatoid arthritis. Ann. Intern Med. 170 (1), ITC1–ITC16. Itc1-itc16. doi:10.7326/aitc201901010
Sun, X., Briel, M., Walter, S. D., and Guyatt, G. H. (2010). Is a subgroup effect believable? Updating criteria to evaluate the credibility of subgroup analyses. Bmj 340, c117. doi:10.1136/bmj.c117
Tang, Y. M. (2020). Effect of total glucosides of paeony on synovial injury in CIA rats: mechanism of expression of IL-4, IFN-γ and TGF-β in small intestinal mucosa and mesenteric lymph nodes. Master thesis (Chengdu: Chengdu University of Traditional Chinese Medicine). doi:10.26988/d.cnki.gcdzu.2020.000264
Wang, G., Wang, L., Wang, J., and Wang, T. (2013a). Effect of large-leaved gentian extract on interferon-γ and interleukin-4 level of collagen induced arthritis rats. J. Sichuan Traditional Chin. Med. 31 (06), 72–74.
Wang, G., Wang, L., Wang, J., Wang, T., and Liu, Z. (2013b). Effect of alcohol extractive from gentianae macrophyllae radix on serum anti-CCP and TNF-α in collagen induced arthritis rats. Chin. J. Exp. Traditional Med. Formulae 19 (19), 302–305.
Wang, Q. (2019). Study on the attenuation of hepatotoxicity in the treatment of rheumatoid arthritis by xiaoyaosan simplified prescription. Master thesis (Jinzhong: Shanxi University of Chinese Medicine).
Wang, Q. T., Zhang, L. L., Wu, H. X., and Wei, W. (2011). The expression change of β-arrestins in fibroblast-like synoviocytes from rats with collagen-induced arthritis and the effect of total glucosides of paeony. J. Ethnopharmacol. 133 (2), 511–516. doi:10.1016/j.jep.2010.10.022
Xia, W., Huang, Z. J., Feng, Y. W., Tang, A. Z., and Liu, L. (2021). Body surface area-based equivalent dose calculation in tree shrew. Sci. Prog. 104 (2), 368504211016935. doi:10.1177/00368504211016935
Xie, Y. F. (2019). Investigation of therapeutic mechanism of compatibility of aconiti lateralis radix praeparata and paeoniae radix alba in wind-cold-dampness type bi-syndrome. Doctor thesis (Chengdu: Chengdu University of Traditional Chinese Medicine).
Yan, L., Tong, S., Liu, J., Gao, D., Chen, N., and Hu, J. (2021). Therapeutic effect of total glucosides of paeony in model rats with rheumatoid arthritis by mediating TLR4/NF-κB signaling pathway and its mechanisim. J. Jilin Univ. Ed. 47 (02), 390–396. doi:10.13481/j.1671-587x.20210219
Yang, K., Zeng, L., Long, Z., He, Q., Xiang, W., Ge, A., et al. (2023). Efficacy and safety of total glucosides of paeony in the treatment of 5 types of inflammatory arthritis: a systematic review and meta-analysis. Pharmacol. Res. 195, 106842. doi:10.1016/j.phrs.2023.106842
Yao, Q. (2007). Effect of total saponins of Panax japonicus on anti-inflammatory and immunomodulatory effects in adjuvant-induced arthritis. Master thesis. (Yichang: China Three Gorges University). Available at: https://d.wanfangdata.com.cn/thesis/ChJUaGVzaXNOZXdTMjAyMzA5MDESB0QwMzkyOTcaCDRkcnh6cjJ0.
Yuan, J. (2013). Effects and mechanisms of Paeoniflorin-6'-O-benzene (CP-25) on mice with collagen-induced arthritis. Master thesis (Hefei: Anhui Medical University).
Zeng, X., Zhang, Y., Kwong, J. S., Zhang, C., Li, S., Sun, F., et al. (2015). The methodological quality assessment tools for preclinical and clinical studies, systematic review and meta-analysis, and clinical practice guideline: a systematic review. J. Evid. Based Med. 8 (1), 2–10. doi:10.1111/jebm.12141
Zhang, L., and Wei, W. (2020). Anti-inflammatory and immunoregulatory effects of paeoniflorin and total glucosides of paeony. Pharmacol. Ther. 207, 107452. doi:10.1016/j.pharmthera.2019.107452
Zhou, R., Tang, Z., Wu, J., Xie, P., Cui, C., Song, Z., et al. (2019). Applicability of membrane separation technique for concentrating anti-inflammatory compounds of Cornus officinalis Decoction based on anti-rheumatoid arthritis activity. Chin. Traditional Herb. Drugs 50 (05), 1182–1188.
Zhou, W., Zhang, Q., Bi, B., Meng, D., Rexiti, F., and Zhang, R. (2018). Comparative research on the mechanisms of two kinds of Chinese herbal medicine based on the collagen induced arthritis rat model. J. Liaoning Univ. Traditional Chin. Med. 20 (01), 26–29. doi:10.13194/j.issn.1673-842x.2018.01.007
Zhou, X., Zhou, W., He, J., Zhu, M., An, H., Mu, C., et al. (2012). Comparison of the effect and mechanism of Leigongteng, Total Glucosides of Paeony and Xingren decoction on adjuvant arthritis rats. Mod. J. Integr. Traditional Chin. West. Med. 21 (10), 1048–1050.
Keywords: total glucosides of paeony, rheumatoid arthritis, animal models, inflammatory cytokines, meta-analysis
Citation: He M, Hu Z and Yang M (2024) Effects of total glucosides of paeony on serum inflammatory cytokines in animal models of rheumatoid arthritis: a systematic review and meta-analysis. Front. Pharmacol. 15:1349259. doi: 10.3389/fphar.2024.1349259
Received: 07 December 2023; Accepted: 01 March 2024;
Published: 25 March 2024.
Edited by:
Mona Abdel Tawab, Central Laboratory of German Pharmacists, GermanyReviewed by:
Filipa Pinto-Ribeiro, University of Minho, PortugalCopyright © 2024 He, Hu and Yang. This is an open-access article distributed under the terms of the Creative Commons Attribution License (CC BY). The use, distribution or reproduction in other forums is permitted, provided the original author(s) and the copyright owner(s) are credited and that the original publication in this journal is cited, in accordance with accepted academic practice. No use, distribution or reproduction is permitted which does not comply with these terms.
*Correspondence: Zhipeng Hu, NTQ1MDUzMzA5QHFxLmNvbQ==; Maoyi Yang, MzQwNjY3MzY1OEBxcS5jb20=
†These authors share second authorship
Disclaimer: All claims expressed in this article are solely those of the authors and do not necessarily represent those of their affiliated organizations, or those of the publisher, the editors and the reviewers. Any product that may be evaluated in this article or claim that may be made by its manufacturer is not guaranteed or endorsed by the publisher.
Research integrity at Frontiers
Learn more about the work of our research integrity team to safeguard the quality of each article we publish.