 Su-Yun Zhang
 Qiong Luo1†‡
 Jian Zhu
 Xiang-Qi Chen
 Sheng Yang
94% of researchers rate our articles as excellent or good
Learn more about the work of our research integrity team to safeguard the quality of each article we publish.
Find out more
ORIGINAL RESEARCH article
Front. Pharmacol. , 22 April 2024
Sec. Pharmacology of Anti-Cancer Drugs
Volume 15 - 2024 | https://doi.org/10.3389/fphar.2024.1341039
This article is part of the Research Topic Potential Biomarkers, Drug Targets, and New Therapeutic Approach in Intracavitary Cancer Therapy View all 8 articles
Background: Gastric cancer (GC) is one of the major malignancies threatening human lives and health. Non-SMC condensin II complex subunit D3 (NCAPD3) plays a crucial role in the occurrence of many diseases. However, its role in GC remains unexplored.
Materials and Methods: The Cancer Genome Atlas (TCGA) database, clinical samples, and cell lines were used to analyze NCAPD3 expression in GC. NCAPD3 was overexpressed and inhibited by lentiviral vectors and the CRISPR/Cas9 system, respectively. The biological functions of NCAPD3 were investigated in vitro and in vivo. Gene microarray, Gene set enrichment analysis (GSEA) and ingenuity pathway analysis (IPA) were performed to establish the potential mechanisms.
Results: NCAPD3 was highly expressed in GC and was associated with a poor prognosis. NCAPD3 upregulation significantly promoted the malignant biological behaviors of gastric cancer cell, while NCAPD3 inhibition exerted a opposite effect. NCAPD3 loss can directly inhibit CCND1 and ESR1 expression to downregulate the expression of downstream targets CDK6 and IRS1 and inhibit the proliferation of gastric cancer cells. Moreover, NCAPD3 loss activates IRF7 and DDIT3 to regulate apoptosis in gastric cancer cells.
Conclusion: Our study revealed that NCAPD3 silencing attenuates malignant phenotypes of GC and that it is a potential target for GC treatment.
Currently, gastric cancer is one of the major malignancies threatening human lives and health (Smyth et al., 2020; Sun et al., 2020). The global cancer statistics report (GLOBOCAN) showed that there were 1.04 million new cases of gastric cancer globally in 2018, making it the fifth most common malignancy, and 0.78 million deaths caused by this disease, making it the third leading cause of cancer death (Bray et al., 2018). Gastric cancer (GC) is a multi-step process that is affected by Helicobacter pylori infection, host susceptibility, and other environmental factors. Gastric cancer is also a multifactorial process caused by the accumulation of a large number of genetic and epigenetic changes in oncogenes and tumor suppressor genes, which results in dysregulation in many signaling pathways, disruption of cell cycle, and disturbance of the equilibrium between proliferation and death (Berger et al., 2016). Therefore, there are still many challenges in gastric cancer prevention and treatment, and how to improve gastric cancer diagnosis and treatment is still a global focus and hotspot. Tumor molecular biology studies have shown that tumorigenesis and tumor progression is an extremely complex biological behavior involving the participation of many genes, multifactorial interactions, and multi-stage development (Bass et al., 2014). Therefore, in-depth understanding of the molecular biology mechanisms of gastric cancer occurrence and progression is vital in the search for more effective prevention and treatment measures.
Non-SMC condensin II complex subunit D3 (NCAPD3) is a subunit of condensin II and the NCAPD3 gene is located in chromosome 13q25. Condensin II is a pentameric complex consisting of XCAPD3, CAP-G2, CAP-H2, SMC2, and SMC4 (Zhang et al., 2014). Condensin complexes are divided into condensin I and condensin II. NCAPD3 and condensin II were first discovered in human HeLa cells and named by Ono et al. (2004). In 2008, Maeshima et al. found that condensins play a critical role in chromosome condensation and separation during mitosis in eukaryotic cells (Maeshima and Eltsov, 2008). In 2011, Abe et al. found that cyclin-dependent kinase-mediated NCAPD3 phosphorylation in the prophase of mitosis can result in chromosome condensation (Abe et al., 2011). In 2015, Bakhreha et al. found that inducing a CAP-D3T1403A mutation in the NCAPD3 ortholog in chicken DT40 cells can cause shortening of the mitotic chromosome axis, leading to disruption of cell division during the prophase (Bakhrebah et al., 2015). Although little is known about the expression and role of NCAPD3 in human tumors, aberrant NCAPD3 expression and its potential effects have been observed in tumor tissues. In 2008, Lapointe pointed out that the postoperative recurrence rate is lower in prostate cancer patients with low postoperative NCAPD3 expression. Hence, NCAPD3 can be used as a prognostic predictor of prostate cancer after surgery (Lapointe et al., 2008). In 2016, Dawkins et al. found that low NCAPD3 expression in pancreatic cancer is intimately associated with good prognosis (Dawkins et al., 2016). However, there have been no studies on the correlation between NCAPD3 and gastric cancer.
In the present study, deep mining of gastric cancer and paracancerous tissue gene sequences in The Cancer Genome Atlas (TCGA) was performed, and RNA sequence data of gastric cancer and paracancerous tissues in the TCGA database were analyzed. The results showed that NCAPD3 is significantly upregulated in gastric cancer tissues. Then gastric cancer and normal gastric mucosal tissues were randomly selected from 67 gastric cancer patients who underwent radical subtotal gastrectomy or total gastrectomy in Fujian Medical University Union Hospital. These tissues were used for immunohistochemical staining. The results showed that NCPADC3 is highly expressed in gastric cancer tissues and is intimately associated with poor prognosis. These findings demonstrated the potential importance and clinical value of NCAPD3 in gastric cancer prevention and treatment.
Subsequently, in vitro and in vivo experiments were conducted on NCAPD3 to investigate the effects of NCAPD3 on gastric cancer cell proliferation, invasion, migration, and apoptosis through overexpression and knockout/knockdown experiments. To understand the potential molecular mechanisms of NCAPD3 knockdown on malignant cytological behavior in gastric cancer, advanced molecular biology techniques and gene chips were employed to measure the effects of NCAPD3 knockdown on gene expression and its related functional pathways, and the potential biological mechanisms of NCAPD3 were examined after obtaining the gene expression spectrum. Next, gene set enrichment analysis (GSEA) was employed to further elucidate the effects of NCAPD3 knockdown on canonical pathways, cellular components, and immune, oncogene, and transcription factor gene sets to examine the role of NCAPD3 knockdown in gastric cancer occurrence and progression at different levels (Bustin et al., 2009; Liu et al., 2017; Zhang et al., 2021). In summary, this NCAPD3 research is expected to provide a new target for gastric cancer treatment and inspire new therapeutic strategies for in-depth basic research and new drug development in clinical practice for gastric cancer.
Gastric cancer (stomach adenocarcinoma, STAD) RNAseq database and clinical information were downloaded from TCGA (https://cancergenome.nih.gov/). As of 30 June 2018, there were 443 samples with useable gastric cancer data in the TCGA database, of which 416 were mRNA chip or RNAseq data samples, and 32 pairs were RNAseq v2 paired sample data with pathological information. Biological coefficient of variation (BCV) was observed for quality control, and 26 paired samples with stable data were selected. Expression spectrum analysis was performed based on this paired sample RNAseq data.
AGS, SGC7901, MGC803, and BGC823 gastric cancer cell lines were purchased from Shanghai Genechem. RPMI 1640 culture medium, PBS, and fetal bovine serum were purchased from Hyclone (United States), and Opti-MEM culture medium was purchased from Gibco (United States). NCAPD3 overexpression lentivirus (LV-NCAPD3), blank control vector lentivirus (LV-NC1), shRNAs targeting the NCAPD3 gene (shRNA-NCAPD3-1/2/3), single guide RNAs (sgRNAs) targeting human NCAPD3 (sgRNA-NCAPD3-1/2/3) and their negative control (shRNA-NC and sgRNA-NC) were purchased from Shanghai Genechem. Supplementary Table S1 shows the sequences of shRNAs and sgRNAs. Knockout and Mutation Detection Kit were purchased from Shanghai Genesci Medical Technology. The TRIzol reagent was purchased from Shanghai Pufei Biotechnology. The reverse transcription kit was purchased from Promega (United States). PCR primers were synthesized by Shanghai Genechem. The MTT assay kit was purchased from Genview (United States). The AnnexinV-APC apoptosis assay kit was purchased from eBioscience (United States). Transwell chambers with matrigel were purchased from Corning (United States). NCAPD3, TNFAIP3, FADD, IRS1, SMAD3, CD44, and MAP1LC3B antibodies were purchased from Abcam (United Kingdom). The CDK6 antibody was purchased from CST (United States). The FLAG antibody was purchased from Sigma-Aldrich (Germany). The GAPDH antibody was purchased from Santa-Cruz Biotechnology (United States). The marker (catalogue number 26619) was purchased from Thermo (United States).
All clinical samples, including 67 pairs of gastric cancer and paracancerous tissues, were obtained from the tissue bank of Fujian Medical University Union Hospital. The application of archived cancer samples was approved by the Ethics Committee of Fujian Medical University Union Hospital (No. 2021WSJK042). In this study, no subjects received preoperative radiotherapy or chemotherapy. All resected specimens were stored at −80 °C for long-term storage. Written informed consents were obtained from all of patients or their guardians.
RPMI-1640/DMEM containing 10% fetal bovine serum and 1% penicillin and streptomycin solution was used for culture of the four gastric cancer cell lines (AGS, MGC803, BGC823, and SGC7901) in a 37 °C, 5% CO2 incubator.
The lentivirus plasmid containing full-length NCAPD3 was used for NCAPD3 overexpression, and the empty plasmid was used as a negative control. Additionally, shRNA plasmids targeting NCAPD3 were used for NCAPD3 knockdown, and shRNA plasmids containing non-specific scrambled shRNA sequences were used as a negative control (shNCs). Lentiviruses were used to transfect knockdown plasmids into GC cells. The culture medium was changed 6 h after lentivirus vectors were transfected into GC cells. Fetal bovine serum (FBS, 10%) was added to the new culture medium, and total RNA and total protein were extracted after 48 h of culture.
The CRISPR/Cas9 system contains the LV-cas9-puro and LV-sgRNA-EGFP recombinant lentiviruses vectors. LV-cas9-puro carries a puromycin resistance gene and LV-sgRNA-EGFP contains an enhanced green fluorescent protein (EGFP) tag. The three single guide RNAs (sgRNAs) targeting human NCAPD3 were designed and synthesized by Shanghai Genechem. Sequencing was used to validate the sequences of the synthesized sgRNAs. The LV-cas9-puro and LV-sgRNA-EGFP vectors were constructed by Shanghai Genechem.
First, LV-cas9-puro lentiviruses were used to transfect AGS cells. Three days after transfection, a suitable amount of puromycin was used for 3 days of selection to obtain AGS cells with stable Cas9 expression. Following that, the three LV-sgRNA-EGFP lentiviruses were used to transfect Cas9-AGS cells. After 3 days of transfection, an inverted microscope was used to look for green fluorescent protein (GFP), and the percentage of green, fluorescent cells was calculated.
The Knockout and Mutation Detection Kit was used to detect gene knockout 5 days after LV-sgRNA-EGFP lentivirus infection according to the manufacturer’s instructions. In brief, the genomic DNA extraction kit was used to extract genomic DNA for PCR amplification according to the manufacturer’s instructions. The PCR conditions used were as follows: pre-denaturation at 94 °C for 90 s, followed by 40 cycles of denaturation at 94 °C for 30 s, annealing at 60 °C for 30 s, and extension at 72 °C for 60 s, followed by final extension at 72 °C for 5 min. The PCR products were cooled to <40 °C. Then, 1 μL Cruiser™ was added to 3 μL PCR product, and the mixture was incubated at 45 °C for 20 min for enzymatic cleavage. Finally, 2% agarose gel electrophoresis was used to observe enzymatic cleavage. Supplementary Table S2 shows the PCR primer sequences.
Gastric cancer cells in the logarithmic growth phase were harvested and seeded at 1,500 cells/well in a 96-well plate. Triplicates were set up for every group, and the final volume of culture medium in each well was 100 µL. The cells were cultured under normal conditions. After 24, 48, 72, 96, and 120 h, 20 µL MTT (5 mg/mL) was added, and the 96-well plates were cultured normally for 4 h in an incubator. After that, the culture medium was carefully aspirated and 100 µL DMSO was added. The plates were incubated with shaking for 2–5 min before a microplate reader was used to read the optical density (OD) of each well at 490 nm.
Pre-cooled PBS was used to wash the cells before trypsin was used for digestion and cells were collected. Following that, 4 °C pre-cooled D-Hanks solution was used to wash the cells, and then 1 × binding buffer was added. Cells were collected by centrifugation before 200 µL 1 × binding buffer was used to resuspend the cell pellet. Next, 10 µL AnnexinV-APC was added for staining. After incubating at room temperature in the dark for 10–15 min, a flow cytometer was used to measure changes in apoptosis rate in the various groups. This procedure was carried out in triplicate for each sample.
After cells had undergone trypsin digestion, serum-free culture medium was used for washing. Following that, serum-free culture medium was used to resuspend cells and enumeration was carried out. A cell suspension of 10 × 104 cells/200 μL was added to every Transwell chamber, and 650 μL of 30% FBS complete culture medium was added to the lower chamber, with triplicate wells for each group. The cells were incubated in a 37 °C incubator for 20 h. After 20 h of culture, 1 mL of 4% formaldehyde was added to every well, and room temperature fixation was carried out for 10 min. The cells were stained, the fixing solution was discarded, and 1× PBS was used to wash the cells once. Subsequently, 1 mL of 0.5% crystal violet solution was added to every well. At 30 min after staining, 1× PBS was used to wash the wells thrice. The plate was dried and observed. A cotton bud was used to gently remove cells that had not migrated in the Transwell chambers, and the chambers were observed under a 200 × microscope. Three random fields were selected per well for enumeration, and ImageJ was used for enumeration. Each expriment was done in triplicate.
Cells in the logarithmic growth phase from the various experimental groups were digested with trypsin before complete culture medium was used to resuspend the cells (plating density was determined based on cell size to achieve >90% confluency on the following day). Next, cells were cultured in 96-well plates in a 37 °C and 5% CO2 incubator, with quintuplicate wells per group and 100 μL/well. On the following day, a wound making tool was used to gently scratch the center of the lower part of wells in the 96-well plates. PBS was used to gently wash the plates 2–3 times, and 0.5% FBS culture medium was added. Photographs were taken, and Celigo was used to analyze the migration area at 0 h and 8 h after scratching.
Trizol reagent was used to extract total RNA from the various groups, followed by reverse transcription to cDNA. Next, fluorescence quantitative PCR was carried out. The primer sequences for real-time PCR analysis are listed in Supplementary Table S3. The reaction conditions were pre-denaturation at 95 °C for 30 s followed by 40 cycles of 95 °C for 5 s and 60 °C for 30 s. Triplicate wells were set up for every sample, and the 2−ΔΔCT method was used to analyze RT-PCR data. Relative mRNA expression changes were calculated (Bustin et al., 2009).
Cells in the logarithmic growth phase were collected and washed twice with PBS. The RIPA lysis buffer and protease inhibitor (or phosphatase inhibitor) mixture was used to extract total protein after transfection. The BCA assay kit was used for protein quantitation. Following that, SDS-PAGE was used to separate proteins (20–30 µg), and proteins were transferred to a PVDF membrane. The membrane was blocked with TBST buffer containing 5% skimmed milk at room temperature for 1 h. Next, the membrane was incubated with primary antibodies at 4 °C overnight. The membrane was washed four times with TBST followed by incubation with secondary antibody for 1.5 h. The membrane was washed four times with TBST, and the ECL reagent was used for luminescence, followed by development and imaging. Briefly, excess ECL solution was removed and membrane was put inside plastic wrap inside X-ray film cassette. Next, we expose membrane to the X-ray film in cassette in dark room for 1–2 min. We developed with the help of Carestream medical film processor using fixer and developer and then measure the band intensity using ImageJ.
Co-IP was performed using the protein A/G plus-agarose immunoprecipitation kit (Santa Cruz Biotechnology, United States), according to the manufacturer’s instructions (Liu et al., 2017). Briefly, the GC cells were lysed by RIPA lysis buffer, followed by total protein extraction. The concentration of proteins was detected using BCA assay kit according to previous studies (Liu et al., 2017; Zhang et al., 2021). Then cell lysate was incubated overnight incubation at 4 °C with IP antibody, followed by incubation with 20 μL protein A/G PLUS-Agarose for 1 h to form an immune complex. The complexes were washed twice with RIPA lysis buffer and resuspended in 6× loading buffer, denatured for 10 min. The suspensions were further analyzed by Western blotting.
Selected gastric cancer tissue samples and their paired paracancerous tissue samples, which were fixed with 4% formaldehyde embedded in paraffin blocks, were made into 3 μm thick continuous sections. The sections were adhered to poly-L-lysine-coated glass slides and dried in a 70 °C oven for 4 h. NCAPD3 monoclonal antibody was purchased from Abcam PLC (United Kingdom). SP immunohistochemistry assay kit and DAB substrate were purchased from Fuzhou Maixin Biotech. Staining was performed according to the manufacturer’s instructions, and PBS was used instead of the primary antibody for the negative control. The positive control was provided by the company. Xylene, absolute ethanol, and PBS were analytical grade.
Immunohistochemistry staining of NCAPD3 was scored by two independent experienced pathologists. For each sample, the score of staining intensity was assigned as follows: 0, negative staining; 1, weak staining (light yellow); 2, moderate staining (yellow brown) and 3, strong staining (brown) (Luo et al., 2020). And the percentage of stained cells was scored as 0 (<5% stained cells); 1 (5%–10% stained cells); 2 (11%–50% stained cells); 3 (51%–80% stained cells) and 4 (>80% stained cells). The final score was defined as staining score multiplied by proportion score (Guo et al., 2021). Final scores of 0–4 and 6–12 were considered to be low and high expression, respectively (Hou et al., 2014).
Twenty five-week-old male nude mice were randomized into two groups: the negative control group in which untreated MGC803 gastric cancer cells were inoculated, and the NCAPD3-knockdown group in which MGC803 gastric cancer cells that were transfected with NCAPD3-shRNA lentivirus vector were inoculated. In each mouse, 4.0 × 10⁶ cells were inoculated subcutaneously below the axilla. Tumor volume (volume = π/6×L×W×W, L: length, W: short axis, unit: mm3) was calculated 30 days after inoculation for one to two times a week. On day 38, nude mice were euthanized by cervical dislocation after intraperitoneal injection of 2% pentobarbital sodium anesthesia, and the tumors were harvested and weighed. In order to minimize the bias from individual differences, the maximum and minimum mice in each group were removed from data analysis. All of the experimental protocols were approved by the Institutional Animal Care and Use Committee of Fujian Medical University (No. 2021-8CAARM125), and the animal experiments were conducted in Animal Center of Fujian Medical University.
In order to obtain the NCAPD3-regulated gene expression spectrum, AGS cells were transfected with shNCAPD3 lentiviruses and control vector to construct AGS-KD and AGS-NC cells. Next, qPCR was used to validate the efficiency of RNA interference. The Trizol reagent was used to extract total RNA for an RNA quality test. The quality standards were: NanoDrop 2000 (Thermo Fisher Scientific, Waltham, MA, United States), 1.7 < A260/A280 < 2.2; Agilent 2100 Bioanalyzer (Agilent Technologies, Santa Clara, CA, United States), RIN ≥7.0, 28S/18S > 0.7. The 3′ IVT Plus Kit (Affymetrix, Santa Clara, CA, United States), a reverse transcription kit, was used for labeling of RNA that passed the quality test according to the manufacturer’s instructions. The labeled RNAs were fragmented and hybridized. The Affymetrix GeneChip PrimeView human gene expression array was used for testing. The selection criteria for significantly differentially expressed genes were |Fold Change| ≥ 2.0 and FDR <0.05. The experiment was completed in Shanghai Genechem. GeneChip Scanner 3000 (Affymetrix) was used for data analysis.
In order to examine changes in overall biological processes and pathways after NCAPD3 knockdown, GSEA was carried out on expression data. First, the probe group with coefficient of variation >25% in the NCAPD3 knockdown group and control group were removed to obtain the filtered expression matrix. The filtered overall expression matrix was inputted into the GSEA. The MSigDB database was used for enrichment analysis of the background gene set, which is a combination of various gene sets, such as canonical pathway, cellular component, immunologic signatures, oncogenic signature, and transcription factor. The GSEA parameter settings were as follows: the permutation type was gene set, and “control vs. knockdown” was used for enrichment analysis. Therefore, the normalized enrichment score (NES) < 0 represents the degree of pathway enrichment of genes that were ranked in front of changes in the knockdown group. Default parameters were used for the other settings. FDR <0.05 was considered to indicate significant enrichment.
The Ingenuity Pathway Analysis (IPA: Ingenuity Systems; www.ingenuity.com; Redwood City, CA, United States) database was used for bioinformatics analysis of differentially expressed genes. Canonical pathway analysis was carried out by comparison of differentially expressed genes and pathways containing these genes, and comparison significance (p < 0.05) was calculated to determine which pathways contained differentially expressed genes. Following that, the upstream and downstream regulatory factors of differentially expressed genes were compared. A Z-score ≥2 means that the pathway is significantly activated, whereas a Z-score ≤ −2 means that the pathway is significantly inhibited. The activation Z-score algorithm was used to analyze upstream regulatory factors to predict activation or inhibition of upstream regulatory factors. Disease and functional analysis was carried out according to IPA internal algorithm and standards. A Z-score ≥2 means that the disease or function is significantly activated, whereas a Z-score ≤ −2 means that the disease or function is significantly inhibited. Network map analysis was used to present the relationship between the disease and the differentially expressed gene. The Consistency Score is a measurement of the consistency and dense connection of causality between upstream regulatory factors and disease or function. The higher the Consistency Score, the more accurate the regulatory effect results. Therefore, IPA results were used to interpret and visualize interactions between upstream and downstream factors and global signal transduction.
Excel 2016 was used for data processing, SPSS 22.0 was used for statistical analysis, GraphPad prism 6 was used for plotting of statistical graphs, and ImageJ was used for measurement of the migration area. Statistical description of quantitative data (mean ± standard deviation) was carried out. One-way ANOVA or t-test was used for comparison of inter-group differences. Qualitative data were described using ratios, and Chi-square test or Fisher’s exact probability test were used to compare differences. A difference with p < 0.05 was considered to be statistically significant.
Deep mining of gastric cancer and paracancerous tissue gene sequences in The Cancer Genome Atlas (TCGA) was performed, and RNA sequence data of gastric cancer and paracancerous tissues in the TCGA database were analyzed. The result showed that NCAPD3 expression level in gastric cancer tissues is significantly higher than paired paracancerous tissues, with a log2-fold change of 2.242 and FDR <0.01 (Figure 1A). In 26 pairs of sequencing samples, the expression level of NACPAD3 in 17 pairs of gastric cancer tissues was significantly higher than paired paracancerous tissues (Figure 1B).
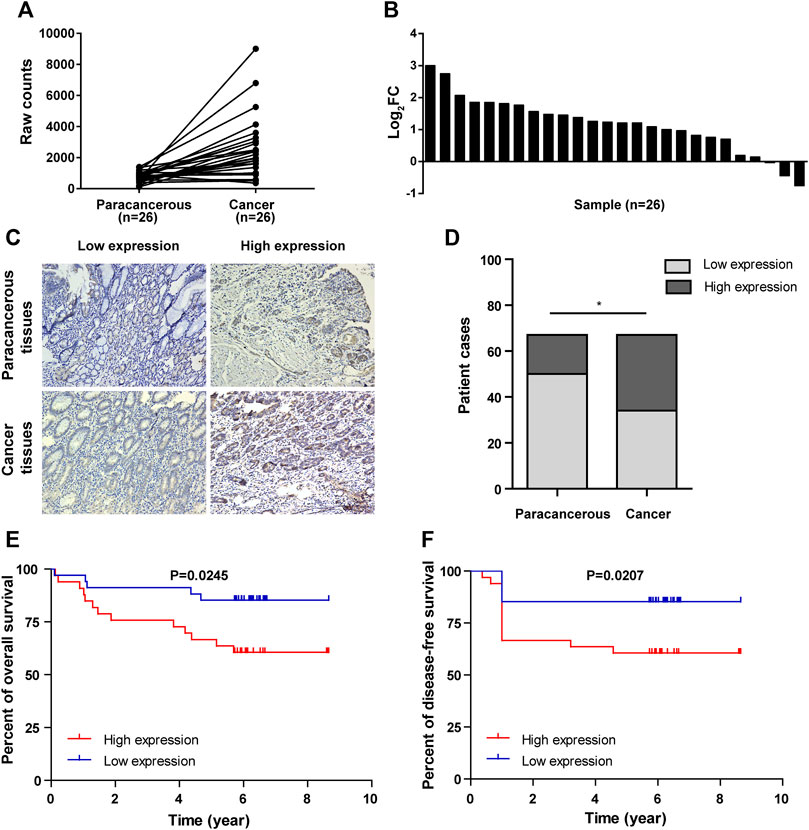
Figure 1. NCAPD3 expression in gastric cancer tissues. (A) Line chart of differential expression of NCAPD3 in 26 pairs of sequencing samples (gastric cancer and matched paracancerous samples) from TCGA. (B) Bar chart of differential expression of NCAPD3 in 26 pairs of sequencing samples (gastric cancer and matched paracancerous samples) from TCGA. FC (fold change): ratio of expression level in cancerous samples to paracancerous samples. (C) Relative protein expression of NCAPD3 in gastric cancer tissues (n = 67) compared with paracancerous normal tissues (n = 67) with immunohistochemistry. (D) Chart of positive immunohistochemical rates and the associated statistics. A total of 49% (33/67) of gastric cancer tissues were positive for NCAPD3 expression, while 25% (17/67) of normal tissues were positive for NCAPD3. *p < 0.05. (E) Kaplan-Meier overall survival (OS) according to NCAPD3 expression in 67 gastric cancer patients. (F) Kaplan-Meier Disease-free survival (DFS) by NCAPD3 expression in 67 gastric cancer patients.
We then detected NCAPD3 protein expression in 67 pairs of gastric cancer tissues and paracancerous tissues with immunohistochemistry. Representative IHC images posited that NCAPD3 protein was primarily expressed in the cytoplasm of gastric cancer cells (Figure 1C). The analysis results of Chi-square test revealed that The NCAPD3-positive expression rate in 67 gastric cancer patients was significantly higher than in paracancerous normal gastric mucosal tissues (p = 0.004) (Figure 1D). According to the relevant NCAPD3 expression in tumor tissues, 67 gastric cancer patients were classified into two groups: low-expression group (n = 34) and high-expression group (n = 33), the correlation between NCAPD3 expression and clinicopathological characteristics in gastric cancer patients were shown in Table 1. Expression of NCAPD3 was identified to be correlated with invasion depth (p = 0.009), lymph node metastases (p = 0.029) and pathological TNM stage (p < 0.001) but not with other clinicopathological characteristics in patients with gastric cancer. As for prognosis, the patients with NCAPD3-high expression had a significantly worse overall survival (OS) and a high risk of relapse than the NCAPD3-low patients. The overall survival rate for the NCAPD3-low patients was 85.3 percent, as compared with 60.6 percent for the patients with high NCAPD3 expression (p = 0.0245); the five-year disease-free survival (DFS) rate was 85.3 percent, as compared with 63.6 percent (p = 0.0207 by the log-rank test), respectively (Figures 1E, F).
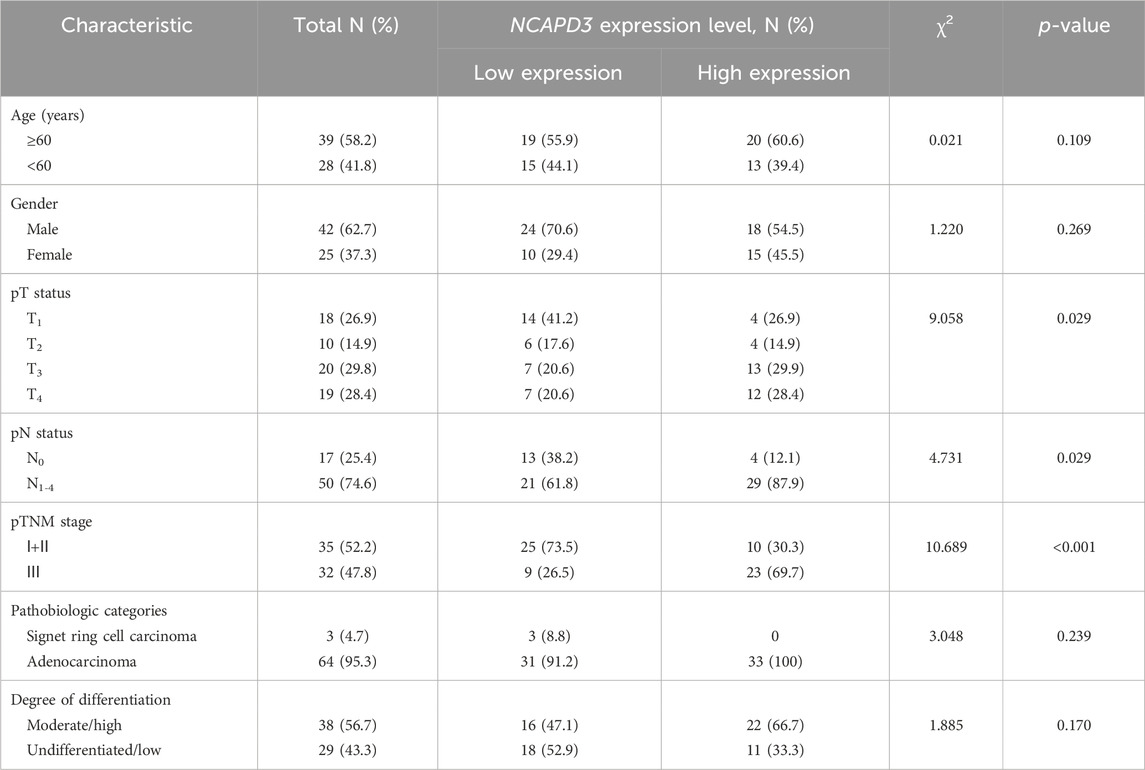
Table 1. Association of NCAPD3 with clinicopathological characteristics from 67 gastric cancer patients.
To examine the function of NCAPD3 in gastric cancer, first, we measured NCAPD3 expression in four cancer-derived GC cell lines (AGS, BGC823, MGC803, and SGC7901) by RT-qPCR and found that the expressions of NCAPD3 mRNA in these four gastric cancer were all high-abundence (Supplementary Material 1). Additionally, AGS cells had a lower level of NCAPD3 mRNA relative to the other cells, while MGC803 cells expressed NCAPD3 at a much higher level (Figure 2A). Therefore, AGS and MGC803 cells were selected for the subsequent studies.
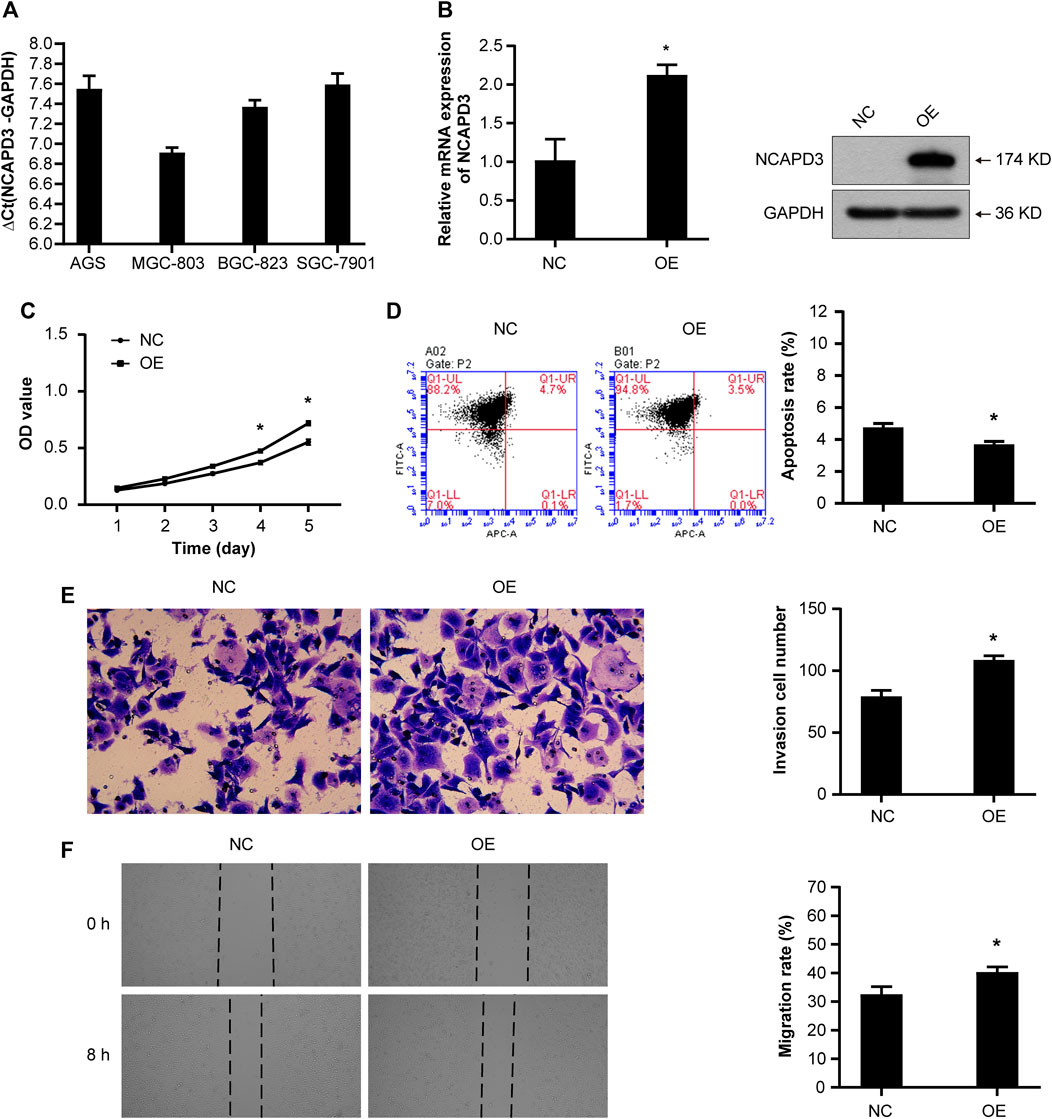
Figure 2. NCAPD3 overexpression promotes the malignant phenotype of GC cells. (A) NCAPD3 expression in four gastric cancer cell lines (AGS, BGC823, MGC803, and SGC7901) determined by RT-qPCR. The larger the ΔCt(NCAPD3-GAPDH), the lower the abundance of mRNA expression in cells: ΔCt≤12, high abundance; 12<ΔCt <16, medium abundance; ΔCt ≥16, low abundance. (B) mRNA and protein expression following NCAPD3 overexpression in AGS cells examined by RT-qPCR and Western blot analysis. NCAPD3 protein detected here was exogenous. (C) The proliferation of AGS cells was measured by MTT assay and presented as OD490 nm absorbance. (D) AnnexinV-APC apoptosis assay was applied to measure the effects of NCAPD3 overexpression on apoptosis in AGS cells. (E) The invasive potentials of AGS cells were determined by Transwell assays. (F) Scratch assays were performed in AGS cells to measure the effects of NCAPD3 overexpression on migration. NC: negative control. OE: NCAPD3 overexpression. *p < 0.05.
Then we established the stable AGS NCAPD3 overexpression cell line by lentiviral transduction. As shown in Figure 2B, NCAPD3 mRNA and protein expressions were significantly increased in cells transfected with NCAPD3 virus (oeNCAPD3) compared with negative control virus (NC). Proliferative and apoptosis abilities were evaluated using MTT assays and flow cytometry assays, respectively. Indeed, the overexpression of NCAPD3 enhanced the viability and reduced the apoptosis of GC cells (Figures 2C, D). The potentials of migration and invasion were also promoted by overexpression of NCAPDS in AGS cells. These effects were validated by Transwell invasion assays and scratch assays (Figures 2E, F).
To further determine the oncogenic properties of NCAPD3 in GC, we used specific short hairpin RNAs (shRNAs) to transfect AGS and MGC803 cells. As demonstrated by RT-qPCR and Western blotting assays, NCAPD3 expression was successfully suppressed in both shNCAPD3-treated AGS and MGC 803 cells (Figure 3A). Then the Effects of NCAPD3 knockdown on malignant biological behaviors of gastric cancer cells were detected by MTT, flow cytometry assays, Transwell invasion assays and scratch assays. As shown in Figures 3B–E, NCAPD3 silencing significantly inhibited proliferation, enhanced apoptosis, and impaired the invasion and migration abilities of GC cells. The results were further verified by the CRISPR/Cas9 technology, which was used to construct AGS cell with stable NCAPD3 knockout (Supplementary Figure S1).
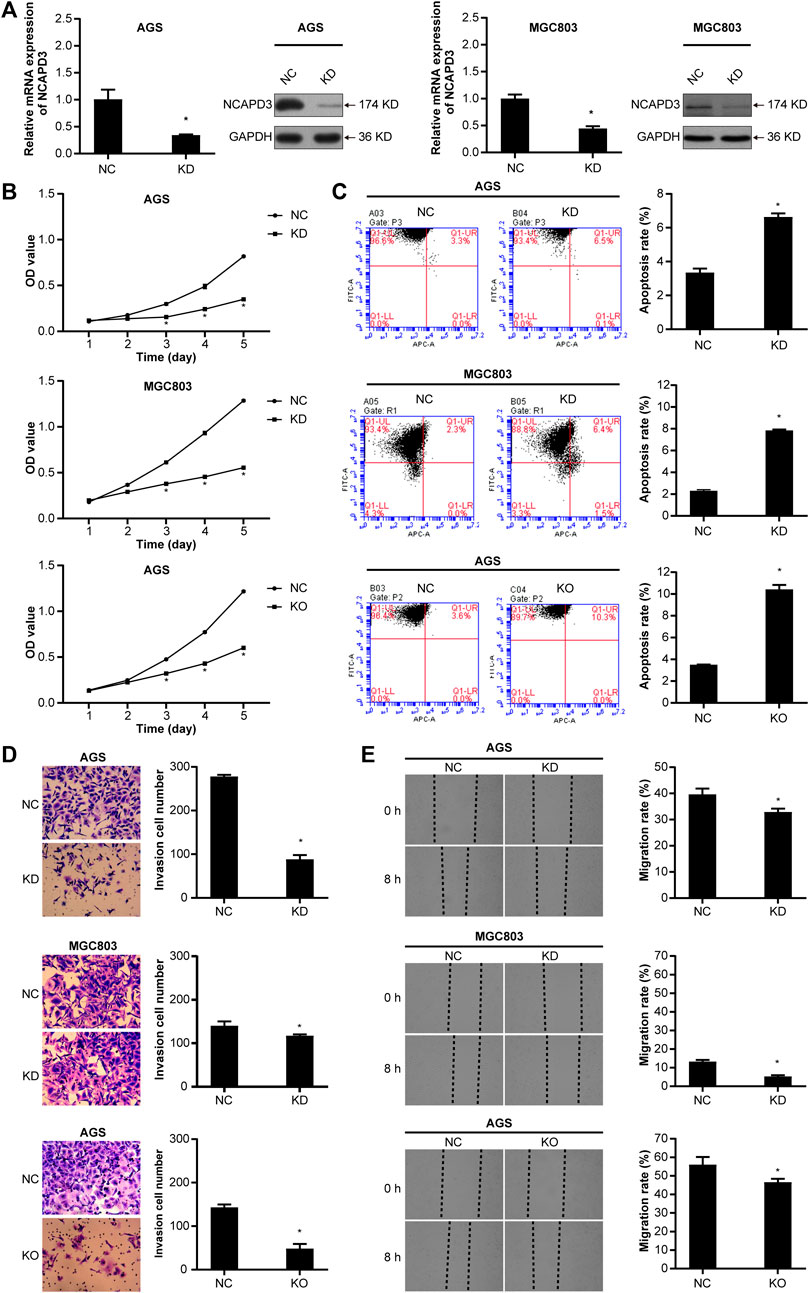
Figure 3. Silencing NCAPD3 inhibits gastric cancer cell malignant biological. (A) RT-PCR and WB were performed to assess knockdown results. (B) MTT was used to measure the effects of NCAPD3 knockdown or knockout on gastric cancer cell proliferation. (C) AnnexinV-APC apoptosis assay was conducted to measure the effects of NCAPD3 knockdown or knockout on apoptosis in gastric cancer cells. (D) Transwell invasion assay was applied to assess the effects of NCAPD3 knockdown or knockout gastric cancer cell invasion. (E) The migratory potentials of NCAPD3-knockdown/knockout AGS and MGC803 cells were determined by Scratch assays. NC: negative control. KD: NCAPD3 knockdown. KO: NCAPD3 knockout. *p < 0.05.
MGC803 gastric cancer cells that were transfected with the empty lentivirus vector (negative control) and NCAPD3-shRNA lentivirus vector were inoculated subcutaneously in nude mice, and tumorigenicity was observed (Figure 4). The growth curve of subcutaneous tumor xenografts was plotted based on xenograft volume at different time points. Results showed that the growth speed of the NCAPD3 knockdown group was significantly lower than the negative control group (p < 0.05).
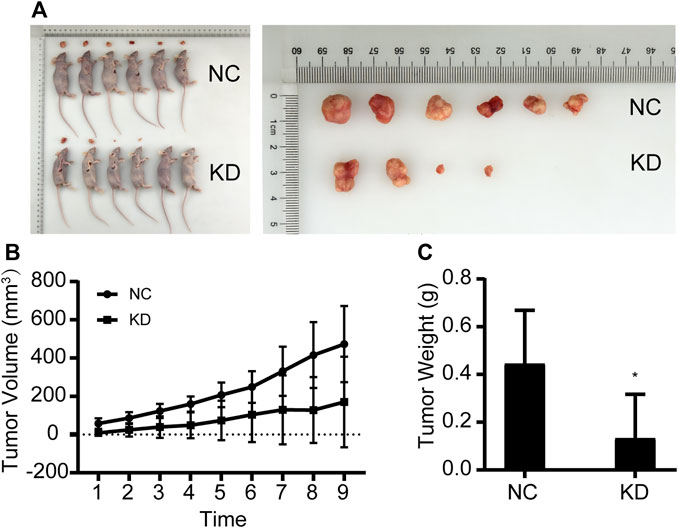
Figure 4. Effects of NCAPD3 knockdown on BGC823 gastric cancer subcutaneous xenografts in nude mice. (A) Macroscopic appearance of representative tumor specimens at autopsy. (B) Tumor growth curves for negative control (NC) group and NCAPD3 knockdown (KD) group mice. (C) Effect of NCAPD3 knockdown on tumor weight. Data are mean ± SD of 6 animals per group. NC: negative control. KD: NCAPD3 knockdown. *p < 0.05.
Tumors were harvested and weighed after nude mice were euthanized. Results showed that the tumor weight in the NCAPD3 knockdown group was significantly lower than the negative control group (p < 0.05). The tumor weight inhibition rate was 70.21%.
In order to study the molecular mechanisms of malignant biological behavior in gastric cancer regulated by NCAPD3, GeneChip PrimeView human gene expression array was used to detect differentially expressed genes (DEGs) before and after NCAPD3 knockdown. The results showed that, after NCAPD3 expression was inhibited, there were significant differences in the expression levels of 1,411 genes in AGS cells, among which 562 genes were upregulated and 849 genes were downregulated after NCAPD3 silencing (Figures 5A, B). Hierarchical clustering was used to analyze the expression of differentially expressed genes. Results showed that there were significant changes in gene expression upregulation and downregulation (Figure 5C).
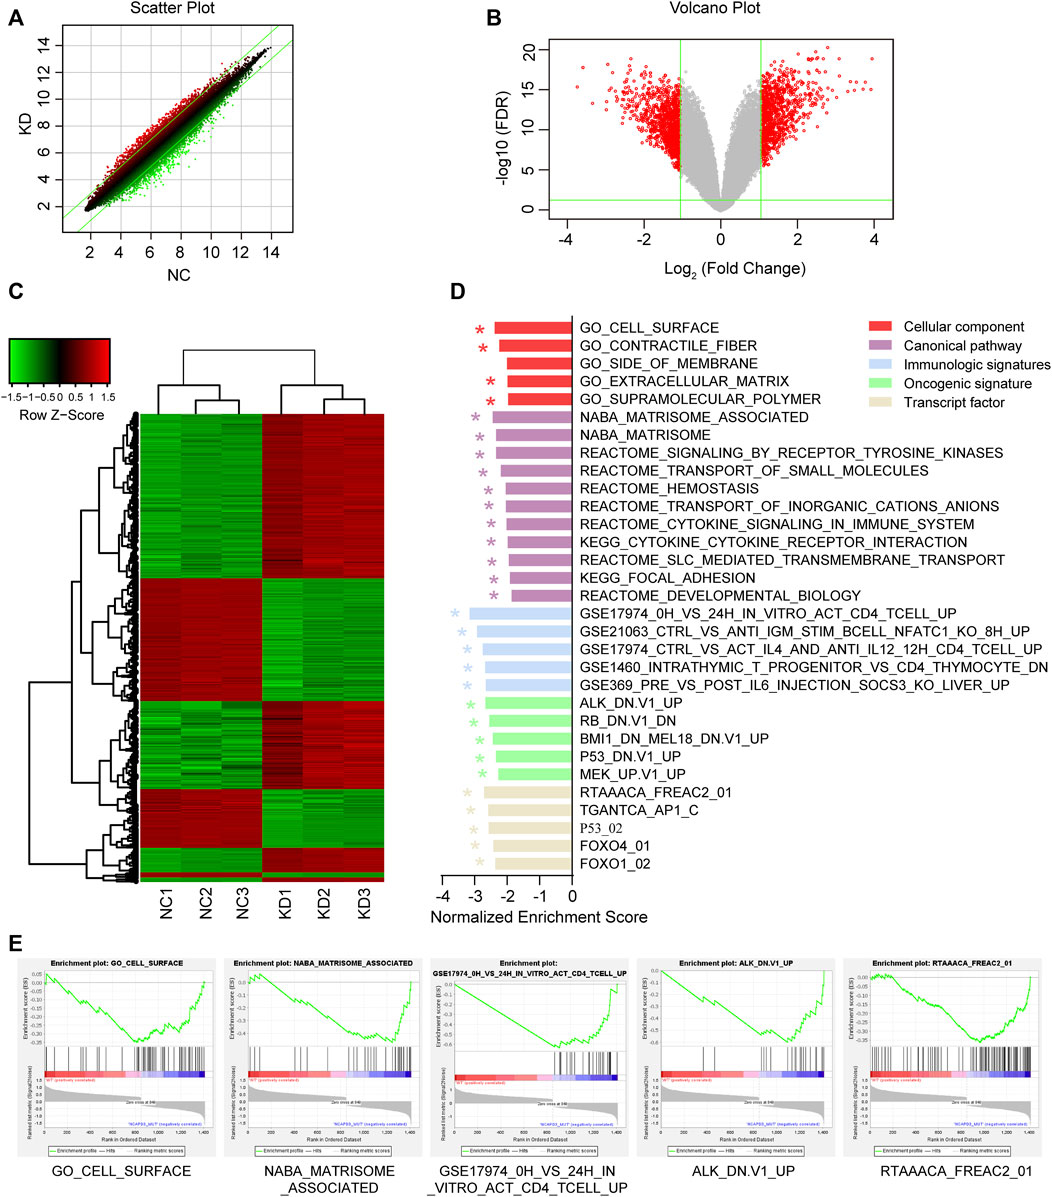
Figure 5. Differential expression analysis and GSEA enrichment results of differentially expressed genes (DEGs) before and after NCAPD3 knockdown. (A) Scatter plot. The green line represents the reference line for differential expression, the red dots represent relatively upregulated groups in KD, and the green dots represent upregulated groups in NC. (B) Volcano plot. Red represents significant differentially expressed genes, and green represents non-significant differentially expressed genes. (C) Cluster analysis heat map. Red represents upregulated gene expression, green represents downregulated gene expression, and black represents no significant change in gene expression. (D) The GSEA enrichment results shown in a bar chart. (E) Five GESA enrichment plots of typical pathways in the canonical pathway, cellular component, immunologic signatures, oncogenic signature, and transcription factor. NC: negative control. KD: NCAPD3 knockdown. * FDR <0.05.
In order to examine changes in overall biological processes and pathways after NCAPD3 knockdown, GSEA analysis was performed on the cellular component, canonical pathway, immunologic signatures, oncogenic signature, and transcription factor (Figures 5D, E). Compared with the non-knockdown group, five significant enrichment results were obtained in the cellular component GSEA after NCAPD3 knockdown, among which cell surface sets were significantly enriched. A total of 11 significant signaling pathways were obtained from the canonical pathway analysis, such as signaling by receptor tyrosine kinases, cytokine signaling in the immune system, and cytokine-cytokine receptor interaction. Immunologic signatures enrichment analysis showed that 119 immune gene sets were significantly enriched in the NCAPD3 knockdown group, showing that NCAPD3 significantly activates immune-related gene sets; this result is consistent with the canonical pathway enrichment analysis results. Twenty-six significantly enriched oncogene sets were obtained from oncogenic signature enrichment analysis, and the top five significantly enriched gene sets include ALK, RB, BMI1, P53, and MEK. Thirteen significant enrichment results were obtained from transcription factor analysis. Figure 5D presents the top five significantly enriched transcription factor gene sets, such as P53, FOXO4, and FOXO1. These results showed that NCAPD3 knockdown affects many signaling pathways and biological processes. Furthermore, NCAPD3 can affect the expression of oncogenes and transcription factors to affect disease occurrence and development.
The IPA platform was used to analyze differentially expressed genes in the negative control (NC) group and NCAPD3 knockdown (KD) group. The canonical pathway analysis results showed that there were 10 signaling pathways that showed differences after NCAPD3 knockdown in the KD group. Pathways that were mainly activated were the p53 signaling, G1/S cell cycle checkpoint, and STAT3 pathways. Pathways that were inhibited mainly included the phosphatidylglycerol biosynthesis II (non-plastidic), IGF-1 signaling, and superpathway of cholesterol biosynthesis, among which the cholesterol biosynthesis pathway was significantly inhibited, with a Z-score of −2.449 (Figure 6A).
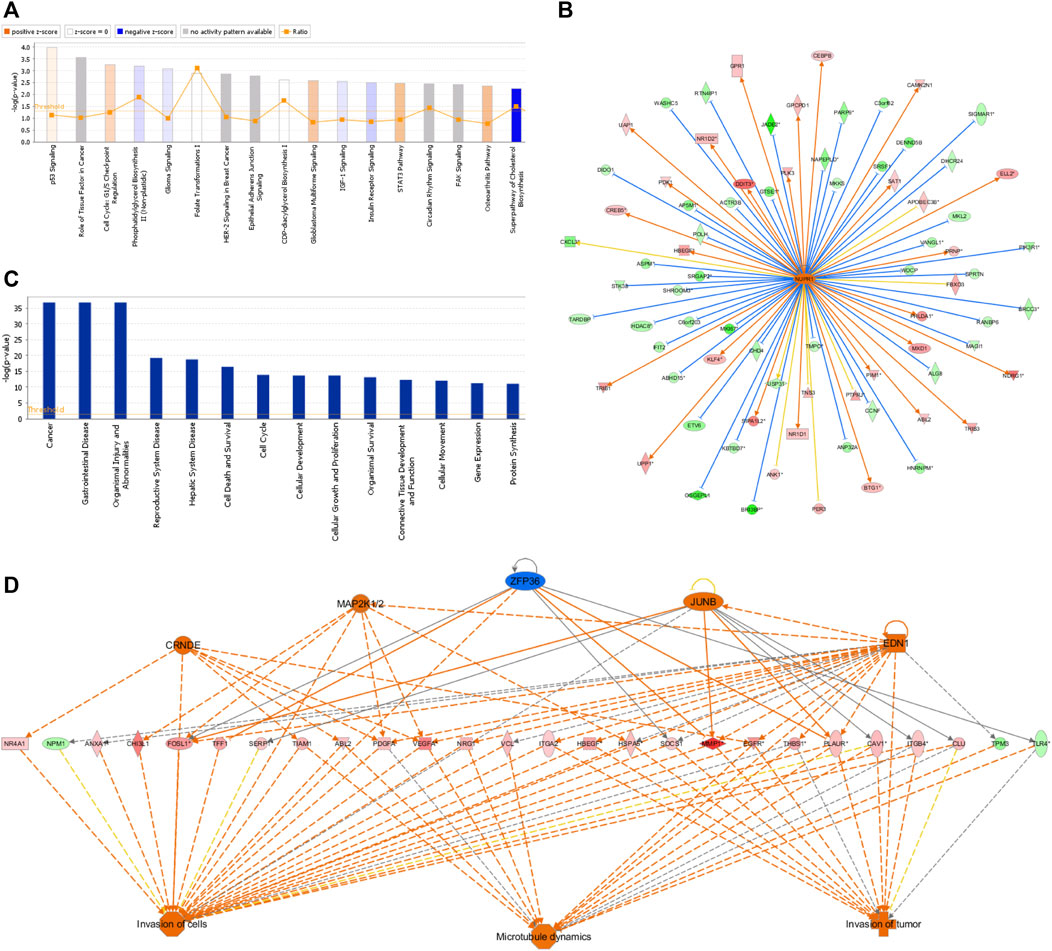
Figure 6. IPA analysis results. (A) Canonical pathway enrichment analysis statistical chart. Orange represents pathway activation and blue represents pathway inhibition. (B) Network map of upstream regulatory factors of NUPR1. An orange line means that the upstream regulatory factor and gene were consistently activated, a blue line means that the upstream regulatory factor and gene were consistently inhibited, and a yellow line means that the expression trend of the upstream regulatory factor and gene were not consistent. (C) Disease and functional enrichment statistical graph. (D) Interactions between genes and regulatory factors and functions.
In order to determine the major upstream regulatory factors and explain differential gene expression between the two groups, upstream regulatory factor analysis was carried out. This analysis determined the number of known targets for each regulatory factor, and their direction of change was compared with that found in past papers. One hundred forty-five upstream regulators (including transcription factors, small RNAs, cytokines, kinases, and chemical molecules and drugs) were identified as activators, and 45 upstream regulators were predicted as suppressors. The prediction results for top 10 activated or inhibited upstream regulatory factors were listed (Table 2), among which the transcription factor NUPR1 was predicted to be significantly activated (Z-score = 2.252). Then an interaction network between the NUPR1 upstream regulatory factor and its downstream factors was constructed (Figure 6B). Among these genes, ELL2, NDRG1, HBEGF, SAT1, NR1D1, PDK1, and DDIT3 were elevated, whereas PARP9, NAPEPLD, MKKS, PIK3R1, MAGI1, HDAC8, ASPM were decreased (Figure 6B).
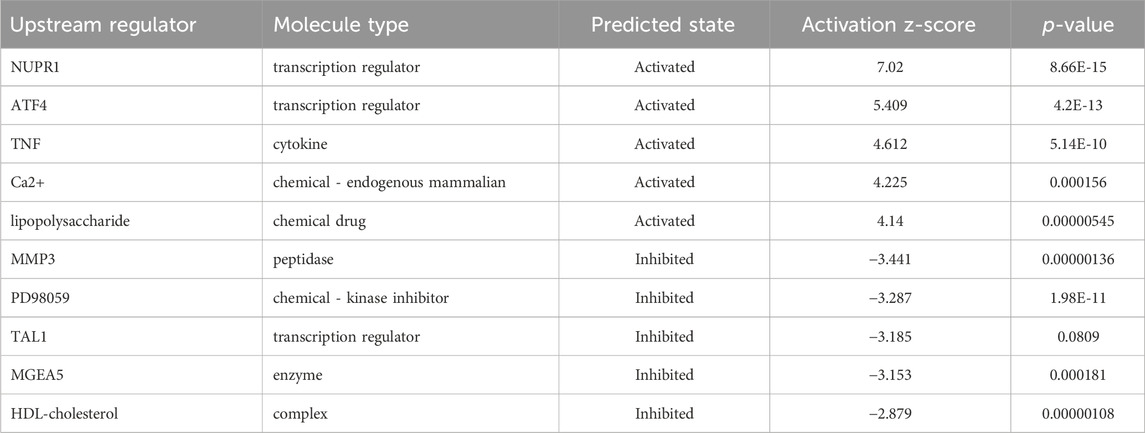
Table 2. Predicted upstream regulators for all differentially expressed genes between NCAPD3-knockdown and negative control AGS cells (top 10).
In the disease and functional analysis, the first analysis showed significantly enriched differentially expressed genes in disease and function, which were mainly enriched in gastrointestinal disease, cell death and survival, cell cycle, cellular development, cellular growth and proliferation, and cellular movement (Figure 6C). This shows that differentially expressed genes that are regulated by inhibiting NCAPD3 expression mainly participate in cell growth, development, and survival. Regulatory effect analysis was used to investigate differentially expressed genes participating in different cellular functions. Results showed that the regulatory factors CRNDE, EDN1, JUNB, and MAP2K1/2, ZFP36 mainly regulate differentially expressed genes (VEGFA, EGFR, PLAUR) to regulate invasion of cells, invasion of tumor, and microtubule dynamics. For example, the regulatory factor CRNDE regulates the EGFR gene to regulate invasion of cells, invasion of tumor, and microtubule dynamics. The EDI regulatory factor regulates invasion of cells, invasion of tumor, and microtubule dynamics through the PLAUR gene (Figure 6D).
In vivo and in vitro experiments showed that NCAPD3 loss can significantly inhibit gastric cancer cell proliferation, invasion, and migration, and promote apoptosis. In order to further study the effector molecular mechanisms, the NCAPD3 knockdown differentially expressed gene data in this study were combined with literature data, and IPA was employed to construct a molecular regulatory network map of tumor cell proliferation and apoptosis. In the molecular regulatory network map in which NCAPD3 knockdown inhibits tumor cell proliferation and promotes tumor cell apoptosis, genes related to tumor cell proliferation pathways showed overall decrease or downregulation, among which CCND1, MYC, ESR1 were significantly decreased and their downstream genes CDK6 and IRS1 were significantly downregulated. Therefore, NCAPD3 knockdown may inhibit CCND1, MYC, and ESR1 activity to downregulate CDK6 and IRS1 expression, thereby inhibiting the proliferation of gastric cancer cells. Additionally, genes associated with tumor cell apoptosis pathways showed overall activation, among which IRF7, DDIT3, and HBEGF were significantly activated. Therefore, NCAPD3 knockdown may activate IRF7, DDIT3, and HBEGF expression to promote gastric cancer cell apoptosis (Figure 7).
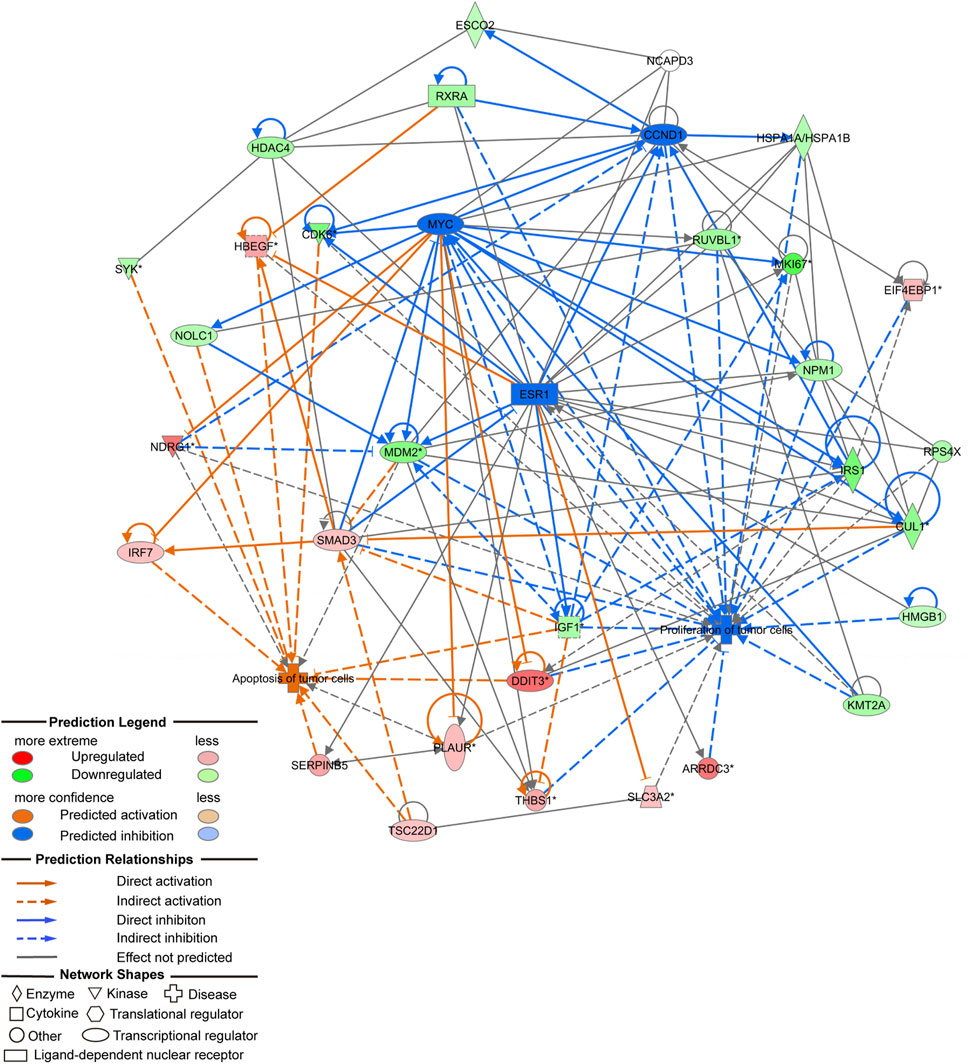
Figure 7. Molecular regulatory network map of NCAPD3 knockdown on inhibition of tumor cell proliferation and promotion of tumor cell apoptosis.
In order to further validate whether NCAPD3 directly targets CCND1, ESR1, and MYC to regulate gastric cancer cell proliferation, Co-IP experiments were conducted to examine if NCAPD3 directly interacts with CCND1, ESR1, and MYC. The results showed that NCAPD3 NCAPD3 protein may not directly interact with MYC but may directly interact with CCND1 and ESR1 (Figure 8A).
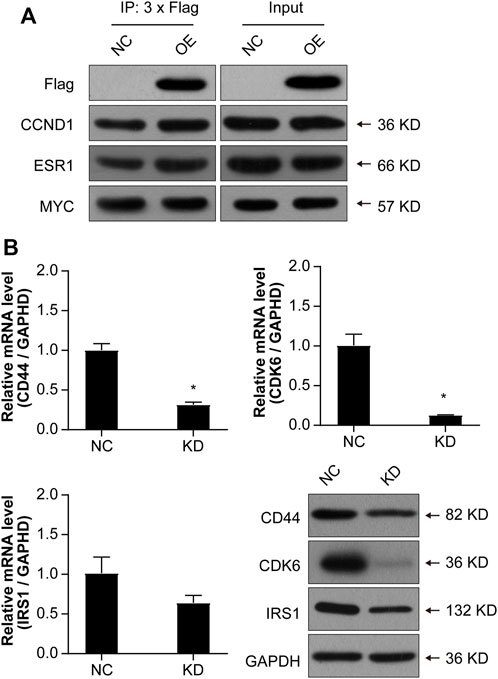
Figure 8. Validations of the possible interactions and downstream target genes. (A) Co-IP was used to validate interactions. FLAG is a protein tag used to indicate NCAPD3 protein. (B) Validations of three target genes by qPCR and WB. NC: negative control. OE: NCAPD3 overexpression. KD: NCAPD3 knockdown. *p < 0.05.
Based on the interaction network analysis, 29 differentially expressed genes (DEGs) of interest were selected for qPCR validation. The validation results showed that the gene chip variation trends of 22 genes were consistent with PCR variation trends (Table 3). From these 22 genes, three (CD44, CDK6, and IRS1) were selected for further WB validation (Figure 8B). The protein expression levels of CD44, CDK6, and IRS1 were downregulated by 32.30%, 84.91%, and 40.50%, respectively. Based on the above experimental and bioinformatics analysis results, the target gene NCAPD3 may upregulate CD44, CDK6, and IRS1 in AGS gastric cancer cells to carry out its effects. In summary, the NCAPD3 protein may target CCND1 or ESR1 to downregulate downstream factors such as CDK6 and IRSI to inhibit gastric cancer cell proliferation.
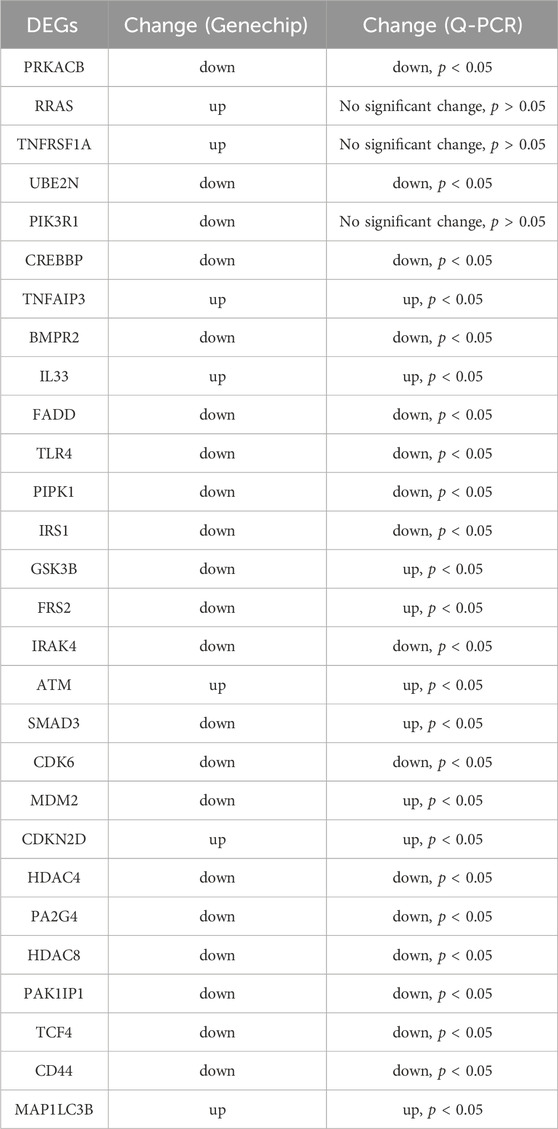
Table 3. The qPCR validation of 29 differentially expressed genes (DEGs).
Gastric cancer occurrence and progression is an extremely complex process involving oncogenes, tumor suppressor genes, cell cycle regulatory factors, and signal regulatory factors. In cancer, somatic cell changes in signaling pathways occur at different frequencies and combinations in different organs and tissues, showing complex interactions and pathway interference (Ajani et al., 2016). Even though conventional gastric cancer treatments such as surgery, chemotherapy, and radiotherapy have contributed to improvements in cancer treatment, disease recurrence is common in most gastric cancer patients (Hayakawa et al., 2015). The reason for this is because the pathogenesis of gastric cancer is still unclear. Therefore, in-depth studies on gastric cancer pathogenesis and discovery of new precision medicine targets are especially important.
NCAPD3 plays a crucial role in chromosome structural changes and separation during mitosis in eukaryotic cells. Previous studies found that NCAPD2/3 is intimately associated with the occurrence of many diseases (Seipold et al., 2009; Zhang et al., 2014). Thadani et al. found that condensin II complex dynamics regulate the cell cycle (Thadani et al., 2018). Yin et al. (2017) found that high expression of the NCAPD3 homologous complex, NCAPH, promotes proliferation in colon cancer cells. Kim et al. (2020) reported that knocking out the NCAPD3 homologue, NCAPH, inhibits the proliferation, colony formation, invasion, and migration of non-small cell lung cancer cells, showing that NCAPH participates in regulating non-small cell lung cancer occurrence and progression. NCAPG is a NCAPD3 homologous complex and also a subunit of the condensin complex. Studies showed that NCAPG participates in many tumors, including prostate cancer (Goto et al., 2017), high-grade glioma in children (Liang et al., 2016), renal cell carcinoma (Yamada et al., 2018), multiple myeloma (Cohen et al., 2014), and melanoma (Ryu et al., 2007). Studies found that NCAPG is crucial for liver cancer occurrence and progression (Zhang et al., 2018). NCAPG can activate the PI3K/AKT/FOXO4 pathway to promote liver cancer proliferation and inhibit apoptosis (Gong et al., 2019). Zhang et al. found that NCAPG overexpression inhibits cardia adenocarcinoma apoptosis and promotes epithelial-mesenchymal transition (Zhang et al., 2021). However, the correlation between NCAPD3 and gastric cancer occurrence and progression is still not clear. Therefore, this study aimed to evaluate the role of NCAPD3 in gastric cancer cells. The results indicated that NCAPD3 is highly expressed in gastric cancer cells and clinical tissue specimens and is intimately associated with prognosis, suggesting that high NCAPD3 expression may be the key to gastric cancer occurrence and progression. In addition, cell experiments demonstrated that NCAPD3 overexpression promotes gastric cancer cell proliferation, invasion, and migration and inhibit apoptosis. Conversely, inhibiting NCAPD3 expression attenuates gastric cancer cell proliferation, invasion, and migration and promote apoptosis. Furthermore, in vivo animal experiments showed that in vivo tumor growth is inhibited after NCAPD3 knockdown. This shows that NCAPD3 may affect cell proliferation, invasion, migration, and apoptosis to affect gastric cancer occurrence and progression. In summary, this study showed that NCAPD3 may be a crucial factor in gastric cancer occurrence and progression.
In order to examine changes in overall biological processes and related signaling pathways after NCAPD3 knockdown, GSEA was carried out. The results showed that cytokine signaling in the immune system and cytokine-cytokine receptor interaction were significantly enriched after NCAPD3 knockdown, indicating that NCAPD3 knockdown may affect immune-related signaling pathways. This finding was proven by the immunologic signature enrichment analysis, the results of which showed that 119 immune gene sets were significantly enriched in the NCAPD3 knockdown group. The tumor microenvironment is beneficial for cancer cell growth and expansion. Many types of cells participate in the tumor microenvironment, such as inflammatory cells, fibroblasts, neurons, and vascular endothelial cells. These matrix cells secrete various factors to directly activate cancer cell growth signals or remodel surrounding regions, thereby promoting tumor growth. Endothelial cells not only provide nutrients to tumors but also secrete chemokines or cytokines to interact with cancer stem cells and immune cells (Oya et al., 2020). Tumor-associated immune cells have tumor suppression or tumor-promoting functions. In immune cell populations, tumor-associated macrophages, such as M1 and M2 macrophages and myeloid-derived suppressor cells, have been reported to secrete soluble factors or regulate immune responses to directly or indirectly promote gastric cancer occurrence (Oya et al., 2020). Patients whose tumors show high T cell infiltration, particularly cytotoxic CD8+ T cells and memory T cells, have longer disease-free survival and overall survival, whereas patients with high neutrophil infiltration in tumors have poor prognosis (Zeng et al., 2019). When one or more cells start to show uncontrollable growth, the cancer will develop. This may be the result of changes in highly regulated processes in normal cell division. These changes may be caused by germline or somatic mutations controlling normal cell proliferation, resulting in an oncogene. GSEA analysis revealed that 26 oncogene sets and 13 transcription factor gene sets were significantly enriched after NCAPD3 knockdown, such as p53 and FOXO1/4. TP53 (p53) is the most common gene mutated in human cancers and TP53 mutations are present in approximately 50% of invasive tumors. Traditionally, p53 is regarded as a gene that induces cell cycle arrest, apoptosis, or senescence or participates in DNA repair to inhibit oncogenesis and cancer progression. Although these tumor suppressor mechanisms have been confirmed in different models, recent data show that p53 can also regulate metabolism, regulate reactive oxygen species (ROS) levels, change non-coding RNA expression, and increase autophagy or ferroptosis to inhibit oncogenesis. Due to its high mutation frequency and crucial role in oncogenesis/cancer progression, p53 is a priority target in antineoplastic treatment (Duffy et al., 2017). Regulation of the FOXO transcription factor mainly occurs at the post-transcriptional and post-translational levels, which are mediated by non-coding RNAs through interactions with other protein chaperones and cofactors (including phosphorylation, acetylation, methylation, and ubiquitination). FOXO regulates factors essential for cell proliferation, death, senescence, angiogenesis, migration, and metastasis and plays a role in tumorigenesis and tumor progression (Jiramongkol and Lam, 2020). These findings showed that NCAPD3 affects the expression of oncogenes and transcription factors to regulate gastric cancer cell proliferation, invasion, migration, and apoptosis.
In order to further study the potential molecular mechanisms by which NCAPD3 regulates behavioral changes in gastric cancer cells, in this study, the human genome expression chip was used to detect differentially expressed genes and related signaling pathways before and after NCAPD3 knockdown. IPA canonical pathway analysis showed that the cholesterol biosynthesis pathway is significantly inhibited after NCAPD3 knockdown. There is controversy over the role of cholesterol in cancer progression and potential treatments targeting cholesterol homeostasis in oncology (Kuzu et al., 2016). One study reported changes and mutations in genes in the cholesterol homeostasis pathway in cancer cells (Murai, 2015). The expression of cholesterol synthesis genes is upregulated, LDL receptor-mediated cholesterol influx is increased, and cholesterol transport is decreased, which increases cellular cholesterol levels, thereby facilitating cancer cell proliferation (Llaverias et al., 2011; Smith and Land, 2012; Krycer and Brown, 2013). In sarcoma, acute myeloid leukemia, and melanoma, increased activity in the cholesterol synthesis pathway is related to decreased patient survival (Riganti and Massaia, 2013; Sui et al., 2015; Brown et al., 2016). However, there are still very few studies in this area, and further studies are required to comprehensively analyze the consequences of these changes and how they regulate cancer progression. This study employed IPA bioinformatics analysis and found that the cholesterol biosynthesis pathway was significantly inhibited after NCAPD3 silencing. Therefore, NCAPD3 downregulation may inhibit cholesterol synthesis, thereby affecting gastric cancer cell proliferation.
Regulatory effect analysis revealed that the biological functions of differentially expressed genes were mainly concentrated in cell invasion and tumor invasion. The expression levels of regulatory factors related to cell and tumor invasion (CRNDE, EDN1, JUNB, MAP2K1/2) were significantly activated, among which the upstream regulatory factors CRNDE and EDN1 activated the expression of the downstream target EGFR to promote cell and tumor invasion, and JUNB activated PLAUR expression to promote cell and tumor invasion. EGFR is a tyrosine kinase receptor, and binding with RGF promotes cell survival and proliferation (Prenzel et al., 2001). In addition, EGFR signaling aids in vitro cell differentiation, invasion, and migration (El-Rehim et al., 2004; Arteaga and Engelman, 2014). Dysregulated EGFR signaling has been observed in many cancers, including breast cancer, colon cancer, and lung cancer (Nautiyal et al., 2012; Matalkah et al., 2016). EGFR can promote breast cancer invasion and migration (Zhao et al., 2018). PLAUR is highly expressed in gastric cancer tissues and promotes gastric cancer invasion (Sandoval-Bórquez et al., 2017). Therefore, the present study suggests that NCAPD3-knockdown-induced differentially expressed genes (DEGs) such as CRNDE, EDN1, and JUNB can regulate cell and tumor invasion through EGFR and PLAUR.
In the molecular regulatory network map, in which NCAPD3 knockdown inhibited tumor cell proliferation and promoted tumor cell apoptosis, genes related to tumor cell proliferation pathways showed overall inhibition or downregulation, among which CCND1, MYC, and ESR1 were significantly inhibited and their downstream genes CDK6 and IRSI were significantly downregulated. Therefore, NCAPD3 knockdown may inhibit CCND1, MYC, and ESR1 expression to downregulate CDK6 and IRSI expression, thereby inhibiting the proliferation of gastric cancer cells. Co-IP was carried out to analyze whether NCAPD3 directly targets CCND1, MYC, and ESR1. The results showed that NCAPD3 directly interacted with CCND1 and ESR1 but did not directly interact with MYC. ESR1, estrogen receptor gene, is a ligand-activated transcription factor composed of a DNA binding and a transcriptional activation domain, including the N-terminal ligand independent activation function (AF)-1 and C-terminal ligand-dependent AF-2 domains. The ligand-binding domain (LBD) and DNA binding and hinge domain in the protein core are also located at the C-terminal. Ligand-receptor binding helps co-regulate the recruitment of proteins, including co-stimulation and co-inhibitory factors to regulate many physiological processes, such as tumorigenesis and tumor progression (Martin et al., 2017). ESR1 has been reported to regulate proliferation in liver cancer (Wang et al., 2021), bladder cancer (Ge et al., 2019), progenitor Leydig cells (Oh et al., 2017), and chondrocytes (Liu et al., 2019). This shows that ESR1 plays important roles in cell proliferation. CCND1 is a member of the cell cycle protein family and regulates the cell cycle by activating CDK4/CDK6 (Marschall et al., 2016). Early studies showed that CCND1 and CDK6 are activated in tumor cells and their expressions are upregulated. Therefore, CCND1 and CDK6/CDK4 are potential therapeutic targets for tumors (Malumbres and Barbacid, 2009; Lang et al., 2015). Cyclin-dependent kinase 6 (CDK6) is a member of the threonine-serine kinase subfamily that participates in controlling the cell cycle, thereby controlling cell proliferation (Turner et al., 2019). Targeting CDK6 is a potential pathway for inducing cell cycle arrest and inhibiting tumor cell proliferation (Rader et al., 2013). CDK6 is an important factor that regulates the cell cycle, and overexpression or activation of CDK6 will accelerate the cell cycle and promote cell proliferation, thereby resulting in transformation and promoting gastric cancer occurrence and progression (Ilyin et al., 2003). Increased CDK6 protein expression can be detected in many types of cancer, and reducing CDK6 expression inhibits the growth and proliferation of tumors in vivo and in vitro (Thammasit et al., 2015). Insulin receptor substrate (IRS1) is an important intracellular signaling protein and an important signaling factor for cell surface receptor activation. IRS1 regulates upstream signals and downstream effectors to regulate cell growth, metabolism, and activation (Jellema et al., 2003). A study reported that IRS1 can promote tumor proliferation (Dearth et al., 2007). IRS1 is a crucial regulatory factor of PI3K in malignant cells and affects tumor cell proliferation (Houghton et al., 2010). A study reported that IRS1 regulates PI3K activity to inhibit gastric cancer occurrence (Baba et al., 2007). Therefore, NCAPD3 knockdown may inhibit CCND1 and ESR1 expression to downregulate CDK6 and IRSI expression, thereby inhibiting the proliferation of gastric cancer cells.
In addition, molecular network regulatory maps showed that apoptosis pathway-related genes (e.g., IRF7 and DDIT3) in tumor cells showed overall activation after NCAPD3 inhibition. This is consistent with the result that inhibiting NCAPD3 expression promotes apoptosis in gastric cancer cells. IRF7 is an interferon regulatory factor that is intimately associated with apoptosis. Liu et al. (2017) found that IRF7 activates NF-κB/GSDMD signals in mouse adipose tissues to promote inflammasome-induced apoptosis. Zhang et al. (2017) reported that the HTLV-1 oncoprotein Tax interacts with MAVS, STING, and RIP1 to inhibit the innate interferon response, resulting in TBK1-mediated inhibition of IRF3/IRF7 phosphorylation, and also to inhibit apoptosis and autophagy in target cells. DDIT3 is also known as C/EBP homologous protein (CHOP) and is a mark of endoplasmic reticulum stress. DDIT3 can form heterodimers with other proteins in the C/EBP family. During endoplasmic reticulum stress, DDIT3 acts as a transcription factor to downregulate the expression of antiapoptotic factors BCL-2 and BCL-Xl, and it acts as a transcription activation factor to upregulate the expression of proapoptotic genes such as BIM (Tsukano et al., 2010; Hu et al., 2019). Therefore, NCAPD3 inhibition may regulate gastric cancer cell apoptosis by activating IRF7 and DDIT3.
In summary, NCAPD3 is upregulated in gastric cancer. NCAPD3 promotes gastric cancer cell proliferation, invasion, and migration and inhibits apoptosis to accelerate gastric cancer progression. Inhibiting NCAPD3 expression can attenuate the malignant biological behaviors of gastric cancer cells. NCAPD3 loss can directly inhibit CCND1 and ESR1 expression to downregulate the expression of downstream targets CDK6 and IRS1 and inhibit the proliferation of gastric cancer cells. Moreover, NCAPD3 loss activates IRF7 and DDIT3 to regulate apoptosis in gastric cancer cells. In addition, NCAPD3 significantly affects many canonical pathways and immune and transcription factor gene sets in gastric cancer occurrence and progression. Overall, this study shows that NCAPD3 may be a potential target for gastric cancer treatment.
The datasets presented in this study can be found in online repositories. The names of the repository/repositories and accession number(s) can be found in the article/Supplementary Material. The expression data presented in the study is publicly available. This data can be found here: Gene Expression Omnibus, accession number GSE261264.
The studies involving humans were approved by the Ethics Committee of Fujian Medical University Union Hospital (No. 2021WSJK042). The studies were conducted in accordance with the local legislation and institutional requirements. The participants provided their written informed consent to participate in this study. The animal study was approved by the Institutional Animal Care and Use Committee of Fujian Medical University (No. 2021-8CAARM125). The study was conducted in accordance with the local legislation and institutional requirements.
S-YZ: Conceptualization, Data curation, Formal Analysis, Investigation, Methodology, Software, Validation, Visualization, Writing–original draft. QL: Conceptualization, Data curation, Formal Analysis, Investigation, Methodology, Software, Validation, Visualization, Writing–original draft. L-RX: Data curation, Formal Analysis, Investigation, Methodology, Software, Writing–original draft. FY: Investigation, Methodology, Software, Data curation, Formal Analysis, Writing–original draft. JZ: Conceptualization, Investigation, Project administration, Supervision, Writing–review and editing, Methodology, Software. X-QC: Conceptualization, Funding acquisition, Investigation, Project administration, Supervision, Validation, Writing–original draft, Writing–review and editing, Data curation, Resources. SY: Investigation, Writing–original draft, Conceptualization, Funding acquisition, Project administration, Supervision, Validation, Writing–review and editing, Data curation, Resources.
The author(s) declare that financial support was received for the research, authorship, and/or publication of this article. This study was supported by the Joint Funds for the innovation of science and Technology, Fujian province under Grant number 2021Y9066; the Fujian Provincial Health Technology Project under Grant numbers 2020CXB016 and 2021CXA016.
The authors would like to express their gratitude to EditSprings (https://www.editsprings.cn) for the expert linguistic services provided.
The authors declare that the research was conducted in the absence of any commercial or financial relationships that could be construed as a potential conflict of interest.
All claims expressed in this article are solely those of the authors and do not necessarily represent those of their affiliated organizations, or those of the publisher, the editors and the reviewers. Any product that may be evaluated in this article, or claim that may be made by its manufacturer, is not guaranteed or endorsed by the publisher.
The Supplementary Material for this article can be found online at: https://www.frontiersin.org/articles/10.3389/fphar.2024.1341039/full#supplementary-material
Abe, S., Nagasaka, K., Hirayama, Y., Kozuka-Hata, H., Oyama, M., Aoyagi, Y., et al. (2011). The initial phase of chromosome condensation requires Cdk1-mediated phosphorylation of the CAP-D3 subunit of condensin II. Genes and Dev. 25, 863–874. doi:10.1101/gad.2016411
Ajani, J. A., D'Amico, T. A., Almhanna, K., Bentrem, D. J., Chao, J., Das, P., et al. (2016). Gastric cancer, version 3.2016, NCCN clinical practice guidelines in oncology. J. Natl. Compr. Cancer Netw. 14, 1286–1312. doi:10.6004/jnccn.2016.0137
Arteaga, C. L., and Engelman, J. A. (2014). ERBB receptors: from oncogene discovery to basic science to mechanism-based cancer therapeutics. Cancer Cell 25, 282–303. doi:10.1016/j.ccr.2014.02.025
Baba, T., Endo, T., Sata, F., Honnma, H., Kitajima, Y., Hayashi, T., et al. (2007). Polycystic ovary syndrome is associated with genetic polymorphism in the insulin signaling gene IRS-1 but not ENPP1 in a Japanese population. Life Sci. 81, 850–854. doi:10.1016/j.lfs.2007.07.023
Bakhrebah, M., Zhang, T., Mann, J. R., Kalitsis, P., and Hudson, D. F. (2015). Disruption of a conserved CAP-D3 threonine alters condensin loading on mitotic chromosomes leading to chromosome hypercondensation. J. Biol. Chem. 290, 6156–6167. doi:10.1074/jbc.M114.627109
Bass, A. J., Thorsson, V., Shmulevich, I., et al. (2014). Comprehensive molecular characterization of gastric adenocarcinoma. Nature 513, 202–209. doi:10.1038/nature13480
Berger, H., Marques, M. S., Zietlow, R., Meyer, T. F., Machado, J. C., and Figueiredo, C. (2016). Gastric cancer pathogenesis. Helicobacter 21, 34–38. doi:10.1111/hel.12338
Bray, F., Ferlay, J., Soerjomataram, I., Siegel, R. L., Torre, L. A., and Jemal, A. (2018). Global cancer statistics 2018: GLOBOCAN estimates of incidence and mortality worldwide for 36 cancers in 185 countries. CA a cancer J. Clin. 68, 394–424. doi:10.3322/caac.21492
Brown, D. N., Caffa, I., Cirmena, G., Piras, D., Garuti, A., Gallo, M., et al. (2016). Squalene epoxidase is a bona fide oncogene by amplification with clinical relevance in breast cancer. Sci. Rep. 6, 19435–19513. doi:10.1038/srep19435
Bustin, S. A., Benes, V., Garson, J. A., et al. (2009). The MIQE Guidelines: Minimum Information for Publication of Quantitative Real-Time PCR Experiments. Oxford University Press.
Cohen, Y., Gutwein, O., Garach-Jehoshua, O., Bar-Haim, A., and Kornberg, A. (2014). The proliferation arrest of primary tumor cells out-of-niche is associated with widespread downregulation of mitotic and transcriptional genes. Hematology 19, 286–292. doi:10.1179/1607845413Y.0000000125
Dawkins, J. B., Wang, J., Maniati, E., Heward, J. A., Koniali, L., Kocher, H. M., et al. (2016). Reduced expression of histone methyltransferases KMT2C and KMT2D correlates with improved outcome in pancreatic ductal adenocarcinoma. Cancer Res. 76, 4861–4871. doi:10.1158/0008-5472.CAN-16-0481
Dearth, R. K., Cui, X., Kim, H.-J., Hadsell, D. L., and Lee, A. V. (2007). Oncogenic transformation by the signaling adaptor proteins insulin receptor substrate (IRS)-1 and IRS-2. Cell cycle 6, 705–713. doi:10.4161/cc.6.6.4035
Duffy, M. J., Synnott, N. C., and Crown, J. (2017). Mutant p53 as a target for cancer treatment. Eur. J. Cancer 83, 258–265. doi:10.1016/j.ejca.2017.06.023
El-Rehim, A., Pinder, S., Paish, C., Bell, J. A., Rampaul, R. S., Blamey, R. W., et al. (2004). Expression and co-expression of the members of the epidermal growth factor receptor (EGFR) family in invasive breast carcinoma. Br. J. cancer 91, 1532–1542. doi:10.1038/sj.bjc.6602184
Ge, Q., Lu, M., Ju, L., Qian, K., Wang, G., Wu, C. L., et al. (2019). miR-4324-RACGAP1-STAT3-ESR1 feedback loop inhibits proliferation and metastasis of bladder cancer. Int. J. cancer 144, 3043–3055. doi:10.1002/ijc.32036
Gong, C., Ai, J., Fan, Y., Gao, J., Liu, W., Feng, Q., et al. (2019). NCAPG promotes the proliferation of hepatocellular carcinoma through PI3K/AKT signaling. OncoTargets Ther. 12, 8537–8552. doi:10.2147/OTT.S217916
Goto, Y., Kurozumi, A., Arai, T., Nohata, N., Kojima, S., Okato, A., et al. (2017). Impact of novel miR-145-3p regulatory networks on survival in patients with castration-resistant prostate cancer. Br. J. cancer 117, 409–420. doi:10.1038/bjc.2017.191
Guo, Z., Zhang, X., Zhu, H., Zhong, N., Luo, X., Zhang, Y., et al. (2021). TELO2 induced progression of colorectal cancer by binding with RICTOR through mTORC2. Oncol. Rep. 45, 523–534. doi:10.3892/or.2020.7890
Hayakawa, Y., Ariyama, H., Stancikova, J., Sakitani, K., Asfaha, S., Renz, B. W., et al. (2015). Mist1 expressing gastric stem cells maintain the normal and neoplastic gastric epithelium and are supported by a perivascular stem cell niche. Cancer Cell 28, 800–814. doi:10.1016/j.ccell.2015.10.003
Hou, T., Yang, C., Tong, C., Zhang, H., Xiao, J., and Li, J. (2014). Overexpression of ASAP1 is associated with poor prognosis in epithelial ovarian cancer. Int. J. Clin. Exp. pathology 7, 280–287.
Houghton, A. M., Rzymkiewicz, D. M., Ji, H., Gregory, A. D., Egea, E. E., Metz, H. E., et al. (2010). Neutrophil elastase–mediated degradation of IRS-1 accelerates lung tumor growth. Nat. Med. 16, 219–223. doi:10.1038/nm.2084
Hu, H., Tian, M., Ding, C., and Yu, S. (2019). The C/EBP homologous protein (CHOP) transcription factor functions in endoplasmic reticulum stress-induced apoptosis and microbial infection. Front. Immunol. 3083. doi:10.3389/fimmu.2018.03083
Ilyin, G. P., Glaise, D., Gilot, D., Baffet, G., and Guguen-Guillouzo, C. (2003). Regulation and role of p21 and p27 cyclin-dependent kinase inhibitors during hepatocyte differentiation and growth. Am. J. Physiology-Gastrointestinal Liver Physiology 285, G115–G127. doi:10.1152/ajpgi.00309.2002
Jellema, A., Zeegers, M., Feskens, E., Dagnelie, P. C., and Mensink, R. P. (2003). Gly972Arg variant in the insulin receptor substrate-1 gene and association with Type 2 diabetes: a meta-analysis of 27 studies. Diabetologia 46, 990–995. doi:10.1007/s00125-003-1126-4
Jiramongkol, Y., and Lam, E. W.-F. (2020). FOXO transcription factor family in cancer and metastasis. Cancer Metastasis Rev. 39, 681–709. doi:10.1007/s10555-020-09883-w
Kim, B., Kim, S. W., Lim, J.-Y., and Park, S.-J. (2020). NCAPH is required for proliferation, migration and invasion of non-small-cell lung cancer cells. Anticancer Res. 40, 3239–3246. doi:10.21873/anticanres.14305
Krycer, J. R., and Brown, A. J. (2013). Cholesterol accumulation in prostate cancer: a classic observation from a modern perspective. Biochimica Biophysica Acta (BBA)-Reviews Cancer 1835, 219–229. doi:10.1016/j.bbcan.2013.01.002
Kuzu, O. F., Noory, M. A., and Robertson, G. P. (2016). The role of cholesterol in cancer. Cancer Res. 76, 2063–2070. doi:10.1158/0008-5472.CAN-15-2613
Lang, E., Zelenak, C., Eberhard, M., Bissinger, R., Rotte, A., Ghashghaeinia, M., et al. (2015). Impact of cyclin-dependent kinase CDK4 inhibition on eryptosis. Cell. physiology Biochem. 37, 1178–1186. doi:10.1159/000430241
Lapointe, J., Malhotra, S., Higgins, J. P., Bair, E., Thompson, M., Salari, K., et al. (2008). hCAP-D3 expression marks a prostate cancer subtype with favorable clinical behavior and androgen signaling signature. Am. J. Surg. pathology 32, 205–209. doi:10.1097/PAS.0b013e318124a865
Liang, M.-L., Hsieh, T.-H., Ng, K.-H., Tsai, Y. N., Tsai, C. F., Chao, M. E., et al. (2016). Downregulation of miR-137 and miR-6500-3p promotes cell proliferation in pediatric high-grade gliomas. Oncotarget 7, 19723–19737. doi:10.18632/oncotarget.7736
Liu, M., Xie, W., Zheng, W., Yin, D., Luo, R., and Guo, F. (2019). Targeted binding of estradiol with ESR1 promotes proliferation of human chondrocytes in vitro by inhibiting activation of ERK signaling pathway. Nan Fang yi ke da xue xue bao= J. South. Med. Univ. 39, 134–143. doi:10.12122/j.issn.1673-4254.2019.09.02
Liu, Q., Huang, S.-Y., Yue, D.-M., Wang, J. L., Wang, Y., Li, X., et al. (2017a). Proteomic analysis of Fasciola hepatica excretory and secretory products (FhESPs) involved in interacting with host PBMCs and cytokines by shotgun LC-MS/MS. Parasitol. Res. 116, 627–635. doi:10.1007/s00436-016-5327-4
Liu, Z., Gan, L., Xu, Y., Luo, D., Ren, Q., Wu, S., et al. (2017b). Melatonin alleviates inflammasome-induced pyroptosis through inhibiting NF-κB/GSDMD signal in mice adipose tissue. J. Pineal Res. 63, e12414. doi:10.1111/jpi.12414
Llaverias, G., Danilo, C., Mercier, I., Daumer, K., Capozza, F., Williams, T. M., et al. (2011). Role of cholesterol in the development and progression of breast cancer. Am. J. pathology 178, 402–412. doi:10.1016/j.ajpath.2010.11.005
Luo, Q., Zhang, S., Zhang, D., Yuan, F., Chen, X., and Yang, S. (2020). Expression of ASAP1 and FAK in gastric cancer and its clinicopathological significance. Oncol. Lett. 20, 974–980. doi:10.3892/ol.2020.11612
Maeshima, K., and Eltsov, M. (2008). Packaging the genome: the structure of mitotic chromosomes. J. Biochem. 143, 145–153. doi:10.1093/jb/mvm214
Malumbres, M., and Barbacid, M. (2009). Cell cycle, CDKs and cancer: a changing paradigm. Nat. Rev. cancer 9, 153–166. doi:10.1038/nrc2602
Marschall, A. L., Dübel, S., and Böldicke, T. (2016). Recent advances with ER targeted intrabodies. Protein Target. Compd. 917, 77–93. doi:10.1007/978-3-319-32805-8_5
Martin, L.-A., Ribas, R., Simigdala, N., Schuster, E., Pancholi, S., Tenev, T., et al. (2017). Discovery of naturally occurring ESR1 mutations in breast cancer cell lines modelling endocrine resistance. Nat. Commun. 8, 1865–1915. doi:10.1038/s41467-017-01864-y
Matalkah, F., Martin, E., Zhao, H., and Agazie, Y. M. (2016). SHP2 acts both upstream and downstream of multiple receptor tyrosine kinases to promote basal-like and triple-negative breast cancer. Breast Cancer Res. 18, 2–14. doi:10.1186/s13058-015-0659-z
Murai, T. (2015). Cholesterol lowering: role in cancer prevention and treatment. Biol. Chem. 396, 1–11. doi:10.1515/hsz-2014-0194
Nautiyal, J., Du, J., Yu, Y., Kanwar, S. S., Levi, E., and Majumdar, A. P. N. (2012). EGFR regulation of colon cancer stem-like cells during aging and in response to the colonic carcinogen dimethylhydrazine. Am. J. Physiology-Gastrointestinal Liver Physiology 302, G655–G663. doi:10.1152/ajpgi.00323.2011
Oh, Y. S., Koh, I. K., Choi, B., and Gye, M. C. (2017). ESR1 inhibits hCG-induced steroidogenesis and proliferation of progenitor Leydig cells in mice. Sci. Rep. 7, 43459–43513. doi:10.1038/srep43459
Ono, T., Fang, Y., Spector, D. L., and Hirano, T. (2004). Spatial and temporal regulation of Condensins I and II in mitotic chromosome assembly in human cells. Mol. Biol. Cell 15, 3296–3308. doi:10.1091/mbc.e04-03-0242
Oya, Y., Hayakawa, Y., and Koike, K. (2020). Tumor microenvironment in gastric cancers. Cancer Sci. 111, 2696–2707. doi:10.1111/cas.14521
Prenzel, N., Fischer, O., Streit, S., Hart, S., and Ullrich, A. (2001). The epidermal growth factor receptor family as a central element for cellular signal transduction and diversification. Endocrine-related cancer 8, 11–31. doi:10.1677/erc.0.0080011
Rader, J., Russell, M. R., Hart, L. S., Nakazawa, M. S., Belcastro, L. T., Martinez, D., et al. (2013). Dual CDK4/CDK6 inhibition induces cell-cycle arrest and senescence in neuroblastoma. Clin. cancer Res. 19, 6173–6182. doi:10.1158/1078-0432.CCR-13-1675
Riganti, C., and Massaia, M. (2013). Inhibition of the mevalonate pathway to override chemoresistance and promote the immunogenic demise of cancer cells: killing two birds with one stone. Oncoimmunology 2, e25770. doi:10.4161/onci.25770
Ryu, B., Kim, D. S., DeLuca, A. M., and Alani, R. M. (2007). Comprehensive expression profiling of tumor cell lines identifies molecular signatures of melanoma progression. PloS one 2, e594. doi:10.1371/journal.pone.0000594
Sandoval-Bórquez, A., Polakovicova, I., Carrasco-Véliz, N., Lobos-González, L., Riquelme, I., Carrasco-Avino, G., et al. (2017). MicroRNA-335-5p is a potential suppressor of metastasis and invasion in gastric cancer. Clin. epigenetics 9, 114–116. doi:10.1186/s13148-017-0413-8
Seipold, S., Priller, F. C., Goldsmith, P., Harris, W. A., Baier, H., and Abdelilah-Seyfried, S. (2009). Non-SMC condensin I complex proteins control chromosome segregation and survival of proliferating cells in the zebrafish neural retina. BMC Dev. Biol. 9, 40–14. doi:10.1186/1471-213X-9-40
Smith, B., and Land, H. (2012). Anticancer activity of the cholesterol exporter ABCA1 gene. Cell Rep. 2, 580–590. doi:10.1016/j.celrep.2012.08.011
Smyth, E. C., Nilsson, M., Grabsch, H. I., van Grieken, N. C., and Lordick, F. (2020). Gastric cancer. Lancet 396, 635–648. doi:10.1016/S0140-6736(20)31288-5
Sui, Z., Zhou, J., Cheng, Z., and Lu, P. (2015). Squalene epoxidase (SQLE) promotes the growth and migration of the hepatocellular carcinoma cells. Tumor Biol. 36, 6173–6179. doi:10.1007/s13277-015-3301-x
Sun, D., Li, H., Cao, M., He, S., Lei, L., Peng, J., et al. (2020). Cancer burden in China: trends, risk factors and prevention. Cancer Biol. Med. 17, 879–895. doi:10.20892/j.issn.2095-3941.2020.0387
Thadani, R., Kamenz, J., Heeger, S., Muñoz, S., and Uhlmann, F. (2018). Cell-cycle regulation of dynamic chromosome association of the condensin complex. Cell Rep. 23, 2308–2317. doi:10.1016/j.celrep.2018.04.082
Thammasit, P., Sangboonruang, S., Suwanpairoj, S., Khamaikawin, W., Intasai, N., Kasinrerk, W., et al. (2015). Intracellular acidosis promotes mitochondrial apoptosis pathway: role of EMMPRIN down-regulation via specific single-chain Fv intrabody. J. Cancer 6, 276–286. doi:10.7150/jca.10879
Tsukano, H., Gotoh, T., Endo, M., Miyata, K., Tazume, H., Kadomatsu, T., et al. (2010). The endoplasmic reticulum stress-C/EBP homologous protein pathway-mediated apoptosis in macrophages contributes to the instability of atherosclerotic plaques. Arteriosclerosis, thrombosis, Vasc. Biol. 30, 1925–1932. doi:10.1161/ATVBAHA.110.206094
Turner, N. C., Liu, Y., Zhu, Z., Loi, S., Colleoni, M., Loibl, S., et al. (2019). Cyclin E1 expression and palbociclib efficacy in previously treated hormone receptor–positive metastatic breast cancer. J. Clin. Oncol. 37, 1169–1178. doi:10.1200/JCO.18.00925
Wang, L., Cui, M., Cheng, D., Qu, F., Yu, J., Wei, Y., et al. (2021). miR-9-5p facilitates hepatocellular carcinoma cell proliferation, migration and invasion by targeting ESR1. Mol. Cell. Biochem. 476, 575–583. doi:10.1007/s11010-020-03927-z
Yamada, Y., Arai, T., Kojima, S., Sugawara, S., Kato, M., Okato, A., et al. (2018). Regulation of antitumor miR-144-5p targets oncogenes: direct regulation of syndecan-3 and its clinical significance. Cancer Sci. 109, 2919–2936. doi:10.1111/cas.13722
Yin, L., Jiang, L.-P., Shen, Q.-S., Xiong, Q. X., Zhuo, X., Zhang, L. L., et al. (2017). NCAPH plays important roles in human colon cancer. Cell death Dis. 8, e2680. doi:10.1038/cddis.2017.88
Zeng, D., Li, M., Zhou, R., Zhang, J., Sun, H., Shi, M., et al. (2019). Tumor microenvironment characterization in gastric cancer identifies prognostic and immunotherapeutically relevant gene signatures. Cancer Immunol. Res. 7, 737–750. doi:10.1158/2326-6066.CIR-18-0436
Zhang, L., Huang, Y., Ling, J., Zhuo, W., Yu, Z., Shao, M., et al. (2018). Screening and function analysis of hub genes and pathways in hepatocellular carcinoma via bioinformatics approaches. Cancer Biomarkers 22, 511–521. doi:10.3233/CBM-171160
Zhang, L.-L., Wei, J.-Y., Wang, L., Huang, S. L., and Chen, J. L. (2017). Human T-cell lymphotropic virus type 1 and its oncogenesis. Acta Pharmacol. Sin. 38, 1093–1103. doi:10.1038/aps.2017.17
Zhang, P., Liu, L., Huang, J., Shao, L., Wang, H., Xiong, N., et al. (2014). Non-SMC condensin I complex, subunit D2 gene polymorphisms are associated with Parkinson’s disease: a Han Chinese study. Genome 57, 253–257. doi:10.1139/gen-2014-0032
Zhang, S., Luo, Q., Feng, R., Yang, F., Xu, Q., Chen, X., et al. (2021a). ADP ribosylation factor guanylate kinase 1 promotes the malignant phenotype of gastric cancer by regulating focal adhesion kinase activation. Life Sci. 273, 119264. doi:10.1016/j.lfs.2021.119264
Zhang, X., Zhu, M., Wang, H., Song, Z., Zhan, D., Cao, W., et al. (2021b). Overexpression of NCAPG inhibits cardia adenocarcinoma apoptosis and promotes epithelial-mesenchymal transition through the Wnt/β-catenin signaling pathway. Gene 766, 145163. doi:10.1016/j.gene.2020.145163
Keywords: gastric cancer, NCAPD3, proliferation, apoptosis, molecular mechanism
Citation: Zhang S-Y, Luo Q, Xiao L-R, Yang F, Zhu J, Chen X-Q and Yang S (2024) Role and mechanism of NCAPD3 in promoting malignant behaviors in gastric cancer. Front. Pharmacol. 15:1341039. doi: 10.3389/fphar.2024.1341039
Received: 19 November 2023; Accepted: 30 March 2024;
Published: 22 April 2024.
Edited by:
Jiajie Peng, Northwestern Polytechnical University, ChinaReviewed by:
Maitane Asensio, University of Salamanca, SpainCopyright © 2024 Zhang, Luo, Xiao, Yang, Zhu, Chen and Yang. This is an open-access article distributed under the terms of the Creative Commons Attribution License (CC BY). The use, distribution or reproduction in other forums is permitted, provided the original author(s) and the copyright owner(s) are credited and that the original publication in this journal is cited, in accordance with accepted academic practice. No use, distribution or reproduction is permitted which does not comply with these terms.
*Correspondence: Sheng Yang, ZHJ5YW5neGgyMDE3QHNpbmEuY29t; Xiang-Qi Chen, ZHJjaHhxdGdAMTI2LmNvbQ==; Jian Zhu, emh1amlhbjEyMDRAeWFob28uY29t
‡ORCID: Su-Yun Zhang, orcid.org/0000-0001-8813-6751; Qiong Luo, orcid.org/0000-0001-8216-4524; Li-Rong Xiao, orcid.org/0009-0004-0783-3635; Fan Yang, orcid.org/0000-0002-9634-7003; Jian Zhu, orcid.org/0000-0003-3596-4339; Xiang-Qi Chen, orcid.org/0000-0003-3367-6261; Sheng Yang, orcid.org/0000-0003-4226-2159
†These authors have contributed equally to this work
Disclaimer: All claims expressed in this article are solely those of the authors and do not necessarily represent those of their affiliated organizations, or those of the publisher, the editors and the reviewers. Any product that may be evaluated in this article or claim that may be made by its manufacturer is not guaranteed or endorsed by the publisher.
Research integrity at Frontiers
Learn more about the work of our research integrity team to safeguard the quality of each article we publish.