 Meichen Pan
 Lingxue Cheng2†
 Chunyi Lyu
 Chao Hou
94% of researchers rate our articles as excellent or good
Learn more about the work of our research integrity team to safeguard the quality of each article we publish.
Find out more
ORIGINAL RESEARCH article
Front. Pharmacol., 31 August 2023
Sec. Experimental Pharmacology and Drug Discovery
Volume 14 - 2023 | https://doi.org/10.3389/fphar.2023.1249041
This article is part of the Research TopicArtificial Intelligence and Drug DiscoveryView all 13 articles
Background: Dihydropteridone derivatives represent a novel class of PLK1 inhibitors, exhibiting promising anticancer activity and potential as chemotherapeutic drugs for glioblastoma.
Objective: The aim of this study is to develop 2D and 3D-QSAR models to validate the anticancer activity of dihydropteridone derivatives and identify optimal structural characteristics for the design of new therapeutic agents.
Methods: The Heuristic method (HM) was employed to construct a 2D-linear QSAR model, while the gene expression programming (GEP) algorithm was utilized to develop a 2D-nonlinear QSAR model. Additionally, the CoMSIA approach was introduced to investigate the impact of drug structure on activity. A total of 200 novel anti-glioma dihydropteridone compounds were designed, and their activity levels were predicted using chemical descriptors and molecular field maps. The compounds with the highest activity were subjected to molecular docking to confirm their binding affinity.
Results: Within the analytical purview, the coefficient of determination (R2) for the HM linear model is elucidated at 0.6682, accompanied by an R2cv of 0.5669 and a residual sum of squares (S2) of 0.0199. The GEP nonlinear model delineates coefficients of determination for the training and validation sets at 0.79 and 0.76, respectively. Empirical modeling outcomes underscore the preeminence of the 3D-QSAR model, succeeded by the GEP nonlinear model, whilst the HM linear model manifested suboptimal efficacy. The 3D paradigm evinced an exemplary fit, characterized by formidable Q2 (0.628) and R2 (0.928) values, complemented by an impressive F-value (12.194) and a minimized standard error of estimate (SEE) at 0.160. The most significant molecular descriptor in the 2D model, which included six descriptors, was identified as “Min exchange energy for a C-N bond” (MECN). By combining the MECN descriptor with the hydrophobic field, suggestions for the creation of novel medications were generated. This led to the identification of compound 21E.153, a novel dihydropteridone derivative, which exhibited outstanding antitumor properties and docking capabilities.
Conclusion: The development of 2D and 3D-QSAR models, along with the innovative integration of contour maps and molecular descriptors, offer novel concepts and techniques for the design of glioblastoma chemotherapeutic agents.
Glioblastoma (GBM), as a highly malignant tumor, originates from genetic alterations in neural glial stem cells or progenitor cells, rendering it highly invasive and lethal (Wang and Jiang, 2013; Schiff et al., 2019). Clinical manifestations of GBM primarily include increased intracranial pressure, seizures, headaches, and neurological deficits (Márquez et al., 2017; Doan et al., 2020). The current standard treatment for GBM is surgical resection. However, due to the highly infiltrative nature of GBM, the active region often overlaps extensively with vital brain areas involved in motor function and language, making complete eradication through surgery challenging and leading to disease progression and recurrence (Davis, 2016). Approximately 70% of GBM patients experience disease progression within a year after diagnosis, with less than 5% surviving beyond 5 years post-diagnosis (Zhu et al., 2019). Consequently, multimodal therapies such as radiation therapy and immunotherapy are often concurrently employed alongside surgical intervention (Tan et al., 2020).
Currently, several chemotherapy drugs are available for GBM treatment, including temozolomide, bevacizumab, carboplatin, etoposide, and irinotecan (Zhao et al., 2020). However, these drugs are associated with adverse effects such as bleeding, perforation, and hepatorenal dysfunction. Prolonged use of a single type of chemotherapy drug also leads to the development of drug resistance, further compromising patient prognosis (Wu et al., 2021). Nonetheless, the molecular mechanisms underlying GBM recurrence, metastasis, drug resistance, and toxicity remain incompletely elucidated. Limited progress has been made in chemotherapy drug research since 2005 (Jackson, Choi, and Lim, 2019). Consequently, there is a pressing need to develop GBM chemotherapy drugs with reduced toxicity and improved efficacy to enhance treatment outcomes.
The principal focal point of action for dihydropteridone derivatives lies in Polo-like kinase 1 (PLK1). PLK1 assumes a pivotal role in numerous functions, encompassing DNA checkpoint regulation, cellular division, microtubule dynamics, and DNA replication/repair (Kim et al., 2017). Being a proto-oncogene, PLK1 expression levels are significantly elevated in various malignancies, including glioblastoma, making it a potential therapeutic target for glioblastoma treatment (Bhola et al., 2015). Dihydropteridone derivatives exert their anticancer effects primarily by interfering with folate metabolism and inhibiting the dihydropteridone reductase pathway (Martin et al., 2020). By impeding the synthesis of nucleotides, the building blocks of DNA and RNA, these drugs disrupt fundamental processes involved in tumor cell development and proliferation (Hofheinz et al., 2010). Additionally, they can induce DNA damage and promote apoptosis in tumor cells (Kim et al., 2017). Moreover, the synthesis process of dihydropteridone-class compounds is relatively straightforward, and their production costs are not exorbitant, providing a foundation for their future prospects in anticancer treatment. Recently, a novel dihydropteridone derivative has garnered attention (Li et al., 2023), as it possesses the aforementioned advantages and also incorporates an oxadiazole moiety, significantly ameliorating the inherent metabolic vulnerability of amides to hydrolysis by esterases and hepatic amidases (Fukami and Yokoi, 2012; Robins, Fogle, and Marlier, 2015). This enhancement in metabolic stability contributes to its improved anticancer activity and opens new avenues for designing chemotherapy drugs targeting glioblastoma.
To facilitate the efficient design and evaluation of novel drugs, we introduce computer-aided drug design, with quantitative structure-activity relationship (QSAR) being the most exceptional experimental approach (Janicka and Śliwińska, 2022). This mathematical framework establishes a correlation between the scrutiny of structural attributes and the corresponding pharmacological efficacy. In previous studies on QSAR modeling, the 2D model primarily focuses on elucidating the impact of the molecular descriptors’ quantity and class on drug activity. Conversely, the 3D model places emphasis on exploring the correlation between the spatial configuration of the molecule and its activity. In the present study, we aim to leverage the strengths of both approaches—molecular descriptors and molecular force fields—to develop a predictive model for the activity of dihydropteridone derivatives against GBM. By employing this mathematical model, our objective is to facilitate the design of more efficacious chemotherapeutic drugs targeting GBM.
All the dihydropteridone derivatives with an oxadiazole moiety used in this experiment were obtained from the research conducted by Zhiwei Li et al. (Li et al., 2023). The structures and corresponding activity values of the 34 compounds are presented in Table 1.
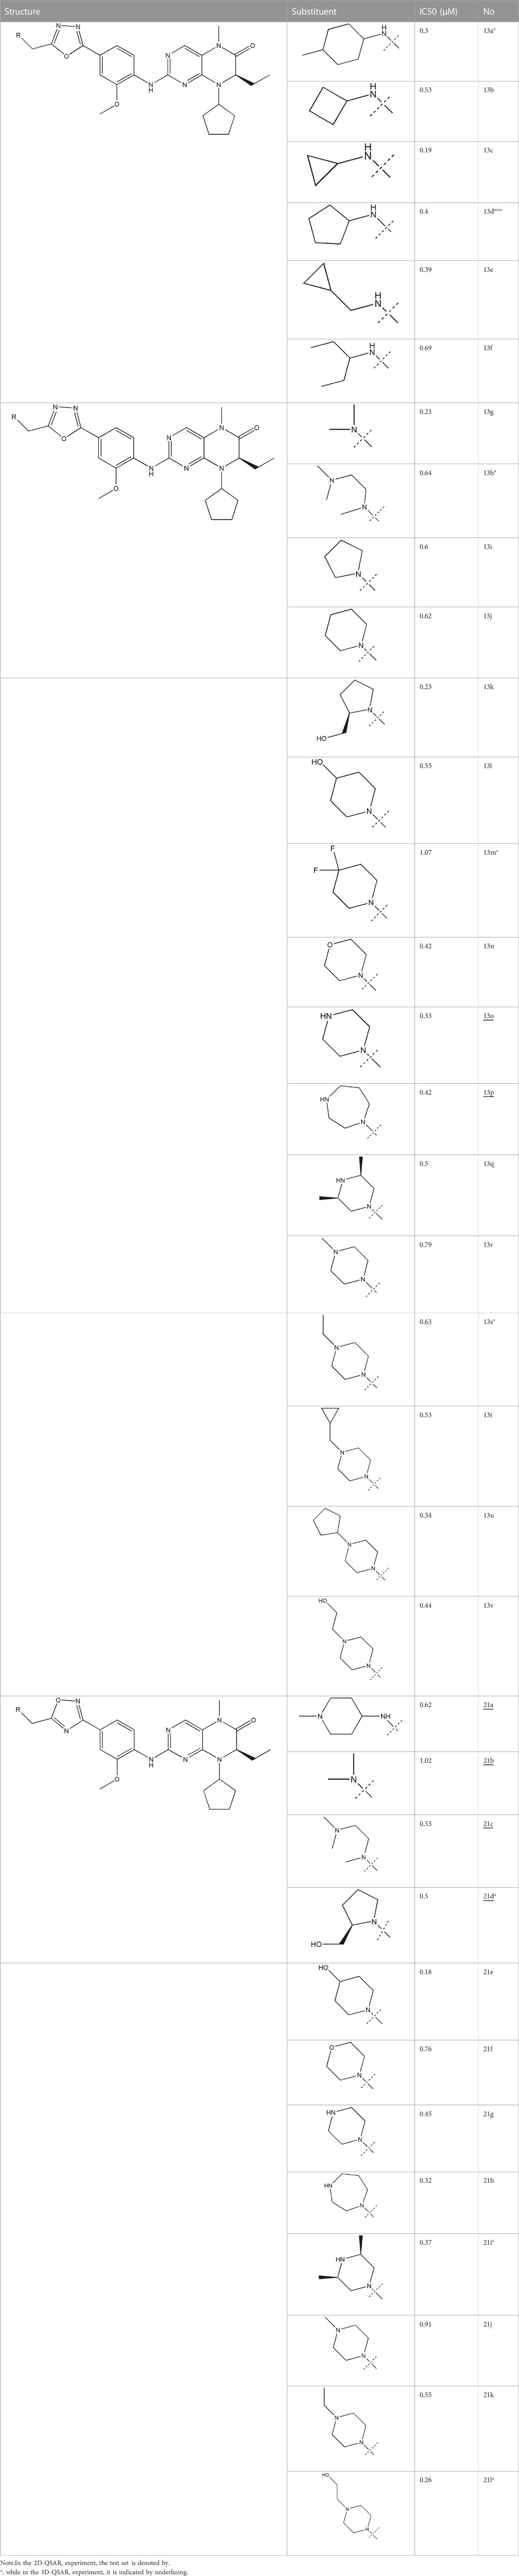
TABLE 1. Structure and IC50 values of 47 compounds.
To mitigate the risk of overfitting, a random partitioning was applied to the set of 34 compounds at a ratio of 1:3, resulting in 8 compounds assigned to the test set and 26 compounds allocated to the training set. The primary objective of the training set is to establish and refine the model, encompassing the construction, calibration, as well as the identification of key variables and algorithms. Meanwhile, the test set serves primarily for model calibration purposes, ensuring the assessment remains unbiased and does not involve parameter modification. Ultimately, decisions regarding algorithm adjustments or model retraining are contingent upon evaluating the overall fit of the model.
The performance of the QSAR model relies heavily on the appropriate selection of molecular descriptors, necessitating the structural optimization of the compound under investigation. In this study, the chemical structure was initially sketched using ChemDraw (Evans, 2014) and subsequently subjected to optimization using HyperChem (Froimowitz, 1993). The optimization process involved employing the molecular mechanics field (MM+) for the initial optimization, followed by the selection of the AM1 or PM3 model based on the presence or absence of S and P atoms. Furthermore, the structure was cyclically optimized using the Polak-Ribiere method until the root mean square gradient reached a threshold of 0.01. Finally, the CODESSA program (Katritzky et al., 2001) was utilized to compute molecular descriptors encompassing quantum chemistry, structure, topology, geometry, and electrostatic properties.
In the process of constructing linear models, the Heuristic Method (HM) was employed to extract all molecular descriptors. Subsequently, feature selection was conducted to determine the optimal number of descriptors that effectively represent the chemical structure while excluding descriptors with minimal impact. Objective measures, such as the F-test, R2, R2CV, and t-test, were used to evaluate the correlation coefficients between two parameters. Additional descriptors were iteratively added until further inclusion of descriptors had little influence on the results. The linear model obtained through this procedure consisted of six descriptors.
Gene Expression Programming (GEP) is a powerful technique rooted in programming and algorithms (Allen, 1992), surpassing the capabilities of both. Unlike coding numbers or analyzing trees, GEP utilizes linear chromosomes as candidates (Kaydani, Mohebbi, and Eftekhari, 2014). The coding of constant-length linear symbols and the derivation of individual phenotypes, similar to coding codes and expression trees, respectively, are employed (Teodorescu and Sherwood, 2008). The candidate chromosomes are generated from the feature set and the end set, and then encoded into an expression tree (ET) format to calculate the equation (Gharagheizi et al., 2012).
Figure 1 illustrates the overall process of GEP. Fitness functions are applied to a random number of chromosomes, with termination conditions being either the achievement of the predicted value or reaching the maximum number of iterations. When the termination requirement is not met, individuals are selected using the elite roulette approach. Genetic operations such as mutation, transposition, and recombination are applied to the selected individuals to form a new generation. This process is repeated iteratively to obtain improved results.
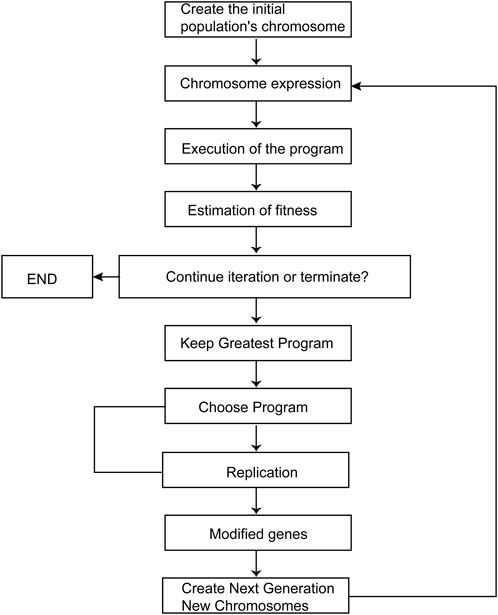
FIGURE 1. GEP diagram.
At the operational level, the molecular descriptor values are inputted using automated problem software (APS), and the GEP technique is employed to derive the nonlinear model. The quality of the model is evaluated using R2 as an objective assessment indicator, and appropriate parameter selection is critical to achieve this objective.
Thus, two models were designed: one linear and the other nonlinear. Clearly, the nonlinear model generated by the GEP method outperforms the linear model in terms of both predictiveness and stability. However, it should be noted that 2D-QSAR alone fails to fully capture the three-dimensional relationship between molecular structure and activity, highlighting the need for further exploration through 3D-QSAR studies.
The IC50 denotes the concentration of a compound necessary to inhibit a biological process by 50% (Sebaugh, 2011), and it frequently covers a wide range of magnitudes. In light of this, we employed the formula log (IC50) + 9 to substitute the IC50 values for the 34 compounds. This approach was undertaken to facilitate the analysis and processing of the data, ultimately enhancing both accuracy and stability. These modified data were randomly divided into validation and training sets in a 1:4 ratio.
Furthermore, the ChemDraw structures of the compounds were imported into the SYBYL program for additional optimization. Unlike previous optimizations, this step aimed to minimize the energy of the CoMSIA structure as much as possible. To achieve this, the Tripos force field and Powell gradient technique were implemented within the software (Yu et al., 2015).
This optimization process was underpinned by a systematic calibration of salient operational parameters. The Dielectric Function was set to “Distance,” the MB Cut-off was designated at 8, and the Dielectric Constant was adjusted to 1. Further refinement was achieved by determining the Max Displacement at 0.01, establishing the Minimum Energy Change at 0.05, setting the LS Accuracy to 0.001, configuring the RMS Displacement at 0.001, and specifying the Gradient at 0.05. Following this intricate calibration, the software initiated a comprehensive sequence of 1,000 iterations, leading to the generation of an optimal minimal structure. This resultant structure subsequently served as the foundational 3D conformation for ensuing analytical stages.
The selection and comparison of conformations are crucial as the compound’s structure plays a vital role in subsequent modeling processes (Patel et al., 2008; Ai et al., 2011). Among the 34 compounds, 21E, which exhibited the highest activity value, was chosen as the reference or stacking template. The bold segment of 21E is exceptionally designated due to its manifestation of the identical structure that compound 21E shares with the other compounds. Based on this reference, the remaining compounds were aligned and arranged accordingly (as shown in Figure 2).
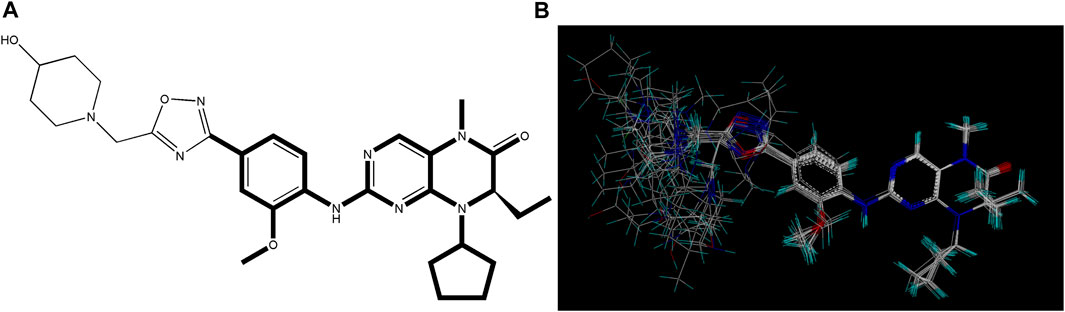
FIGURE 2. Utilization of compound 21E as a molecular stacking template. (A) Bold highlighting indicates the stacking regions shared by all compounds. (B) Graph illustrating the subsequent stacking process.
The Comparative Molecular Similarity Index Analysis (CoMSIA) is based on the concept that changes in molecular bond affinities are strongly correlated with changes in molecular properties (Yu et al., 2015). This technique involves the calculation of molecular fields as numerous contour plots using a Gaussian function that depends on distance (Li et al., 2012). In contrast to CoMFA, CoMSIA utilizes contour plots to depict the five distinct spatial molecular fields. This approach eliminates the need for arduous procedures, such as aligning the grid with the molecules in the dataset, which is required in CoMFA (Bordas, Komives, and Lopata, 2003). As a result, CoMSIA enhances both clarity and precision in the analysis.
The region for molecule stacking is filled with a cubic grid with a pitch of 2 Å and extending 4 Å in all directions. The default probe generates a multi-molecular field grid, and the affinity is associated with molecular properties using partial least squares (PLS). This leads to the construction of a 3D quantitative conformational model.
The leave-one-out (LOO) cross-validation test is employed to determine statistical significance, providing cross-validated correlation coefficients (Q2) and best group scores (ONC) (Hadni and Elhallaoui, 2020). Additionally, the ONC is further analyzed through non-cross-validation to formulate the ultimate regression model. Objective assessment indicators such as the standard error of estimate (SEE), F-value, and non-cross-validation correlation coefficient (R2) are used for the evaluation of non-cross-validation modeling (Yan et al., 2020).
The method of external validation was employed to forecast the activity of the compound set in the test group (Yan et al., 2020), yielding the correlation coefficient
In the aforementioned equation, ntest represents the total quantity of compounds present within the test set. Symbol
Moreover, we performed an supplementary validation of the model utilizing
The formula is expressed as follows:
Within the formula,
Meanwhile, an internal validation, specifically, a 20-times Y-randomization validation, was performed to ascertain the optimal model. We subjected the dependent variables to randomization and generated new QSAR models. On each occasion, these newly created models exhibited lower q2 and R2 values than the original model. Subsequently, the parameter
Where
The compounds underwent initial optimization using the SYBYL software, employing the Tripos force field. Following that, the conformation displaying the minimum energy value was chosen for the molecular docking procedure. The PLK1 receptor (ID: 3db6) was obtained from the RCSB Protein Data Bank (PDB) during the second stage. After removing water molecules and hydrogenated atoms, the protein ligand was extracted and discarded, while retaining the binding site for further analysis.
Following this, a flexible docking approach was employed to facilitate the interaction between the ligand and receptor, allowing for the exposure of the active pocket at the binding site. Docking was performed utilizing Sybyl-Dock as the benchmark, employing a docking threshold with a value of 0.5, an expansion factor of 1, and a retention of 20 conformational alterations. The evaluation of ligand-receptor interactions was objectively conducted using a comprehensive scoring function, with higher values indicating a stronger binding impact of the drug. Undoubtedly, the considerations of hydrophobicity, enthalpy, and polarity are crucial in this context.
A total of 501 molecular descriptors were calculated for the 34 compounds using CODESSA. Based on the hierarchical modeling (HM), a linear model consisting of eight distinct descriptor numbers (1–8) was constructed. The relationship between these descriptor numbers and the model’s evaluation indexes, namely R2, R2cv, and S2, was examined (refer to Figure 3). It was observed that both R2 and R2cv showed positive correlations with the increase in descriptor numbers, while S2 exhibited an inverse relationship. Notably, the addition of the 7th descriptor did not result in a significant improvement in R2. The six-parameter HM model, with an R2 value of 0.6682, an R2cv of 0.5669, and an S2 measuring at 0.0199, is deemed the optimal linear model for evaluating the efficacy of glioma inhibitors.
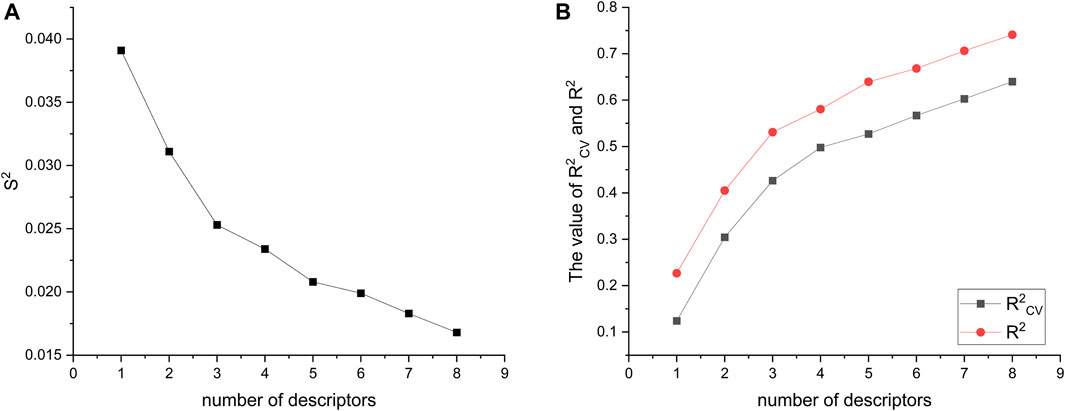
FIGURE 3. Visualization of descriptor number changes in relation to S2 (A), R2, and R2cv (B).
Specific information about the six modeled molecular descriptors is provided in Table 2. To ensure the absence of multicollinearity, Table 3 presents the correlation between these descriptors. The correlation coefficient between any two descriptors was found to be less than 0.80, indicating their independence and lack of mutual influence. This validates the integrity of the linear model.
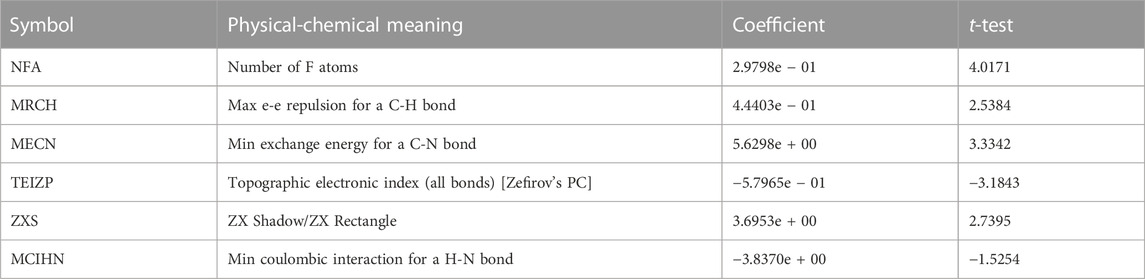
TABLE 2. Correlation information for the six molecular descriptors.
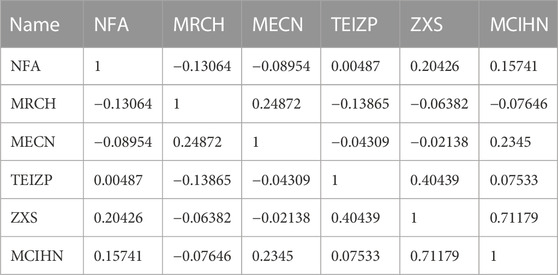
TABLE 3. Correlation table displaying the relationships among the selected six descriptors.
Figure 4 illustrates the predicted and measured values of the hierarchical modeling (HM) linear model for the compounds. The equation representing this model is as follows: Log (IC50) = −2.4280e + 01 + NFA*2.9798e − 01 + MRCH*4.4403e − 01 + MECN*5.6298e + 00 − TEIZP*5.7965e − 01 + ZXS *3.6953e + 00 − MCIHN*3.8370e + 00.
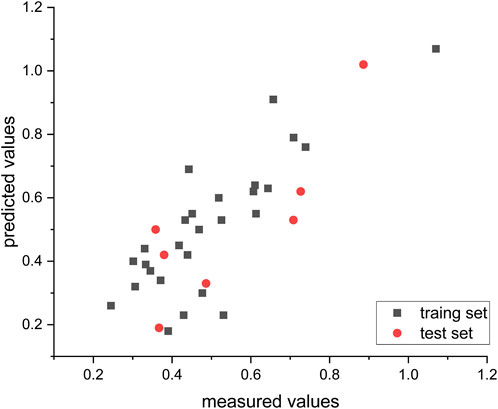
FIGURE 4. Empirical vs. computed log (IC50) values using the HM methodology.
The absolute magnitude of the coefficients was employed to evaluate the impact of the molecular descriptors on the antiglioma activity of dihydropteridone derivatives. It can be observed that the order of influence is as follows: MECN > MCIHN > ZXS > TEIZP > MRCH > NFA.
After randomly assigning the 34 compounds, 26 compounds were allocated to the training set, and the remaining 8 compounds were assigned to the test set in proportion. The nonlinear model was constructed using the GEP method implemented in the Automated Problem Solver (APS) program. Table 4 provides the model’s parameters and corresponding symbols. The distribution of predicted and measured values obtained from this model for compound prediction is depicted in Figure 5. The R2 values for the training and test sets are 0.79 and 0.76, respectively, indicating a high level of accuracy in the model’s predictions.
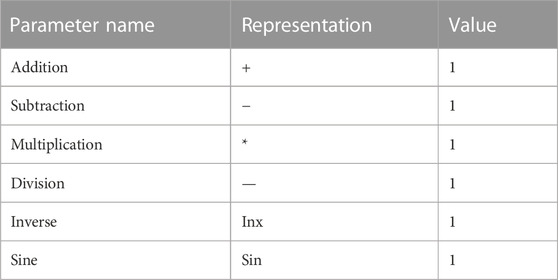
TABLE 4. Parameters and symbols used in nonlinear equation operations.
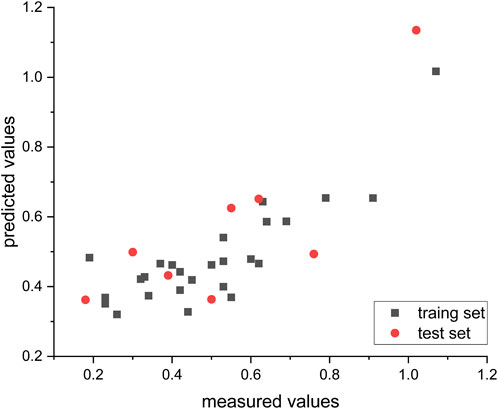
FIGURE 5. Empirical and predicted values from non-linear algorithms (GEP), with all IC50 measurements converted to their respective log (IC50) notations.
The nonlinear model equations were translated into the following representation using the C programming language: Log\[IC_(50) \] = 1\/\(TEIZP − NFA\) + sin\[sin\(TEIZP\) + \(MECN − MECN\)\]\/\(MRCH − MCIHN\) * sin\(MRCH\) + ZXS * 1\/\{MRCH * sin\(ZXS\) \/ZXS + ZXS \/TEIZP + sin\[sin\(sin\(sin\(MRCH\) * sin\(MCIHN\)\)\)\]\}.
Table 5 presents the key statistical data for the CoMSIA model with the most optimal performance. The model exhibits high Q2 (0.628), R2 (0.928), and F-values (12.194), indicating a strong and reliable fit. Additionally, the model demonstrates low SEE values (0.160), further supporting its robustness.
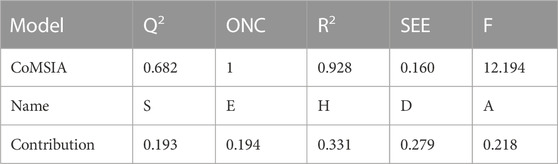
TABLE 5. Statistical results of the highly efficient 3D-QSAR model derived from the CoMSIA method.
When the
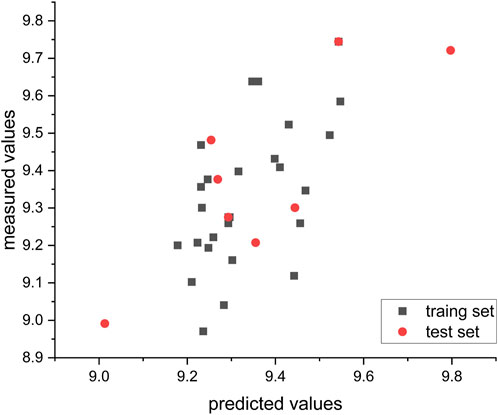
FIGURE 6. Relationship between measured and predicted values in the CoMSIA model.
The utilization of CoMSIA confers a notable advantage wherein it enables the visualization of contour maps pertaining to individual molecular fields (Mao et al., 2012). This feature establishes a fundamental basis for our comprehension of the role of physicochemical structure in activity. Moreover, the identification and annotation of pivotal structures, regions, and active sites have yielded significant advancements in the development of innovative pharmaceuticals.
As exemplified in Figure 7, the illustration exemplifies the diverse contributions of the five molecular fields to the most active 21E molecule. Evidently, the hydrophobic field exerts a substantial influence on the compound, thus necessitating a subsequent design orientation in alignment with this aspect.
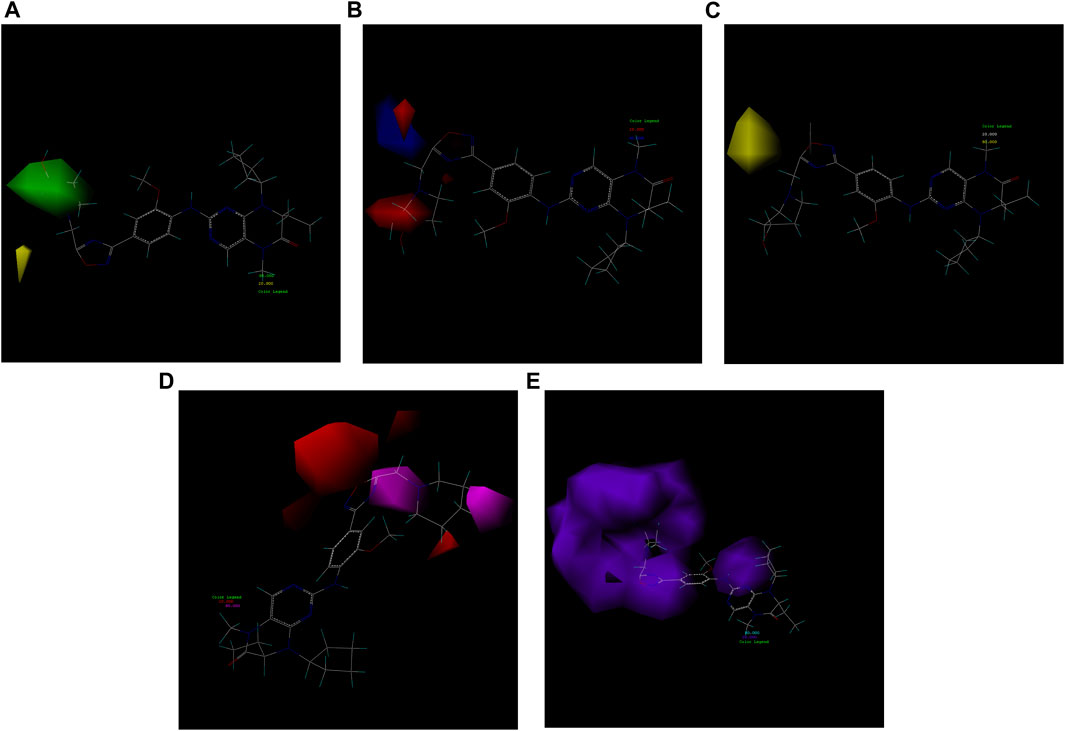
FIGURE 7. Five molecular field maps of CoMSIA based on the template of compound 21E. (A) Steric field, with the increase of the green group positively correlated with activity and the increase of the yellow group negatively correlated. (B) Electrostatic field, exhibiting a positive correlation between the increase of the red negative field and blue positive field and the activity. (C) Hydrophobic field, where the yellow portion requires strengthening of its hydrophobic structure, while the gray portion necessitates reinforcement of its hydrophilic structure. (D) Hydrogen bond acceptor field, indicating the need for an increase in the purple region and a decrease in the red region for hydrogen bond acceptors. (E) Hydrogen bond donor field, indicating the need for augmentation in the blue-green region and reduction in the purple region for hydrogen bond donors.
First, we must analyze the regions wherein positive and negative alterations in molecular descriptors lead to augmented or diminished activity, respectively. Subsequently, we shall explore the influence of modifications in the 3D structural attributes within the CoMSIA contour map on the biological activity in 3D space. It is imperative to identify five molecular fields, namely spatial (S), hydrogen bond donor (D), electrostatic (E), hydrogen bond acceptor (A), and hydrophobic (H), where advantageous changes correspond to heightened activity in specific regions. By manipulating the distinct 3D geometries and compositions of the compounds, we can ascertain their association with the favorable regions on the 3D CoMSIA contour map.
Upon evaluating the outcomes of 2D-QSAR analysis on dihydropteridone derivatives, it was determined that the molecular descriptor known as “Minimum exchange energy for a C-N bond” (MECN) exerts the most substantial influence on the compound’s activity. MECN represents the underlying energetics of the C-N bond transformation (Gilli et al., 2002). This energy metric holds paramount importance in the sophisticated realms of molecular interactions and bonding dynamics. It significantly influences the bioactivity of molecular entities by determining their inherent stability, reactivity, and binding propensity (Bariwal and Van der Eycken, 2013). The intrinsic affinity between a molecule and its designated target is central to assessing its therapeutic efficacy. A reduced MECN suggests enhanced stability in molecular engagements with biological entities, implying superior inhibitory responses against pathogenic enzymes or proteins. Conversely, an elevated MECN could compromise these interactions, thereby diminishing a compound’s therapeutic effectiveness. Therefore, understanding and optimizing the MECN is pivotal for amplifying its bioactive potential.
Beyond the MECN, five paramount molecular descriptors are delineated: the “Number of fluorine atoms,” which modulates solubility and metabolic tenacity (Shah and Westwell, 2007); the “Max e-e repulsion for a C-H bond,” articulating molecular conformation and kinetic propensities (Brandes and Ellman, 2022); the “Topographic electronic index (all bonds) [Zefirov’s PC],” epitomizing molecular discernment via electronic topography (Hamlin, Swart, and Bickelhaupt, 2018); the “Min coulombic interaction for a H-N bond,” signifying electrostatic congruencies (Tang et al., 2020); and the “ZX Shadow/ZX Rectangle,” encapsulating the compound’s spatial and electronic disposition (Silakari et al., 2008).
Leveraging this observation, along with the notable importance of the hydrophobic field in CoMSIA, the MECN descriptor was integrated into the design process for novel medications, with a particular emphasis on augmenting the drug’s efficacy through the hydrophobic field.
A total of 200 new dihydropteridone derivatives were synthesized and subsequently assessed using CoMSIA software, utilizing 21E as a template. Due to spatial limitations, only the top eight innovative compounds and their projected activity levels are presented in Table 6. Notably, 21E.153, exhibiting the highest activity value, exhibits promising potential as an anti-glioma medication. Molecular docking experiments were subsequently conducted to further validate our hypothesis.
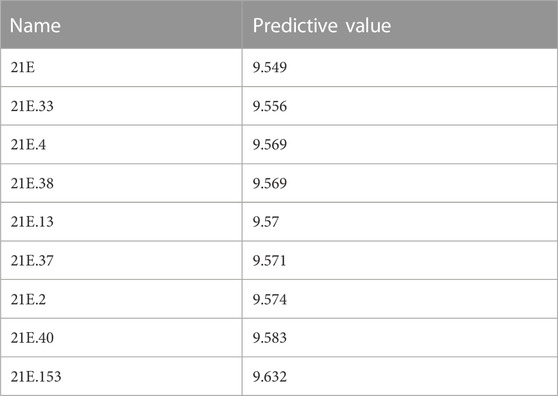
TABLE 6. A Presentation of 200 novel compounds along with their predicted values (shown here are the top eight only).
In this investigation, we employed ligands 21E, 21E.153, and Temozolomide for conducting molecular docking experiments with the glioma-associated target PKL1, respectively. Temozolomide, a commonly utilized chemotherapeutic agent for glioma, was chosen as the docking ligand. Figure 8 illustrates the docking results of these three compounds, wherein the yellow segment denotes hydrogen bonding interactions. It is worth noting that compound 21E.153 exhibits a remarkable presence of three hydrogen bonds, surpassing the quantities observed in compounds 21E and temozolomide. Furthermore, their respective docking scores of 8.7688, 8.7067, and 3.4497 provide additional support for this interpretation. Collectively, the aforementioned observations substantiate the superior docking efficacy of compound 21E.153.
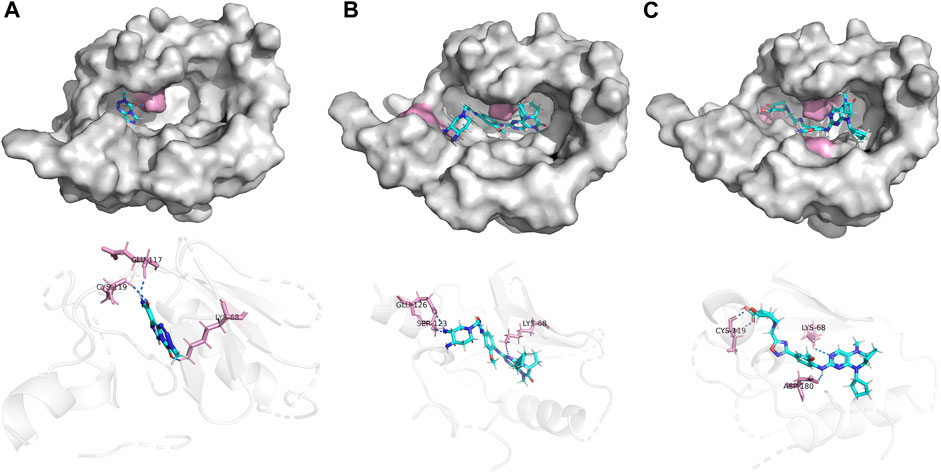
FIGURE 8. Docking of compounds 21E (A), 21E.153 (B), Temozolomide (C) and to a glioblastoma-associated target (PLK1, PDB ID: 3db6).
In this study, our initial approach involved the exploration of both linear and nonlinear 2D-QSAR models. However, it became evident that the nonlinear models outperformed the linear models in terms of stability and prediction capabilities. Nonetheless, both linear and nonlinear models overlook the influence of spatial structure on activity. Hence, we proceeded to develop a 3D-QSAR model utilizing the CoMSIA technique. The robustness of the 3D-QSAR model is demonstrated by its high Q2 (0.628), R2 (0.928), and F-values (12.194), along with low SEE values (0.160).
Employing the CoMSIA approach not only enables us to uncover the three-dimensional structural variations of the model but also provides us with five molecular field contour maps, which prove to be unexpectedly valuable for the generation of new molecules. By combining the significant molecular descriptor “MECN” with the significant molecular field “hydrophobic field”, we successfully generated and postulated 200 novel compounds. Among these, compound 21E.153 emerged as the most potent.
To validate the affinity of these compounds for glioma-related receptor targets, we conducted molecular docking experiments. Encouragingly, 21E.153 exhibited the most favorable docking interaction, introducing a novel concept and strategy for the future development of glioma medications.
The datasets presented in this study can be found in online repositories. The names of the repository/repositories and accession number(s) can be found in the article/Supplementary material.
Conceptualization, MP and LC; methodology, MP and CH; software, MP; validation, CL and LC; formal analysis, MP; investigation, MP; data curation, CH; writing original draft preparation, MP; writing review and editing, YW and QZ; funding support, YW and QZ. All authors contributed to the article and approved the submitted version.
China Academy of Traditional Chinese Medicine Experimental Center unveils the list of hanging topics (JBGS2021007) funded the research.
We appreciate the efforts of the SYBYL, CODESSA, and APS software developers.
The authors declare that the research was conducted in the absence of any commercial or financial relationships that could be construed as a potential conflict of interest.
All claims expressed in this article are solely those of the authors and do not necessarily represent those of their affiliated organizations, or those of the publisher, the editors and the reviewers. Any product that may be evaluated in this article, or claim that may be made by its manufacturer, is not guaranteed or endorsed by the publisher.
Ai, Y., Wang, S.-T., Tang, C., Sun, P.-H., and Song, F.-J. (2011). 3D-QSAR and docking studies on pyridopyrazinones as BRAF inhibitors. Med. Chem. Res. 20, 1298–1317. doi:10.1007/s00044-010-9468-1
Bariwal, J., and Van der Eycken, E. (2013). C–N bond forming cross-coupling reactions: an overview. Chem. Soc. Rev. 42 (24), 9283–9303. doi:10.1039/c3cs60228a
Bhola, N. E., Jansen, V. M., Bafna, S., Giltnane, J. M., Balko, J. M., Estrada, M. V., et al. (2015). Kinome-wide functional screen identifies role of PLK1 in hormone-independent, ER-positive breast cancer. Cancer Res. 75 (2), 405–414. doi:10.1158/0008-5472.CAN-14-2475
Bordas, B., Komives, T., and Lopata, A. (2003). Ligand-based computer-aided pesticide design. A review of applications of the CoMFA and CoMSIA methodologies. Pest Manag. Sci. 59 (4), 393–400. doi:10.1002/ps.614
Brandes, D. S., and Ellman, J. A. (2022). C–H bond activation and sequential addition to two different coupling partners: A versatile approach to molecular complexity. Chem. Soc. Rev. 51, 6738–6756. doi:10.1039/d2cs00012a
Davis, M. E. (2016). Glioblastoma: overview of disease and treatment. Clin. J. Oncol. Nurs. 20 (5), S2–S8. doi:10.1188/16.CJON.S1.2-8
Doan, P., Musa, A., Murugesan, A., Sipilä, V., Candeias, N. R., Emmert-Streib, F., et al. (2020). Glioblastoma multiforme stem cell cycle arrest by alkylaminophenol through the modulation of EGFR and CSC signaling pathways. Cells 9 (3), 681. doi:10.3390/cells9030681
Evans, D. A. (2014). History of the harvard ChemDraw project. Angew. Chem. Int. Ed. Engl. 53 (42), 11140–11145. doi:10.1002/anie.201405820
Froimowitz, M. (1993). HyperChem: A software package for computational chemistry and molecular modeling. Biotechniques 14 (6), 1010–1013.
Fukami, T., and Yokoi, T. (2012). The emerging role of human esterases. Drug metabolism Pharmacokinet. 27 (5), 466–477. doi:10.2133/dmpk.dmpk-12-rv-042
Gharagheizi, F., Ilani-Kashkouli, P., Farahani, N., and Mohammadi, A. H. (2012). Gene expression programming strategy for estimation of flash point temperature of non-electrolyte organic compounds. Fluid Phase Equilibria 329, 71–77. doi:10.1016/j.fluid.2012.05.015
Gilli, P., Bertolasi, V., Pretto, L., Lyčka, A., and Gilli, G. (2002). The nature of solid-state N-H triplebondO/O-H triplebond N tautomeric competition in resonant systems. Intramolecular proton transfer in low-barrier hydrogen bonds formed by the triplebond O=C-C=N-NH triple bond --> <-- triplebond HO-C=C-N=N triplebond Ketohydrazone-Azoenol system. A variable-temperature X-ray crystallographic and DFT computational study. J. Am. Chem. Soc. 124 (45), 13554–13567. doi:10.1021/ja020589x
Hadni, H., and Elhallaoui, M. (2020). 2D and 3D-QSAR, molecular docking and ADMET properties in silico studies of azaaurones as antimalarial agents. New J. Chem. 44 (16), 6553–6565. doi:10.1039/c9nj05767f
Hamlin, T. A., Swart, M., and Matthias Bickelhaupt, F. (2018). Nucleophilic substitution (SN2): dependence on nucleophile, leaving group, central atom, substituents, and solvent. ChemPhysChem 19 (11), 1315–1330. doi:10.1002/cphc.201701363
Hofheinz, R. D., Al-Batran, S. E., Hochhaus, A., Jager, E., Reichardt, V. L., Fritsch, H., et al. (2010). An open-label, phase I study of the polo-like kinase-1 inhibitor, BI 2536, in patients with advanced solid tumors. Clin. Cancer Res. 16 (18), 4666–4674. doi:10.1158/1078-0432.CCR-10-0318
Jackson, C. M., Choi, J., and Lim, M. (2019). Mechanisms of immunotherapy resistance: lessons from glioblastoma. Nat. Immunol. 20 (9), 1100–1109. doi:10.1038/s41590-019-0433-y
Janicka, M., and Śliwińska, A. (2022). Quantitative retention (Structure)-Activity relationships in predicting the pharmaceutical and toxic properties of potential pesticides. Molecules 27 (11), 3599. doi:10.3390/molecules27113599
Katritzky, A. R., Perumal, S., Petrukhin, R., and Kleinpeter, E. (2001). Codessa-based theoretical QSPR model for hydantoin HPLC-RT lipophilicities. J. Chem. Inf. Comput. Sci. 41 (3), 569–574. doi:10.1021/ci000099t
Kaydani, H., Ali, M., and Eftekhari, M. (2014). Permeability estimation in heterogeneous oil reservoirs by multi-gene genetic programming algorithm. J. Petroleum Sci. Eng. 123, 201–206. doi:10.1016/j.petrol.2014.07.035
Kim, S.-B., Dent, R., Seock-Ah, I., Espié, M., Blau, S., AntoinetteTan, R., et al. (2017). Ipatasertib plus paclitaxel versus placebo plus paclitaxel as first-line therapy for metastatic triple-negative breast cancer (LOTUS): A multicentre, randomised, double-blind, placebo-controlled, phase 2 trial. Lancet Oncol. 18 (10), 1360–1372. doi:10.1016/S1470-2045(17)30450-3
Li, X., Ye, L., Wang, X., Wang, X., Liu, H., Qian, X., et al. (2012). Molecular docking, molecular dynamics simulation, and structure-based 3D-QSAR studies on estrogenic activity of hydroxylated polychlorinated biphenyls. Sci. Total Environ. 441, 230–238. doi:10.1016/j.scitotenv.2012.08.072
Li, Z., Mei, S., Liu, J., Huang, J., Yue, H., Ge, T., et al. (2023). Design, synthesis, and biological evaluation of novel dihydropteridone derivatives possessing oxadiazoles moiety as potent inhibitors of PLK1. Eur. J. Med. Chem. 251, 115242. doi:10.1016/j.ejmech.2023.115242
Robins Lori, I., Emily, J. F., and Marlier, J. F. (2015). Mechanistic investigations of the hydrolysis of amides, oxoesters and thioesters via kinetic isotope effects and positional isotope exchange. Biochimica Biophysica Acta (BBA)-Proteins Proteomics 1854 (11), 1756–1767. doi:10.1016/j.bbapap.2014.12.016
Mao, Y., Li, Y., Ming, H., Zhang, S., and Ai, C. (2012). Docking, molecular dynamics and quantitative structure-activity relationship studies for HEPTs and DABOs as HIV-1 reverse transcriptase inhibitors. J. Mol. Model. 18, 2185–2198. doi:10.1007/s00894-011-1236-8
Márquez, J., Alonso, F. J., JoséMatés, M., Segura, J. A., Martín-Rufián, M., and Campos-Sandoval, J. A. (2017). Glutamine addiction in gliomas. Neurochem. Res. 42, 1735–1746. doi:10.1007/s11064-017-2212-1
Martin, J. K., Sheehan, J. P., Bratton, B. P., Moore, G. M., Mateus, A., Li, S. H., et al. (2020). A dual-mechanism antibiotic kills gram-negative bacteria and avoids drug resistance. Cell 181 (7), 1518–1532. e14. doi:10.1016/j.cell.2020.05.005
Mouchlis, V. D., Melagraki, G., Mavromoustakos, T., George, K., and Afantitis, A. (2012). Molecular modeling on pyrimidine-urea inhibitors of TNF-α production: an integrated approach using a combination of molecular docking, classification techniques, and 3d-qsar comsia. J. Chem. Inf. Model. 52 (3), 711–723. doi:10.1021/ci200579f
Patel, P. D., Patel, M. R., Kaushik-Basu, N., and Talele, T. T. (2008). 3D QSAR and molecular docking studies of benzimidazole derivatives as hepatitis C virus NS5B polymerase inhibitors. J. Chem. Inf. Model. 48 (1), 42–55. doi:10.1021/ci700266z
Pratim Roy, P., Paul, S., Mitra, I., and Roy, K. (2009). On two novel parameters for validation of predictive QSAR models. Molecules 14 (5), 1660–1701. doi:10.3390/molecules14051660
Roy, K., and Mitra, I. (2012). On the use of the metric rm2 as an effective tool for validation of QSAR models in computational drug design and predictive toxicology. Mini Rev. Med. Chem. 12 (6), 491–504. doi:10.2174/138955712800493861
Rücker, C., Rücker, G., and Meringer, M. (2007). y-Randomization and its variants in QSPR/QSAR. J. Chem. Inf. Model. 47 (6), 2345–2357. doi:10.1021/ci700157b
Schiff, D., Van den Bent, M., Vogelbaum, M. A., Wick, W., Miller, C. R., Martin, T., et al. (2019). Recent developments and future directions in adult lower-grade gliomas: society for neuro-oncology (sno) and european association of neuro-oncology (eano) consensus. Neuro-oncology 21 (7), 837–853. doi:10.1093/neuonc/noz033
Sebaugh, J. L. (2011). Guidelines for accurate EC50/IC50 estimation. Pharm. Stat. 10 (2), 128–134. doi:10.1002/pst.426
Shah, P., and Westwell, A. D. (2007). The role of fluorine in medicinal chemistry. J. Enzyme Inhibition Med. Chem. 22 (5), 527–540. doi:10.1080/14756360701425014
Silakari, P., Devi Shrivastava, S., Silakari, G., Rambabu, G., Srivastava, S., Kumar Shrivastava, S., et al. Dharm Veer Kohli (2008). QSAR analysis of 1,3-diaryl-4,5,6,7-tetrahydro-2H-isoindole derivatives as selective COX-2 inhibitors. Eur. J. Med. Chem. 43 (7), 1559–1569. doi:10.1016/j.ejmech.2007.09.028
Tang, B., Zhao, J., Xu, J. F., and Zhang, X. (2020). Tuning the stability of organic radicals: from covalent approaches to non-covalent approaches. Chem. Sci. 11 (5), 1192–1204. doi:10.1039/c9sc06143f
Teodorescu, L., and Sherwood, D. (2008). High energy physics event selection with gene expression programming. Comput. Phys. Commun. 178 (6), 409–419. doi:10.1016/j.cpc.2007.10.003
Wang, Y., and Jiang, T. (2013). Understanding high grade glioma: molecular mechanism, therapy and comprehensive management. Cancer Lett. 331 (2), 139–146. doi:10.1016/j.canlet.2012.12.024
Wu, W., Klockow, J. L., Zhang, M., Lafortune, F., Chang, E., Jin, L., et al. (2021). Glioblastoma multiforme (GBM): an overview of current therapies and mechanisms of resistance. Pharmacol. Res. 171, 105780. doi:10.1016/j.phrs.2021.105780
Yan, W., Lin, G., Zhang, R., Liang, Z., and Wu, W. (2020). Studies on the bioactivities and molecular mechanism of antioxidant peptides by 3D-QSAR, in vitro evaluation and molecular dynamic simulations. Food & Funct. 11 (4), 3043–3052. doi:10.1039/c9fo03018b
Yang, Y., Jin, Q., Liu, H., and Yao, X. (2011). Molecular dynamics simulation, free energy calculation and structure-based 3D-QSAR studies of B-RAF kinase inhibitors. J. Chem. Inf. Model. 51 (3), 680–692. doi:10.1021/ci100427j
Yu, Z., Li, X., Ge, C., Si, H., Cui, L., Gao, H., et al. (2015). 3D-QSAR modeling and molecular docking study on Mer kinase inhibitors of pyridine-substituted pyrimidines. Mol. Divers. 19, 135–147. doi:10.1007/s11030-014-9556-0
Zhao, M., van Straten, D., Broekman, M. L. D., Preat, V., and Schiffelers, R. M. (2020). Nanocarrier-based drug combination therapy for glioblastoma. Theranostics 10 (3), 1355–1372. doi:10.7150/thno.38147
Keywords: glioblastoma, drug design, dihydropteridone derivatives, QSAR, molecule docking
Citation: Pan M, Cheng L, Wang Y, Lyu C, Hou C and Zhang Q (2023) Exploration of 2D and 3D-QSAR analysis and docking studies for novel dihydropteridone derivatives as promising therapeutic agents targeting glioblastoma. Front. Pharmacol. 14:1249041. doi: 10.3389/fphar.2023.1249041
Received: 28 June 2023; Accepted: 21 August 2023;
Published: 31 August 2023.
Edited by:
Wenying He, Hainan Normal University, ChinaReviewed by:
Yuzhen Niu, Shandong University of Technology, ChinaCopyright © 2023 Pan, Cheng, Wang, Lyu, Hou and Zhang. This is an open-access article distributed under the terms of the Creative Commons Attribution License (CC BY). The use, distribution or reproduction in other forums is permitted, provided the original author(s) and the copyright owner(s) are credited and that the original publication in this journal is cited, in accordance with accepted academic practice. No use, distribution or reproduction is permitted which does not comply with these terms.
*Correspondence: Chao Hou, MTEyMzMyODA3NUBxcS5jb20=; Qiming Zhang, emhhbmdxaW1pbmc5MTdAMTYzLmNvbQ==
†These authors share first authorship
Disclaimer: All claims expressed in this article are solely those of the authors and do not necessarily represent those of their affiliated organizations, or those of the publisher, the editors and the reviewers. Any product that may be evaluated in this article or claim that may be made by its manufacturer is not guaranteed or endorsed by the publisher.
Research integrity at Frontiers
Learn more about the work of our research integrity team to safeguard the quality of each article we publish.