 Jasmine Phénix1,2†
 Jonathan Côté3,4†
 Denis Dieme3,4Sherilyn J. Recinto1,2,5Felix Oestereich1,2,5
 Sasen Efrem1,2
 Sami Haddad3,4*Michèle Bouchard3,4*
 Lisa Marie Munter1,2,6*
- 1Department of Pharmacology and Therapeutics, McGill University, Montreal, QC, Canada
- 2Cell Information Systems Group, Montreal, QC, Canada
- 3Department of Environmental and Occupational Health, School of Public Health, Université de Montréal, Montreal, QC, Canada
- 4Public Health Research Center (CReSP), Université de Montréal, Montreal, QC, Canada
- 5Integrated Program in Neuroscience, McGill University, Montreal, QC, Canada
- 6Centre de Recherche en Biologie Structurale (CRBS), Montreal, QC, Canada
High levels of plasma cholesterol, especially high levels of low-density lipoprotein cholesterol (LDL-C), have been associated with an increased risk of Alzheimer’s disease. The cholesteryl ester transfer protein (CETP) in plasma distributes cholesteryl esters between lipoproteins and increases LDL-C in plasma. Epidemiologically, decreased CETP activity has been associated with sustained cognitive performance during aging, longevity, and a lower risk of Alzheimer’s disease. Thus, pharmacological CETP inhibitors could be repurposed for the treatment of Alzheimer’s disease as they are safe and effective at lowering CETP activity and LDL-C. Although CETP is mostly expressed by the liver and secreted into the bloodstream, it is also expressed by astrocytes in the brain. Therefore, it is important to determine whether CETP inhibitors can enter the brain. Here, we describe the pharmacokinetic parameters of the CETP inhibitor evacetrapib in the plasma, liver, and brain tissues of CETP transgenic mice. We show that evacetrapib crosses the blood–brain barrier and is detectable in brain tissue 0.5 h after a 40 mg/kg i.v. injection in a non-linear function. We conclude that evacetrapib may prove to be a good candidate to treat CETP-mediated cholesterol dysregulation in Alzheimer’s disease.
Introduction
Cholesterol plays major roles in diverse processes essential to life and is ubiquitously found in membranes and organelles in mammalian cells (Maxfield and van Meer, 2010; Paschkowsky et al., 2018). Cholesterol acts as a signal transducer for many signaling pathways and is the precursor for steroid hormones (Porter et al., 1996; Burke et al., 1999; Cooper et al., 2003; Payne and Hales, 2004). Though cholesterol is necessary for proper development and maintaining homeostasis, dysregulated cholesterol metabolism has also been shown to be associated with a plethora of pathologies from cardiovascular diseases to neurodegenerative diseases, including Parkinson’s disease, amyotrophic lateral sclerosis, and Alzheimer’s disease (Whitmer et al., 2005; Huang et al., 2019; Iwagami et al., 2021; Godoy-Corchuelo et al., 2022). Interestingly, higher levels of plasma cholesterol and low-density lipoprotein cholesterol (LDL-C) were also associated with an increased risk of developing Alzheimer’s disease (Whitmer et al., 2005; Solomon et al., 2009; Liu et al., 2020). However, the molecular mechanisms by which peripheral LDL-C may increase the risk for Alzheimer’s disease remain unclear, especially as LDL particles do not cross the blood–brain barrier (Bjorkhem and Meaney, 2004).
The cholesteryl ester transfer protein (CETP) is a plasma glycoprotein mostly secreted by the liver, spleen, adipose tissues, and brain (Tall, 1995). Its main function is to mediate the transport of cholesteryl esters and triglycerides between plasma lipoproteins. The CETP transporter works according to a concentration gradient leading to a net flux of cholesteryl esters from high-density lipoproteins (HDL) particles into LDL and very low-density lipoproteins (VLDL), increasing the total LDL-C and VLDL-C levels (Barter and Rye, 1994). Thus, CETP activity could increase the risk of AD by raising LDL-C in the periphery. CETP inhibitors were developed as a new class of non-statin cholesterol-lowering drugs to increase HDL-C and decrease LDL-C in plasma, such as dalcetrapib (Hoffman-La Roche) (Ray et al., 2014), anacetrapib (Merck) (Gotto et al., 2014), evacetrapib (Eli Lilly) (Nicholls et al., 2017), or obicetrapib (New Amsterdam Pharma) (Tall and Rader, 2018; Nicholls et al., 2022). These new-generation CETP inhibitors were proven to be safe and effective in lowering LDL-C while raising HDL-C to varying extents. However, they failed to reduce cardiovascular events over already existing drugs and thus were not approved for the treatment of cardiovascular disease (Tall and Rader, 2018; Nelson et al., 2022). Nevertheless, CETP inhibitors may be repurposed in other conditions, such as Alzheimer’s disease.
CETP forms a promising drug target as individuals with homozygous CETP deficiency have been described as overall healthy with potentially longer life span (Brown et al., 1989; Inazu et al., 1990). Remarkably, the CETP polymorphism rs5882 (I405V) was associated with exceptional longevity and healthy aging in centenarians (Barzilai et al., 2003; Barzilai et al., 2006). This CETP variant and other variants identified lead to either decreased CETP expression or reduced CETP activity and associate with good cognitive performance and decreased risk of developing Alzheimer’s disease (Barzilai et al., 2003; Sun et al., 2013; Lythgoe et al., 2015). Here, it is important to note the role of apolipoprotein E isoform 4 (APOE4), a protein important for the cellular uptake of LDL particles. APOE4 is the greatest genetic risk factor for Alzheimer’s disease, increasing the risk by 3–15-fold in a dose-dependent manner (Poirier et al., 1993; Neu et al., 2017; Bellenguez et al., 2022). CETP variants with lower CETP activity have the potential to decrease Alzheimer’s disease risk, specifically in subjects carrying the APOE4 allele (Rodriguez et al., 2006; Chen et al., 2008; Oliveira and de Faria, 2011; Sundermann et al., 2016). Thus, pharmacological CETP inhibition may have the capacity to abolish the increased Alzheimer’s risk conferred by APOE4, again indicating that CETP is a valuable drug target with promising disease-modifying outcomes. Therefore, the use of CETP inhibitors may positively impact cognitive performance, promote longevity, and decrease the risk of Alzheimer’s disease.
To evaluate the potential of CETP inhibitors for Alzheimer’s disease prevention, preclinical modeling in mice is necessary. Of note, mice do not express CETP or any orthologous genes, and as a result, mice have naturally very low LDL levels, thereby limiting the use of such rodents in investigating LDL-related diseases. Therefore, transgenic mice expressing the human CETP gene (hCETPtg) were developed in 1991 and have since been widely used in cardiovascular disease research (Agellon et al., 1991; Jiang et al., 1992). hCETPtg mice have demonstrated a similar CETP expression pattern to humans, and most importantly, on a high-cholesterol diet, they show elevated LDL plasma levels comparable to those of healthy individuals (Steenbergen et al., 2010). In humans, CETP is mostly expressed in the liver and secreted to the plasma but has also been found in the cerebrospinal fluid (CSF) at 12% of the concentration found in the plasma, as well as in the brain (Albers et al., 1992; Yamada et al., 1995). Indeed, our laboratory previously confirmed CETP mRNA expression in astrocytes enriched from hCETPtg mouse brains (Oestereich et al., 2022). The functions carried out by cerebral CETP remain unclear, as only HDL-like particles are formed in the brain, and there are no LDL-like particles. Thus, the question as to whether CETP of the brain or the periphery modulates the risk of Alzheimer’s disease prevails. To first assess if the potent CETP inhibitor evacetrapib can reach brain tissue, we herein characterized the pharmacokinetics of evacetrapib in hCETPtg mice.
Materials and methods
Chemicals
Evacetrapib was purchased from AdooQ Biosciences (United States). All other reagents were commercially available and were pure or liquid chromatography/mass spectrometry (LC/MS) grade.
Animal acclimatation and housing
hCETPtg mice with a C57BL/6J background were chosen as the experimental model (Jackson Laboratory). Mice were housed in the Goodman Cancer animal facility (12 h light-dark cycle, 20°C–26°C, and 40%–60% humidity) in polysulfone cages of two to five mice per cage. Husbandry was heterozygous, and mice were genotyped using Transnetyx™ at 3 weeks of age. The protocol was approved by the Animal Compliance Office at McGill University (ACO approval# 2013-7359).
Animal exposure and sample collection
The experiment was performed in conformity with the OECD Guidelines 417 (OECD, 2010). Male hCETPtg mice were chosen for the pharmacokinetic analysis. Mice were fed Teklad Global Diets #2018 from Envigo, Canada, for 8 weeks starting from birth, followed by a diet change of modified low-fat RD Western diet to match TD.08485 with 1% cholesterol from research diets #D16121201 for a duration of 3–4 weeks. Throughout that period, tap water was provided ad libitum. Initially, evacetrapib was solubilized in 20% of the final solution volume of Kolliphor® EL (pH range 6.0–8.0, cat# C5135) by alternating between 5 min intervals using an ultrasonic water bath at 4°C and a hot water bath at 50°C until complete dissolution. Then, 80% of the final volume was added (isotonic glucose solution 50 g/L glucose containing D-(+)-glucose Sigma cat# G7021 in MilliQ water, sterile filtered).
CETP inhibitor evacetrapib was administered through tail vein injection at doses of 40 mg/kg body weight (BW) or 120 mg/kg BW. Mice weighed 28.42 ± 3.16 g on the day of injection. They were randomly divided into two groups: 24 mice received a dose of 40 mg/kg BW of evacetrapib and the other 24 received a dose of 120 mg/kg BW. Mice from both groups were euthanized at 0, 0.5, 2, 6, 12, and 24 h after injection. Mice euthanized at later time points had continued access to food and water until the end of the experiment. Blood was collected (300–500 µL) at euthanasia for each mouse by cardiac puncture. Blood plasma was extracted using 10 µL of 1 M EDTA pH 8.0 solution in MilliQ water. Brain and liver tissues were collected immediately after euthanasia, rinsed in 0.9% NaCl solution, and snap-frozen in liquid nitrogen. Samples were stored at −80°C until analysis.
UHPLC-MS-qTOF analysis
Sample preparation and digestion for evacetrapib analysis were performed using UHPLC-MS-qTOF. Working solutions from a stock of evacetrapib were prepared at concentrations of 10 μmol, 100 nmol, 1 nmol, 500 pmol, and 125 pmol per ml of methanol. Working solutions of anacetrapib used as an internal standard were prepared at concentrations of 10 μmol, 100 nmol, and 1 nmol per ml from a stock solution.
Brain and liver samples were homogenized using a polytron supplemented with a carbonate buffer at pH 9.8. The volume was adjusted such that each sample reached a final concentration of 100 mg/ml of buffer. A volume of 0.5 ml of homogenate was transferred to a Pyrex tube and enriched with 100 µL of 1 nmol/ml anacetrapib solution used as an internal standard. Then, samples were extracted twice using 4 ml of saturated ethyl acetate. For each extraction, samples were shaken for 30 min using a lateral shaker, followed by a centrifugation round (20 min, 3,000 rpm, 4°C). Organic phases were collected, combined, and then evaporated until dry under a nitrogen stream in a rotating bath at 40°C. The residues were resuspended in methanol. Samples were vortexed until no residues were left. Resuspended residues for both the brain and liver were then centrifuged (20 min, 3,000 rpm, 4°C). The supernatant was recovered, transferred into new vials, and injected into UHPLC-MS-qTOF. For the plasma measurement, 20 µL of plasma was enriched with 100 µL of 1 nmol/ml anacetrapib solution in a microtube. Evacetrapib was extracted using two steps of ethanol wash (200 µL) followed by an incubation time (30 min, 22°C) and centrifugation (5 min, 16,000 g, 10°C). Samples were dried under a gentle nitrogen stream to separate the liquid phase from the solid phase. The residues were subsequently dissolved in methanol, vortexed until no residues were left, and centrifuged (20 min, 3,000 rpm, 4°C). The supernatant was recovered, transferred into new vials, and injected into UHPLC-MS-qTOF.
The UHPLC-MS-qTOF system consisted of an Agilent model 1290-LC binary gradient UHPLC system (Agilent, Mississauga, Canada) connected to an Agilent model 1290 autosampler and thermostated column compartment (Agilent, Mississauga, Canada) and coupled to a quadrupole time-of-flight mass spectrometer with a Dual Jet Stream Electrospray Ionization (Dual-AJS ESI) source (Agilent Technologies, Mississauga, Ontario, Canada). The AJS ESI interface was operated in positive ion mode. The column used was Agilent Zorbax Eclipse plus C18 (2.1 × 50 mm; 1.8 µm). The precolumn used was Agilent Fast Guard Zorbax Eclipse plus C18 (2.1 × 5 mm; 1.8 µm). HPLC elution solutions were H2O eluant 0.01% acidified (1 L ultra-pure water + 100 µL of HPLC-grade acetic acid) and methanol eluant 0.01% acidified (1 L MS-grade methanol +100 µL HPLC-grade acetic acid). Tuning of the instrument was performed once a month, and calibration was performed once a week to accurately analyze the mass ratio m/z < 1,700.
The exact mass of evacetrapib was determined in an MS mode using the following ToF conditions: sheath gas (N2) temperature at 365°C and gas flow rate of 10 L/min, nebulizer gas pressure of 50 psi, drying gas temperature (N2) at 200°C and flow rate of 12 L/min, capillary voltage (Vcap) at 3,000 V, nozzle voltage at 1,000 V, fragmentor at 75 V, skimmer at 65 V, and octopole at 750 V. The precursor ion [M + H]+ evacetrapib analyzed was m/z 639.28797. Identification and quantification were performed in an extracted ion chromatogram (EIC) mode.
Quantification was performed using a seven-point calibration curve with the internal standard correction prepared in the brain, liver, or plasma, respectively. These curves were established by plotting the response factors as a function of the concentration levels over a maximum range of 6.25–200 pmol/ml. The response factors corresponded to the peak-area ratios of the evacetrapib ion to the anacetrapib internal standard ion. The limit of detection (LOD) (corresponding to three times of standard deviations of response ratio from replicate analysis of a blank) was 30.3 pmol/g of the brain, 11.5 pmol/g of the liver, and 83 pmol/ml of plasma. Repeatability from replicate analysis of samples under the same calibration and tuning conditions (blank samples spiked with evacetrapib standards at two levels) was below 5%. The recovery percentages determined in the different matrices with two levels of spikes were between 95% and 108%.
Data analysis and determination of main kinetic parameters from different organ time courses
The time courses of evacetrapib in the blood, brain, and liver were established following injections of 40 and 120 mg/kg BW in mice (expressed as the average concentration in nmol/ml or nmol/g over time). The parameters used to determine the fit are as follows: A1e(b1*t) + A2e(b2*t), where A1 and A2 are the different intercepts within the function, b1 and b2 are the different slopes within the function, and t is the specific time for which the parameter is calculated. The concentration–time course data for each tissue were independently fitted with Microsoft Excel using the solver function set on the generalized reduced gradient (GRG) non-linear method. The slope and intercepts were determined using the parameters generated by the fit. The elimination rate constant ki and the half-life (t1/2) for each tissue at both concentrations were calculated using the following equations:
Pharmacokinetic parameters such as the area under the plasma concentration–time curve (AUCIV), the area under the first moment of the plasma concentration–time curve from time zero to infinity (AUMCIV), mean residence time (MRT), apparent total body clearance of the drug from plasma (CL), and apparent volume of distribution at a steady state (Vss) were determined using the following equations:
Mice were not perfused at euthanasia to allow the plasma, brain, and liver to be collected accurately at time point 0 and uniformly across all time points. Thus, residual blood in vessels of the brain may have left residual traces of evacetrapib in brain samples. Residual plasma volume in mouse brains was determined to be, on average, 8 µL, according to Kaliss and Pressman (1950). The quantity of evacetrapib in a volume of 8 µL of plasma was calculated using the average concentration in the plasma for each time point (in nmol/ml) multiplied by the volume. The literature shows that the conversion ratio of a gram of brain to a milliliter of brain is 1.04 ml for each gram (Leithner et al., 2010). The average concentration (in nmol/ml) was calculated for each time point using the average concentration of evacetrapib (in nmol/g) in the brain and the average brain volume per gram. From the calculated average concentration of evacetrapib in the brain (in nmol/ml), the quantity of evacetrapib (in nmol) in the brain for each time point was determined. The average concentration of evacetrapib in the brain was corrected for residual blood (in nmol/ml and converted back to nmol/g) by subtracting the amount of previously calculated average concentration of evacetrapib in the residual blood (in nmol/ml) from the average amount of evacetrapib in the brain for each time point (in nmol/ml).
Following the correction for the evacetrapib amount in the residual blood in the brain samples—using the area under the curve (AUC in nmol × h/ml) in the brain divided by the area under the curve in the plasma—the plasma-to-brain-tissue penetration ratio was calculated to determine the extent to which evacetrapib is detected in the brain depending on the initial concentration. The tissue penetration ratio allows for approximating the amount of evacetrapib accumulated in the brain and whether it is consistent with the dosage given to mice. The equation used to calculate this parameter is as follows:
Distribution to the brain
A semi-physiological-based pharmacokinetic (PBPK) model was developed to obtain more mechanistic information on the distribution of evacetrapib in the brain. First, a two-compartmental model (i.e., a plasma and a peripheral compartment) with a first-order elimination rate was fitted to describe the kinetics of the compound in plasma (Mukherjee, 2022) (Figure 1). Second, a third compartment was added and connected to the plasma compartment (Figure 1). The parameters related to the brain compartment are presented in Table 1. The brain compartment was subdivided into vascular and tissue sub-compartments, with mass balance differential equations describing a distribution in the tissue that can be limited by diffusion as follows (Shen, 2010):
where ABrT is the amount in the brain tissue, ABrP is the amount in the brain plasma, CBrP the concentration in the brain plasma, CBrT the concentration in the brain tissue subcompartment, CBr the concentration in the brain, Cp the plasma concentration, PA the permeability area product, PBr the brain-to-plasma partition coefficient, PF the plasma fraction of the blood, VBrVF the vascular volume fraction of the brain, VBr the volume of the brain, and QBr plasma flow to the brain.
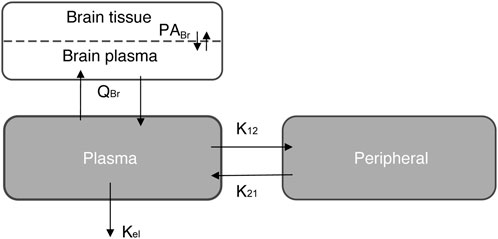
FIGURE 1. Schematic representation of the three-compartment model simulation for the semi-PBPK model. See also Table 1.
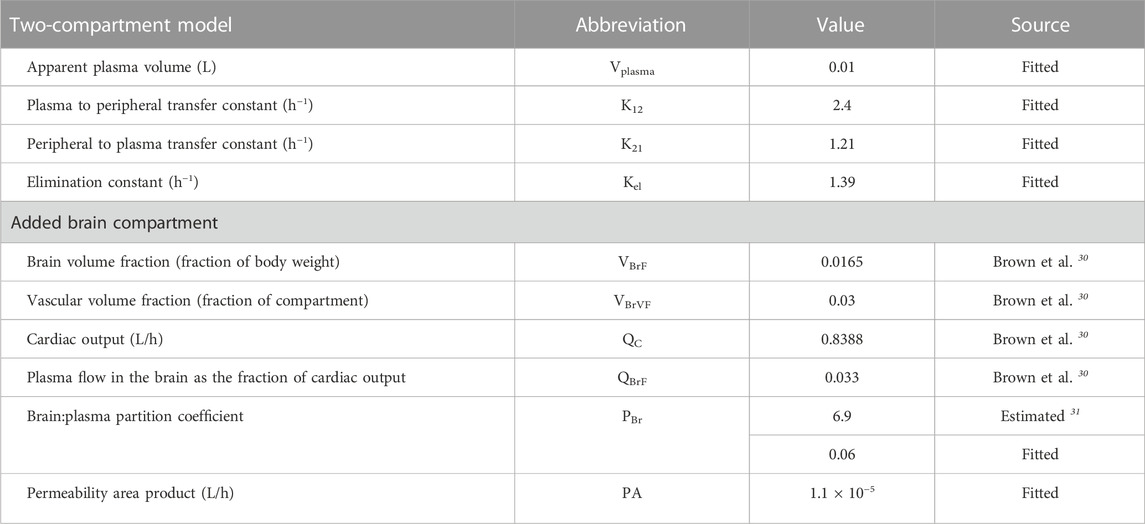
TABLE 1. Parameter values for the semi-physiologically based pharmacokinetic model to simulate accumulation in the brain.
Several scenarios were tested using this semi-PBPK model and brain concentration data to determine the mechanisms that best explain accumulation in the brain: 1) no permeability (i.e., PA = 0 L/h); 2) a perfusion-limited distribution (PA > 1,000,000 L/h) using the predicted PBr (Poulin and Haddad, 2011); 3) a perfusion-limited distribution with a low PBr (fitted); 4) a diffusion-limited distribution (fitted PA) using the predicted PBr; and 5) diffusion-limited distribution (fitted PA) and low PBr (fitted).
Results
Evacetrapib was shown to be tolerated up to 600 mg/kg BW/day in rats by oral gavage, with an oral absorption fraction of 25% (Takubo et al., 2014; Simic et al., 2017). Therefore, we chose a dose of 120 mg/kg BW as the highest intravenous dose and a threefold lower dose of 40 mg/kg BW for this pharmacokinetic study. Intravenous injections were chosen as the route of administration to bypass the barriers of absorption and focus on the distribution and elimination of the drug. Four male mice per time point were euthanized, and brain, blood, and liver samples were collected according to the OECD guidelines 417 (OECD, 2010).
Plasma elimination of evacetrapib
Peak plasma values were observed at the first sampling time point t = 0 h, followed by a rapid distribution phase to different tissues and then a second slower elimination phase from the plasma (Figure 2). Pharmacokinetic parameters were determined based on these blood time courses, as described in Table 2. The drug clearance (CL) from the blood of 9.4 ml/h at the 40 mg/kg BW dose was much faster than that of 3.3 ml/h at the 120 mg/kg BW dose. The mean residence time (MRT) of 2.0 h for the 40 mg/kg BW dose and 1.6 h for the 120 mg/kg BW dose remained similar. The steady-state volume of distribution (Vss) of 18.5 ml was about threefold greater at the 40 mg/kg BW dose compared to 5.3 ml for the 120 mg/kg BW dose.
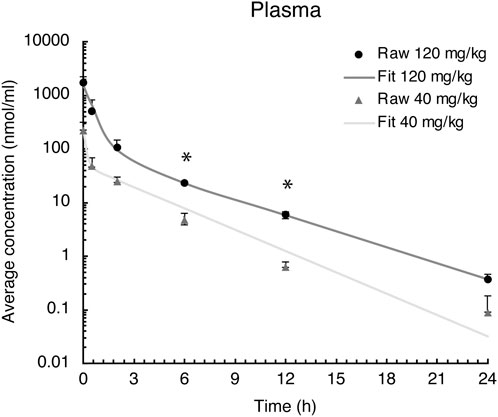
FIGURE 2. Evacetrapib concentration in plasma after a single intravenous injection of evacetrapib at six time points over a 24-h course. Symbols represent means ± SEM, n = 4 per time point. * depicts significant differences (p < 0.05) between the two doses.
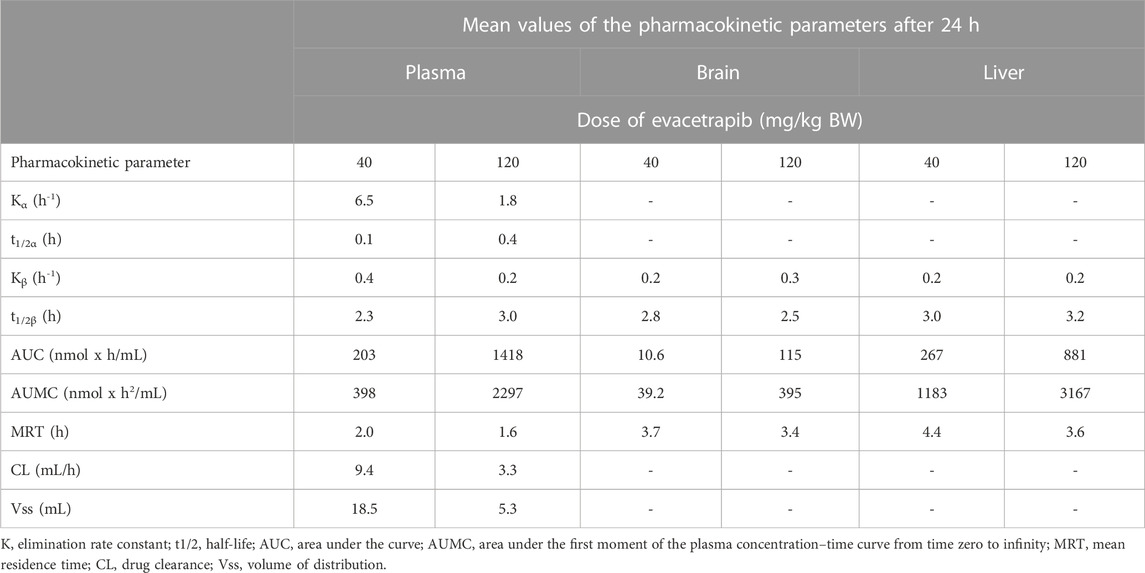
TABLE 2. Pharmacokinetic parameters of evacetrapib in plasma, liver, and brain.
Elimination of evacetrapib in the liver
The liver is the primary site for drug metabolism, responsible for the concentration, metabolism, and excretion of most drugs that pass through the body. Therefore, evacetrapib quantification was determined in this tissue. For both doses in the liver, the time courses were very similar, showing a steady decrease in evacetrapib over time (Figure 3). Pharmacokinetic parameters were determined and described in Table 2. Results show similar elimination rates of 0.2 h−1 for the 40 mg/kg BW dose and 0.3 h−1 for the 120 mg/kg BW dose, with the slopes of both curves being parallel to each other. The elimination half-lives of 2.8 h and 2.5 h observed for 40 mg/kg and 120 mg/kg BW, respectively, are of comparable value showing that both doses of evacetrapib are eliminated with the same speed. The MRT was similar for both concentrations (Table 2), though slightly higher for the 40 mg/kg BW, indicating that the pharmacokinetic parameters in the liver remain unchanged in the 40 mg/kg and 120 mg/kg BW conditions.
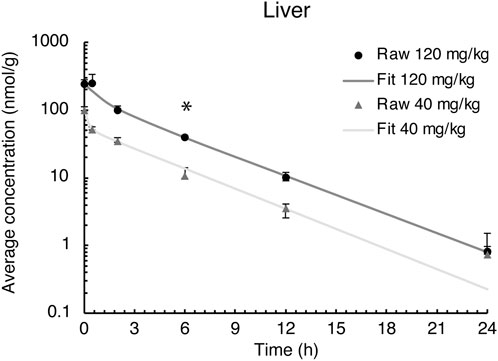
FIGURE 3. Evacetrapib concentration in the liver after a single intravenous injection of evacetrapib. Symbols represent means ± SEM, n = 4 per time point. * depicts significant differences (p < 0.05) between the two doses.
Evacetrapib pharmacokinetics in the brain
Evacetrapib concentrations were quantified in this tissue to assess whether it could enter the brain. The time course for both doses shows that evacetrapib enters the brain with a peak concentration after 0.5 h (Figure 4A). For a more accurate reading of evacetrapib concentration in the brain tissue, calculations were performed to correct for the residual blood in the brain, as shown in Table 3 and Figure 4B. For the 40 mg/kg BW dose at times 0 and 24 h, no evacetrapib was present in plasma, and thus no correction was performed. At times 0.5, 2, 6, and 12 h, the average concentration of evacetrapib in the brain corrected for residual blood was determined as 1.5, 1.0, 0.5, and 0.1 nmol/g, respectively. For the 120 mg/kg BW dose, the average concentration of evacetrapib corrected for residual blood in the brain at time 0 h was 0 nmol/g. At times 0.5, 2, 6, 12, and 24 h, the average concentration of evacetrapib corrected for residual blood in the brain was determined as 16.7, 15.3, 5.0, 1.0, and 0.02 nmol/g, respectively, in a decreasing manner. This confirms the presence of evacetrapib in the brain tissue starting 30 min after intravenous injection until 12 h after injection. As reported in Table 2, the MRT values for both evacetrapib concentrations are similar, with 3.7 h for the 40 mg/kg BW and 3.4 h for the 120 mg/kg BW doses, showing that similar proportional amounts of evacetrapib enter the brain. Comparing the time courses of evacetrapib for not-corrected (Figure 4A) and corrected (Figure 4B) brain concentrations, the elimination rate constant and half-lives remained similar, if not identical, for both doses.
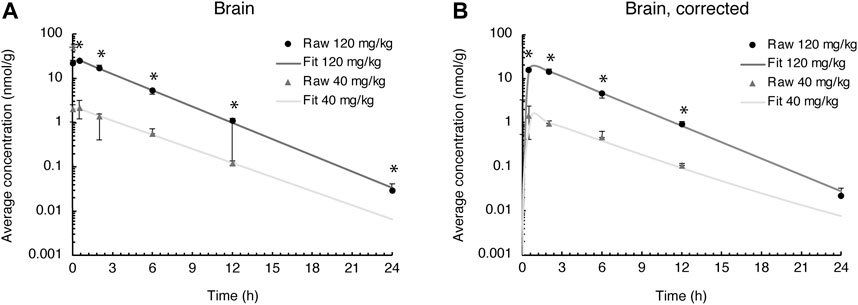
FIGURE 4. Evacetrapib concentration in the brain. (A) Experimental values not corrected for residual blood. (B) Experimental values corrected for residual blood. Symbols represent means ± SEM, n = 4 per time point. * depicts significant differences (p < 0.05) between the two doses.
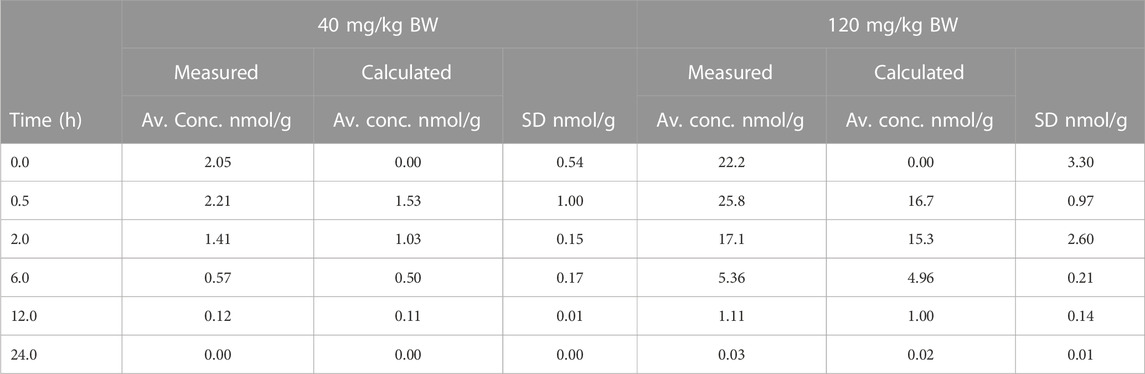
TABLE 3. Average evacetrapib concentration determined in the brain over a 24-h period after a 40 mg/kg BW or 120 mg/kg BW i.v. injection in hCETPtg mice comparing residual-blood correction to no correction.
Tissue penetration ratio in the brain
The tissue penetration ratio calculated using the mean AUC (nmol × h/g) of the brain tissue divided by the mean AUC (nmol × h/g) of plasma and accounting for residual blood is described in Table 3, yielding a ratio of 0.08 for the 40 mg/kg BW and 0.13 for the 120 mg/kg BW doses. Thus, the tissue penetration ratio shows a 1.63-fold increase from the low to the high evacetrapib concentration.
Semi-PBPK model of evacetrapib entering the brain
We used a semi-physiological three-compartment model to simulate the in vivo data (Figure 1). The parameters for the plasma and peripheral compartments were fitted to the plasma concentration at 40 mg/kg BW (Table 1; Figure 5B) (Brown et al., 1997; Peyret et al., 2010). Then, four scenarios were simulated assuming the following: a) perfusion-limited distribution with the predicted brain-to-plasma partition coefficient (PBr), b) as in a) with a low PBr, c) diffusion-limited distribution with the predicted PBr, and d) as in c) with low PBr, against the brain concentration data corrected for residual blood as explained in the Methods section. When assuming perfusion-limited distribution, the model could not simulate the observed data (Figure 5A), even when we adjusted for PBr. However, simulating diffusion limitation in the brain resulted in a better fit of the simulation toward the observed brain concentrations when fitted for the permeability area product (PA) and PBr (Figure 5A, blue curve compared to black circles). Thus, we propose that evacetrapib enters the brain in a diffusion-limited manner, which could include some form of facilitated transport.
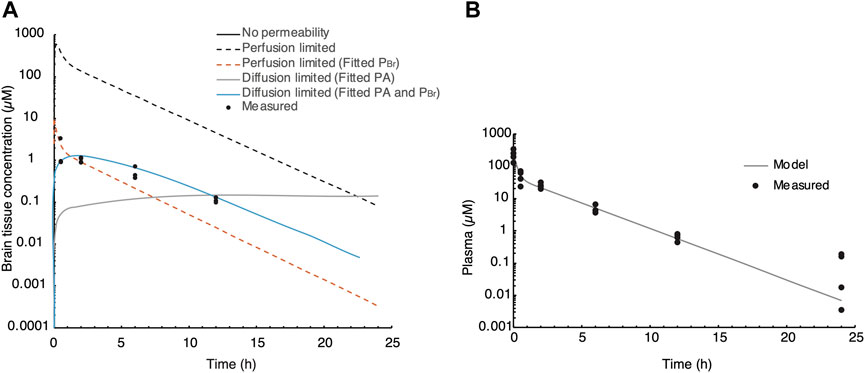
FIGURE 5. Semi-PBPK modeling of evacetrapib entering the brain. (A) Three-compartment model simulation of the plasma concentration at 40 mg/kg. Experimentally determined values are indicated by black circles. Different perfusion-limited models show different concentrations, with the best fit obtained with diffusion limitation and fitted PA and PBr. (B) Parameters for the plasma and peripheral compartments fitted to the plasma concentration at 40 mg/kg BW.
Discussion
We investigated the distribution of the CETP inhibitor evacetrapib in hCETPtg mice, and the major finding of this study is that evacetrapib does enter the mouse brain tissue. We detected evacetrapib in the brain 0.5 h after intravenous injection at 40 mg/kg BW in a non-linear function. Evacetrapib inhibits CETP in human plasma with an IC50 of 36 nM (Cao et al., 2011). We detected evacetrapib in the brain at peak (after correction for residual blood) of 1.5 μM at 40 mg/kg BW and 16.7 μM at 120 mg/kg BW dose, thus approximately 40- or 450-fold, respectively, above plasma IC50, indicating that evacetrapib administration could indeed inhibit cerebral CETP, potentially even at lower doses. Our semi-PBPK compartmental model shows that evacetrapib does not rapidly diffuse across the blood–brain barrier, indicating that the mechanism of evacetrapib distribution to the brain may rely on facilitated transport mechanisms.
Dysregulation of the cholesterol metabolism has been associated with various diseases such as atherosclerosis and Alzheimer’s disease (Vance, 2012; Liu et al., 2020). An important protein regulating the distribution of cholesteryl esters in the blood is CETP, which has been linked to Alzheimer’s disease through polymorphisms (Rodriguez et al., 2006; Lythgoe et al., 2015; Sundermann et al., 2016). Although the function of CETP has mainly been established in the periphery, cholesteryl transfer activity has also been reported in the central nervous system (CNS) and the CSF (Albers et al., 1992; Yamada et al., 1995). Although it has been suggested that plasma cholesterol does not have a direct effect on brain cholesterol levels [discussed in Bjorkhem and Meaney (2004)], whether it is the CETP activity in the CNS or the action of peripheral CETP which plays a role in dementia remains unclear. Lipoprotein particles of the brain differ from those of the periphery as LDL-like particles do not exist in the brain, but rather small HDL-like particles which are only incompletely characterized (Vitali et al., 2014). These HDL-like particles transport cholesterol from astrocytes to neurons (Ioannou et al., 2019; Borras et al., 2022; Turri et al., 2022). As CETP remodels HDL particles (Nicholls et al., 2015), a potential benefit of CETP inhibition could stem from promoted cholesterol delivery to neurons.
Unlike humans, mice do not express endogenous CETP, making hCETPtg mice a more representative animal model in terms of peripheral lipoprotein dynamics. Indeed, although wild-type mice have very low levels of endogenous LDL, hCETPtg mice have an LDL profile that is much more comparable to that of humans due to CETP activity (Steenbergen et al., 2010). We previously found that hCETPtg mice have approximately 22% higher cholesterol content in their brains compared to wild-type mice brains (Oestereich et al., 2022). The elevated cholesterol content in the brain and the periphery of hCETPtg mice could differentially affect the distribution and elimination kinetics of the very lipophilic CETP inhibitors (evacetrapib has an octanol to water partition coefficient of logP 7.56) (Small et al., 2015). Due to these fundamental physiological differences, the pharmacokinetic parameters of a CETP inhibitor should be assessed in hCETPtg mice rather than wild-type mice. Thus, hCETPtg mice present a good model for testing CETP inhibitors in the context of drug repurposing for Alzheimer’s disease. Remarkably, several proteins associated with Alzheimer’s disease are linked to cholesterol. For example, the central protein in Alzheimer’s disease, the amyloid precursor-protein (APP), contains cholesterol-binding motifs in its transmembrane sequence (Barrett et al., 2012). Further proteins encoded by gene variants identified by genome-wide associated studies carry functions related to cholesterol, including the most prominent APOE, CLU, SORL1, PICALM, BIN1, SORT1, ABCA7, and ABCA1 (Bellenguez et al., 2022). Therefore, CETP may play an indirect modifying role in Alzheimer’s disease by affecting cholesterol of the brain. Collectively, further investigations are necessary to address the potential impact of CETP inhibition in ameliorating Alzheimer’s disease symptoms.
Only another CETP inhibitor, dalcetrapib developed by Hoffman-La Roche, was shown to have the capacity to cross the blood–brain barrier of rats (Takubo et al., 2014). In comparison to our study, rats received 10 mg/kg BW dalcetrapib intravenously, which reached a twofold lower concentration in the brain after 0.5 h than 40 mg/kg BW evacetrapib in mice. Conversely, 24 h after injection, the dalcetrapib concentration was >20-fold higher than the evacetrapib concentration in mice injected with 40 mg/kg BW, indicating that although evacetrapib may enter the brain tissue faster than dalcetrapib, it has a lower capacity to accumulate and is eliminated faster than dalcetrapib. It should be noted that anacetrapib, another CETP inhibitor developed by Merck, has been shown to accumulate in adipose tissues (Krishna et al., 2017). In contrast, continuous administration of evacetrapib does not accumulate in adipose tissues (Small et al., 2015; Nurmohamed et al., 2022), avoiding unwanted storage of the drug in the body. To our knowledge, whether the CETP inhibitor evacetrapib accumulates in the brain with long-term use has not been evaluated yet. It should also be noted that the doses administered for this pharmacokinetic study in mice are higher than those tested in clinical trials in humans (Nicholls et al., 2011; Nair and Jacob, 2016), whereas lower doses will likely reach the brain at biologically relevant concentrations.
One last factor we considered in this study was the mechanism by which evacetrapib is transported into brain tissue. To that effect, toxicokinetic parameters were derived from the blood and brain time courses, which indicate that the drug possibly requires some sort of transporter to reach peripheral compartments, such as the brain, and to clear from brain tissue. The difference in the tissue penetration ratio as a function of the dose indicates that a higher concentration of evacetrapib has a greater capacity to be detected in brain tissue. A possible explanation could be that evacetrapib enters the brain faster than it is cleared out of it, leading to a buildup in brain tissue. The compartmental model developed (Shen, 2010) suggests that diffusion-limited uptake occurs in the brain and that the PBr was very low, which may indicate that evacetrapib diffuses into the brain inefficiently and would require the use of transporters. To determine which mechanisms are involved in evacetrapib distribution to the brain, a semi-PBPK model was developed (parameter values are in Table 1; Figure 5). To this end, we first aimed to determine the brain: plasma partition coefficient of evacetrapib using rapid equilibrium dialysis. Our preliminary data showed that the molecule did not appreciably diffuse across the porous membrane; only 2% of evacetrapib diffused after 24 h in the system consisting of plasma on both sides of the membrane. This may be in line with our in vivo observations considering that only a small fraction of evacetrapib crossed the blood–brain barrier. However, the slow diffusion in our in vitro model is incongruent with the concentrations of evacetrapib found in the brain 2.2 h following intravenous injections. Thus, the implication of transporters cannot be excluded.
Epidemiological studies indicated that CETP plays a disease-modifying role in Alzheimer’s disease (Barzilai et al., 2003; Rodriguez et al., 2006; Sun et al., 2013). Although the exact mechanism remains unclear, CETP activity may promote Alzheimer’s disease through modifying cholesterol content, distribution, storage, or metabolism, which could be prevented by CETP inhibitors such as evacetrapib. To set the grounds for assessing CETP inhibitors for potential drug repurposing in Alzheimer’s disease, we showed here that evacetrapib reaches brain tissue fast after intravenous injection in hCETPtg mice. Furthermore, we demonstrate that evacetrapib enters brain tissue, possibly through the actions of a transporter or other facilitating mechanism. Thus, CETP activity in the brain could be pharmacologically reversed, which may carry the potential to delay or ameliorate Alzheimer’s disease.
Data availability statement
The original contributions presented in the study are included in the article. Further inquiries can be directed to the corresponding authors.
Ethics statement
The animal study was reviewed and approved by the Animal Compliance Office at McGill University (ACO approval# 2013-7359).
Author contributions
JP drafted the manuscript, made the figures, bred mice, and collected samples after injections. JC modeled the pharmacokinetic parameters. JP and JC performed the pharmacokinetic analysis. DD conducted and analyzed evacetrapib detection by mass spectrometry. SR, SE, and FO bred mice and collected mouse samples after injections. SH designed and completed the semi-PBPK model. SH, MB, and LM designed, coordinated, and supervised the study. All authors contributed to the article and approved the submitted version.
Funding
This work was funded by the Weston Brain Institute award RR172187, Canadian Institute of Health Research CIHR-PJT-162302 and CIHR-PJT-175306, and Alzheimer Society of Canada regular Research Grant 17-02, The Alzheimer's Association US AARG-21-852152 and was supported by the Fonds de Recherche du Québec—Santé FRQS research allocation FRQ-S 36571, the Canada Foundation of Innovation Leaders Opportunity Fund Grant 32565, and the Natural Sciences and Engineering Research Council of Canada (NSERC) Discovery Grants RGPIN-2015-04645 to LM. JP and FO received a stipend award from the Canada First Research Excellence Fund, awarded to McGill University for the Healthy Brains for Healthy Lives initiative. JP further received the Laszlo and Etelka Kollar Fellowship of the Faculty of Medicine and Health Sciences of McGill University. FO further received studentships through the Integrated Program in Neuroscience (IPN). SR received a CGS-Master’s award.
Acknowledgments
The authors thank the CMARC Animal Health Technicians for the drug treatments in mice.
Conflict of interest
LM received funds from New Amsterdam Pharma for a research project regarding CETP inhibitors independent from the work presented herein. This PK study was completed in its core prior to this funding.
The remaining authors declare that the research was conducted in the absence of any commercial or financial relationships that could be construed as a potential conflict of interest.
Publisher’s note
All claims expressed in this article are solely those of the authors and do not necessarily represent those of their affiliated organizations or those of the publisher, the editors, and the reviewers. Any product that may be evaluated in this article, or claim that may be made by its manufacturer, is not guaranteed or endorsed by the publisher.
References
Agellon, L. B., Walsh, A., Hayek, T., Moulin, P., Jiang, X. C., Shelanski, S. A., et al. (1991). Reduced high density lipoprotein cholesterol in human cholesteryl ester transfer protein transgenic mice. J. Biol. Chem. 266, 10796–10801. doi:10.1016/s0021-9258(18)99088-5
Albers, J. J., Tollefson, J. H., Wolfbauer, G., and Albright, R. E. (1992). Cholesteryl ester transfer protein in human brain. Int. J. Clin. Lab. Res. 21, 264–266. doi:10.1007/BF02591657
Barrett, P., Song, Y., Van Horn, W., Hustedt, E., Schafer, J., Hadziselimovic, A., et al. (2012). The amyloid precursor protein has a flexible transmembrane domain and binds cholesterol. Science 336, 1168–1171. doi:10.1126/science.1219988
Barter, P., and Rye, K. A. (1994). Cholesteryl ester transfer protein: Its role in plasma lipid transport. Clin. Exp. Pharmacol. Physiol. 21, 663–672. doi:10.1111/j.1440-1681.1994.tb02569.x
Barzilai, N., Atzmon, G., Derby, C., Bauman, J., and Lipton, R. (2006). A genotype of exceptional longevity is associated with preservation of cognitive function. Neurology 67, 2170–2175. doi:10.1212/01.wnl.0000249116.50854.65
Barzilai, N., Atzmon, G., Schechter, C., Schaefer, E., Cupples, A., Lipton, R., et al. (2003). Unique lipoprotein phenotype and genotype associated with exceptional longevity. JAMA 290, 2030–2040. doi:10.1001/jama.290.15.2030
Bellenguez, C., Kucukali, F., Jansen, I. E., Kleineidam, L., Moreno-Grau, S., Amin, N., et al. (2022). New insights into the genetic etiology of Alzheimer's disease and related dementias. Nat. Genet. 54, 412–436. doi:10.1038/s41588-022-01024-z
Bjorkhem, I., and Meaney, S. (2004). Brain cholesterol: Long secret life behind a barrier. Arterioscler. Thromb. Vasc. Biol. 24, 806–815. doi:10.1161/01.ATV.0000120374.59826.1b
Borras, C., Mercer, A., Sirisi, S., Alcolea, D., Escola-Gil, J. C., Blanco-Vaca, F., et al. (2022). HDL-like-Mediated cell cholesterol trafficking in the central nervous system and alzheimer's disease pathogenesis. Int. J. Mol. Sci. 23, 9356. doi:10.3390/ijms23169356
Brown, M. L., Inazu, A., Hesler, C. B., Agellon, L. B., Mann, C., Whitlock, M. E., et al. (1989). Molecular basis of lipid transfer protein deficiency in a family with increased high-density lipoproteins. Nature 342, 448–451. doi:10.1038/342448a0
Brown, R. P., Delp, M. D., Lindstedt, S. L., Rhomberg, L. R., and Beliles, R. P. (1997). Physiological parameter values for physiologically based pharmacokinetic models. Toxicol. Ind. Health 13, 407–484. doi:10.1177/074823379701300401
Burke, R., Nellen, D., Bellotto, M., Hafen, E., Senti, K. A., Dickson, B. J., et al. (1999). Dispatched, a novel sterol-sensing domain protein dedicated to the release of cholesterol-modified hedgehog from signaling cells. Cell 99, 803–815. doi:10.1016/s0092-8674(00)81677-3
Cao, G., Beyer, T. P., Zhang, Y., Schmidt, R. J., Chen, Y. Q., Cockerham, S. L., et al. (2011). Evacetrapib is a novel, potent, and selective inhibitor of cholesteryl ester transfer protein that elevates HDL cholesterol without inducing aldosterone or increasing blood pressure. J. Lipid Res. 52, 2169–2176. doi:10.1194/jlr.M018069
Chen, D., Yang, J., Tang, Z., Dong, X., Feng, X., Yu, S., et al. (2008). Cholesteryl ester transfer protein polymorphism D442G associated with a potential decreased risk for Alzheimer's disease as a modifier for APOE epsilon4 in Chinese. Brain Res. 1187, 52–57. doi:10.1016/j.brainres.2007.10.054
Cooper, M. K., Wassif, C. A., Krakowiak, P. A., Taipale, J., Gong, R., Kelley, R. I., et al. (2003). A defective response to Hedgehog signaling in disorders of cholesterol biosynthesis. Nat. Genet. 33, 508–513. doi:10.1038/ng1134
Godoy-Corchuelo, J. M., Fernandez-Beltran, L. C., Ali, Z., Gil-Moreno, M. J., Lopez-Carbonero, J. I., Guerrero-Sola, A., et al. (2022). Lipid metabolic alterations in the ALS-FTD spectrum of disorders. Biomedicines 10, 1105. doi:10.3390/biomedicines10051105
Gotto, A. M., Kher, U., Chatterjee, M. S., Liu, Y., Li, X. S., Vaidya, S., et al. (2014). Lipids, safety parameters, and drug concentrations after an additional 2 years of treatment with anacetrapib in the DEFINE study. J. Cardiovasc Pharmacol. Ther. 19, 543–549. doi:10.1177/1074248414529621
Huang, X., Sterling, N. W., Du, G., Sun, D., Stetter, C., Kong, L., et al. (2019). Brain cholesterol metabolism and Parkinson's disease. Mov. Disord. 34, 386–395. doi:10.1002/mds.27609
Inazu, A., Brown, M., Hesler, C., Agellon, L., Koizumi, J., Takata, K., et al. (1990). Increased high-density lipoprotein levels caused by a common cholesteryl-ester transfer protein gene mutation. N. Engl. J. Med. 323, 1234–1238. doi:10.1056/NEJM199011013231803
Ioannou, M. S., Jackson, J., Sheu, S. H., Chang, C. L., Weigel, A. V., Liu, H., et al. (2019). Neuron-astrocyte metabolic coupling protects against activity-induced fatty acid toxicity. Cell 177, 1522–1535.e14. doi:10.1016/j.cell.2019.04.001
Iwagami, M., Qizilbash, N., Gregson, J., Douglas, I., Johnson, M., Pearce, N., et al. (2021). Blood cholesterol and risk of dementia in more than 1.8 million people over two decades: A retrospective cohort study. Lancet Healthy Longev. 2, e498–e506. doi:10.1016/S2666-7568(21)00150-1
Jiang, X., Agellon, L., Walsh, A., Breslow, J., and Tall, A. (1992). Dietary cholesterol increases transcription of the human cholesteryl ester transfer protein gene in transgenic mice. Dependence on natural flanking sequences. J. Clin. Invest. 90, 1290–1295. doi:10.1172/JCI115993
Kaliss, N., and Pressman, D. (1950). Plasma and blood volumes of mouse organs, as determined with radioactive iodoproteins. Proc. Soc. Exp. Biol. Med. 75, 16–20. doi:10.3181/00379727-75-18083
Krishna, R., Gheyas, F., Liu, Y., Hagen, D. R., Walker, B., Chawla, A., et al. (2017). Chronic administration of anacetrapib is associated with accumulation in adipose and slow elimination. Clin. Pharmacol. Ther. 102, 832–840. doi:10.1002/cpt.700
Leithner, C., Muller, S., Fuchtemeier, M., Lindauer, U., Dirnagl, U., and Royl, G. (2010). Determination of the brain-blood partition coefficient for water in mice using MRI. J. Cereb. Blood Flow. Metab. 30, 1821–1824. doi:10.1038/jcbfm.2010.160
Liu, Y., Zhong, X., Shen, J., Jiao, L., Tong, J., Zhao, W., et al. (2020). Elevated serum tc and LDL-C levels in alzheimer's disease and mild cognitive impairment: A meta-analysis study. Brain Res. 1727, 146554. doi:10.1016/j.brainres.2019.146554
Lythgoe, C., Perkes, A., Peterson, M., Schmutz, C., Leary, M., Ebbert, M. T., et al. (2015). Population-based analysis of cholesteryl ester transfer protein identifies association between I405V and cognitive decline: The cache county study. Neurobiol. Aging 36, 547.e1–547.e3. doi:10.1016/j.neurobiolaging.2014.08.022
Maxfield, F. R., and van Meer, G. (2010). Cholesterol, the central lipid of mammalian cells. Curr. Opin. Cell Biol. 22, 422–429. doi:10.1016/j.ceb.2010.05.004
Mukherjee, B. (2022). “Pharmacokinetic models and drug distribution,” in Pharmacokinetics: Basics to applications pp 51-110 (Singapore: Springer Singapore).
Nair, A. B., and Jacob, S. (2016). A simple practice guide for dose conversion between animals and human. J. Basic Clin. Pharm. 7, 27–31. doi:10.4103/0976-0105.177703
Nelson, A. J., Sniderman, A. D., Ditmarsch, M., Dicklin, M. R., Nicholls, S. J., Davidson, M. H., et al. (2022). Cholesteryl ester transfer protein inhibition reduces major adverse cardiovascular events by lowering apolipoprotein B levels. Int. J. Mol. Sci. 23, 9417. doi:10.3390/ijms23169417
Neu, S. C., Pa, J., Kukull, W., Beekly, D., Kuzma, A., Gangadharan, P., et al. (2017). Apolipoprotein E genotype and sex risk factors for alzheimer disease: A meta-analysis. JAMA Neurol. 74, 1178–1189. doi:10.1001/jamaneurol.2017.2188
Nicholls, S., Brewer, H., Kastelein, J., Krueger, K., Wang, M., Shao, M., et al. (2011). Effects of the CETP inhibitor evacetrapib administered as monotherapy or in combination with statins on HDL and LDL cholesterol: A randomized controlled trial. JAMA 306, 2099–2109. doi:10.1001/jama.2011.1649
Nicholls, S. J., Ditmarsch, M., Kastelein, J. J., Rigby, S. P., Kling, D., Curcio, D. L., et al. (2022). Lipid lowering effects of the CETP inhibitor obicetrapib in combination with high-intensity statins: A randomized phase 2 trial. Nat. Med. 28, 1672–1678. doi:10.1038/s41591-022-01936-7
Nicholls, S. J., Ray, K. K., Ballantyne, C. M., Beacham, L. A., Miller, D. L., Ruotolo, G., et al. (2017). Comparative effects of cholesteryl ester transfer protein inhibition, statin or ezetimibe on lipid factors: The ACCENTUATE trial. Atherosclerosis 261, 12–18. doi:10.1016/j.atherosclerosis.2017.04.008
Nicholls, S. J., Ruotolo, G., Brewer, H. B., Kane, J. P., Wang, M. D., Krueger, K. A., et al. (2015). Cholesterol efflux capacity and pre-beta-1 HDL concentrations are increased in dyslipidemic patients treated with evacetrapib. J. Am. Coll. Cardiol. 66, 2201–2210. doi:10.1016/j.jacc.2015.09.013
Nurmohamed, N. S., Ditmarsch, M., and Kastelein, J. J. P. (2022). Cholesteryl ester transfer protein inhibitors: From high-density lipoprotein cholesterol to low-density lipoprotein cholesterol lowering agents? Cardiovasc Res. 118, 2919–2931. doi:10.1093/cvr/cvab350
Oestereich, F., Yousefpour, N., Yang, E., Phenix, J., Nezhad, Z. S., Nitu, A., et al. (2022). The cholesteryl ester transfer protein (CETP) raises cholesterol levels in the brain. J. Lipid Res. 63, 100260. doi:10.1016/j.jlr.2022.100260
Oliveira, H., and de Faria, E. (2011). Cholesteryl ester transfer protein: The controversial relation to atherosclerosis and emerging new biological roles. IUBMB Life 63, 248–257. doi:10.1002/iub.448
Paschkowsky, S., Oestereich, F., and Munter, L. M. (2018). Embedded in the membrane: How lipids confer activity and specificity to intramembrane proteases. J. Membr. Biol. 251, 369–378. doi:10.1007/s00232-017-0008-5
Payne, A. H., and Hales, D. B. (2004). Overview of steroidogenic enzymes in the pathway from cholesterol to active steroid hormones. Endocr. Rev. 25, 947–970. doi:10.1210/er.2003-0030
Peyret, T., Poulin, P., and Krishnan, K. (2010). A unified algorithm for predicting partition coefficients for PBPK modeling of drugs and environmental chemicals. Toxicol. Appl. Pharmacol. 249, 197–207. doi:10.1016/j.taap.2010.09.010
Poirier, J., Davignon, J., Bouthillier, D., Kogan, S., Bertrand, P., and Gauthier, S. (1993). Apolipoprotein E polymorphism and Alzheimer's disease. Lancet 342, 697–699. doi:10.1016/0140-6736(93)91705-q
Porter, J. A., Young, K. E., and Beachy, P. A. (1996). Cholesterol modification of hedgehog signaling proteins in animal development. Science 274, 255–259. doi:10.1126/science.274.5285.255
Poulin, P., and Haddad, S. (2011). Microsome composition-based model as a mechanistic tool to predict nonspecific binding of drugs in liver microsomes. J. Pharm. Sci. 100, 4501–4517. doi:10.1002/jps.22619
Ray, K. K., Ditmarsch, M., Kallend, D., Niesor, E. J., Suchankova, G., Upmanyu, R., et al. (2014). The effect of cholesteryl ester transfer protein inhibition on lipids, lipoproteins, and markers of HDL function after an acute coronary syndrome: The dal-ACUTE randomized trial. Eur. Heart J. 35, 1792–1800. doi:10.1093/eurheartj/ehu105
Rodriguez, E., Mateo, I., Infante, J., Llorca, J., Berciano, J., and Combarros, O. (2006). Cholesteryl ester transfer protein (CETP) polymorphism modifies the Alzheimer's disease risk associated with APOE epsilon4 allele. J. Neurol. 253, 181–185. doi:10.1007/s00415-005-0945-2
Shen, D. D. (2010). “Chapter 7. Toxicokinetics,” in Casarett and Doull's Essentials of Toxicology, 2e. Editors C. D. Klaassen, and J. B. Watkins (New York, NY: The McGraw-Hill Companies).
Simic, B., Mocharla, P., Crucet, M., Osto, E., Kratzer, A., Stivala, S., et al. (2017). Anacetrapib, but not evacetrapib, impairs endothelial function in CETP-transgenic mice in spite of marked HDL-C increase. Atherosclerosis 257, 186–194. doi:10.1016/j.atherosclerosis.2017.01.011
Small, D. S., Ke, A. B., Hall, S. D., Mantlo, N., Rotelli, M., and Friedrich, S. (2015). Assessment of the persistence of anacetrapib and evacetrapib concentrations using two pharmacokinetic modeling approaches. J. Clin. Pharmacol. 55, 757–767. doi:10.1002/jcph.472
Solomon, A., Kivipelto, M., Wolozin, B., Zhou, J., and Whitmer, R. (2009). Midlife serum cholesterol and increased risk of Alzheimer's and vascular dementia three decades later. Dement. Geriatr. Cogn. Disord. 28, 75–80. doi:10.1159/000231980
Steenbergen, R. H., Joyce, M. A., Lund, G., Lewis, J., Chen, R., Barsby, N., et al. (2010). Lipoprotein profiles in SCID/uPA mice transplanted with human hepatocytes become human-like and correlate with HCV infection success. Am. J. Physiol. Gastrointest. Liver Physiol. 299, G844–G854. doi:10.1152/ajpgi.00200.2010
Sun, L., Hu, C. Y., Shi, X. H., Zheng, C. G., Huang, Z. Z., Lv, Z. P., et al. (2013). Trans-ethnical shift of the risk genotype in the CETP I405V with longevity: A Chinese case-control study and meta-analysis. PLoS One 8, e72537. doi:10.1371/journal.pone.0072537
Sundermann, E. E., Wang, C., Katz, M., Zimmerman, M. E., Derby, C. A., Hall, C. B., et al. (2016). Cholesteryl ester transfer protein genotype modifies the effect of apolipoprotein epsilon4 on memory decline in older adults. Neurobiol. Aging 41, 200 e207–e200 e212. doi:10.1016/j.neurobiolaging.2016.02.006
Takubo, H., Ishikawa, T., Kuhlmann, O., Nemoto, H., Noguchi, T., Nanayama, T., et al. (2014). Pharmacokinetics and disposition of dalcetrapib in rats and monkeys. Xenobiotica 44, 1117–1126. doi:10.3109/00498254.2014.932471
Tall, A. R. (1995). Plasma lipid transfer proteins. Annu. Rev. Biochem. 64, 235–257. doi:10.1146/annurev.bi.64.070195.001315
Tall, A. R., and Rader, D. J. (2018). Trials and tribulations of CETP inhibitors. Circ. Res. 122, 106–112. doi:10.1161/CIRCRESAHA.117.311978
Turri, M., Marchi, C., Adorni, M. P., Calabresi, L., and Zimetti, F. (2022). Emerging role of HDL in brain cholesterol metabolism and neurodegenerative disorders. Biochim. Biophys. Acta Mol. Cell Biol. Lipids 1867, 159123. doi:10.1016/j.bbalip.2022.159123
Vance, J. (2012). Dysregulation of cholesterol balance in the brain: Contribution to neurodegenerative diseases. Dis. Model Mech. 5, 746–755. doi:10.1242/dmm.010124
Vitali, C., Wellington, C. L., and Calabresi, L. (2014). HDL and cholesterol handling in the brain. Cardiovasc Res. 103, 405–413. doi:10.1093/cvr/cvu148
Whitmer, R. A., Sidney, S., Selby, J., Johnston, S. C., and Yaffe, K. (2005). Midlife cardiovascular risk factors and risk of dementia in late life. Neurology 64, 277–281. doi:10.1212/01.WNL.0000149519.47454.F2
Keywords: cholesterol, evacetrapib, brain, cholesteryl ester transfer protein (CETP), Alzheimer’s disease, PBPK model, pharmacokinetic, inhibitor
Citation: Phénix J, Côté J, Dieme D, Recinto SJ, Oestereich F, Efrem S, Haddad S, Bouchard M and Munter LM (2023) CETP inhibitor evacetrapib enters mouse brain tissue. Front. Pharmacol. 14:1171937. doi: 10.3389/fphar.2023.1171937
Received: 22 February 2023; Accepted: 26 June 2023;
Published: 18 July 2023.
Edited by:
Yurong Lai, Gilead, United StatesCopyright © 2023 Phénix, Côté, Dieme, Recinto, Oestereich, Efrem, Haddad, Bouchard and Munter. This is an open-access article distributed under the terms of the Creative Commons Attribution License (CC BY). The use, distribution or reproduction in other forums is permitted, provided the original author(s) and the copyright owner(s) are credited and that the original publication in this journal is cited, in accordance with accepted academic practice. No use, distribution or reproduction is permitted which does not comply with these terms.
*Correspondence: Sami Haddad, c2FtaS5oYWRkYWRAdW1vbnRyZWFsLmNh; Michèle Bouchard, bWljaGVsZS5ib3VjaGFyZEB1bW9udHJlYWwuY2E=; Lisa Marie Munter, bGlzYS5tdW50ZXJAbWNnaWxsLmNh
†These authors have contributed equally to this work