
95% of researchers rate our articles as excellent or good
Learn more about the work of our research integrity team to safeguard the quality of each article we publish.
Find out more
ORIGINAL RESEARCH article
Front. Pharmacol. , 08 June 2023
Sec. Pharmacology of Anti-Cancer Drugs
Volume 14 - 2023 | https://doi.org/10.3389/fphar.2023.1164367
This article is part of the Research Topic Novel Small Molecules in Targeted Cancer Therapy View all 8 articles
 Yan Hu1,2†
 Zhe Zhao1,3†Yuan-Ting Liu2†Ze-Cheng Xu2Jing-Yi Li1,4Zheng-Yu Yang1 Rui-Wang2Yun-Qi Yang2Jia-Hui Zhang2Si-Yuan Qiu2Tao He1*Yi-Ying Wu1*
 Sha Liu1,2*
Background: N-linoleyltyrosine (NITyr), one of the anandamide analogs, exerts activity via the endocannabinoid receptors (CB1 and CB2), which showed anti-tumor effects in various tumors. Therefore, we speculated that NITyr might show anti-non-small cell lung cancer (NSCLC) effects via the CB1 or CB2 receptor. The purpose of the investigation was to reveal the anti-tumor ability of NITyr on A549 cells and its mechanisms.
Methods: The viability of A549 cells was measured by MTT assay, and the cell cycle and apoptosis were both examined by flow cytometry; in addition, cell migration was tested by wound healing assay. Apoptosis-related markers were measured by immunofluorescence. The downstream signaling pathways (PI3K, ERK, and JNK) of CB1 or CB2 were examined through Western blotting. The expressions of CB1 and CB2 were detected by immunofluorescence. Finally, the AutoDock software was used to validate the binding affinity between the targets, such as CB1 and CB2, with NITyr.
Results: We found that NITyr inhibited cell viability, hindered the cell cycle, resulted in apoptosis, and inhibited migration. The CB1 inhibitor, AM251, and the CB2 inhibitor, AM630, weakened the aforementioned phenomenon. The immunofluorescence assay suggested that NITyr upregulated the expression of CB1 and CB2. Western blot analysis indicated that NITyr upregulated the expression of p-ERK, downregulated the expression of p-PI3K, and did not affect p-JNK expression. In conclusion, NITyr showed a role in inhibiting NSCLC through the activation of CB1 and CB2 receptors involved in PI3K and ERK pathways.
Non-small cell lung cancer (NSCLC) accounts for about 85% of lung cancers. Because of its high invasiveness and limited treatment options, the 5-year overall survival rate of NSCLC patients is low. In addition, the postoperative recurrence rate is very high (Siegel et al., 2021). In recent years, the endocannabinoid system (ECS) has become a vital target for treating different illnesses (Dando et al., 2013; Pellati et al., 2018; Hinz and Ramar, 2019; Ellert-Miklaszewska et al., 2021). Extensive studies on NSCLC in vivo and in vitro show that the ECS reduces neovascularization and migration of tumor cells by inhibiting the reproduction of cancer cells and resulting in apoptosis.
The ECS includes endocannabinoids (AEA and 2-AG), endocannabinoid receptor CBR (CB1 and CB2), and endocannabinoid metabolic enzymes (FAAH and MAGL), which are members of the serine hydrolase superfamily and hydrolyze AEA and 2-AG, respectively (Lu and Mackie, 2021). The effects of AEA and 2-AG are mainly mediated by CB1 and CB2. The CB1 receptor is mainly distributed in the central nervous systems (CNSs), and the expression of the CB2 receptor is mainly distributed in immune cells and at an average level in peripheral tissue (Ye et al., 2019). The relationship between ECS function and the biological processes of cancer is closely relevant, such as the growth, migration, and invasion of tumor cells (Preet et al., 2011). A large number of studies suggest that CB1 and CB2 proteins are overexpressed in tumor cells, such as those in NSCLC, gliomas, liver cancer, and pancreatic cancer. (Ayakannu et al., 2018; Kisková et al., 2019; Laezza et al., 2020; Milian et al., 2020; Shah et al., 2021). Meanwhile, AEA inhibits the viability of A549, SW620, and DLD1 cells, which are related to NSCLC and colon cancer, through the activation of CB1 and CB2 (Ravi et al., 2014; Kuc et al., 2012; Proto et al., 2012; Pasquariello et al., 2009). Therefore, AEA is considered to resist NSCLC and improve the survival rate of patients. Additionally, the tumor cells are also suppressed via inhibiting FAAH and MAGL, whose roles are to hydrolyze AEA and 2-AG (Slivicki et al., 2019). Moreover, the rapid inactivation of AEA reduces its anti-tumor activity (Willoughby et al., 1997). Generally, it is highly difficult to apply AEA in the clinic. Therefore, it is vital to develop AEA analogs.
In previous studies, our laboratory synthesized an AEA analog, N-linoleyltyrosine (NITyr). NITyr prevented transient cerebral ischemia in gerbils by regulating the PI3K/Akt signaling pathway involvement of the CB2 receptor (Cheng et al., 2019). At the same time, NITyr exerted neuroprotective effects in the regulation of autophagy via a cannabinoid receptor in vitro and in vivo (Liu et al., 2020; Long et al., 2021). In summary, NITyr exerted benign pharmacological activities through the ECS, and the ECS participated in the processes of tumor formation (de Melo Reis et al., 2021). Based on the above, it is speculated that NITyr might show anti-tumor effects through the ECS. In this experiment, the roles of NITyr on proliferation, apoptosis, and invasion in NSCLC were clarified, and the regulatory mechanism of the ECS on NITyr was further discussed.
NITyr, obtained from our laboratory, as previously reported (Cheng et al., 2019). Caspase-3 (1: 500), caspase-9 (1: 500), Bax (1: 500), Bcl-2 (1: 500), ERK1/2 (1: 5,000), phospho-ERK1/2 (1: 5,000), and cyclin D1 (1: 2000) rabbit polyclonal antibodies (Abways, United States); PI 3 kinase p85 alpha (1: 500) and phospho-PI 3 kinase p85 alpha (1: 500) antibodies (Abways, United States); goat anti-rabbit IgG (H + L) conjugated to horseradish peroxidase (HRP) (1: 5,000) (Abways, United States); goat anti-rabbit IgG (H + L) conjugated to horseradish peroxidase (HRP) with Alexa Fluor 594 (1: 5,000) (Abways, United States); GAPDH (1: 10,000), CB1 (1: 2000) and JNK (1: 2000) rabbit polyclonal antibodies (Proteintech, Rosemont, IL, United States); phospho-JNK (Tyr185) recombinant (1: 5,000) antibody (Proteintech, Rosemont, IL, United States); CB2 antibody (1: 500) (Affinity Biosciences, Cincinnati, OH, United States); AM251 (200 μg/mL) (Sigma-Aldrich, Burlington, MA, United States); AM630 (200 μg/mL) (Sigma-Aldrich, Burlington, MA, United States); chemiluminescent HRP substrate (BMD, Merck Millipore, Burlington, MA, United States); and ethylene diamine tetraacetic acid (EDTA) (Beyotime Institute of Biotechnology, Inc., Jiangsu, China).
A549 cells were obtained from Shanghai Fuheng Biotechnology Co., Ltd. (Shanghai, China). A549 cells were cultivated with a cell culture medium that included RPMI-1640 medium, 10% fetal bovine serum (FBS), and 1% penicillin–streptomycin solution, placed in a standard 5% CO2 laboratory incubator at 37°C, and then sub-cultured on the third day. The experimental groups were divided as follows: i) control; ii) 10, 25, 50, 75, and 100 μg/mL NITyr; iii) NITyr + AM251 (200 μg/mL); iv) NITyr + AM630 (200 μg/mL); v) control + AM251 (200 μg/mL); vi) control + AM630 (200 μg/mL).
A549 cells (5 × 10³ cells/well) were grown in 96-well plates and then stored in an incubator at 37°C at a 5% CO2 for 1 day. Next, the cells were processed with various concentrations of NITyr (10, 25, 50, 75, and 100 μg/mL) for 12, 24, and 48 h. In total, 10 μL of 3- (4,5-dimethylthiazol-2-yl)-2,5-diphenyltetrazolium bromide (MTT) solution (5 mg/mL) was added to the 96-well plates, and the plates were placed in the aforementioned incubator for 4 h. Next, 100 μL of dimethyl sulfoxide (DMSO) was provided to dissolve formazan crystals in each well. Subsequently, the plates were sonicated for 10 min. Afterward, the absorption of each well at 560 nm was detected by using a VICTOR Nivo™ microplate reader (PerkinElmer, Inc., Waltham, MA, United States).
A549 cells (6 × 10⁴ cells/well) were cultured into each well of the 6-well plates at a 5% CO2 incubator at 37°C for up to 1 day. Afterward, various concentrations of NITyr (10, 25, and 50 μg/mL) were added into the well to maintain A549 cells for up to 12, 24, and 48 h. Then, apoptotic cells were gathered into EP tubes and rinsed twice with cold phosphate-buffered saline (PBS). Additionally, the cells were centrifuged at 2000 rpm for 5 min at 4°C, then 200 μL 1× binding buffer, 2 μL Annexin V-FITC, and 2 μL propidium iodide (PI) was added into EP tubes in turn and stored for 8 min in the dark. Finally, the NovoCyte Quanteon flow cytometer (ACEA Biosciences-Agilent Technologies, Santa Clara, CA, United States) was used to detect all samples.
A549 cells were seeded into 6-well plates at a density of 6 × 10⁴ cells per well, and the aforementioned plates were incubated for 1 day at a 5% CO2 incubator at 37°C. Next, NITyr (10, 25, and 50 μg/mL) was provided to process A549 cells for 12, 24, and 48 h, respectively. Then, the cell supernatant was collected into EP tubes, and the remaining cells were flushed twice with 1× cold PBS, trypsinized, and collected into EP tubes. Subsequently, all cell suspensions aforementioned were centrifuged for 5 min at a speed of 2000 rpm and rinsed twice with cold PBS. Next, the cells were fixed with ice–cold 70% ethanol overnight at 4°C. Later, the cells were resuspended with PI Master Mix (5 μL PI and 20 μL RNase A in 275 µL PBS) after being centrifuged at 2000 rpm for 5 min and incubated for 15 min in the darkness. Eventually, the cell cycle was analyzed by flow cytometry (ACEA Biosciences-Agilent Technologies, Santa Clara, CA, United States) after cell filtration.
After A549 cells were transplanted at a density of 105 cells/well in 6-well plates for 24 h, different concentrations of NITyr (10 and 25 μg/mL) were added into the well to maintain A549 cells. Subsequently, we drew two straight lines perpendicular to each other in every well to create the wound with a pipette tip. The pictures were photographed to measure the gap between the wound edges. Then, the cells were continuously cultured for 12 h, 24 h, and 48 h. In order to assess the distance between wound edges, the pictures were taken again, and the grayscale value of the aforementioned pictures was detected using ImageJ software.
A549 cells were seeded on coverslips with a number of 5 × 10⁵ cells per well in 6-well plates and preserved for 1 day in an incubator at 37°C. Afterward, the cells were handled by NITyr (10, 25, and 50 μg/mL) for 24 h. The coverslips were rinsed with cold PBS three times for 5 min each. In total, 4% paraformaldehyde was subsequently provided to immobilize coverslips for 15 min. In addition, the cells were permeated with 0.5% Triton X-100 diluted with Tris-buffered saline with Tween-20 (TBST) for 20 min at ambient temperature. All coverslips were washed again and incubated for 45 min with the blocking solution containing 5% bovine serum albumin (BSA) at ambient temperature. Immediately after, the corresponding primary antibodies, which were formulated by 1× TBST containing 1% BSA, were used to incubate the cells overnight at 4°C. After being flushed for 3 min per time with 1× TBST (three times in total), the secondary antibodies conjugated with Alexa Fluor 594 were provided to incubate the cells for 60 min at ambient temperature in the dark. In addition, the nucleus of A549 cells was probed with 4′, 6-diamidino-2′-phenylindole (DAPI). Finally, all coverslips were washed for 5 min each time with 1× TBST (five times in all) and detected by using a BX63 fluorescence microscope (magnification ×40; Olympus Corporation, Tokyo, Japan).
After being seeded into culture dishes, the A549 cells at a density of 106 cells per well were stored in a standard 5% CO2 laboratory incubator at 37°C for 1 day. The cells were administered based on the Western blot protocol after being supplied with 10, 25, and 50 μg/mL NITyr to treat cells (Liu et al., 2020). After the cells were washed three times with cold PBS, the prepared lysis buffer containing 1% protease inhibitor and 1% EDTA was added to the 6-well plates, which were placed in a thermal box filled with ice for up to half an hour. Afterward, the cells were scraped by a cell scraper, collected into EP tubes, and centrifuged at 12,000 × g at 4°C for 20 min. After centrifugation, the cell supernatant was gently transferred to newly pre-chilled EP tubes that were placed on ice. Depending on the protocol of the Easy II Protein Quantitative Kit (TransGen Biotech Co., Ltd., Beijing, China), the protein concentration was detected and adjusted, and then all samples were denatured at 100°C for 6 min. To separate the protein, 10% polyacrylamide gels were applied (Tris-HCl system). Next, the isolated protein was transblotted onto polyvinylidene difluoride (PVDF) membranes (Merck Millipore, Burlington, MA, United States), and 5% BSA was used to block the aforementioned membranes on a shaker at 37°C for 1 h. The next step was to incubate the aforementioned membranes with the relevant primary antibodies for at least one night at 4°C. The GAPDH rabbit polyclonal antibody, an internal control, was used to quantify target proteins. Subsequently, after being flushed for 5 min each time with 1× TBST (three times in total), all membranes were preserved with secondary HRP-conjugated antibodies for 60 min and then rinsed with 1× TBST as previously mentioned. To detect the protein bands, all membranes aforementioned were handled with the chemiluminescent HRP substrate. The ChemiDoc system was provided to capture the images of protein bands, and the grayscale value of protein bands was probed via ImageJ software 1.8.0.
The AutoDock software was used to explore binding affinities between macromolecules and small molecules. The three-dimensional (3D) structure of NITyr was obtained from the PDB database (http://www.rcsb.org/). The protein was pre-processed using AutoDock tools by removing water molecules and adding hydrogen atoms. The 3D structures of the CB1 receptor agonist (AM11542, AEA) and CB2 receptor agonist (dronabinol, 2-AG) were obtained from the NCBI PubChem database (https://pubchem.ncbi.nlm.nih.gov/). All visualization results were analyzed using PyMOL software (https://www.pymol.org/).
All data analyses were performed using GraphPad Prism, and the results were presented as mean ± standard deviation (SD). Comparisons were evaluated by unpaired Student’s t-tests or ANOVA. When the p-value was less than 0.05, the outcome was considered to be significantly different.
As shown in Figure 1, compared to the control group, in the presence of NITyr at 12 h, the cell viability decreased to 77.33%, 64.33%, 21%, and 18.67% (p < 0.05, p < 0.01, and p < 0.001, respectively). After processing by NITyr for 24 h, the cell viability decreased to 46%, 19.33%, 16.33%, and 16.67% compared to the control group. After being processed by NITyr for up to 48 h, the cell viability decreased to 16.67%, 10%, 9.33%, and 13% compared to the control group (p < 0.05, p < 0.01, and p < 0.001, respectively). The aforementioned results indicated that NITyr inhibited the cell viability of A549.
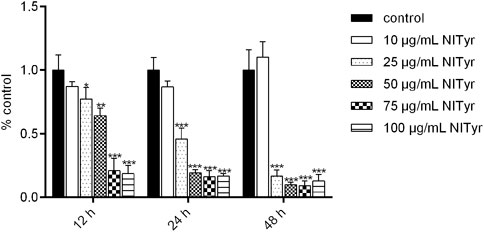
FIGURE 1. NITyr decreased the viability of A549 cells. MTT was used to detect the cell viability of A549 cells treated with 0, 10, 25, 50, 75, and 100 μg/mL NITyr for different times (12, 24, and 48 h). The above experiment was performed at least three times. *p < 0.05, **p < 0.01, and ***p < 0.001 compared to the control group.
As shown in Figure 2, after being treated with NITyr for 12 h, the ratio of cells increased from 71.5% to 63% and 62% (p < 0.05 both) in the G1 phase, the proportion of cells in the G2 phase increased from 8.377% to 18% and 19% (p < 0.05, p < 0.01), and the noticeable discrepancy was not tested in the S phase. After having dealt with NITyr for 24 h, the ratio of cells in the S phase decreased from 17.5% to 11% (p < 0.05), the proportion of cells in the G2 phase increased from 10.64% to 14% (p < 0.05), and an evident performance was observed in the G1 phase. In addition, after being handled by NITyr for 48 h, the ratio of cells in the G1 phase increased from 75.13% to 81 (p < 0.01), the ratio of cells in the S phase decreased from 13.64% to 8% (p < 0.05), and a notable discrepancy was observed in the G2 phase. The aforementioned results indicated that NITyr at various concentrations arrested the cell cycle at different phases.
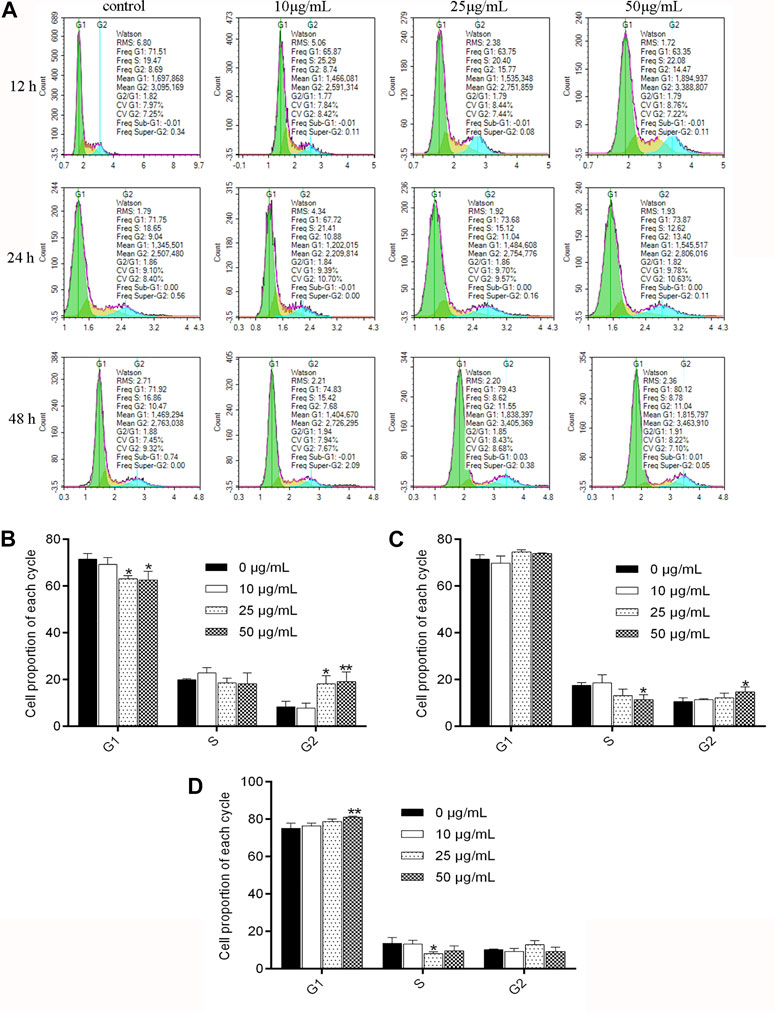
FIGURE 2. NITyr arrested the cell cycle of A549 cells. (A) Flow cytometry was performed to test the cell cycle of A549 cells treated with 0, 10, 25, and 50 μg/mL NITyr for different times, including 12, 24, and 48 h. (B) Statistical analysis of NITyr treatment for 12 h. (C) Statistical analysis of NITyr treatment for 24 h. (D) Statistical analysis of NITyr treatment for 48 h. The above experiment was conducted at least three times. *p < 0.05, **p < 0.01, and ***p < 0.001 compared to the control group.
As shown in Figure 3, the apoptosis rate significantly increased from 6.377% to 18.33% (p < 0.01) after treatment with NITyr at 50 μg/mL when compared to the control group for 24 h. With the extension of time, the rate of cell apoptosis was notably increased at 48 h. The apoptosis rate increased from 6.943% to 37.02% and 94.19%, respectively, after 25 μg/mL and 50 μg/mL NITyr treatment (p < 0.01, p < 0.001) as compared with the control group. To sum up, NITyr promoted A549 cell apoptosis.
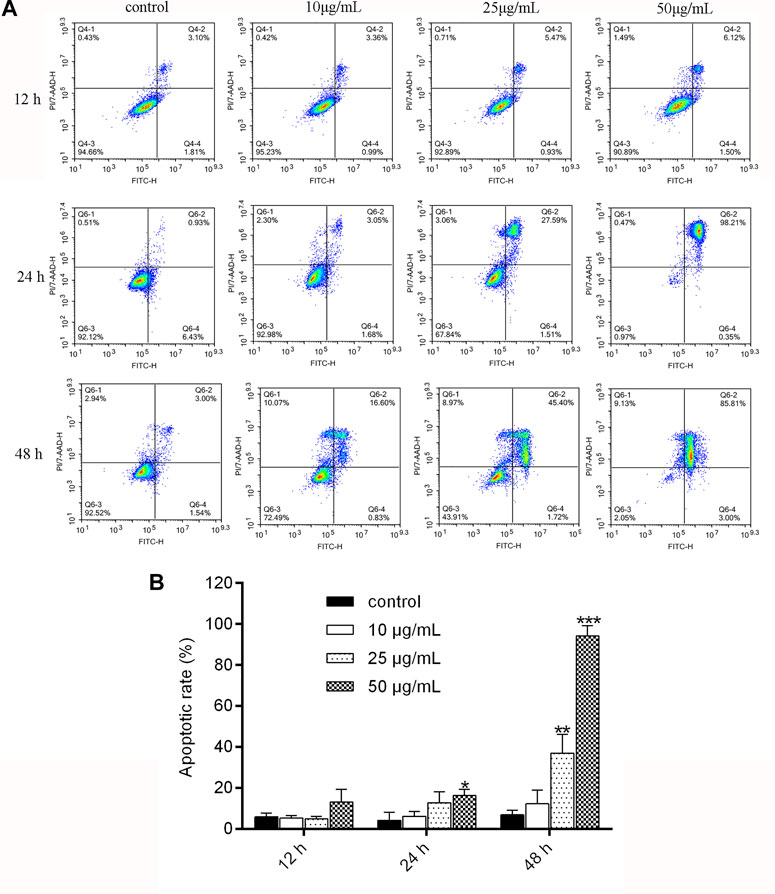
FIGURE 3. NITyr promoted A549 cell apoptosis. (A) Flow cytometry was performed to examine cell apoptosis at 12, 24, and 48 h after A549 cells were processed by NITyr (0, 10, 25, and 50 μg/mL). (B) Statistical analysis of flow cytometry. The above experiment was conducted at least three times. **p < 0.01 and ***p < 0.001 compared to the control group.
As shown in Figure 4, when the cells were administered with NITyr for 12 h, the open wound area in the NITyr groups was not significantly changed compared to the control group. As expected, in the presence of NITyr (10 μg/mL and 25 μg/mL) for 24 and 48 h, the open wound area was notably wider than in the control group (p < 0.05 and p < 0.01). In summary, NITyr showed an evident inhibition of the migration of A549 cells.
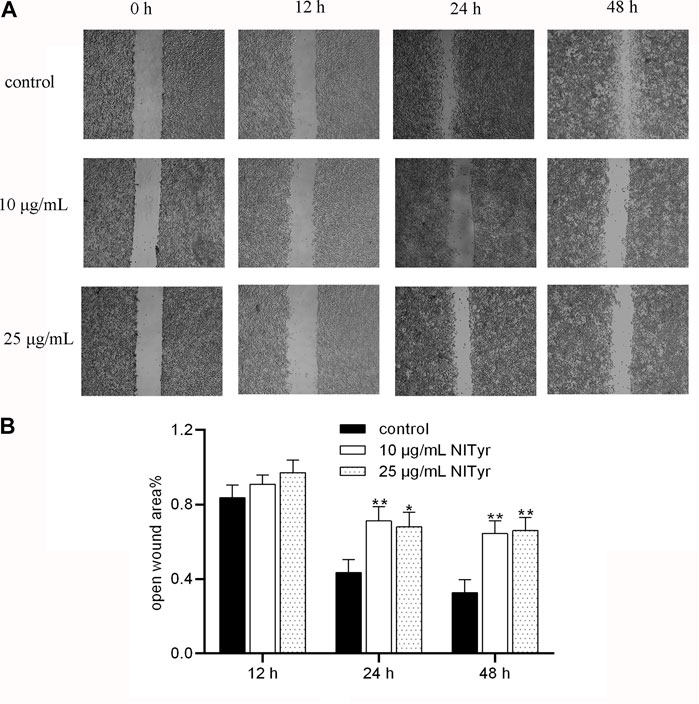
FIGURE 4. NITyr inhibited the migration ability of A549 cells. (A) The results of the control and experimental groups at 0 h, 12 h, 24 h, and 48 h were analyzed by using the wound healing assay. (B) Statistical analysis of the wound healing assay. The above experiment was conducted at least three times. *p < 0.05 and **p < 0.01 compared to the control group.
As shown in Figure 5, the red fluorescence intensities of Bax, caspase-3, and caspase-9 were notably enhanced in the NITyr-treated groups as compared to the control group (p < 0.05, p < 0.01, and p < 0.01, respectively). Meanwhile, no prominent variation in the expression of Bcl-2 was investigated.
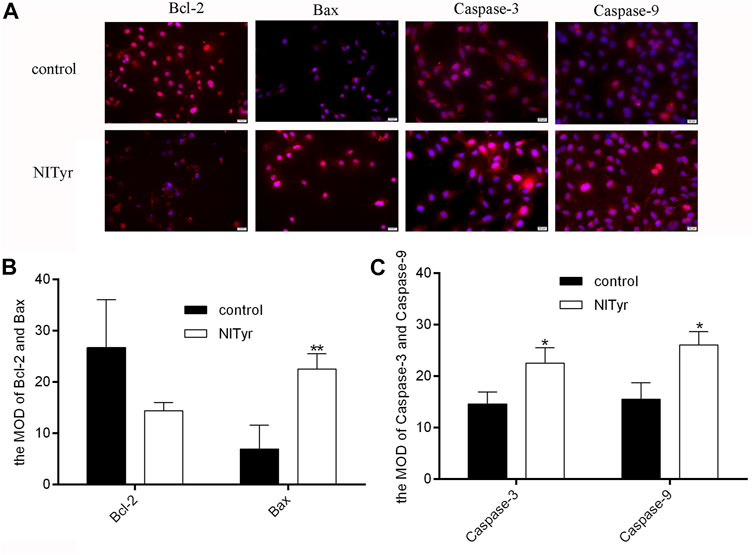
FIGURE 5. NITyr promoted the expression of apoptosis-related index. (A) The immunofluorescence test was used to assess the protein expressions of Bcl-2, Bax, caspase-3 and caspase-9. (B) The immunofluorescence images of Bax and Bcl-2 were statistically analyzed. (C) The immunofluorescence images of Caspase-3 and Caspase-9 were statistically analyzed. The above experiment was conducted at least three times. *p < 0.05 and **p < 0.01 compared to the control group.
As shown in Figure 6, compared to the control group, the proportion of p-ERK/ERK increased obviously (p < 0.05), while that of p-PI3K/PI3K was downregulated (p < 0.05) in the NITyr groups. Meanwhile, in the presence of NITyr, no significance was detected in the ratio of p-JNK/JNK compared to the control group. Moreover, no obvious discrepancy was discovered in the non-phosphorylation expression of each pathway-related protein.
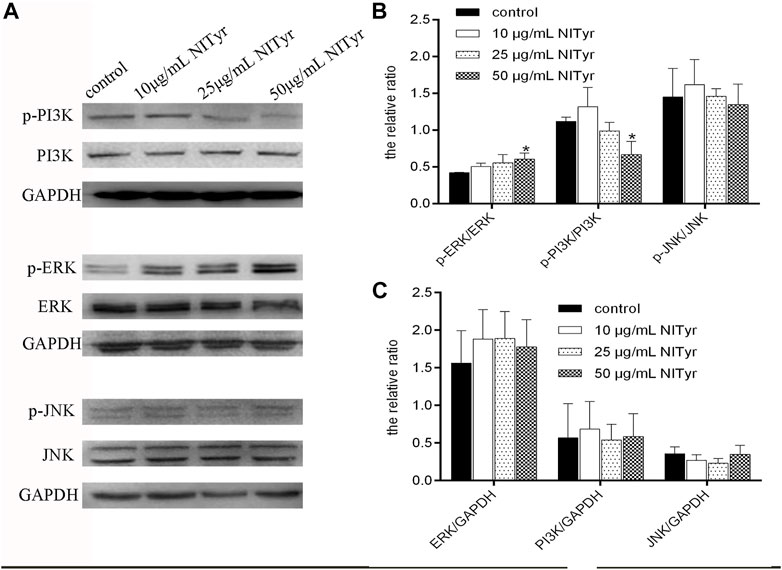
FIGURE 6. NITyr regulated the PI3K, ERK, and JNK pathways. (A) Western blotting was performed to test the expression of p-PI3K, PI3K, p-ERK, ERK, p-JNK, and JNK. (B) The relative ratios of p-PI3K/PI3K, p-ERK/ERK, p-JNK/JNK were statistically analyzed. (C) The relative ratios of ERK/GAPDH, PI3K/GAPDH, JNK/GAPDH were statistically analyzed. The above experiment was conducted at least three times. *p < 0.05, **p < 0.01, and ***p < 0.001 compared with the control group.
As shown in Figure 7, the fluorescence intensities were evidently enhanced in the NITyr-treated groups when compared to the control group, indicating that the expression of CB1 and CB2 proteins was upregulated.
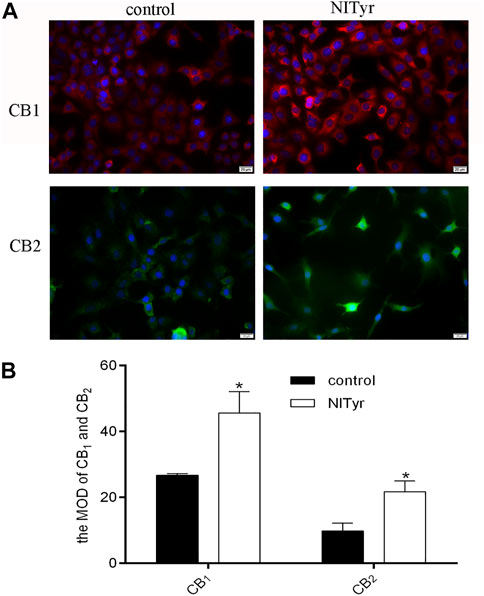
FIGURE 7. NITyr upregulated CB1 and CB2 expressions. (A) Immunofluorescence assay detected the expression of CB1 and CB2 proteins. (B) The immunofluorescence images were statistically analyzed. The above experiment was conducted at least three times. *p < 0.05 compared to the control group.
As shown in Figure 8, pre-treatment with AM251 and AM630 had no significance on the cell viability or migration of A549 cells compared with the control group. AM251 and AM630, combined with NITyr, exerted a weaker effect on cell viability. Furthermore, AM630 weakened the effect of NITyr on migration, while AM251 did not.
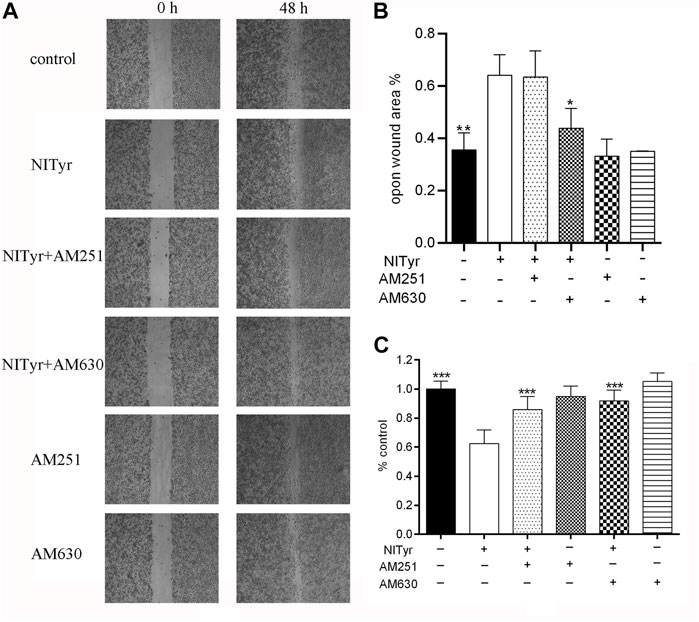
FIGURE 8. NITyr inhibited the ability of proliferation and migration by activating CB1 or CB2 receptors. (A) Scratch images were detected by using a microscope. (B) Statistical analysis of a cell-scratch experiment. (C) AM251 and AM630 weakened the effect of NITyr on cell viability. The above experiment was conducted at least three times. *p < 0.05, **p < 0.01, and ***p < 0.001 compared with the control group.
As shown in Figure 9, pre-treatment with AM251 and AM630 had no significance on the expressions of Bcl-2, Bax, and cyclin D1 of A549 cells compared with the control group. AM251 or AM630 attenuated the effect of NITyr on Bax expression but not on the expression of Bcl-2 and cyclin D1.
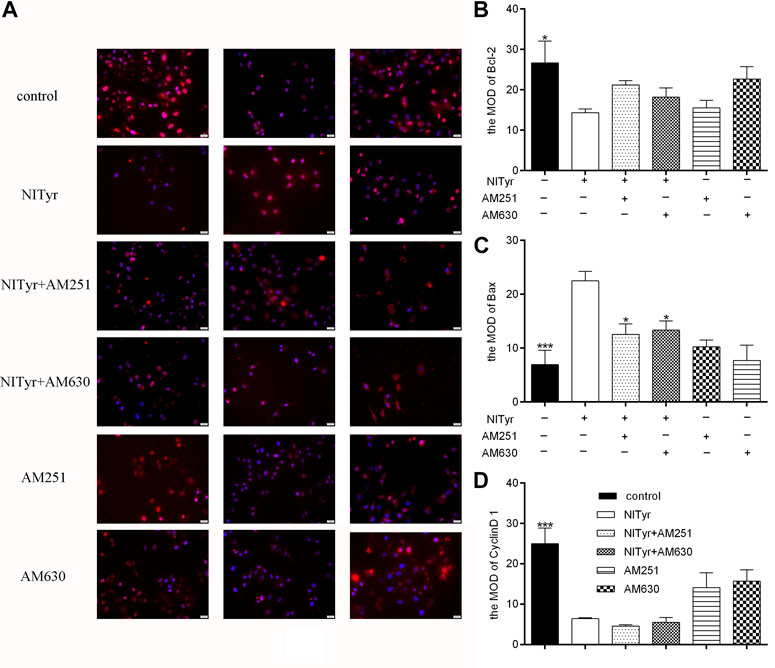
FIGURE 9. AM630 attenuated the effect of NITyr on Bax expression. (A) Immunofluorescence assay detected the expression of Bcl-2, Bax, and cyclin D1 proteins. (B) The immunofluorescence images of Bcl-2 were statistically analyzed (C) The immunofluorescence images of Bax were statistically analyzed. (D) The immunofluorescence images of cyclin D1 were statistically analyzed. The above experiment was conducted at least three times. *p < 0.05, **p < 0.01, and ***p < 0.001 compared with the control group.
AutoDock Vina molecular docking will obtain the score of each docking. The lower the docking score, the stronger the binding affinity with the target protein. These scores were compared with those of the positive drugs to predict potential targets. The docking scores of NITyr with CB1 and CB2 are shown in Table 1. As shown in Figure 10, All visualization results were analyzed using PyMOL software.
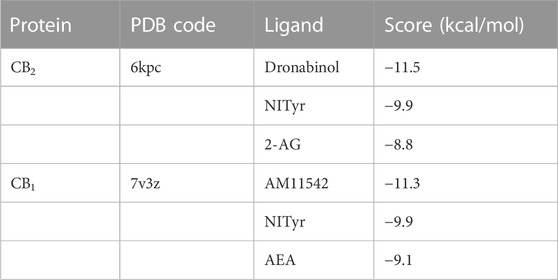
TABLE 1. Molecular docking scores.
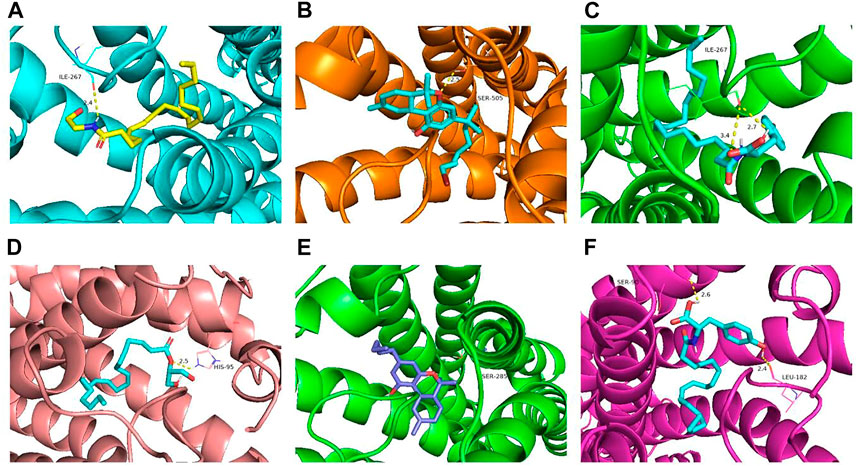
FIGURE 10. Molecular docking results of key targets (CB1 and CB2) with NITyr. (A) CB1 and AEA. (B) CB1 and AM11542. (C) CB1 and NITyr. (D) CB2 and 2-AG. (E) CB2 and dronabinol. (F) CB2 and NITyr.
Numerous studies indicated that endocannabinoid analogs inhibited the multiplication, apoptosis, invasion, metastasis, and angiogenesis of cancers (Huang et al., 2021; Khodadadi et al., 2021; Mangal et al., 2021; Volmar et al., 2021; Wang et al., 2021). In addition, endocannabinoid analogs mainly acted on damaged tissues, but less on normal tissues, indicating they owned high selectivity (Meccariello R. 2020). However, the rapid metabolic deactivation of endocannabinoids limited the clinical application. Thus, the development of AEA analogs showed benign application prospects. In previous studies, NITyr, as an endocannabinoid analog, protected PC12 cells from oxidative damage via CB1 receptor regulation, prevented neurons against Aβ1–40-mediated cell toxicity through autophagy related to the CB2/AMPK/mTOR/ULK1 pathway (Zhou et al., 2022), and exerted neuroprotective activities in APP/PS1 transgenic mice through cannabinoid receptor-induced autophagy, indicating the neuroprotective activities of NITyr were related to endocannabinoid signal pathways. Furthermore, the intervention of the CB1/2 receptor improved the anti-tumorigenic effects in NSCLC (). In summary, it is speculated that NITyr also resisted NSCLC.
In the study, A549 cells were taken as the research object, and when the concentration of NITyr was 25 μg/mL, the cell viability was rapidly inhibited, and the inhibition rate was up to approximately 90%, indicating that NITyr inhibited cell viability at low concentrations.
In cell cycle experiments, after being processed with NITyr for 12 h, the ratio of cells in the G1 phase decreased while the proportion of cells in the G2 phase increased, suggesting that the cell reproduction was hampered in the G2 stage; after being treated with NITyr for 24 h, the ratio of cells in the S period declined as the number of cells in the G2 period increased, showing that the cell cycle was arrested in the G2 stage; after having dealt with NITyr for 48 h, the cell proportion in the S stage reduced while the cell proportion in the G1 period increased, suggesting the cell cycle was deterred in the G1 period. The aforementioned results indicated that with the prolongation of treatment time, the arresting effect of NITyr on cells gradually transited from the G2 phase to the G1 phase, and the arresting ability was steadily enhanced. The aforementioned results demonstrated that NITyr did inhibit cell proliferation.
In the scratch test, as the concentration of NITyr exceeded 25 μg/mL or the action time of NITyr exceeded 48 h, numerous cells died, and the phenomenon of cell migration could not apparently be observed; thus, the effects of NITyr within 48 h were observed. The scratch test simulated the processes of migration of A549 cells, and we analyzed the scratch width of cells to assess the migration of cells (Yi et al., 2021). The study demonstrated that NITyr remarkably prevented cell migration. Furthermore, the effects of NITyr at 12 h and 24 h were similar, indicating that its impact was not time-dependent. In the apoptosis experiment, NITyr mainly promoted the late apoptosis of cells, and the ratio of apoptotic cells gradually increased in a dose- and time-dependent manner, suggesting that NITyr could inhibit cell viability by promoting apoptosis.
Studies showed that CB1 and CB2 receptors regulate the growth, apoptosis, and migration of tumor cells (Preet et al., 2008; Elbaz et al., 2015; Mayor and Etienne-Manneville, 2016); thus, we further observed whether the effect of NITyr was related to CB1 and CB2 receptors. In the following experiment, we added CB1 and CB2 receptor inhibitors to observe the effect of NITyr on NSCLC. AM251 and AM630 inhibited the effect of NITyr on cell viability and migration. Moreover, AM630, but not AM251, was discovered to attenuate the expression of Bax induced by NITyr. The aforementioned results suggested that NITyr had anti-NSCLC effects by upregulating the expression of Bax mediated by CB2 receptors.
AEA analogs regulate PI3K, ERK, and JNK pathways via the activation of CB1/2 receptors (Sanchez et al., 2003; Ravi et al., 2014; Boyacioglu et al., 2021). PI3K possessed serine/threonine kinase activities. The p85 subunit of PI3K aggregated near the cell membrane when it received signals from the tyrosine kinase or G protein-coupled receptor, thereby promoting cell proliferation, inhibiting cell apoptosis, and ultimately promoting cell survival. The studies reported that the PI3K/Akt pathway was heavily implicated in tumorigenesis and the progression of NSCLC (Tan, 2020). ERK1/2 is an extracellular regulatory protein kinase that transmits signals from the surface receptor to the nucleus, thus mediating the reproduction of cells, discrepancy, and survival (Cagnol and Chambard, 2010). Moreover, excessive activation of ERK has been discovered in many tumor cells. Additionally, various compounds with anti-cancer properties have been indicated to lead to apoptosis in an ERK activation-dependent manner (Sugiura et al., 2021). JNK is a mitogen-activated protein kinase signaling pathway in mammalian cells. It not only plays the most crucial role in many physiological and pathological processes, such as cell proliferation, apoptosis, and stress but also plays a bigger role in the occurrence and development of tumors (Wu et al., 2019). The activation of the JNK pathway induces cell apoptosis in NSCLC (Tan et al., 2019).
In this study, the self-synthesized cannabinoid analog - NITyr - was used in an experimental group, and it significantly inhibited the proliferation and migration of A549 cells, promoted cell apoptosis, blocked the cell cycle, and upregulated the expression of apoptosis-related proteins (caspase-3, caspase-9, and Bax) and cannabinoid receptors (CB1 and CB2). In addition, NITyr markedly upregulated the proportion of p-ERK/ERK and notably downregulated that of p-PI3K/PI3K, suggesting that NITyr inhibited the growth or promoted apoptosis of NSCLC through the aforementioned pathways.
The original contributions presented in the study are included in the article/Supplementary Materials; further inquiries can be directed to the corresponding author.
Methodology, YH, ZZ, and Y-TL; project administration, YH, Y-TL, ZZ, and Z-YY; data curation and analysis, R-W, Z-CX, Y-QY, and S-YQ; writing—original draft manuscript, SL, Y-YW and TH; writing—review, SL and Y-JL; funding acquisition, SL, TH and Y-JL. All authors contributed to the article and approved the submitted version.
This study was supported by the National Natural Science Foundation of China (grant number 81803514); the Foundation of Science and Technology Department of Sichuan Province (grant number 22NSFSC0727); the National Student Innovation Training Program (grant number S202213705073); the Disciplinary Construction Innovation Team Foundation of Chengdu Medical College (grant number CMC-XK-2104); the Scientific Research Project of Sichuan Medical Association (grant number S19078); the Chengdu Municipal Health Commission (grant number 2020163); the Chengdu Science and Technology Bureau (grant number 2022-YF05-01504-SN).
The authors declare that the research was conducted in the absence of any commercial or financial relationships that could be construed as a potential conflict of interest.
All claims expressed in this article are solely those of the authors and do not necessarily represent those of their affiliated organizations, or those of the publisher, the editors, and the reviewers. Any product that may be evaluated in this article, or claim that may be made by its manufacturer, is not guaranteed or endorsed by the publisher.
The Supplementary Material for this article can be found online at: https://www.frontiersin.org/articles/10.3389/fphar.2023.1164367/full#supplementary-material
Ayakannu, T., Taylor, A. H., and Konje, J. C. (2018). Cannabinoid receptor expression in estrogen-dependent and estrogen independent endometrial cancer. J. Recept Signal Transduct. Res. 38, 385–392. doi:10.1080/10799893.2018.1531890
Boyacıoğlu, Ö., Bilgiç, E., Varan, C., Bilensoy, E., Nemutlu, E., Sevim, D., et al. (2021). ACPA decreases non-small cell lung cancer line growth through Akt/PI3K and JNK pathways in vitro. Cell Death Dis. 12 (1), 56. doi:10.1038/s41419-020-03274-3
Cagnol, S., and Chambard, J. (2010). ERK and cell death: Mechanisms of ERK-induced cell death—apoptosis, autophagy and senescence. FEBS J. 277, 2–21. doi:10.1111/j.1742-4658.2009.07366.x
Cheng, L., Li, J., Zhou, Y., Zheng, Q., Ming, X., and Liu, S. (2019). N-linoleyltyrosine protects against transient cerebral ischemia in gerbil via CB2 receptor involvement in PI3K/akt signaling pathway. Biol. Pharm. Bull. 42, 1867–1876. doi:10.1248/bpb.b19-00394
Dando, I., Donadelli, M., Costanzo, C., Dalla Pozza, E., D'Alessandro, A., Zolla, L., et al. (2013). Cannabinoids inhibit energetic metabolism and induce AMPK-dependent autophagy in pancreatic cancer cells. Cell Death Dis. 4 (6), e664. doi:10.1038/cddis.2013.151
de Melo Reis, R. A., Isaac, A. R., Freitas, H. R., de Almeida, M. M., Schuck, P. F., Ferreira, G. C., et al. (2021). Quality of life and a surveillant endocannabinoid system. Front. Neurosci. 15, 747229. doi:10.3389/fnins.2021.747229
Elbaz, M., Nasser, M. W., Ravi, J., Wani, N. A., Ahirwar, D. K., Zhao, H., et al. (2015). Modulation of the tumor microenvironment and inhibition of EGF/EGFR pathway: Novel anti-tumor mechanisms of cannabidiol in breast cancer. Mol. Oncol. 9 (4), 906–919. doi:10.1016/j.molonc.2014.12.010
Ellert-Miklaszewska, A., Ciechomska, I. A., and Kaminska, B. (2021). Synthetic cannabinoids induce autophagy and mitochondrial apoptotic pathways in human glioblastoma cells independently of deficiency in TP53 or PTEN tumor suppressors. Cancers (Basel) 13 (3), 419. doi:10.3390/cancers13030419
Hinz, B., and Ramer, R. (2019). Anti-tumour actions of cannabinoids. Br. J. Pharmacol. 176 (10), 1384–1394. doi:10.1111/bph.14426
Huang, T., Xu, T., Wang, Y., Zhou, Y., Yu, D., Wang, Z., et al. (2021). Cannabidiol inhibits human glioma by induction of lethal mitophagy through activating TRPV4. Autophagy 17 (11), 3592–3606. doi:10.1080/15548627.2021.1885203
Khodadadi, H., Salles, E. L., Alptekin, A., Mehrabian, D., Rutkowski, M., Arbab, A. S., et al. (2021). Inhalant cannabidiol inhibits glioblastoma progression through regulation of tumor microenvironment. Cannabis Cannabinoid Res. doi:10.1089/can.2021.0098
Kisková, T., Mungenast, F., Suváková, M., Jäger, W., and Thalhammer, T. (2019). Future aspects for cannabinoids in breast cancer therapy. Int. J. Mol. Sci. 20 (7), 1673. doi:10.3390/ijms20071673
Kuc, C., Jenkins, A., and Van Dross, R. T. (2012). Arachidonoyl ethanolamide (AEA)-induced apoptosis is mediated by J-series prostaglandins and is enhanced by fatty acid amide hydrolase (FAAH) blockade. Mol. Carcinog. 51 (2), 139–149. doi:10.1002/mc.20770
Laezza, C., Pagano, C., Navarra, G., Pastorino, O., Proto, M. C., Fiore, D., et al. (2020). The endocannabinoid system: A target for cancer treatment. Int. J. Mol. Sci. 21 (3), 747. doi:10.3390/ijms21030747
Liu, X., Wu, Y., Zhou, D., Xie, Y., Zhou, Y., Lu, Y., et al. (2020). N-Linoleyltyrosine protects PC12 cells against oxidative damage via autophagy: Possible involvement of CB1 receptor regulation. Int. J. Mol. Med. 46 (5), 1827–1837. doi:10.3892/ijmm.2020.4706
Long, C. M., Zheng, Q. X., Zhou, Y., Liu, Y. T., Gong, L. P., Zeng, Y. C., et al. (2021). N-linoleyltyrosine exerts neuroprotective effects in APP/PS1 transgenic mice via cannabinoid receptor-mediated autophagy. J. Pharmacol. Sci. 147 (4), 315–324. doi:10.1016/j.jphs.2021.08.008
Lu, H. C., and Mackie, K. (2021). Review of the endocannabinoid system. Biol. Psychiatry Cogn. Neurosci. Neuroimaging 6 (6), 607–615. doi:10.1016/j.bpsc.2020.07.016
Mangal, N., Erridge, S., Habib, N., Sadanandam, A., Reebye, V., and Sodergren, M. H. (2021). Cannabinoids in the landscape of cancer. J. Cancer Res. Clin. Oncol. 147 (9), 2507–2534. doi:10.1007/s00432-021-03710-7
Mayor, R., and Etienne-Manneville, S. (2016). The front and rear of collective cell migration. Nat. Rev. Mol. Cell Biol. 17 (2), 97–109. doi:10.1038/nrm.2015.14
Meccariello, R. (2020). Endocannabinoid system in Health and disease: Current situation and future perspectives. Int. J. Mol. Sci. 21 (10), 3549. doi:10.3390/ijms21103549
Milian, L., Mata, M., Alcacer, J., Oliver, M., Sancho-Tello, M., Martín de Llano, J. J., et al. (2020). Cannabinoid receptor expression in non-small cell lung cancer. Effectiveness of tetrahydrocannabinol and cannabidiol inhibiting cell proliferation and epithelial-mesenchymal transition in vitro. PLoS One 15, e0228909. doi:10.1371/journal.pone.0228909
Pasquariello, N., Catanzaro, G., Marzano, V., Amadio, D., Barcaroli, D., Oddi, S., et al. (2009). Characterization of the endocannabinoid system in human neuronal cells and proteomic analysis of anandamide-induced apoptosis. J. Biol. Chem. 284 (43), 29413–29426. doi:10.1074/jbc.M109.044412
Pellati, F., Borgonetti, V., Brighenti, V., Biagi, M., Benvenuti, S., and Corsi, L. (2018). Cannabis sativa L. And nonpsychoactive cannabinoids: Their chemistry and role against oxidative stress, inflammation, and cancer. Biomed. Res. Int. 2018, 1691428. doi:10.1155/2018/1691428
Preet, A., Ganju, R. K., and Groopman, J. E. (2008). Delta9-tetrahydrocannabinol inhibits epithelial growth factor-induced lung cancer cell migration in vitro as well as its growth and metastasis in vivo. Oncogene 27 (3), 339–346. doi:10.1038/sj.onc.1210641
Preet, A., Qamri, Z., Nasser, M. W., Prasad, A., Shilo, K., Zou, X., et al. (2011). Cannabinoid receptors, CB1 and CB2, as novel targets for inhibition of non-small cell lung cancer growth and metastasis. Cancer Prev. Res. (Phila). 4 (1), 65–75. doi:10.1158/1940-6207.CAPR-10-0181
Proto, M. C., Gazzerro, P., Di Croce, L., Santoro, A., Malfitano, A. M., Pisanti, S., et al. (2012). Interaction of endocannabinoid system and steroid hormones in the control of colon cancer cell growth. J. Cell Physiol. 227 (1), 250–258. doi:10.1002/jcp.22727
Ravi, J., Sneh, A., Shilo, K., Nasser, M. W., and Ganju, R. K. (2014). FAAH inhibition enhances anandamide mediated anti-tumorigenic effects in non-small cell lung cancer by downregulating the EGF/EGFR pathway. Oncotarget 5 (9), 2475–2486. doi:10.18632/oncotarget.1723
Sanchez, M. G., Ruiz-Llorente, L., Sanchez, A. M., and Diaz-Laviada, I. (2003). Activation of phosphoinositide 3-kinase/PKB pathway by CB(1) and CB(2) cannabinoid receptors expressed in prostate PC-3 cells. Involvement in Raf-1 stimulation and NGF induction. Cell Signal 15 (9), 851–859. doi:10.1016/s0898-6568(03)00036-6
Shah, S. A., Gupta, A. S., and Kumar, P. (2021). Emerging role of cannabinoids and synthetic cannabinoid receptor 1/cannabinoid receptor 2 receptor agonists in cancer treatment and chemotherapy-associated cancer management. J. Cancer Res. Ther. 17 (1), 1–9. doi:10.4103/jcrt.JCRT_488_18
Siegel, R. L., Miller, K. D., Fuchs, H. E., and Jemal, A. (2021). Cancer statistics, 2021. CA Cancer J. Clin.;71(1):7–33. doi:10.3322/caac.21654
Slivicki, R. A., Xu, Z., Mali, S. S., and Hohmann, A. G. (2019). Brain permeant and impermeant inhibitors of fatty-acid amide hydrolase suppress the development and maintenance of paclitaxel-induced neuropathic pain without producing tolerance or physical dependence in vivo and synergize with paclitaxel to reduce tumor cell line viability in vitro. Pharmacol. Res. 142, 267–282. doi:10.1016/j.phrs.2019.02.002
Sugiura, R., Satoh, R., and TakasakiERK, T. (2021). Erk: A double-edged sword in cancer. ERK-dependent apoptosis as a potential therapeutic strategy for cancer. Cells 10 (10), 2509. doi:10.3390/cells10102509
Tan, A. C. (2020). Targeting the PI3K/Akt/mTOR pathway in non-small cell lung cancer (NSCLC). Thorac. Cancer 11 (3), 511–518. doi:10.1111/1759-7714.13328
Tan, B., Huang, Y., Lan, L., Zhang, B., Ye, L., Yan, W., et al. (2019). Bruceine D induces apoptosis in human non-small cell lung cancer cells through regulating JNK pathway. Biomed. Pharmacother. 117, 109089. doi:10.1016/j.biopha.2019.109089
Volmar, M. N. M., Cheng, J., Alenezi, H., Richter, S., Haug, A., Hassan, Z., et al. (2021). Cannabidiol converts NF-κB into a tumor suppressor in glioblastoma with defined antioxidative properties. Neuro Oncol. 23 (11), 1898–1910. doi:10.1093/neuonc/noab095
Wang, K., Wang, Q., Li, Q., Zhang, Z., Gao, J., Fan, C., et al. (2021). Cannabinoid WIN55212-2 inhibits human glioma cell growth by triggering ROS-mediated signal pathways. Biomed. Res. Int. 2021, 6612592. doi:10.1155/2021/6612592
Willoughby, K. A., Moore, S. F., Martin, B. R., and Ellis, E. F. (1997). The biodisposition and metabolism of anandamide in mice. J. Pharmacol. Exp. Ther. 282, 243–247.
Wu, Q., Wu, W., Fu, B., Shi, L., Wang, X., and Kuca, K. (2019). JNK signaling in cancer cell survival. Med. Res. Rev. 39 (6), 2082–2104. doi:10.1002/med.21574
Ye, L., Cao, Z., Wang, W., and Zhou, N. (2019). New insights in cannabinoid receptor structure and signaling. Curr. Mol. Pharmacol. 12 (3), 239–248. doi:10.2174/1874467212666190215112036
Yi, S., Li, Z., Wang, X., Du, T., and Chu, X. (2021). Circ_0001806 promotes the proliferation, migration and invasion of NSCLC cells through miR-1182/NOVA2 Axis. NOVA2 Axis 13, 3067–3077. doi:10.2147/CMAR.S290059
Keywords: N-linoleyltyrosine, non-small cell lung cancer, phosphatidylinositol 3-kinase, extracellular signal-regulated kinase, c-Jun NH2-terminal kinase
Citation: Hu Y, Zhao Z, Liu Y-T, Xu Z-C, Li J-Y, Yang Z-Y, Rui-Wang , Yang Y-Q, Zhang J-H, Qiu S-Y, He T, Wu Y-Y and Liu S (2023) N-linoleyltyrosine resisted the growth of non-small cell lung cancer cells via the regulation of CB1 and CB2 involvement of PI3K and ERK pathways. Front. Pharmacol. 14:1164367. doi: 10.3389/fphar.2023.1164367
Received: 12 February 2023; Accepted: 22 May 2023;
Published: 08 June 2023.
Edited by:
Rong Li, Guilin Medical University, ChinaCopyright © 2023 Hu, Zhao, Liu, Xu, Li, Yang, Rui-Wang, Yang, Zhang, Qiu, He, Wu and Liu. This is an open-access article distributed under the terms of the Creative Commons Attribution License (CC BY). The use, distribution or reproduction in other forums is permitted, provided the original author(s) and the copyright owner(s) are credited and that the original publication in this journal is cited, in accordance with accepted academic practice. No use, distribution or reproduction is permitted which does not comply with these terms.
*Correspondence: Sha Liu, MTAyMDE1MDA1QGNtYy5lZHUuY24=; Tao He, MTc4OTYxODMwQHFxLmNvbQ==; Yi-Ying Wu, MTE3NTU0NzVAcXEuY29t
†These authors have contributed equally to this work
Disclaimer: All claims expressed in this article are solely those of the authors and do not necessarily represent those of their affiliated organizations, or those of the publisher, the editors and the reviewers. Any product that may be evaluated in this article or claim that may be made by its manufacturer is not guaranteed or endorsed by the publisher.
Research integrity at Frontiers
Learn more about the work of our research integrity team to safeguard the quality of each article we publish.