 Fan Liu
 Hanxi Yi3
 Lei Wang
 Zeneng Cheng
 Guoqing Zhang
- 1Xiangya School of Pharmaceutical Sciences, Central South University, Changsha, Hunan, China
- 2Department of Neurology, Xiangya Hospital, Central South University, Changsha, Hunan, China
- 3School of Basic Medicine, Central South University, Changsha, Hunan, China
- 4Department of Rheumatology and Immunology, The Second Clinical Medical College, Jinan University (Shenzhen People's Hospital), Shenzhen, China
- 5Integrated Chinese and Western Medicine Postdoctoral Research Station, Jinan University, Guangzhou, China
The in vivo performances of most drugs after extravascular administration are fitted well with the two-compartment pharmacokinetic (PK) model, but the estimation of absorption rate constant (ka) for these drugs becomes difficult during unavailability of intravenous PK data. Herein, we developed a novel method, called the direct method, for estimating the ka values of drugs without using intravenous PK data, by proposing a new PK parameter, namely, maximum apparent rate constant of disposition (kmax). The accuracy of the direct method in ka estimation was determined using the setting parameters (k12, k21, and k10 values at high, medium, and low levels, respectively) and clinical data. The results showed that the absolute relative error of ka estimated using the direct method was significantly lower than that obtained using both the Loo-Riegelman method and the statistical moment method for the setting parameters. Human PK studies of telmisartan, candesartan cilexetil, and tenofovir disoproxil fumarate indicated that the ka values of these drugs were accurately estimated using the direct method based on good correlations between the ka values and other PK parameters that reflected the absorption properties of drugs in vivo (Tmax, Cmax, and Cmax/AUC0-t). This novel method can be applied in situations where intravenous PK data cannot be obtained and is expected to provide valuable support for PK evaluation and in vitro-in vivo correlation establishment.
1 Introduction
The absorption rate of drugs refers to the rate at which the drug enters systemic circulation after passing through the mucosal lining since extravascular administration (i.e., orally, perorally, rectally, etc.), and this rate consequently affects the peak time (Tmax) and peak concentration (Cmax) of drugs in vivo (Tozer et al., 1996). Quantitative assessment of the drug absorption rate constant (ka) plays a vital role in the pharmaceutical industry. For instance, the correlation between the in vivo absorption rate and the in vitro dissolution rate (IVIVC) of a dosage form can predict the bioavailability of a drug and help avoid excessive number of clinical trials (Zhang et al., 2021). According to the U.S. Food and Drug Administration (FDA), proprietary preparations with identical active pharmaceutical ingredients are regarded as bioequivalents if the rate and extent of drug absorption between the test and reference formulations do not show any significant differences (FDA, 2003). To date, several methods have been widely employed for ka estimation, and can be classified into two different categories: i) methods based on the compartmental pharmacokinetic (PK) model, including the Wagner-Nelson method (suitable for the one-compartment PK model) and the Loo-Riegelman method (suitable for the two-compartment PK model); ii) methods based on the non-compartmental PK model, including the numerical deconvolution method and the statistical moment method.
In addition to the absorption and elimination phases, the two-compartment model for a drug includes a distribution phase, where the drug is distributed from a central compartment to a peripheral compartment; this model differs from the one-compartment model that treats the body as one uniform component (Figures 1A, D). In this case, the Loo-Riegelman method is the classic method, as it considers the distribution phase for estimating the ka values of drugs with the two-compartment model. This method requires the data of PK parameters including k10 (first-order elimination rate constant), k12 (first-order rate constant of the drugs transfer from the central compartment to the peripheral compartment), and k21 (first-order rate constant of the drugs transfer from the peripheral compartment to the central compartment); these data need to be obtained from the intravenous administration of the corresponding drugs to estimate their ka (Wagner, 1975). The numerical deconvolution method calculates the ka of drugs and does not involve the limitations of the compartmental model, but it requires the same sampling time and intervals for both intravenous and extravascular administrations (Yu et al., 1996). Thus, intravenous PK data are necessary for estimating the ka when using either the Loo-Riegelman method or the numerical deconvolution method. However, determining the intravenous PK parameters of drugs is challenging if they can be administered only through the extravascular route because of safety concerns in human volunteers.
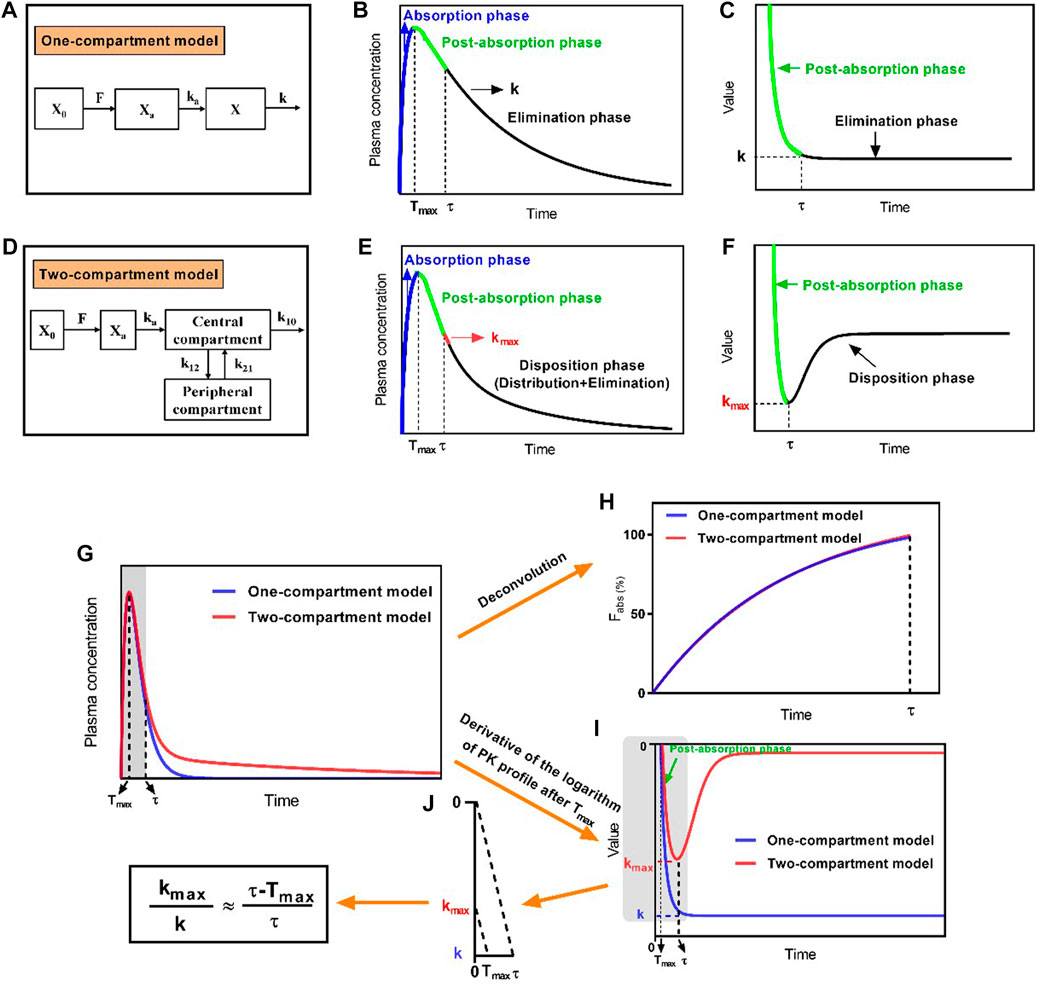
FIGURE 1. Schematic diagram of the development of the direct method by proposing the maximum apparent rate constant of disposition (kmax) and its corresponding time point (τ) in the two-compartment model. (A) Schematic diagram of the extravascular administration for the one-compartment model, (B) characteristic profile of the one-compartment model, and (C) derivative of the logarithmic plasma drug concentration–time profile after Tmax, which shows an invariable elimination rate constant (k); (D) schematic diagram of the extravascular administration for the two-compartment model, (E) characteristic profile of the two-compartment model, and (F) derivative of the logarithmic plasma drug concentration–time profile after Tmax, for which the kmax and its corresponding time point of τ were available; (G) plasma drug concentration–time profile of drugs fitting the one-compartment model or two-compartment model; (H) absorption profiles of drugs after deconvolution; (I) derivative of the logarithmic plasma drug concentration–time profiles; (J) The relationship of
The statistical moment method can also be applied to the non-compartmental PK model by applying overall random variables obtained from the in vivo process of drugs. ka is estimated by calculating the difference in mean residence time (MRT) between various types of administrations to avoid the use of intravenous PK data. However, many factors affect the accuracy of ka estimated using the statistical moment method, such as the precision of detecting low plasma drug concentration and the lack of appropriate data for determining the logarithmic linearity in the terminal phase that yields the accurate elimination rate constant (kT) (Riegelman and Collier, 1980). Therefore, the deficiency in intravenous PK data or poor accuracy of the method hinders ka estimation for drugs with the two-compartment model.
Generally, the plasma concentration (C) and ka of drugs for extravascular administration in the one-compartment model had the following relationship (Eq. 1):
where F is the drug bioavailability, X0 is the dose, V is the apparent volume of distribution, and k is the elimination rate constant. When differentiating with respect to time t, it gets the following equation:
As the plasma drug concentration reached the Cmax (i.e.,
When the PK model was not considered, the concentration–time curve consisted of two sections: the first-order rate increase curve and the first-order rate decrease curve. The basic formula satisfied
In the present study, a new parameter, namely, maximum apparent rate constant of disposition (kmax), was defined to develop a novel method (named as “the direct method”) for ka estimation. The accuracy of ka estimated using the direct method was investigated by setting the k12, k21, and k10 values at high, medium, and low levels, respectively, after the relationship and range of these parameters were determined from previously published reports. Additionally, the accuracy of the ka value estimated using the direct method was compared with the accuracies determined using the Loo-Riegelman method and the statistical moment method. Three model drugs (telmisartan (TMS), candesartan cilexetil (CSC), and tenofovir disoproxil fumarate (TDF)) with different formulations were selected, and their PK parameters were assessed in humans. The direct method was used to estimate the ka values of three model drugs, and from the results, correlations were established between their estimated ka values and the other PK parameters that reflected the absorption properties of the drugs in vivo. These correlations were analyzed to verify the accuracy of the direct method in estimating the ka value of drugs.
2 Materials and methods
2.1 Materials
Tablet dosage forms with different immediate-release (IR) formulations, including TMS (FM1 and FM2, specifications: 80 mg), CSC (FC1 and FC2, specifications: 4 mg), and TDF (FD1 and FD2, specifications: 300 mg), were kindly supplied by three different pharmaceutical companies.
2.2 Development of the direct method for ka estimation
2.2.1 Definition of kmax
Unlike the one-compartment model, which has an invariable value of k (Figure 1B), the plasma drug concentration–time curve that fixed well with the two-compartment model was divided into three phases: the absorption phase, post-absorption phase, and disposition phase (i.e., sum of the distribution and elimination phase; Figure 1E). The portion of the curve before Tmax represented the absorption phase, during which the rate of increasing plasma drug concentration was significantly higher than the rate of its disposition, and the portion of the curve after Tmax represented the post-absorption phase, during which the disposition rates of the drugs were higher than the absorption rates. Thereafter, the disposition rate gradually decreased until it reached an invariable terminal elimination process. At the end time of the post-absorption phase (τ), the absorption phase had completed; thus, only the disposition phase remained. This phase presented the highest apparent rate of drug disposition (kmax) at the first time interval after τ (Figure 1E). Moreover, the derivative of the logarithm of the plasma drug concentration–time profile reflected the real-time rate of decreasing drug concentration (i.e., the slope of the logarithmic PK curve after Tmax), which gradually increased and then remained at a constant rate (k) for the one-compartment model because of the presence of the post-absorption phase after Tmax (Figure 1C). By contrast, the rate of declining drug concentration continuously showed changes in the order of increase, decrease, and constant that presented the kmax at τ for the two-compartment model (Figure 1F).
2.2.2 Development of the direct method
The ka, X0, F, and V in the one-compartment model and two-compartment model were set as the same values, as well as k = k12 + k10. The absorption phase, post-absorption phase, and disposition phase satisfied first-order kinetics. The absorption phases of two simulated drug concentration–time curves had almost overlapped (Figure 1G). The absorption profiles had also overlapped after deconvolution (Figure 1H). The absorption was complete at time point τ, which corresponded to kmax. After the derivative of the logarithmic plasma drug concentration–time profile, kmax and k showed unequal values, and the value of kmax was always less than that of k, but the value of τ was always greater than that of Tmax. When the values of kmax, k, Tmax, and τ were extracted from Figure 1I, the four parameters had the following relationship after proportional scaling of triangles (Eq. 4; Figure 1J).
Equation 4 was transformed into Eq. 5:
Thus, Eq. 3 was approximately transformed into Eq. 6 using the relationship established in Eq. 5.
In this case, the values of Tmax were obtained from the plasma drug concentration–time curves, and the values of kmax and τ were obtained from the logarithm of the plasma drug concentration–time curves for the two-compartment model after extravascular administration. Subsequently, ka was estimated using Newton’s iteration method with the Python software package (version 3.6.7). Therefore, the direct method did not require measurement of the intravenous concentration of drugs.
2.3 Validation of the direct method by setting parameters
2.3.1 Parameter setting and model judgment
To ensure that the setting parameters satisfied the two-compartment model, the human plasma drug concentration–time curves of 36 drugs fitting the two-compartment model in the fasted or fed states were obtained from previously published reports, and the corresponding data were extracted using GetData Graph Digitizer software (version 2.25, https://www.getdata-graph-digitizer.com/). The preliminary ka, k12, k21, and k10 values of these drugs were calculated using WinNonlin software (version 8.2, Certara Co., United States), which were attributed to the inability to obtain these parameters from the literature.
The ka, k12, k21, and k10 values were sorted in the descending order. The average values of the top one-third, middle one-third, and bottom one-third of these data (n = 12) were set as high, medium, and low levels, respectively. Then, the different levels of each parameter were combined randomly. Plasma drug concentration was calculated at different time points (intervals of 0.1 h) after factoring the setting parameters (ka, k12, k21, and k10) into the following Eqs 7–9:
where X0, F, and Vc were randomly set as fixed values (e.g., X0 = 2,200 μg, F = 1, Vc = 10 L). The α and β variables in Eq. 7, which represent the distribution phase mixed first-order rate constant and the elimination phase mixed first-order rate constant, respectively, were determined using Eqs 8, 9:
Furthermore, the Akaike information criteria (AIC) values were calculated using Eqs 10, 11 to evaluate the compartmental model of the drug concentration–time curves.
where N is the number of experimental groups, Re is the sum of squares of the weighted residuals, p is the number of model parameters, Wi is the weight coefficient, Ci is the experimental plasma drug concentration, and Ĉi is the estimated plasma drug concentration. The AIC values of drugs in the one-compartment model and two-compartment model were calculated; the smaller the AIC value, the better the fitting (Kadam et al., 2013).
2.3.2 Estimation of ka using the direct method
Tmax was determined from the data of the plasma drug concentration–time curves of the setting parameters. The kmax was fitted from the slope of the logarithm of plasma drug concentration–time curve at the first time interval after the time point τ. The ka value was then estimated using the direct method (Eq. 6). The accuracy of ka estimation was calculated by comparing the estimated ka from Eq. 6 to the setting value of ka (i.e., the true ka value) using Eq. 12:
2.3.3 Estimation of ka using the Loo-Riegelman method
The setting k12, k21, and k10 values were used to estimate the ka value using the Loo-Riegelman method. Briefly, ka was calculated using the following equation (Eq. 13):
and the in vivo absorption fraction (Fabs) was obtained using Eq. 14:
The
where
2.3.4 Estimation of ka using the statistical moment method
The ka value determined upon fitting the plasma drug concentration–time data of the setting parameters with the statistical moment method was compared with that determined upon fitting plasma drug concentration–time data with the direct method. The calculation of the statistical moment method performed to make this comparison is shown in Eq. 16:
where MAT is the average absorption time, MRT is the average residence time after extravascular administration, and kT is the elimination rate constant at the terminal phase. The area under the plasma drug concentration–time curve (AUC) was calculated using the trapezoidal method. AUMC, which represented the area under the moment curve, was calculated using Eq. 17:
where Ci, Ci+1, and Cn are the drug concentrations at time points ti, ti+1, and tn, respectively.
2.4 Validation of the direct method using clinical data
2.4.1 Clinical data of the model drugs
The plasma concentrations of three model drugs, namely, TMS, CSC, and TDF, were obtained from PK studies involving healthy human volunteers. The clinical studies were conducted in accordance with the Declaration of Helsinki, and the experimental protocols were approved by the Chinese Food and Drug Administration (CFDA) and the Institutional Research Ethics Committee of Xiangya School of Pharmacy, Central South University (project code: 2020006). All enrolled volunteers were fully informed of the protocol of the clinical studies, and their consents to participate were approved. PK studies had randomized, open-label, and single-dose designs, wherein the PK parameters were compared after the oral administration of different formulations containing TMS, CSC, or TDF.
Briefly, PK studies of TMS tablets were conducted with a two-way crossover design on 26 healthy volunteers in the fasted state, which included a 7-day washout period between treatments. Blood samples were collected in heparin-containing vacutainers before administration (0 h) and 0.17, 0.33, 0.5, 0.75, 1, 1.25, 1.5, 2, 2.5, 3, 4, 6, 8, 10, 12, 24, 48, 72, and 96 h after the administration of the FM1 or FM2 tablets.
PK studies of CSC tablets were conducted with a two-way crossover design on 24 volunteers in the fasted state, which included a 7-day washout period between treatments. Blood samples were collected in heparin-containing vacutainers before administration (0 h) and 0.33, 0.67, 1, 1.33, 1.67, 2, 2.33, 2.67, 3, 4, 6, 8, 12, 24, and 48 h after the administration of the FC1 or FC2 tablets.
PK studies of TDF tablets were conducted with a two-way crossover design on 24 volunteers in the fasted state and the fed state (the fed state consisted of a high-fat meal with a nutritional composition of 522-kcal fat, 288-kcal carbohydrates, 149-kcal protein, and 959-kcal total calories). Studies of TDF tablets featured the 7-day washout period between treatments. Blood samples were collected in heparin-containing vacutainers before administration (0 h) and 0.25, 0.5, 1, 1.5, 2, 2.5, 3, 3.5, 4, 5, 6, 8, 10, 12, 24, 36, and 48 h after the administration of the FD1 or FD2 tablets.
All blood samples were centrifuged at 3,500 rpm for 10 min. The plasma samples were separated and then stored at −70°C until analysis by high-performance liquid chromatography-tandem mass spectrometry (Agilent, United States).
2.4.2 Determination of PK parameters
CSC and TDF were rapidly and completely hydrolyzed to candesartan and tenofovir in the plasma, respectively, after absorption from the gastrointestinal tract (Gleiter and Morike, 2002; Kearney et al., 2004). The U.S. FDA recommended the detection of plasma concentrations of candesartan and tenofovir in human PK studies of CSC tablet (FDA, 2008) and TDF tablet (FDA, 2012), respectively. PK parameters, namely, Cmax, Tmax, AUC0-t, AUC0-∞, and elimination half-life (t1/2), of TMS, candesartan, and tenofovir were calculated using the WinNonlin software package. All data were expressed as mean ± standard deviation.
2.4.3 Validation of the direct method
The values of kmax and τ for TMS, CSC, and TDF were obtained by calculating the logarithm of the plasma drug concentration–time curves. The ka values for TMS, CSC, and TDF were estimated using the direct method (Eq. 6), statistical moment method (Eq. 16), and Loo-Riegelman method (Eq. 13), respectively. Pearson’s correlation analysis (SPSS 25.0; SPSS Inc., United States) was performed to evaluate the relationship between the ka values and other PK parameters that reflected the absorption properties of the drugs in vivo (Tmax, Cmax, and Cmax/AUC0-t). Furthermore, the absorption rate versus time profiles were fitted using Eq. 18:
2.5 Statistical analysis
All statistical analyses were performed using SPSS software package (version 25.0; SPSS Inc., United States) and assessed using Student’s t-test. Data with p < 0.05 were considered to have a statistically significant difference.
3 Results
3.1 Characteristics of ka, k10, k12, and k21 for drugs with the two-compartment model
The AIC values of 36 IR formulations were determined. All the drugs were more suitable for the two-compartment model because the AIC2 values (for the two-compartment model) were smaller than the AIC1 values (for the one-compartment model; Table 1). The ranges of ka (0.210–1.726 h−1), k12 (0.044–0.847 h−1), k21 (0.010–0.451 h−1), and k10 (0.012–1.003 h−1) were estimated. Interestingly, the sum of k12 and k10 was less than the value of ka for all drugs ((ka > k12 + k10; Table 1). Additionally, the values of ka and k12 were both higher than the values of k21 for all drugs (ka > k12 > k21; Table 1). The mean values of k10 were significantly higher than that of k21 (*p < 0.05), excepted for a few drugs (e.g., acyclovir, daclatasvir, and levonorgestrel), whose k10 values were less than their k21 values. These results provided the rationale for setting the available values of ka, k10, k12, and k21 for the drugs satisfying the two-compartment model.
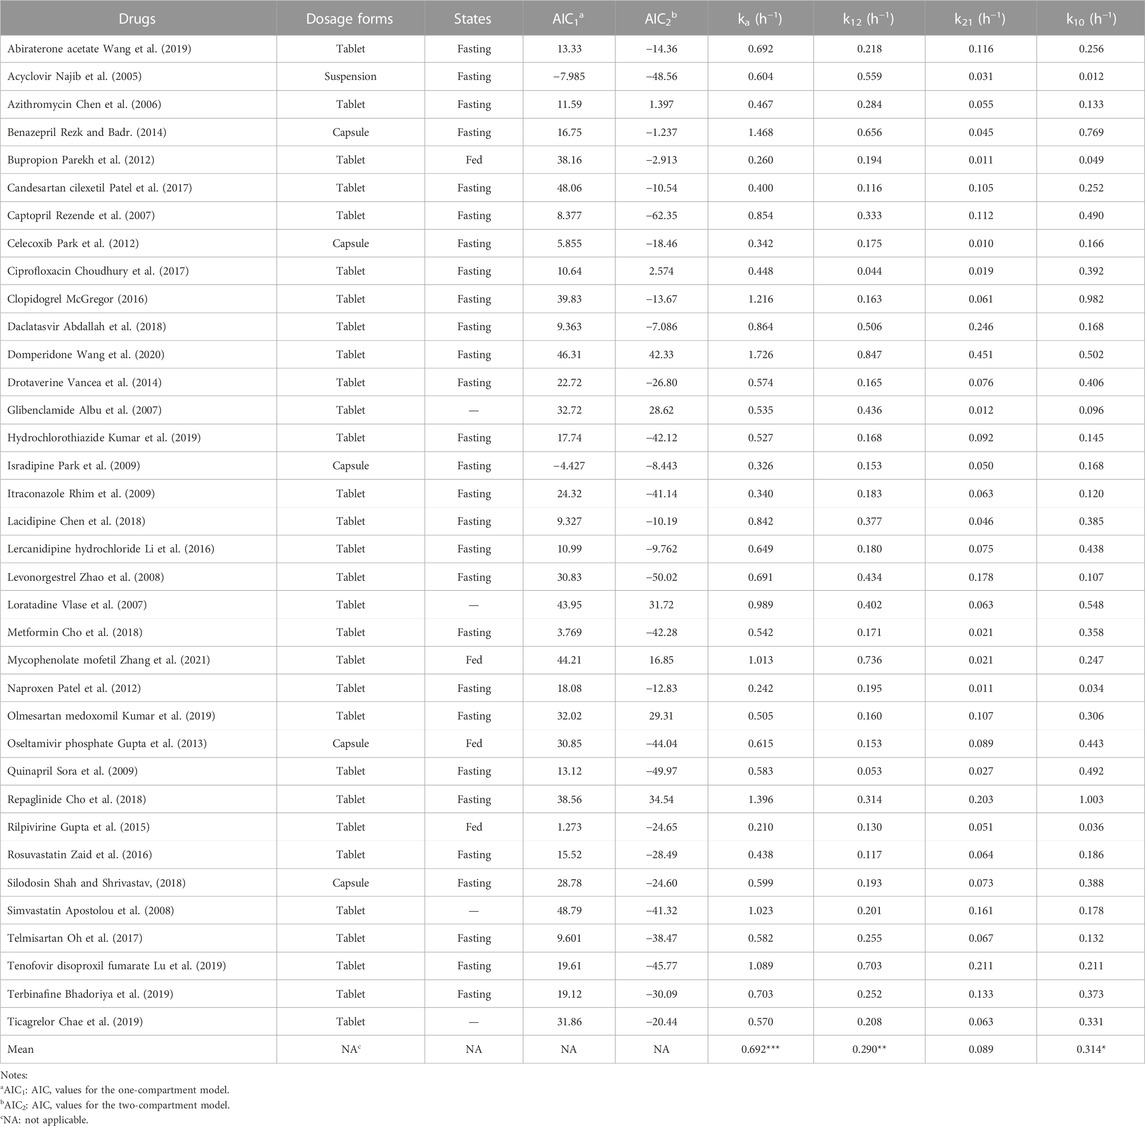
TABLE 1. The values of ka, k10, k12, and k21 of 36 drugs with IR dosage forms estimated using the WinNonlin software in the two-compartment model after oral administrations in human (***p < 0.001 vs k12, k21, k10, respectively; **p < 0.01 vs. k21; *p < 0.05 vs k21 by Student’s t-test).
3.2 Assessing the accuracy of ka estimated using the direct method with the setting parameters
To investigate the accuracy and sensitivity of the direct method, the high, medium, and low values of ka, k12, k21, and k10 were set according to previous reports (Table 1). The setting values of ka were 1.098, 0.603, and 0.375 h−1; the setting values of k12 were 0.525, 0.211, and 0.133 h−1; the setting values of k21 were 0.176, 0.067, and 0.025 h−1; the setting values of k10 were 0.571, 0.271, and 0.100 h−1, respectively (Table 2). Thirty-nine groups were finally obtained with the combination of the values of ka, k12, k21, and k10 based on the relationships among them (ka > k12 + k10, ka > k12 > k21). All groups satisfied the two-compartment model (AIC1 > AIC2; Table 2). The values of Tmax, kmax, and τ were obtained from the drug concentration−time curves of the corresponding group (Figure 2A), which showed that the Tmax increased following a decrease in ka. The values of ka were then estimated using the direct method, Loo-Riegelman method, and statistical moment method. The RE of the ka estimated using the direct method had both positive and negative values when compared with the setting ka (i.e., the true ka value), the values of which were less than 20% in most groups. However, all RE values obtained using the Loo-Riegelman method were positive, wherein estimated ka > true ka. On the contrary, most of the RE values obtained using the statistical moment method were negative, wherein estimated ka < true ka.

TABLE 2. The ka values estimated using the different methods with the setting data (39 groups).
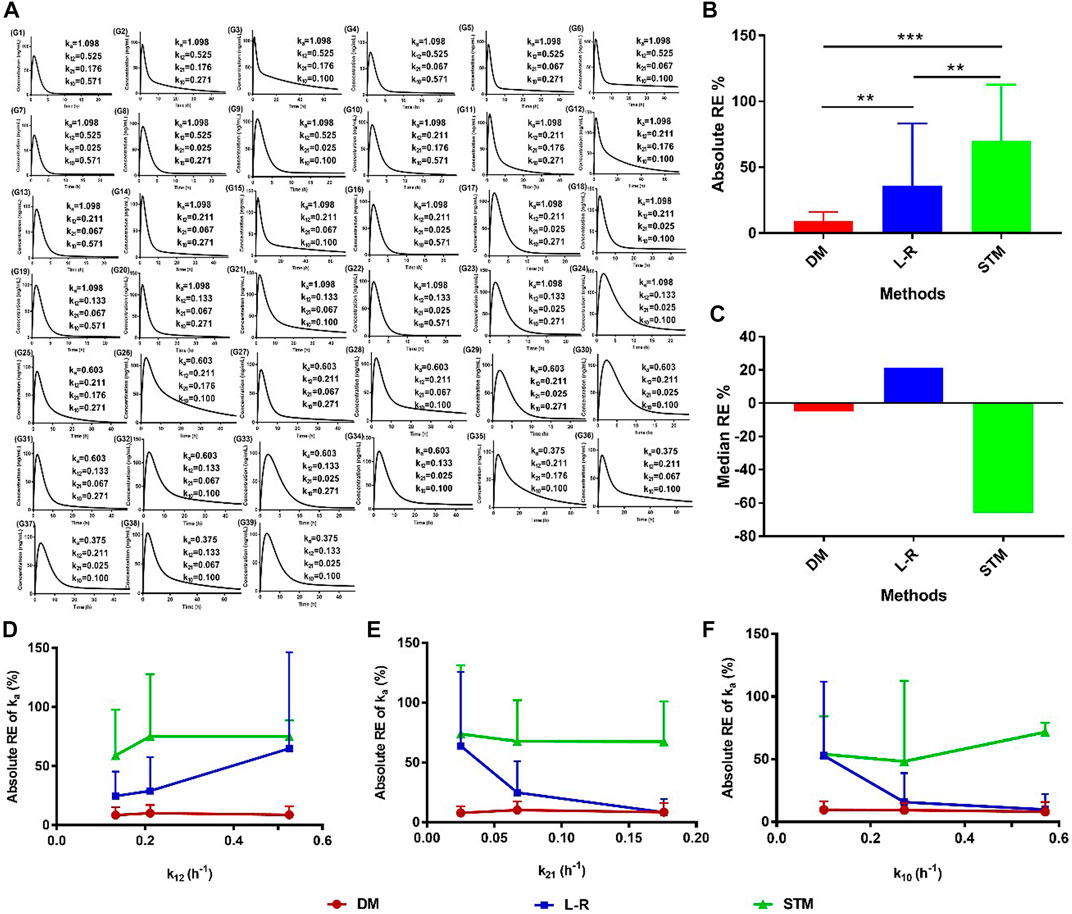
FIGURE 2. Accuracy of the ka estimated using the direct method with the setting parameters. (A) Plasma drug concentration–time profiles of the setting groups; (B) absolute values and (C) median values of RE for the ka values estimated using different methods. Absolute RE of ka with changes in (D) k12, (E) k21, and (F) k10 estimated using different methods. Data are presented as mean ± standard deviation, **p < 0.01 and ***p < 0.001. DM: direct method; L-R: Loo-Riegelman method; RE: relative error; STM: statistical moment method.
The absolute values of RE were calculated, and the data are shown in Figure 2B. The absolute RE of ka estimated using the direct method was significantly less than that estimated using either the statistical moment method (**p < 0.01) or the Loo-Riegelman method (***p < 0.001). The absolute RE of ka estimated using the Loo-Riegelman method was significantly less than that estimated using the statistical moment method (**p < 0.01). The median RE of ka estimated using the direct method (−4.98%) was better than that estimated using the Loo-Riegelman method (21.5%) and the statistical moment method (−65.9%; Figure 2C). The accuracy of ka estimated using the direct method was not affected by changes in k12, k21, and k10, which also demonstrated excellent accuracy when compared with that estimated using the Loo-Riegelman method and the statistical moment method (Figures 2D–F). Therefore, the direct method yielded a more accurate value and did not require the determination of k12, k21, and k10 from intravenous PK measurements.
3.3 Validation of the direct method in human PK studies
The mean plasma drug concentration–time curves of TMS, candesartan, and tenofovir were obtained from PK evaluation in human (Figure 3). The PK parameters are listed in Table 3.
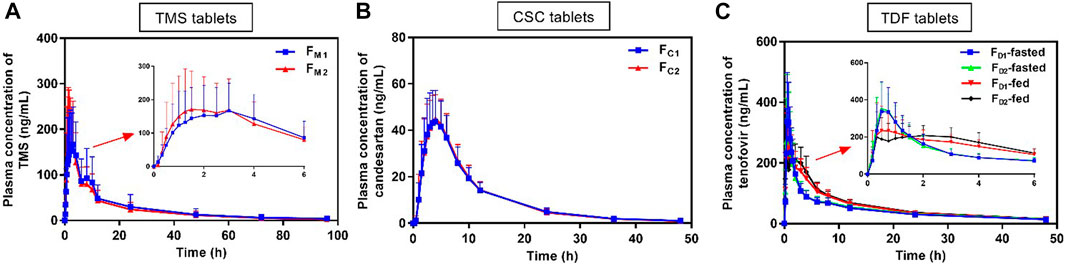
FIGURE 3. Mean plasma concentration versus time profiles of (A) TMS, (B) candesartan (metabolite of CSC), and (C) tenofovir (metabolite of TDF) obtained after the oral administration of TMS (n = 26), CSC (n = 24), and TDF tablets (n = 24) in humans. Data are presented as mean ± standard deviation. CSC: candesartan cilexetil; TDF: tenofovir disoproxil fumarate; TMS: telmisartan.
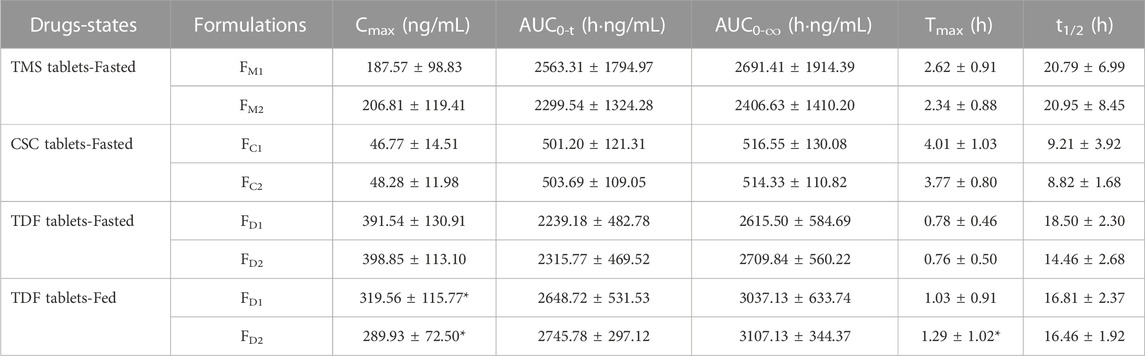
TABLE 3. PK parameters of TMS, candesartan (metabolite of CSC), tenofovir (metabolite of TDF) following administration of single dose of TMS (n = 26), CSC (n = 24) and TDF tablets (n = 24) in the fasted or/and fed state, respectively. Data are presented as mean ± standard deviation, *p < 0.05 vs. the same formulation in the fasted state.
The mean plasma concentrations of FM2 were higher than those of FM1 over a period of 0.5–3.0 h after oral administration (Figure 3A), and the Cmax of FM2 was higher than that of FM1 (Table 3). Overall, the plasma drug concentration–time profiles (Figure 3B) and the PK parameters (Table 3) of FC1 and FC2 were similar. The Cmax of tenofovir in the fed state was significantly lower than that of tenofovir in the fasted state for both FD1 and FD2 (*p < 0.05; Figure 3C; Table 3), and the Tmax of tenofovir in the fed state was also larger than that of tenofovir in the fasted state (*p < 0.05 for FD2). The three model drugs with different Tmax values (0.5–4.0 h) represented low, medium, and high absorption rates of the IR dosage forms.
The ka values of the TMS, CSC, and TDF tablets were estimated using different methods. Data of intravenous PK parameters of TMS were obtained from a previously published report (Stangier et al., 2000) and were used to estimate ka using the Loo-Riegelman method. However, it was difficult to acquire the in vivo data of CSC, TDF, and their respective metabolites (candesartan, tenofovir) after intravenous administration. The ka value for FM2 estimated using the direct method was higher than that of FM1 estimated using the same method. These values had a consistent trend with the estimation of ka using the Loo-Riegelman method, but it had a contrary trend to the estimation of ka using the statistical moment method (Table 4). ka estimated using the direct method for FC1 was similar to that of FC2, whereas ka estimated using the statistical moment method of FC1 was higher than that of FC2. The estimated ka of both FD1 and FD2 in the fasted state was higher than those of FD1 and FD2 in the fed state (*p < 0.05 for FD2). The kmax values of both FD1 and FD2 in the fasted state were also higher than that of FD1 and FD2 in the fed state (*p < 0.05). Moreover, the ka value of FD1 was consistent with that of FD2 estimated using the direct method in the same state. This finding was contrary to that obtained using the statistical moment method, which yielded the ka value of FD1 that was higher than that of FD2.
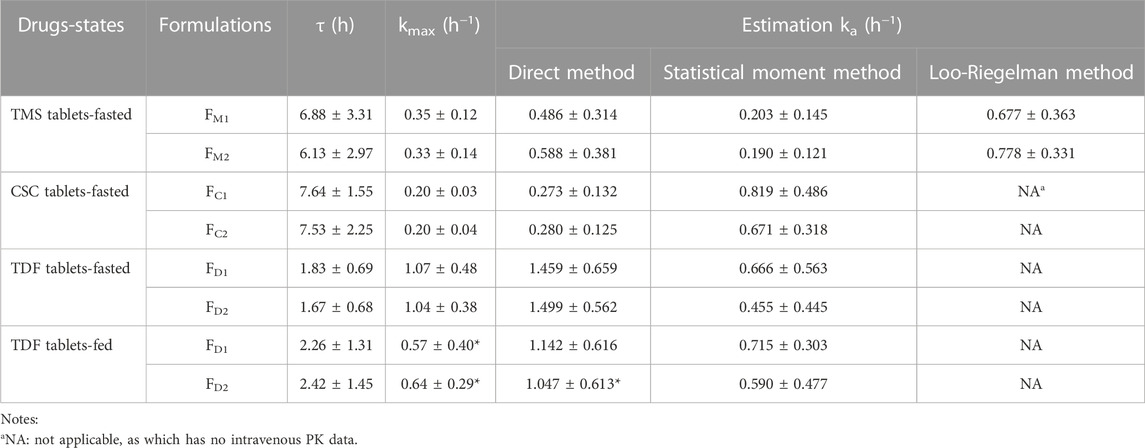
TABLE 4. The ka values estimated using the different method for the TMS, CSC, TDF tablets in the fasted or/and fed state. Data are presented as mean ± standard deviation, *p < 0.05 vs. ka value of the same formulation estimated using the direct method in the fasted state.
The mean absorbed fraction-time profiles of TMS tablets showed that the absorbed fraction of FM2 was faster than those of FM1 using the direct method and the Loo-Riegelman method within the first 4 h (Figures 4A1, B1), which was consistent with the mean plasma drug concentration-time profiles (Figure 3A) and Cmax value of TMS (Table 3). However, the absorption profiles of FM1 and FM2 had nearly overlapped when estimated using the statistical moment method (Figure 4C1), which was inconsistent with their in vivo experimental data. The values of ka estimated using the direct method were positively correlated with both Cmax and Cmax/AUC0-t (correlation coefficient (R) > 0.4, p < 0.01; Figures 4A2, A3) and negatively correlated with Tmax (R = −0.858, p < 0.001; Figure 4A4) as observed in Pearson’s correlation analysis. However, the ka estimated using the Loo-Riegelman method (Figures 4B2–B4) and the statistical moment method (Figures 4C2–C4) demonstrated only slight correlation with these parameters (p > 0.1).
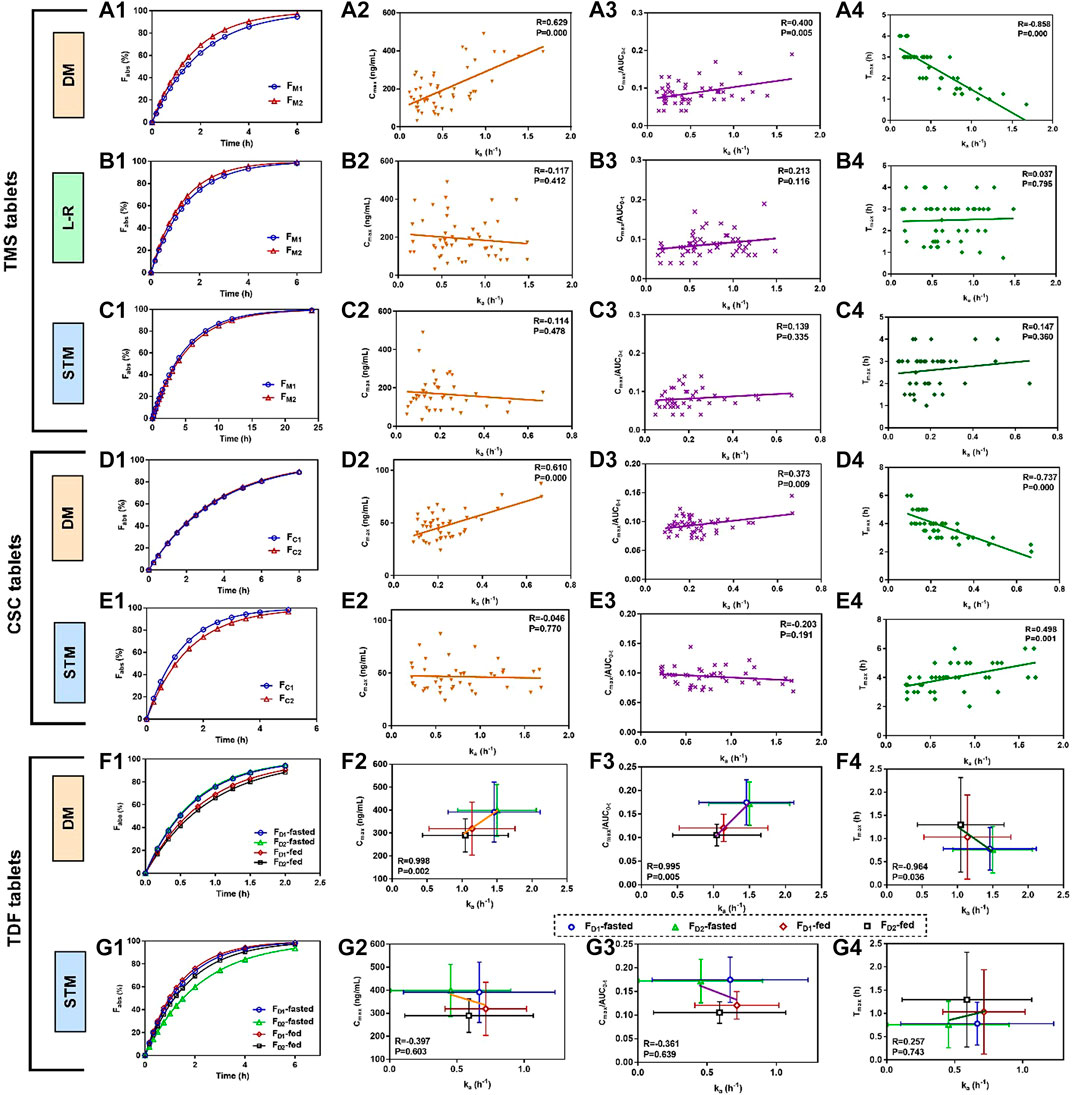
FIGURE 4. Mean absorbed fraction versus time profiles of TMS tablets, CSC tablets, and TDF tablets and correlations between estimated ka values and the other PK parameters that reflected the absorption properties of the drugs in vivo (Tmax, Cmax and Cmax/AUC0-t). (A1) Mean absorbed profiles of TMS tablets estimated using the DM, and the correlations between the values of ka and (A2) Cmax, (A3) Cmax/AUC0-t, (A4) Tmax; (B1) mean absorbed profiles estimated using the L-R method, and the correlations between the values of ka and (B2) Cmax, (B3) Cmax/AUC0-t, (B4) Tmax; (C1) mean absorbed profiles estimated using the STM, and the correlations between the values of ka and (C2) Cmax, (C3) Cmax/AUC0-t, (C4) Tmax; (D1) mean absorbed profiles of CSC tablets estimated using the DM, and the correlations between the values of ka and (D2) Cmax, (D3) Cmax/AUC0-t, (D4) Tmax; (E1) mean absorbed profiles estimated using the STM, and the correlations between the values of ka and (E2) Cmax, (E3) Cmax/AUC0-t and (E4) Tmax. (F1) Mean absorbed profiles of TDF tablets obtained using the DM, and the correlations between the values of ka and (F2) Cmax, (F3) Cmax/AUC0-t, (F4) Tmax; (G1) mean absorbed fraction versus time profiles of TDF tablets obtained using the STM, and the correlations between the values of ka and (G2) Cmax, (G3) Cmax/AUC0-t, and (G4) Tmax. Data of the correlations for TDF tablets are presented as mean ± standard deviation. All correlations were investigated using Pearson’s correlation analysis (p < 0.05 indicates good correlation). CSC: candesartan cilexetil; DM: direct method; L-R method: Loo-Riegelman method; PK: pharmacokinetic; STM: statistical moment data; TDF: tenofovir disoproxil fumarate; TMS: telmisartan.
The similarity in the estimated ka between FC1 and FC2 led to nearly overlapped absorbed fraction-time profiles using the direct method (Figure 4D1). The estimated ka values were positively correlated with both Cmax and Cmax/AUC0-t (p < 0.01; Figures 4D2, D3) and negatively correlated with Tmax (p < 0.001; Figure 4D4). However, these two profiles were not similar when estimated using the statistical moment method (Figure 4E1), which were inconsistent with their in vivo performance (Figure 3B). The ka estimated using the statistical moment method also showed only slight correlation with both Cmax and Cmax/AUC0-t (Figures 4E2, E3), while it was positively correlated with Tmax (Figure 4E4).
The mean absorbed fraction-time profiles of the TDF tablets were obtained after the ka values were estimated using both the direct method (Figure 4F1) and the statistical moment method (Figure 4G1). The absorptions of TDF in both formulations (FD1 and FD2) in the fasted state were higher than that in the fed state when assessed using the direct method. The estimated ka values for FD1 and FD2 were strongly correlated with the corresponding average values of Cmax, Cmax/AUC0-t, and Tmax in both the fed and fasted states (R > 0.96, p < 0.05; Figures 4F2–F4). However, data from the absorption curves were inconsistent with the in vivo concentration data (Figure 3C) when assessed using the statistical moment method (Figure 4G1). Furthermore, the ka estimated using the statistical moment method had only slight correlations with Cmax, Cmax/AUC0-t, and Tmax (p > 0.6; Figures 4G2–G4).
4 Discussion
The ka, k12, k21, and k10 values of drugs with the two-compartment model have shown variation owing to their physicochemical properties and dosage form (Byron and Notari, 1976), but the relationships between these parameters have not been reported. The accuracies of the estimated ka, k12, k21, and k10 values for the IR formulations of drugs are higher than those for the extended-release formulations because the former is affected at a lesser rate by the rate of dissolution in vivo (Franek et al., 2015). In this case, 36 IR dosage forms with different Tmax (0.75–4.0 h) and t1/2 (1.2–52.8 h) values, as well as satisfying the two-compartment model, were used to estimate the ka, k12, k21, and k10 values (Table 1), mainly for investigating the relationships between these parameters. In theory, the value of k12 should be higher than that of k21 (k12 > k21) because of the dynamics of drug distribution from the central compartment to the peripheral compartment. Meanwhile, the absorption rate of a drug needs to be greater than the sum of the distribution and elimination rates (ka > k12 + k10), so that the concentration of a drug can be determined in the plasma after extravascular administration. Elucidating the relationships between these parameters could circumvent any void in setting data for investigations using the direct method. However, the ka, k12, k21, and k10 values of 36 IR dosage forms were assessed only by preliminary quantification to observe their relationships using WinNonlin software (built-in residual method). As expected, the ka values of TMS, CSC, and TDF estimated using WinNonlin software were different from the values of ka calculated using the direct method (Tables 1, 4).
The range of Tmax for all setting groups was 0.5–4.0 h (Table 2), which was representative of the in vivo performance of most of the IR dosage forms in practice. The ka estimated using the direct method was evidently affected by kmax, Tmax, and τ values (Eq. 6), and the negative correlation between kmax and Tmax (or τ) could ensure that the estimated ka was accurate and independent of the changes in k12, k21, and k10 (Figures 2D–F). The statistical moment method, as a non-compartmental method, should be non-sensitive to the changes in compartmental parameters (i.e., k12, k21, and k10). However, the most values of ka estimated using the statistical moment method had low levels (Table 2) because small values of kT were obtained from the terminal sampling point (Riegelman and Collier, 1980). The estimated values of ka were undoubtedly and sensitively affected by k12, k21, and k10 values when applying the Loo-Riegelman method (Figures 2D–F), according to Eqs 14, 15 (Byron and Notari, 1976; Zeng et al., 2020). However, all the estimated values of ka were higher than the true values of ka, which might have been attributed to the difference in the number of time points in the unabsorbed fraction (1–Fabs%) that were fitted in the linear regression analysis. Moreover, the mean absolute RE of the ka estimated using the Loo-Riegelman method had a relatively large value because of a few outliers (RE > 100%) that negatively affected the fitting precision, but it also had a better estimating accuracy than that of the statistical moment method (Figures 2B, C).
The three model drugs, whose Tmax (0.5–4.0 h) values were different, were selected to explore the accuracy and scopes of the direct method in practice (Oh et al., 2017; Patel et al., 2017; Lu et al., 2019). The empirical ka values of these drugs could not be obtained from previously reported studies. Therefore, the relationships between the absorption rate and the PK data were investigated to indirectly verify the accuracy of the direct method. Generally, the high absorption rate of the drugs showed a large Cmax and a short Tmax (Han et al., 2018). The values of Cmax and Cmax/AUC0-t represented the in vivo exposure of the drugs, which were also related to the ka values (Tozer et al., 1996). The ka values of the three model drugs estimated using the direct method were positively correlated with the in vivo exposure of TMS (Figures 4A2, A3), CSC (Figures 4D2, D3), and TDF (Figures 4F2, F3), which might be advantageous in predicting the in vivo exposure of the different formulations. Negative correlations were observed between ka and Tmax (Figures 4A4, 4D4, 4F4), which were consistent with previous literature results (Han et al., 2018). However, both the Loo-Riegelman method (used only for TMS) and the statistical moment method failed to establish the correlation between the estimated ka and their Cmax, Cmax/AUC0-t, and Tmax values. The ka of CSC estimated using the statistical moment method was positively correlated with Tmax, which was contrary to the literature precedent (Han et al., 2018).
The PK parameters of drugs, including Cmax, AUC0-t, Tmax, and ka, are generally affected by the intake of high-fat foods (Winter et al., 2013). In this study, the decreased ka and Cmax values and prolonged Tmax values of TDF in the fed states were compared to those in the fasted state. The similar in vivo results of TDF between the fed and fasted states were consistent with that reported in a previous study (Lu et al., 2013). A difference in the estimated ka of TDF was observed between the fed and fasted states when assessed using the direct method (Table 4), and linear correlations with Cmax, Cmax/AUC0-t, and Tmax values were observed (Figures 4F2–F4). On the contrary, the statistical moment method failed to produce a difference in the estimated ka between the fed and fasted states, and no correlations were observed between the estimated ka and their Cmax, Cmax/AUC0-t, and Tmax values (Figures 4G2–G4). Therefore, these results corroborated that the direct method was sensitive and accurate when estimating ka for applications related to PK evaluations.
Although the absorption of a drug after oral administration was terminated at a finite time point after Tmax in a previous study (Macheras, 2019), the exact endpoint was unclear. In this study, τ represented the endpoint of the post-absorption phase in the PK profiles, at which the absorption process had finished. The values of τ for TMS, CSC, and TDF tablets were obtained in the fed and/or fasted states (Table 4). The average values of Fabs for these drugs exceeded 90% at the mean value of τ (Figures 4A1, 4D1, 4F1), which verified the inference of the direct method.
As the accuracies of kmax, τ, and Tmax greatly affected the estimation of ka, sufficient sampling points in PK studies might be needed to obtain accurate values of kmax, τ, and Tmax. In the present study, the sampling points for PK studies of the three model drugs in humans were designed as conventional sampling points (such as 0.17 h, 0.33 h, 0.5 h, 1 h, … ), rather than sampling points with intervals of 0.1 h for the setting data. The conventional points did not significantly affect the calculation of ka, demonstrating that the direct method was highly feasible for estimating the absorption rate of drugs in practical applications. However, more drugs fitting with the two-compartment PK model should be evaluated in further studies to verify the accuracy and applicability of the direct method.
5 Conclusion
In this study, the direct method was developed and used for estimating the ka value of a drug with the two-compartment model using the equation
Data availability statement
The raw data supporting the conclusion of this article will be made available by the authors, without undue reservation.
Ethics statement
The studies involving human participants were reviewed and approved by Chinese Food and Drug Administration (CFDA) and the Institutional Research Ethics Committee of Xiangya School of Pharmaceutical Sciences, Central South University. The patients/participants provided their written informed consent to participate in this study.
Author contributions
FL, HY, GZ, and LW participated the research design; FL, HY, and GZ conducted the research; FL, GZ, LW, and ZC performed data analysis; FL and GZ contributed to the writing of the manuscript.
Funding
The financial supported from the National Nature Science Foundation of China (Grant No. 82073932).
Acknowledgments
The authors are grateful for the technical supported from Hunan Huize Bio-pharmaceutical Co., Ltd.
Conflict of interest
The authors declare that the research was conducted in the absence of any commercial or financial relationships that could be construed as a potential conflict of interest.
Publisher’s note
All claims expressed in this article are solely those of the authors and do not necessarily represent those of their affiliated organizations, or those of the publisher, the editors and the reviewers. Any product that may be evaluated in this article, or claim that may be made by its manufacturer, is not guaranteed or endorsed by the publisher.
References
Abdallah, O. M., Abdel-Megied, A. M., and Gouda, A. S. (2018). Development and validation of LC-MS/MS method for simultaneous determination of sofosbuvir and daclatasvir in human Plasma: Application to pharmacokinetic study. Biomed. Chromatogr. 32, e4186. doi:10.1002/bmc.4186
Albu, F., Georgita, C., David, V., and Medvedovici, A. (2007). Determination of glibenclamide in human plasma by liquid chromatography and atmospheric pressure chemical ionization/MS-MS detection. J. Chromatogr. B Anal. Technol. Biomed. Life Sci. 846, 222–229. doi:10.1016/j.jchromb.2006.09.005
Apostolou, C., Kousoulos, C., Dotsikas, Y., Soumelas, G. S., Kolocouri, F., Ziaka, A., et al. (2008). An improved and fully validated LC-MS/MS method for the simultaneous quantification of simvastatin and simvastatin acid in human plasma. J. Pharm. Biomed. Anal. 46, 771–779. doi:10.1016/j.jpba.2007.12.001
Bhadoriya, A., Shah, P. A., Shrivastav, P. S., Bharwad, K. D., and Singhal, P. (2019). Determination of terbinafine in human plasma using UPLC-MS/MS: Application to a bioequivalence study in healthy subjects. Biomed. Chromatogr. 33, e4543. doi:10.1002/bmc.4543
Byron, P. R., and Notari, R. E. (1976). Critical analysis of "flip-flop" phenomenon in two-compartment pharmacokinetic model. J. Pharm. Sci. 65, 1140–1144. doi:10.1002/jps.2600650804
Chae, S. I., Yoo, H. J., Lee, S. Y., Chung, E. K., Shim, W. S., and Lee, K. T. (2019). Development and validation of simple LC-MS-MS assay for the quantitative determination of ticagrelor in human plasma: Its application to a bioequivalence study. J. Chromatogr. Sci. 57, 331–338. doi:10.1093/chromsci/bmz001
Chen, B. M., Liang, Y. Z., Chen, X., Liu, S. G., Deng, F. L., and Zhou, P. (2006). Quantitative determination of azithromycin in human plasma by liquid chromatography-mass spectrometry and its application in a bioequivalence study. J. Pharm. Biomed. Anal. 42, 480–487. doi:10.1016/j.jpba.2006.05.011
Chen, H., Li, L., Song, S., Du, Y., Jin, X., Ding, P., et al. (2018). Determination of lacidipine in human plasma by LC-MS/MS: Application in a bioequivalence study. Int. J. Clin. Pharmacol. Ther. 56, 493–500. doi:10.5414/CP203250
Cho, H. Y., Ngo, L., Kim, S. K., Choi, Y., and Lee, Y. B. (2018). Bioequivalence of a fixed-dose repaglinide/metformin combination tablet and equivalent doses of repaglinide and metformin tablets. Int. J. Clin. Pharmacol. Ther. 56, 292–300. doi:10.5414/CP203199
Choudhury, H., Gorain, B., Paul, A., Sarkar, P., Dan, S., Chakraborty, P., et al. (2017). Development and validation of an LC-MS/MS-ESI method for comparative pharmacokinetic study of ciprofloxacin in healthy male subjects. Drug Res. (Stuttg) 67, 94–102. doi:10.1055/s-0042-116593
FDA (2008). Candesartan cilexetil. Available at: https://www.accessdata.fda.gov/drugsatfda_docs/psg/Candesartan_Cilexetil_tab_20838_RC8-04.pdf.
FDA (2012). Tenofovir disoproxil fumarate. Available at: https://www.accessdata.fda.gov/drugsatfda_docs/psg/Tenofovir%20Disoproxil%20Fumarate%20022577%20RC09-12.pdf.
FDA (2003). U.S. Department of health and human services, food and drug administration. Center for drug evaluation and research. Guidance for industry. Bioavailability and bioequivalence studies for orally administered drug products-general considerations.
Franek, F., Jarlfors, A., Larsen, F., Holm, P., and Steffansen, B. (2015). In vitro solubility, dissolution and permeability studies combined with semi-mechanistic modeling to investigate the intestinal absorption of desvenlafaxine from an immediate- and extended release formulation. Eur. J. Pharm. Sci. 77, 303–313. doi:10.1016/j.ejps.2015.06.012
Gleiter, C. H., and Morike, K. E. (2002). Clinical pharmacokinetics of candesartan. Clin. Pharmacokinet. 41, 7–17. doi:10.2165/00003088-200241010-00002
Gupta, A., Guttikar, S., Patel, Y., Shrivastav, P. S., and Sanyal, M. (2015). Reliable LC-MS/MS assay for the estimation of rilpivirine in human plasma: Application to a bioequivalence study and incurred sample reanalysis. Drug Test. Anal. 7, 290–299. doi:10.1002/dta.1665
Gupta, A., Guttikar, S., Shrivastav, P. S., and Sanyal, M. (2013). Simultaneous quantification of prodrug oseltamivir and its metabolite oseltamivir carboxylate in human plasma by LC-MS/MS to support a bioequivalence study. J. Pharm. Anal. 3, 149–160. doi:10.1016/j.jpha.2012.11.004
Han, Y. R., Lee, P. I., and Pang, K. S. (2018). Finding Tmax and Cmax in multicompartmental models. Drug Metab. Dispos. 46, 1796–1804. doi:10.1124/dmd.118.082636
Kadam, R., Bourne, D., Kompella, U., and Aquilante, C. (2013). Effect of cytochrome P450 2C8*3 on the population pharmacokinetics of pioglitazone in healthy Caucasian volunteers. Biol. Pharm. Bull. 36, 245–251. doi:10.1248/bpb.b12-00657
Kearney, B. P., Flaherty, J. F., and Shah, J. (2004). Tenofovir disoproxil fumarate: Clinical pharmacology and pharmacokinetics. Clin. Pharmacokinet. 43, 595–612. doi:10.2165/00003088-200443090-00003
Kumar, A., Dwivedi, S. P., and Prasad, T. (2019). Method validation for simultaneous quantification of olmesartan and hydrochlorothiazide in human plasma using LC-MS/MS and its application through bioequivalence study in healthy volunteers. Front. Pharmacol. 10, 810. doi:10.3389/fphar.2019.00810
Li, X., Shi, F., He, X., Jian, L., and Ding, L. (2016). A rapid and sensitive LC-MS/MS method for determination of lercanidipine in human plasma and its application in a bioequivalence study in Chinese healthy volunteers. J. Pharm. Biomed. Anal. 128, 67–72. doi:10.1016/j.jpba.2016.05.013
Lu, C., Jia, Y., Chen, L., Ding, Y., Yang, J., Chen, M., et al. (2013). Pharmacokinetics and food interaction of a novel prodrug of tenofovir, tenofovir dipivoxil fumarate, in healthy volunteers. J. Clin. Pharm. Ther. 38, 136–140. doi:10.1111/jcpt.12023
Lu, C., Yang, Y., Zhang, Q., Zhou, R., Liu, Z., and Hu, W. (2019). Pharmacokinetic and bioequivalence study of emtricitabine/tenofovir disoproxil fumarate tablets in healthy Chinese subjects. Int. J. Clin. Pharmacol. Ther. 57, 623–632. doi:10.5414/CP203533
Macheras, P. (2019). On an unphysical hypothesis of Bateman equation and its implications for pharmacokinetics. Pharm. Res. 36, 94. doi:10.1007/s11095-019-2633-4
Mcgregor, G. P. (2016). Pivotal bioequivalence study of Clopacin®, a generic formulation of clopidogrel 75 mg film-coated tablets. Adv. Ther. 33, 186–198. doi:10.1007/s12325-016-0290-0
Najib, N. M., Idkaidek, N., Beshtawi, M., Mohammed, B., Admour, I., Alam, S. M., et al. (2005). Bioequivalence assessment of lovrak (julphar, UAE) compared with zovirax (glaxo wellcome, UK)--Two brands of acyclovir--in healthy human volunteers. Biopharm. Drug Dispos. 26, 7–12. doi:10.1002/bdd.426
Oh, M., Park, S. E., Ghim, J. L., Choi, Y. K., Shim, E. J., Shin, J. G., et al. (2017). Comparative pharmacokinetics of a fixed-dose combination vs concomitant administration of telmisartan and S-amlodipine in healthy adult volunteers. Drug Des. Devel Ther. 11, 3543–3550. doi:10.2147/DDDT.S148534
Parekh, J. M., Sutariya, D. K., Vaghela, R. N., Sanyal, M., Yadav, M., and Shrivastav, P. S. (2012). Sensitive, selective and rapid determination of bupropion and its major active metabolite, hydroxybupropion, in human plasma by LC-MS/MS: Application to a bioequivalence study in healthy Indian subjects. Biomed. Chromatogr. 26, 314–326. doi:10.1002/bmc.1660
Park, J. H., Park, Y. S., Rhim, S. Y., Jhee, O. H., Kim, S. H., Yang, S. C., et al. (2009). Quantification of isradipine in human plasma using LC-MS/MS for pharmacokinetic and bioequivalence study. J. Chromatogr. B Anal. Technol. Biomed. Life Sci. 877, 59–64. doi:10.1016/j.jchromb.2008.11.021
Park, M. S., Shim, W. S., Yim, S. V., and Lee, K. T. (2012). Development of simple and rapid LC-MS/MS method for determination of celecoxib in human plasma and its application to bioequivalence study. J. Chromatogr. B Anal. Technol. Biomed. Life Sci. 902, 137–141. doi:10.1016/j.jchromb.2012.06.016
Patel, D. P., Sharma, P., Sanyal, M., Singhal, P., and Shrivastav, P. S. (2012). Challenges in the simultaneous quantitation of sumatriptan and naproxen in human plasma: Application to a bioequivalence study. J. Chromatogr. B Anal. Technol. Biomed. Life Sci. 902, 122–131. doi:10.1016/j.jchromb.2012.06.041
Patel, R., Palmer, J. L., Joshi, S., Di Cio Gimena, A., and Esquivel, F. (2017). Pharmacokinetic and bioequivalence studies of a newly developed branded generic of candesartan cilexetil tablets in healthy volunteers. Clin. Pharmacol. Drug Dev. 6, 492–498. doi:10.1002/cpdd.321
Rezende, K. R., Mundim, I. M., Teixeira, L. S., Souza, W. C., Ramos, D. R., Cardoso, C. R., et al. (2007). Determination of captopril in human plasma, using solid phase extraction and high-performance liquid chromatography, coupled to mass spectrometry: Application to bioequivalence study. J. Chromatogr. B Anal. Technol. Biomed. Life Sci. 850, 59–67. doi:10.1016/j.jchromb.2006.11.007
Rezk, M. R., and Badr, K. A. (2014). Development, optimization and validation of a highly sensitive UPLC-ESI-MS/MS method for simultaneous quantification of amlodipine, benazeprile and benazeprilat in human plasma: Application to a bioequivalence study. J. Pharm. Biomed. Anal. 98, 1–8. doi:10.1016/j.jpba.2014.05.005
Rhim, S. Y., Park, J. H., Park, Y. S., Kim, D. S., Lee, M. H., Shaw, L. M., et al. (2009). A sensitive validated LC-MS/MS method for quantification of itraconazole in human plasma for pharmacokinetic and bioequivalence study in 24 Korean volunteers. Pharmazie 64, 71–75.
Riegelman, S., and Collier, P. (1980). The application of statistical moment theory to the evaluation of in vivo dissolution time and absorption time. J. Pharmacokinet. Biopharm. 8, 509–534. doi:10.1007/BF01059549
Shah, P. A., and Shrivastav, P. S. (2018). Determination of silodosin and its active glucuronide metabolite KMD-3213G in human plasma by LC-MS/MS for a bioequivalence study. Biomed. Chromatogr. 32, e4041. doi:10.1002/bmc.4041
Sora, I., Cristea, E., Albu, F., Udrescu, S., David, V., and Medvedovici, A. (2009). LC-MS/MS assay of quinapril and its metabolite quinaprilat for drug bioequivalence evaluation: Prospective, concurrential and retrospective method validation. Bioanalysis 1, 71–86. doi:10.4155/bio.09.5
Stangier, J., Su, C. A., and Roth, W. (2000). Pharmacokinetics of orally and intravenously administered telmisartan in healthy young and elderly volunteers and in hypertensive patients. J. Int. Med. Res. 28, 149–167. doi:10.1177/147323000002800401
Tozer, T. N., Bois, F. Y., Hauck, W. W., Chen, M. L., and Williams, R. L. (1996). Absorption rate vs. exposure: Which is more useful for bioequivalence testing? Pharm. Res. 13, 453–456. doi:10.1023/a:1016061013606
Vancea, S., Gall, Z., Donath-Nagy, G., and Borka-Balas, R. (2014). Rapid LC-MS/MS method for determination of drotaverine in a bioequivalence study. J. Pharm. Biomed. Anal. 98, 417–423. doi:10.1016/j.jpba.2014.06.029
Vlase, L., Imre, S., Muntean, D., and Leucuta, S. E. (2007). Determination of loratadine and its active metabolite in human plasma by high-performance liquid chromatography with mass spectrometry detection. J. Pharm. Biomed. Anal. 44, 652–657. doi:10.1016/j.jpba.2006.08.013
Wagner, J. G. (1975). Application of the Loo-Riegelman absorption method. J. Pharmacokinet. Biopharm. 3, 51–67. doi:10.1007/BF01066595
Wang, C., Hu, C., Gao, D., Zhao, Z., Chen, X., Hu, X., et al. (2019). Pharmacokinetics and bioequivalence of generic and branded abiraterone acetate tablet: A single-dose, open-label, and replicate designed study in healthy Chinese male volunteers. Cancer Chemother. Pharmacol. 83, 509–517. doi:10.1007/s00280-018-3754-x
Wang, C., Qin, Z., Ren, G., Zhai, Y., Fu, K., Lu, C., et al. (2020). Development of a sensitive UPLC-MS/MS assay for domperidone and pharmacokinetics of domperidone tablet formulations in fasting and fed Chinese healthy subjects. Int. J. Clin. Pharmacol. Ther. 58, 177–182. doi:10.5414/CP203529
Winter, H., Ginsberg, A., Egizi, E., Erondu, N., Whitney, K., Pauli, E., et al. (2013). Effect of a high-calorie, high-fat meal on the bioavailability and pharmacokinetics of PA-824 in healthy adult subjects. Antimicrob. Agents Chemother. 57, 5516–5520. doi:10.1128/AAC.00798-13
Yu, Z., Schwartz, J. B., Sugita, E. T., and Foehl, H. C. (1996). Five modified numerical deconvolution methods for biopharmaceutics and pharmacokinetics studies. Biopharm. Drug Dispos. 17, 521–540. doi:10.1002/(SICI)1099-081X(199608)17:6<521::AID-BDD974>3.0.CO;2-A
Zaid, A. N., Al Ramahi, R., Cortesi, R., Mousa, A., Jaradat, N., Ghazal, N., et al. (2016). Investigation of the bioequivalence of rosuvastatin 20 mg tablets after a single oral administration in Mediterranean Arabs using a validated LC-MS/MS method. Sci. Pharm. 84, 536–546. doi:10.3390/scipharm84030536
Zeng, Y., Liu, J., Liu, W., Jiang, S., Wang, S., and Cheng, Z. (2020). A new method for the estimation of absorption rate constant in two-compartment model by extravascular administration. J. Pharm. Sci. 109, 1802–1810. doi:10.1016/j.xphs.2020.01.025
Zhang, G., Sun, M., Jiang, S., Wang, L., Tan, Y., Wang, L., et al. (2021). Investigating a modified apparatus to discriminate the dissolution capacity in vitro and establish an IVIVC of mycophenolate mofetil tablets in the fed state. J. Pharm. Sci. 110, 1240–1247. doi:10.1016/j.xphs.2020.10.028
Zhao, L. Z., Zhong, G. P., Bi, H. C., Ding, L., Deng, Y., Guan, S., et al. (2008). Determination of levonorgestrel in human plasma by liquid chromatography-tandem mass spectrometry method: Application to a bioequivalence study of two formulations in healthy volunteers. Biomed. Chromatogr. 22, 519–526. doi:10.1002/bmc.963
Keywords: absorption rate constant, the direct method, maximum apparent rate constant of disposition, two-compartment model, extravascular administration
Citation: Liu F, Yi H, Wang L, Cheng Z and Zhang G (2023) A novel method to estimate the absorption rate constant for two-compartment model fitted drugs without intravenous pharmacokinetic data. Front. Pharmacol. 14:1087913. doi: 10.3389/fphar.2023.1087913
Received: 02 November 2022; Accepted: 20 April 2023;
Published: 04 May 2023.
Edited by:
Simone Brogi, University of Pisa, ItalyReviewed by:
Muhammad Usman, University of Veterinary and Animal Sciences, PakistanJianguo Sun, China Pharmaceutical University, China
Copyright © 2023 Liu, Yi, Wang, Cheng and Zhang. This is an open-access article distributed under the terms of the Creative Commons Attribution License (CC BY). The use, distribution or reproduction in other forums is permitted, provided the original author(s) and the copyright owner(s) are credited and that the original publication in this journal is cited, in accordance with accepted academic practice. No use, distribution or reproduction is permitted which does not comply with these terms.
*Correspondence: Lei Wang, d2FuZ2xlaXZ2bEAxNjMuY29t; Zeneng Cheng, Y2hlbmd6bkBjc3UuZWR1LmNu; Guoqing Zhang, Z3F6aGFuZzA4MjRAMTYzLmNvbQ==