94% of researchers rate our articles as excellent or good
Learn more about the work of our research integrity team to safeguard the quality of each article we publish.
Find out more
CORRECTION article
Front. Pharmacol., 09 September 2022
Sec. Inflammation Pharmacology
Volume 13 - 2022 | https://doi.org/10.3389/fphar.2022.995767
This article is a correction to:
TAZ Induces Migration of Microglia and Promotes Neurological Recovery After Spinal Cord Injury
 Xuyang Hu†
 Jinxin Huang†
 Yiteng Li†
 Lei Dong
 Yihao Chen
 Fangru Ouyang
 Jianjian Li
 Ziyu Li*
 Juehua Jing*
 Li Cheng*
A Corrigendum on
TAZ induces migration of microglia and promotes neurological recovery after spinal cord injury
by Hu X, Huang J, Li Y, Dong L, Chen Y, Ouyang F, Li J, Li Z, Jing J and Cheng L (2022). Front. Pharmacol. 13:938416. doi: 10.3389/fphar.2022.938416
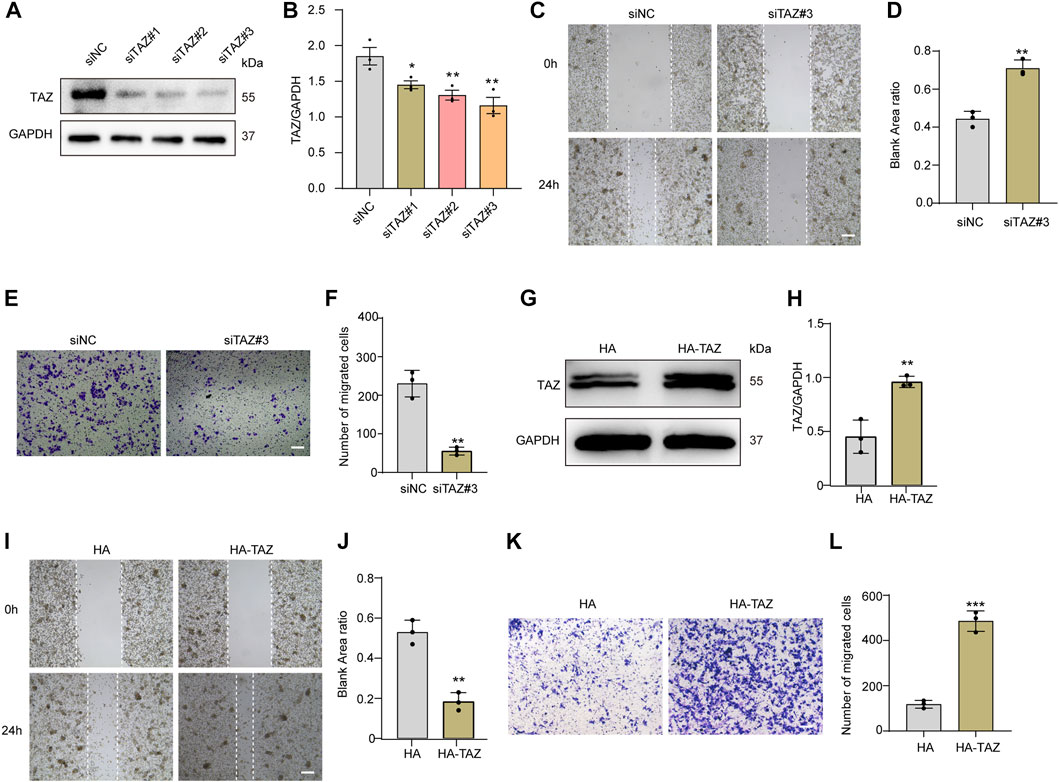
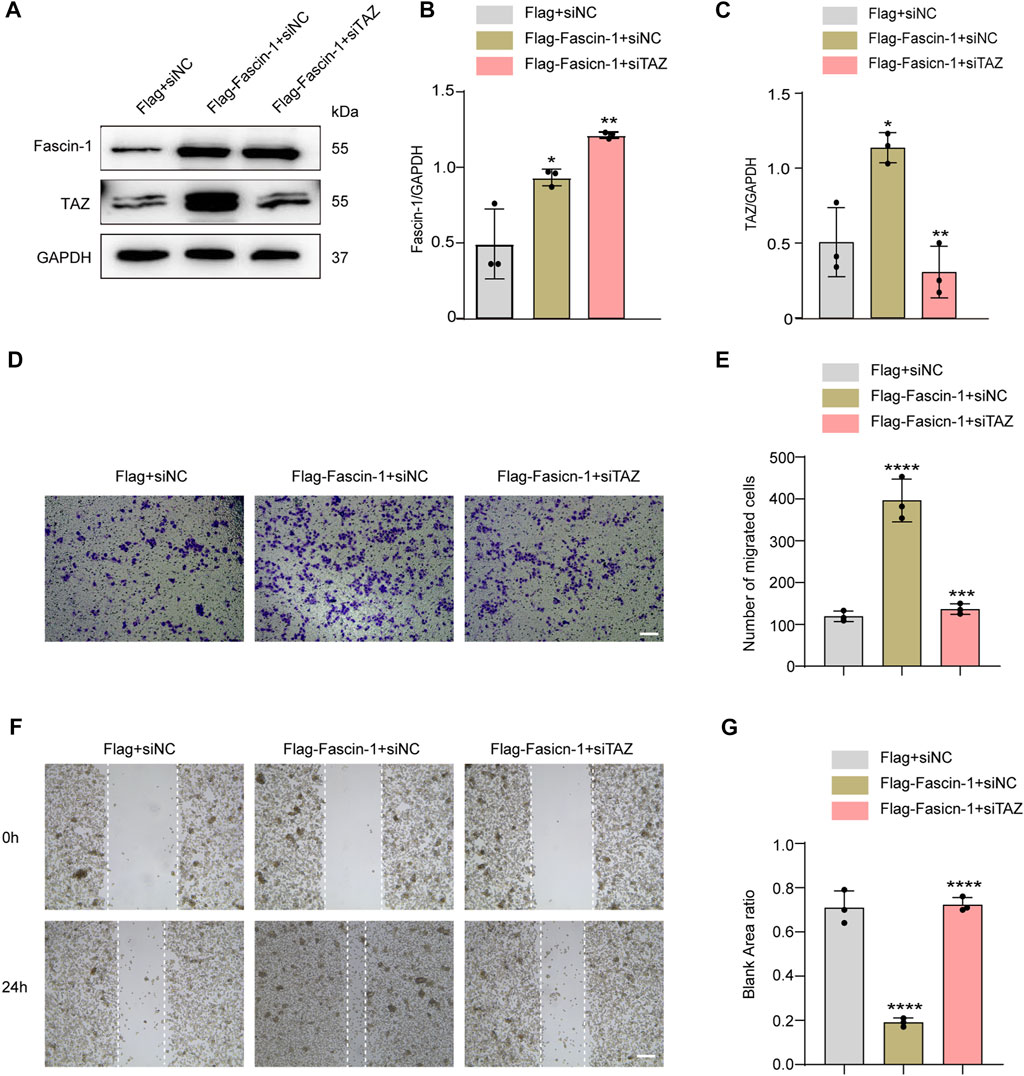
In the published article, there were errors in “Figure 5 and Figure 8” as published. Due to processing a large number of images in different groups at one time, certain images were mixed between groups, resulting in the unintentional misplacement of the representative images in Figures 5C,K and Figures 8D,F. The authors provided the journal with the original data files. The corrected Figure 5 and Figure 8 appear below. The authors have checked the original images and adjusted the statistical analysis, and there is no problem with the scientific conclusions.

FIGURE 5. TAZ promoted microglial migration in vitro. (A) Western blot analysis of the expression of TAZ was detected after transfection with siTAZ (knockdown) and siNC (control). (B) Quantitative analysis of TAZ expression in (A). GAPDH was used as the loading control. The blots (n = 3 per group) were quantified as previously described. Data were mean ± SEM. *p < 0.05 (siNC vs. siTAZ#1); **p < 0.01 (siNC vs. siTAZ#2 or siTAZ#3). According to the results, siTAZ#3 knockdown was the best effect on transfection, and siTAZ#3 was selected for transfection. (C,E) For the scratch assay and Transwell analysis were used to detect the migration of microglia after transfection with siNC and siTAZ#3 for 24 h, and cell migration was recorded 0 and 24 h (n = 3 per group). Scale bar: 200 μm. (D) Quantification of blank area ratio in (C). Data were mean ± SEM. **p < 0.01 (siNC vs. siTAZ). (F) Quantitative analysis of the number of transmembrane cells in (E). Data were mean ± SEM. **p < 0.01 (siNC vs. siTAZ). Scale bar: 200 μm. (G) Western blot analysis of the expression of TAZ was detected after plasmid HA-TAZ (overexpression) and HA (control) were transfected into microglia. (H) Quantitative analysis of TAZ expression in (G). The imprints (n = 3 per group) were quantified by densitometry using ImageJ software. Data were mean ± SEM. **p < 0.01 (HA vs. HA-TAZ). (I,K) Scratch and Transwell analysis, which were used to detect microglial migration after transfection with plasmid HA-TAZ and HA into microglia for 24 h (n = 3 per group), cell migration was recorded 0 and 24 h. Scale bar: 200 μm. (J) Quantification of blank area ratio in (I). Data were mean ± SEM. **p < 0.01 (HA vs. HA-TAZ). (L) Quantitative analysis of the number of transmembrane cells in (K). Data were mean ± SEM. ***p < 0.001 (HA vs. HA-TAZ). Scale bar: 200 μm.

FIGURE 8. TAZ was downstream of Fascin-1 for regulating microglial migration. (A) Western blot was used to detect protein expression changes of Fascin-1 and TAZ after different treatment groups, including Flag+siNC, Flag-Fascin-1+siNC, Flag-Fascin-1+siTAZ (n = 3 per group). (B,C) Quantitative analysis of the relative levels of Fascin-1 (B) and TAZ (C) as shown in (A). The protein expression was normalized to GAPDH. Data were mean ± SEM. *p < 0.05 (Flag-Fascin-1+siNC vs. Flag+siNC); **p < 0.01 (Flag-Fascin-1+siTAZ vs. Flag-Fascin-1+siNC) in (B,C). (D,F) Scratch and Transwell tests were used to detect microglial migration in the above treatment groups (n = 3 per group). (E) Quantitative analysis of the number of transmembrane cells in (D). Data were mean ± SEM. ****p < 0.0001 (Flag-Fascin-1+siNC vs. Flag+siNC), ***p < 0.001 (Flag-Fascin-1+siTAZ vs. Flag-Fascin-1+siNC). Scale bar: 200 μm. (G) Quantification of blank area ratio in (F). Data were mean ± SEM. ****p < 0.0001 (Flag-Fascin-1+siNC vs. Flag+siNC), ****p < 0.0001 (Flag-Fascin-1+siTAZ vs. Flag-Fascin-1+siNC). Scale bar: 200 μm.
The authors apologize for this error and state that this does not change the scientific conclusions of the article in any way. The original article has been updated.
All claims expressed in this article are solely those of the authors and do not necessarily represent those of their affiliated organizations, or those of the publisher, the editors and the reviewers. Any product that may be evaluated in this article, or claim that may be made by its manufacturer, is not guaranteed or endorsed by the publisher.
Keywords: TAZ, Fascin-1, microglia, migration, spinal cord injury
Citation: Hu X, Huang J, Li Y, Dong L, Chen Y, Ouyang F, Li J, Li Z, Jing J and Cheng L (2022) Corrigendum: TAZ induces migration of microglia and promotes neurological recovery after spinal cord injury. Front. Pharmacol. 13:995767. doi: 10.3389/fphar.2022.995767
Received: 16 July 2022; Accepted: 25 August 2022;
Published: 09 September 2022.
Edited and reviewed by:
Paola Patrignani, University of Studies G. d'Annunzio Chieti and Pescara, ItalyCopyright © 2022 Hu, Huang, Li, Dong, Chen, Ouyang, Li, Li, Jing and Cheng. This is an open-access article distributed under the terms of the Creative Commons Attribution License (CC BY). The use, distribution or reproduction in other forums is permitted, provided the original author(s) and the copyright owner(s) are credited and that the original publication in this journal is cited, in accordance with accepted academic practice. No use, distribution or reproduction is permitted which does not comply with these terms.
*Correspondence: Li Cheng, Y2hlbmdsaTc3ODhAMTYzLmNvbQ==; Juehua Jing, ampoaHVAc2luYS5jb20=; Ziyu Li, eml5dWxpcGFwZXJAc2luYS5jb20=
†These authors have contributed equally to this work
Disclaimer: All claims expressed in this article are solely those of the authors and do not necessarily represent those of their affiliated organizations, or those of the publisher, the editors and the reviewers. Any product that may be evaluated in this article or claim that may be made by its manufacturer is not guaranteed or endorsed by the publisher.
Research integrity at Frontiers

Learn more about the work of our research integrity team to safeguard the quality of each article we publish.