 Xiuqing Zhu
 Ming Zhang1,2†
 Yuguan Wen
 Dewei Shang
- 1Department of Pharmacy, The Affiliated Brain Hospital of Guangzhou Medical University, Guangzhou, China
- 2Guangdong Engineering Technology Research Center for Translational Medicine of Mental Disorders, Guangzhou, China
Background and Aim: Many studies associated with the combination of machine learning (ML) and pharmacometrics have appeared in recent years. ML can be used as an initial step for fast screening of covariates in population pharmacokinetic (popPK) models. The present study aimed to integrate covariates derived from different popPK models using ML.
Methods: Two published popPK models of valproic acid (VPA) in Chinese epileptic patients were used, where the population parameters were influenced by some covariates. Based on the covariates and a one-compartment model that describes the pharmacokinetics of VPA, a dataset was constructed using Monte Carlo simulation, to develop an XGBoost model to estimate the steady-state concentrations (
Results: After data preprocessing, the finally generated combined dataset was divided into a derivation cohort and a validation cohort (8:2). The XGBoost model was developed in the derivation cohort and yielded excellent performance in the validation cohort with a mean absolute error of 2.4 mg/L, root-mean-squared error of 3.3 mg/L, mean relative error of 0%, and percentages within
Conclusion: This study highlighted the bridging role of ML in big data and pharmacometrics, by integrating covariates derived from different popPK models.
1 Introduction
Model-informed precision dosing (MIPD), an emerging, modern approach for individualizing drug therapy, involves various mathematical modeling methods (e.g., pharmacometrics) to integrate multidimensional patient-level data (Darwich et al., 2021). In particular, machine learning (ML), as a new promising data-driven tool in MIPD, has attracted considerable attention recently (Kluwe et al., 2021). For example, a previous study by us proved the feasibility of ML algorithms for predicting the dose-adjusted concentrations of lamotrigine for personalized dose adjustment (Zhu et al., 2021a). Although a lot of related work has been conducted to directly predict drug concentration or drug dose using ML-based strategies (Jovanović et al., 2015; Huang et al., 2021a; Zheng et al., 2021), the integration of model-informed and data-driven approaches is critical (Kluwe et al., 2021).
Fortunately, research collaborations among experts in different fields are advancing the integration of these approaches. Tang et al. (2021) reported a combined population pharmacokinetic (popPK) and ML approach, which had more accurate predictions of individual clearances of renally eliminated drugs in neonates and could be used to individualize the initial dosing regimen. Bououda et al. (2022) also suggested that ML could be used in combination with standard popPK approaches to increase confidence in the predictions of vancomycin exposure. Ogami et al. (2021) developed a model by applying artificial neural networks for predicting the time-series pharmacokinetics of cyclosporine A, which showed higher prediction accuracy than the conventional popPK model. Woillard et al. (2021a) developed an eXtreme gradient boosting (XGBoost) model allowing accurate estimation of the area under the curve (AUC) of tacrolimus based on only two or three concentrations with excellent performance, better than that of deterministic pharmacokinetic models with Bayesian estimation. However, the major limitation to developing such accurate ML models is the availability of large databases on drug concentration-time profiles, which can be solved by using simulation methods such as Monte Carlo (MC) simulation (Woillard et al., 2021b). MC simulation results in estimations of the possible outcomes by expanding the sample size, in light of probability distributions of the relevant parameters as inputs in a model (Zhu et al., 2021b). This technique has been used for popPK models to determine remedial dosing recommendations for non-adherent patients (Wang et al., 2020; Liu et al., 2021). Another study by Sibieude et al. (2021) applied ML as a fast initial covariate screening strategy and then utilized more traditional pharmacometrics approaches to build a final satisfying model to assess the clinical relevance of selected covariates and make predictions in different populations and scenarios. Thus, pharmacometrics can partner with ML to advance clinical data science by strongly decreasing computational costs for analyzing clinical datasets (Koch et al., 2020; Sibieude et al., 2021). Nevertheless, to the best of our knowledge, few studies have explored integrating covariates derived from different popPK models using ML. Our study, therefore, fills this gap.
Valproic acid (VPA) is a widely used drug for the treatment of bipolar disorder, particularly for acute mania, and multiple seizure types such as generalized tonic-clonic seizures (Hakami, 2021; Kishi et al., 2022). As a narrow therapeutic index drug, it is characterized by high pharmacokinetic variability (Johannessen and Johannessen, 2003). Various popPK models of VPA in Chinese patients have been constructed in recent years, to explore personalized VPA dosing and its variability patterns (Xu et al., 2018; Zang et al., 2022a). However, the covariates that influence the VPA pharmacokinetics varied between these models. Therefore, it is necessary to investigate the comprehensive impacts of these potential factors on VPA pharmacokinetics using our established XGBoost model.
The XGBoost algorithm, one of the best-known ensemble techniques, was originally developed by Chen and Guestrin (2016). It is based on the basic idea of boosting and serves as an extension to gradient boosted decision trees (GBDT), where the decision trees are built serially and each tree tries to minimize the error made by the previous one (Yaman and Subasi, 2019). Several innovations have been made to the XGBoost algorithm, including parallel tree boosting and approximate greedy search (Chen and Guestrin, 2016). Therefore, it can simultaneously reduce the model bias and variance (Cao et al., 2010). This state-of-the-art ML algorithm has been gradually applied to deal with predictions of therapeutic drug monitoring (TDM) values, drug dose, and drug exposure to specific medications (Huang et al., 2021a; Guo et al., 2021; Bououda et al., 2022). The details of the differences between the XGBoost and GBDT algorithms are given in the section titled “An introduction to XGBoost algorithm.”
In this study, our objective was to integrate covariates derived from different popPK models of VPA using the XGBoost algorithm, interpret our proposed model based on the SHapley Additive exPlanations (SHAP) analysis (Lundberg and Lee, 2017), and evaluate the combined effects across multiple covariates (i.e., CYP2C19 genotypes and co-administered enzyme-inducing antiepileptic drugs) in terms of VPA exposure by assuming four scenarios. Furthermore, for easy clinical use, we built a simplified model by using only CYP2C19 genotypes and some noninvasive clinical parameters, and omitting several features (similar to the practices in the ablation experiment) that were infrequently measured during TDM [e.g., albumin (ALB)], or whose clinically available values were inaccurate [e.g., blood sampling time (t)]. We evaluated this simplified model on our independent external dataset. An easy-to-use web application based on the simplified model was then designed as a real-time tool to support clinical decisions for MIPD.
2 Materials and methods
2.1 Data source and dataset construction
Generally, the predictability of different popPK models when extrapolated to other clinical centers might remain to be compared (Lv et al., 2021). An external validation study based on published VPA models by Zang et al. (2022b) suggested that the absence of children, Asian ethnicity, one-compartment models, and inclusion of the covariates body weight (BW) and VPA dosage, were the most important factors contributing to good performance in their Chinese dataset. This indicates that the selection of published popPK models of VPA is vital in our study, and priority may be given to these models that include the abovementioned factors. Moreover, glucuronidation and β-oxidation in the mitochondria are the major routes of VPA metabolism in humans (Ghodke-Puranik et al., 2013), and cytochrome P450 2C9 (CYP2C9) is the most significant cytochrome P450 (CYP) enzyme that mediates the oxidation of VPA considered a minor route of its metabolism (Ho et al., 2003; Ghodke-Puranik et al., 2013). Nevertheless, cytochrome P450 2C19 (CYP2C19) also participates in VPA metabolism (Hiemke et al., 2018; Song et al., 2022). Multiple studies reported that CYP2C19 polymorphisms/genotypes significantly influenced the pharmacokinetic variability of VPA in Chinese Han subjects (Jiang et al., 2009; Guo et al., 2020; Wang et al., 2021). Given the limitations of the genetic test items in our hospital (no CYP2C9 genotype testing), the reported references about the impact of CYP2C19 polymorphisms on VPA, and the goal of validation of the simplified XGBoost model using our external dataset, we selected two previously published popPK models of VPA in Chinese epileptic patients for simulations [i.e., Model-A including the covariate CYP2C19 genotypes (Guo et al., 2020) and Model-B including the covariates BW and daily dose of VPA (Daily Dose) (Lin et al., 2015)], both of which involved one-compartment models and Chinese epileptic patients aged 14 years and above. The detailed descriptions of the two studies are listed in Table 1.
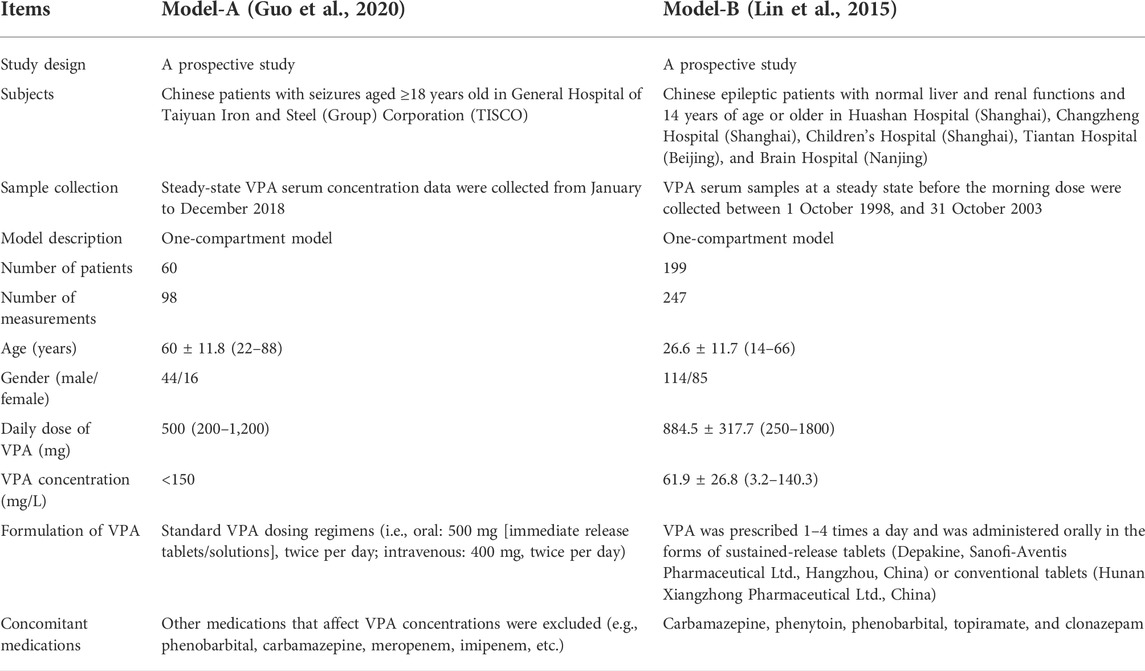
TABLE 1. Descriptions of the two studies about Model-A and Model-B.
A general overview of our implementation of pharmacometric models to ML models in this study is shown in Figure 1. The population parameters, namely, the rate of absorption (
where
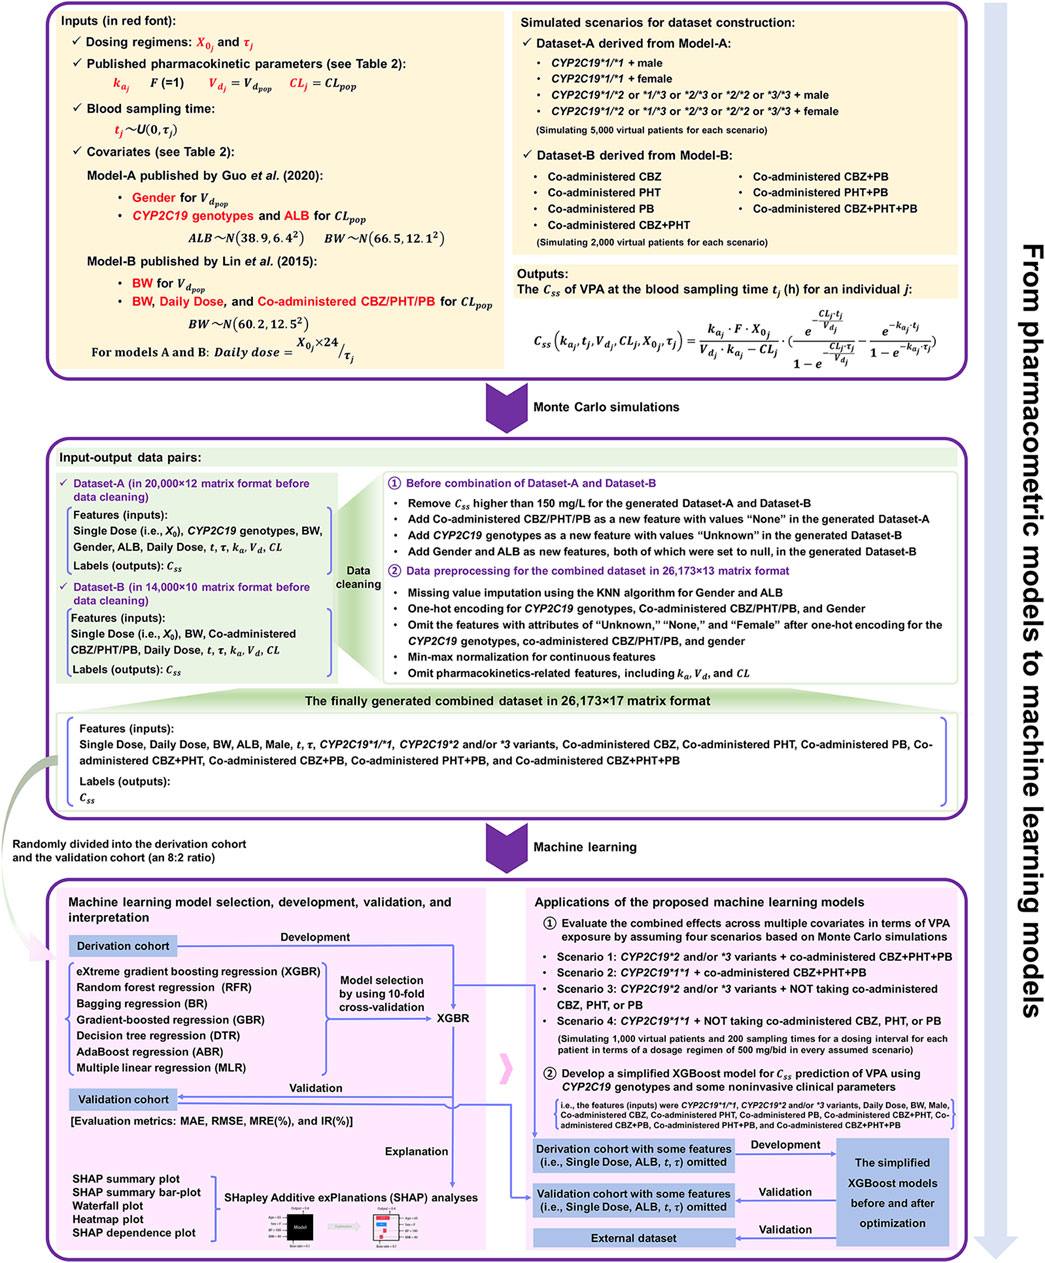
FIGURE 1. The workflow from pharmacometrics models to machine learning (ML) models mainly involves three parts: 1) data acquirement from published pharmacokinetic studies, 2) the construction of the combined dataset via Monte Carlo (MC) simulation and a series of data cleaning process, and 3) ML-based predictive modelling based on the finally generated combined dataset.
To determine a clear relationship between the features and the simulated outcomes without noise,
where
The parameter
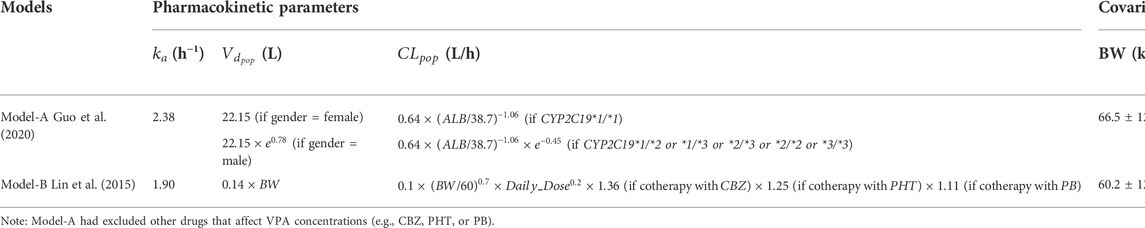
TABLE 2. Related parameters in the Model-A and Model-B for the dataset simulation process (in accordance with the original articles).
The constructed dataset combined two simulated datasets, i.e., Dataset-A and Dataset-B, derived from Model-A and Model-B, respectively. For Dataset-A, four scenarios (i.e., CYP2C19*1/*1 + male, CYP2C19*1/*1 + female, CYP2C19*1/*2 or *1/*3 or *2/*3 or *2/*2 or *3/*3 + male, and CYP2C19*1/*2 or *1/*3 or *2/*3 or *2/*2 or *3/*3 + female) were considered for simulating overall 20,000 virtual patients (in equal proportion, namely, simulating 5,000 virtual patients for each scenario). For each scenario, BW and ALB were simulated using normal distributions with mean ± standard deviation (SD) of (66.5 ± 12.1) kg and (38.9 ± 6.4) g/L, respectively, obtained from Model-A (see Table 2). For Dataset-B, a total of seven scenarios for different types of concomitant medication were simulated, including combinations with CBZ, PHT, PB, CBZ + PHT, CBZ + PB, PHT + PB, and CBZ + PHT + PB, and for each type, 2,000 virtual patients were generated, whose BW (kg) followed a normal distribution with 60.2 mean and an SD of 12.5, taken from Model-B (see Table 2). Dosing regimens were presumed to be the same in both models, as follows:
where
Subsequently, MC simulations resulted in 20,000 and 14,000 individual values of
2.2 An introduction to the XGBoost algorithm
XGBoost, a gradient-boosting framework, was developed by a team led by Chen Tianqi at the University of Washington (Chen and Guestrin, 2016). It is an effective tool for tackling classification and regression problems using tabular data. Compared with GBDT, XGBoost uses a series of optimizations (Li et al., 2019; Chen et al., 2020). An important aspect is the application of an additional regularization term to the loss function to prevent overfitting. The objective function (
where
where
Moreover, the second-order Taylor expansion of
where
Subsequently, other calculations were used to determine the optimal split node by using the information gain of
where
XGBoost has a multitude of hyperparameters. The optimal choice of the following key hyperparameters may yield the best performance by the model:
1) n_estimators: This represents the total number of trees. Too small or too large a value of n_estimators may lead to underfitting or overfitting, respectively.
2) max_depth: It is the maximum depth of the tree. Increasing max_depth will make the model more complex and lends it a stronger fitting ability. However, a large value is likely to cause it to overfit the data.
3) min_child_weight: It represents the minimum number of samples that a node can represent in order to be split further. We can increase this value to reduce overfitting.
4) gamma: It is a regularization parameter that denotes the minimum reduction in loss at every split. The larger gamma is, the more conservative the algorithm is, the smaller is the number of leaves that the tree has, and therefore, the lower is the complexity of the model.
5) colsample_bytree: It denotes the subsample ratio of columns (i.e., the rate of feature sampling) when constructing each tree, and controls overfitting.
6) subsample: It is the subsample ratio of the training instances. Increasing this value makes the algorithm more conservative and the model more likely to underfit.
7) learning_rate: It is the shrinkage in step size used in updates to prevent overfitting. Reducing the weight of each step makes the model more robust.
2.3 Model development and evaluation
The finally generated combined dataset in 26,173 × 17 matrix format was randomly divided into two parts, the derivation cohort for model selection and the development of the XGBoost model, and the validation cohort for its evaluation (an 8: 2 ratio). Before using the XGBoost algorithm, 10-fold cross-validation was applied to the derivation cohort to assess the performance of the XGBoost model, and other tree-based and non-tree-based models, including random forest regression (RFR), bagging regression (BR), gradient-boosted regression (GBR), decision tree regression (DTR), AdaBoost regression (ABR), and multiple linear regression (MLR). We used their default settings for the hyperparameters.
K-fold cross-validation involves 1) splitting the derivation cohort into K folds, 2) starting by using K-1 folds as the training set and the remaining one fold as the test set, 3) training the model on the training set and testing it on the test set, 4) saving the test score, 5) repeating steps 2–4 for K iterations, and 6) comparing the performance of the models by using the average cross-validation score [mean absolute error (MAE), used as the evaluation metric in this study] in the test sets across all K folds (Kalagotla et al., 2021).
The metrics used to evaluate the performance of the developed XGBoost model on the validation cohort were the MAE, root-mean-squared error (RMSE), mean relative error (MRE), and ideal rate (IR, i.e., percentages within ±20% of actual values), defined as follows:
where
2.4 Model interpretation
The SHAP analysis was utilized to provide interpretability to the proposed XGBoost model, which is generally criticized as a ‘black-box’ model due to its complexity. The main advantages of SHAP inspired by cooperative game theory (Štrumbelj and Kononenko, 2014), are that it is model agnostic, easy to use, and straightforward to interpret the feature contributions at global and local levels, as well as the interactions among these features (Li et al., 2020). The contribution of each feature on the model output associated with each predicted sample is allocated according to their marginal contribution (Shapley, 1953), and can be determined by the Shapley value, defined via the following formula (Yang et al., 2021):
where
2.5 Applications of the integration of pharmacometrics and ML models
2.5.1 Impacts of the integrated covariates on VPA exposure
To assess the comprehensive impacts of different popPK models-derived covariates–CYP2C19 genotypes and co-administered enzyme-inducing antiepileptic drugs–on VPA exposure, we used MC simulations to simulate 1,000 virtual patients and 200 sampling times for a dosing interval (i.e.,
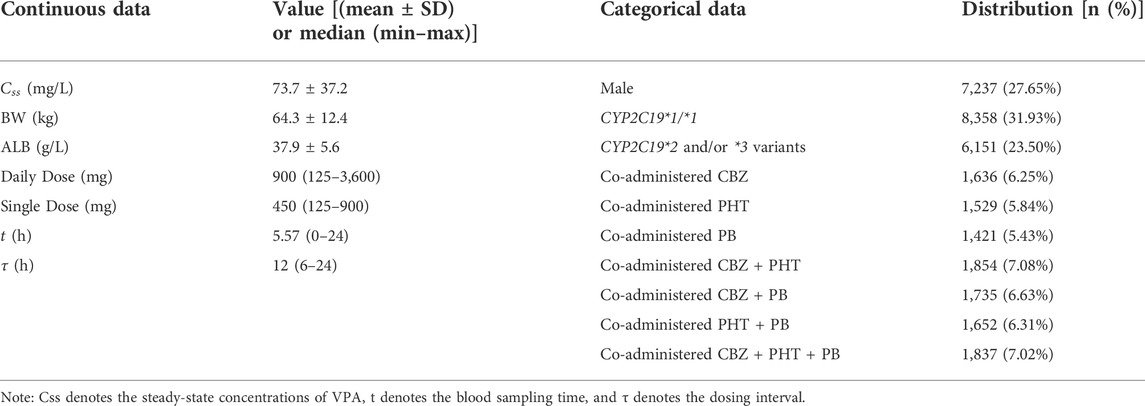
TABLE 3. Simulated patient characteristics in the finally generated combined dataset (N = 26,173).
A total of four scenarios were considered:
Scenario 1: Patients with CYP2C19*2 and/or *3 variants (feature value = 1) and taking co-administered CBZ + PHT + PB (feature value = 1).
Scenario 2: Patients with CYP2C19*1*1 genotype (feature value = 1) and taking co-administered CBZ + PHT + PB (feature value = 1).
Scenario 3: Patients with CYP2C19*2 and/or *3 variants (feature value = 1) and NOT taking co-administered CBZ, PHT, or PB (feature values of all co-administered drug predictors = 0).
Scenario 4: Patients with CYP2C19*1*1 genotype (feature value = 1) and NOT taking co-administered CBZ, PHT, or PB (feature values of all co-administered drug predictors = 0).
All predictors except for
Both
2.5.2 Model simplification to develop an easy-to-use MIPD tool
In clinical practice, a balance needs to be struck between the performance of the ML model and its ease of use. The ideal ML models are those that have as few predictors as possible (and perhaps should be easily available in the clinic) while delivering high performance. In this study, we aimed to build a simplified XGBoost model to develop an easy-to-use MIPD tool. Considering that the values of some predictors were missing owing to infrequent measurements during TDM (e.g., ALB) or were inaccurate clinical data (e.g., inappropriate sampling time in the TDM practice and irregular single doses or dosing intervals in the prescriptions) (Jakobsen et al., 2017; Firman et al., 2021), we built a simplified model by omitting these types of features (i.e., Single Dose, ALB,
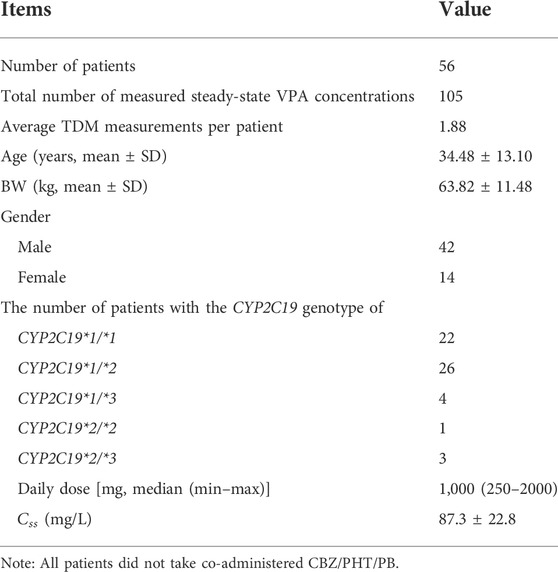
TABLE 4. Descriptions of our external dataset.
2.6 Implementation
All the analyses were performed in Python using the Jupyter notebook. Libraries sklearn, XGBoost, pandas, numpy, scipy, matplotlib, seaborn, palettable, and shap, were used for implementation.
3 Results
3.1 Simulation and data
Figure 2A shows the histogram of the simulated
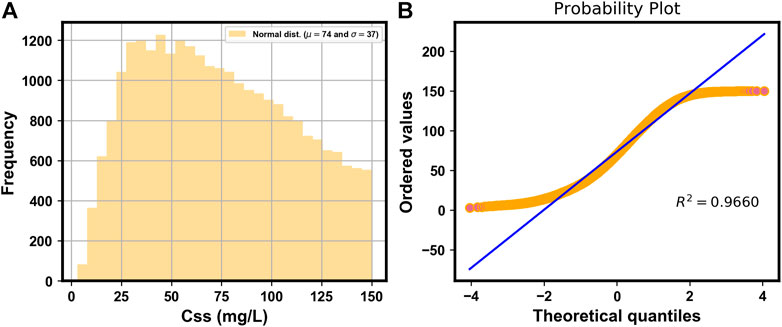
FIGURE 2. Histogram (A) and probability plot (B) of the simulated

FIGURE 3. Heat map of Pearson’s correlations between
3.2 XGBoost model
Table 5 shows the overall comparison of the regression models in the derivation cohort. The lowest average MAE value of the XGBoost model in the test sets indicated that it was superior to the other tree-based and non-tree-based models considered. As is presented in Table 6, the proposed XGBoost model delivered excellent performance on the validation cohort, illustrated by an MAE of 2.4 mg/L, RMSE of 3.3 mg/L, MRE of 0%, and IR of 98.85%, respectively.
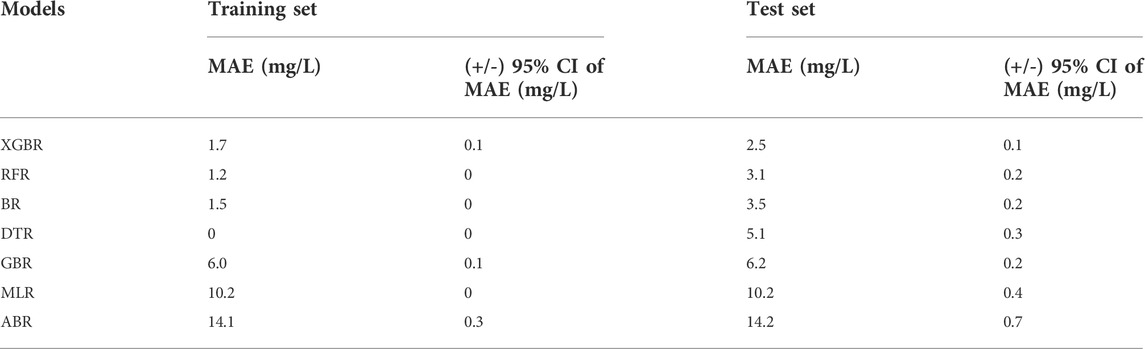
TABLE 5. The mean absolute error (MAE) at 95% confidence interval (CI) for the prediction of the value of
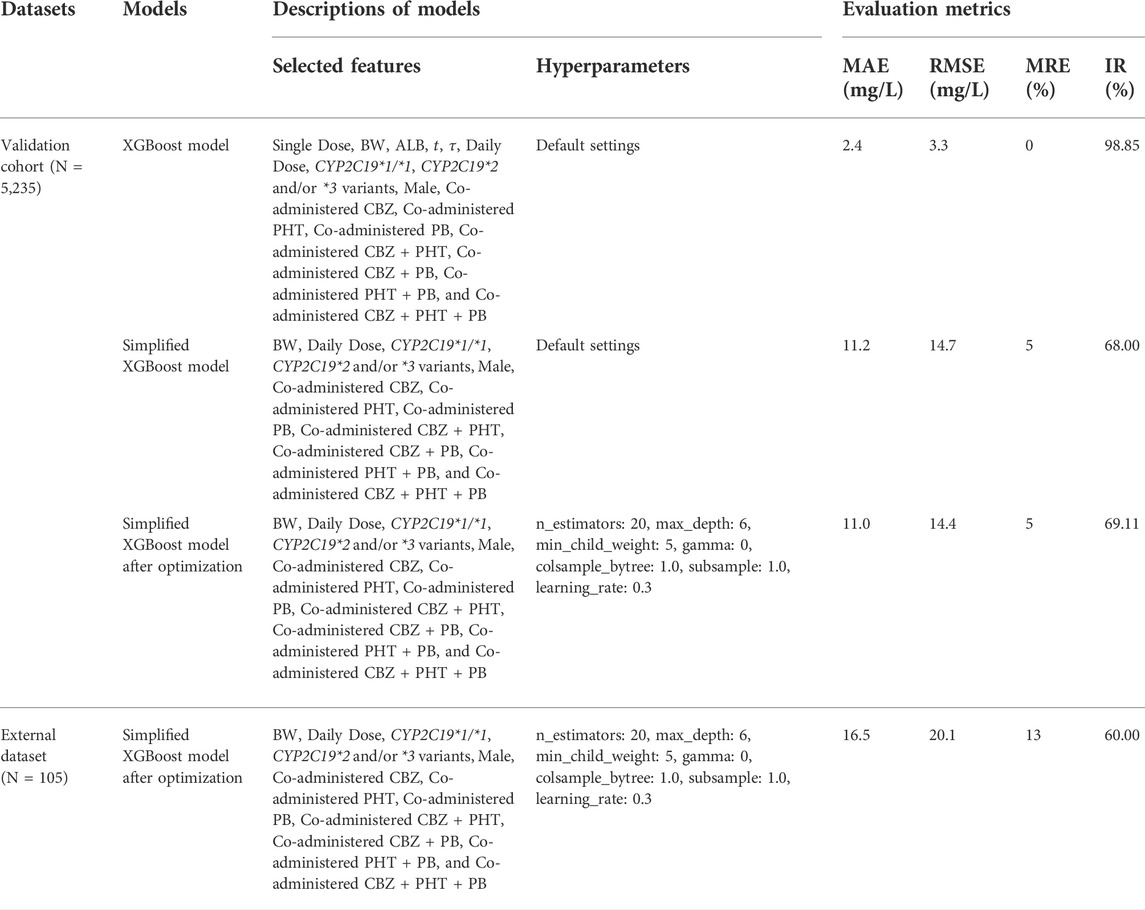
TABLE 6. Comparisons of the performance of the proposed models on the validation cohort and the independent external dataset.
3.3 SHAP analysis
Figure 4A shows the SHAP summary plot that orders all predictors according to their feature importance to detect the features which have high contributions to the
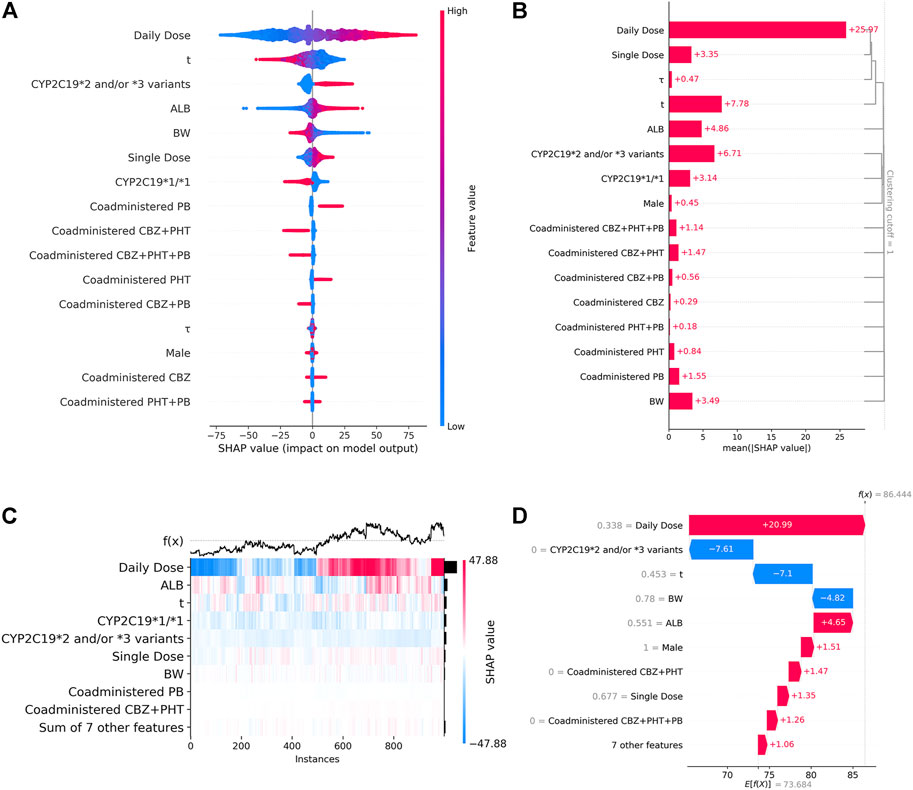
FIGURE 4. (A). SHAP summary plot. From it, we can get an initial sense of the relationship between the value of a certain feature and its impact on prediction. Each point represents an instance and a Shapley value for a feature. Its position on this plot is determined by the feature on the y-axis (ordered by feature importance) and the Shapley value on the x-axis, while its color is determined by the value of the feature. A higher SHAP value corresponds to a higher
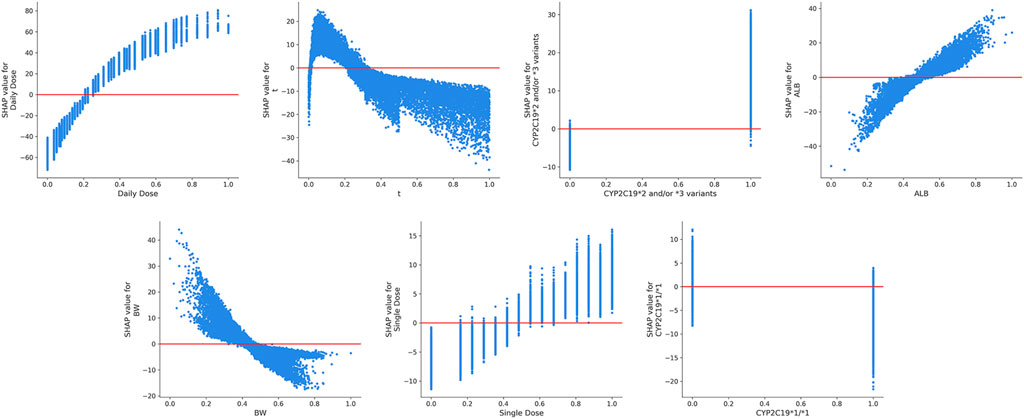
FIGURE 5. The SHAP dependence plots of features that ranked higher according to their importance ranking. From the scatter plots, we can see the exact form of the relationships between a single feature and the predictions made by the model.
3.4 Impacts of covariates on VPA exposure
Figure 6 shows the comprehensive impacts of CYP2C19 genotypes and co-administered enzyme-inducing antiepileptic drugs on the

FIGURE 6. Simulated
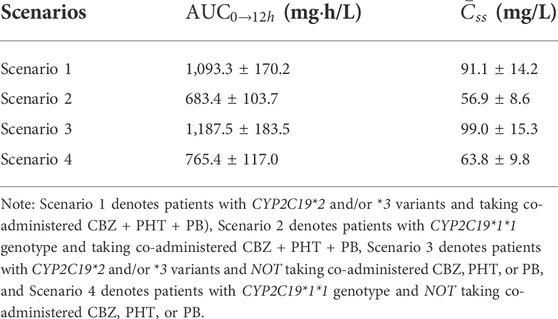
TABLE 7. Simulated steady-state area under the curve from time zero to 12 h (
3.5 Performance of the simplified models
The simplified XGBoost model by omitting the features of Single Dose, ALB,
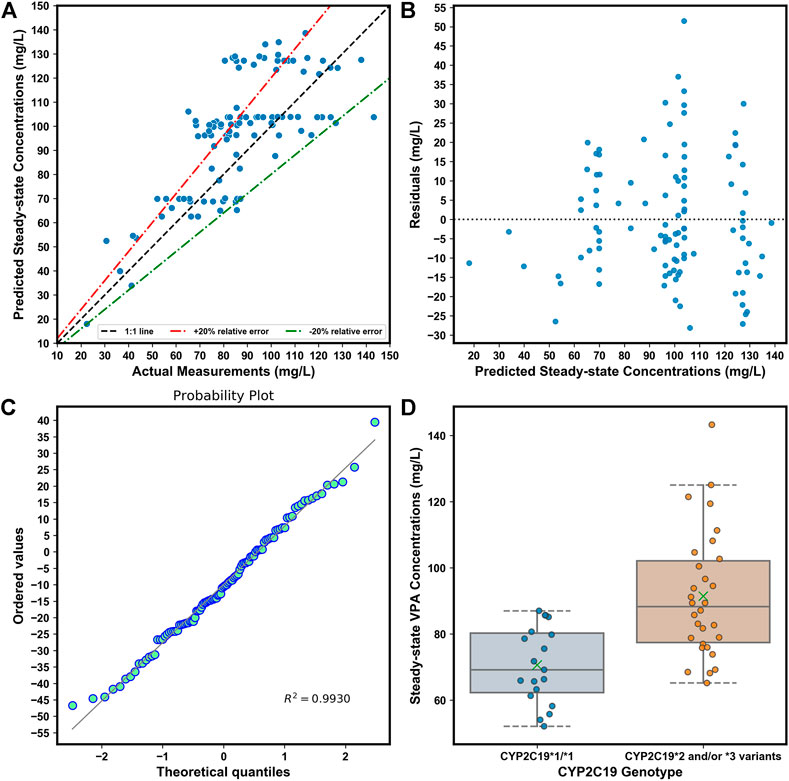
FIGURE 7. (A). Comparison of predicted and observed
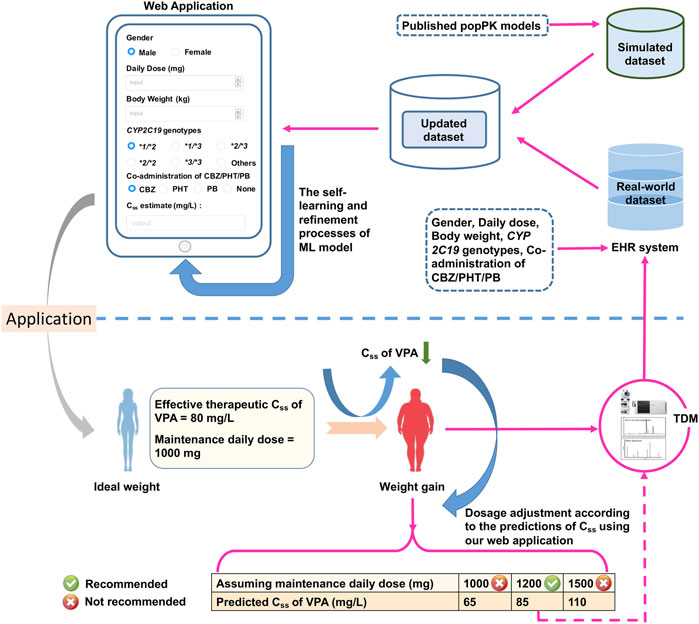
FIGURE 8. The designed web application for real-time estimations of the value of
4 Discussion
ML can serve as a bridge between big data and pharmacometrics by providing an efficient computational approach, but the effective utilization of ML tools in pharmacometrics modeling is still in its infancy (McComb et al., 2022). Many attempts have been made to combine ML and pharmacometrics to advance MIDP, such as the fast screening of covariates in popPK models using ML. However, the ML-based integration of covariates in different popPK models, to our knowledge, is another potentially interesting but unexplored application of ML in pharmacometrics.
In this work, we have first proposed an innovative approach to integrate covariates in multiple previously published popPK models of VPA in Chinese epileptic patients using MC simulations to construct population-based large datasets for ML modeling. However, several key points need to be addressed before implementation. One is the choice of published popPK models. As mentioned at the beginning of the section “materials and methods,” it is important to select suitable popPK models of VPA due to the differing predictability within models. Another point that involves the size ratio of simulated datasets from different popPK models, is also noteworthy. Due to the potential differences in covariate types in different popPK models, missing values of features are inevitable when merging these simulated datasets from different popPK models to construct the combined dataset for the ML task. These features should usually occur in more than 50% of samples; otherwise, they need to be omitted (Meyer et al., 2018). Hence, it is of crucial importance to determine the partition ratio of different sub-datasets in the combined dataset so as not to remove key covariates. Processing these features with less than 50% missing values usually consists of assigning “Unknown” to categorical variables, or setting them to null for further imputation of the missing values. Furthermore, the proportion of data simulated by using different models, as well as the methods dealing with features with missing values, may have an impact on explaining feature importance and the patterns of influence. For example, an inappropriate proportion of simulated datasets may lead to the learning of an insufficient amount of information on the key factors by ML models. Therefore, the appropriate construction of the combined dataset requires incorporating expert knowledge into the ML modeling process. In this study, we have tried to set the simulated sub-datasets close to the same scale while considering the percentages of missing values of features in the finally generated combined dataset. We also have incorporated our expert knowledge into the construction of the combined dataset and well explained the influence of a predictor in the XGBoost model based on the constructed combined dataset by using explanation methods (e.g., the SHAP analysis). The last point to consider is that, after the data cleaning process including missing data imputation and one-hot encoding, we might have to be concerned about multi-collinearity in features in the finally generated combined dataset before ML modeling because collinearity in the features may affect the performance of ML models. The common method of dealing with this is to remove collinearity from the feature set (Dormann et al., 2013). Nevertheless, the decision regarding whether to retain the features related to each other depends on their interpretation meaning, the severity of multicollinearity, and the performance of XGBoost models.
The ultimate prediction model established with XGBoost achieved a good prediction precision and accuracy in the validation cohort. The prediction behaviors of this “black-box” model were illustrated by SHAP analysis. Our results demonstrated that the daily dosage of VPA was the most important variable. Other variables ranking among the top were as follows: blood sampling time, CYP2C19*2 and/or *3 variants, ALB, BW, single dosage of VPA, and CYP2C19*1/*1 genotype. The SHAP dependent plots indicated the nonlinear relationships between the
Furthermore, after covariate integration, it was necessary to explore the comprehensive impacts of CYP2C19 genotypes and co-administered enzyme-inducing antiepileptic drugs on VPA exposure. Our simulations, which were well-verified by our independent external dataset, showed that at the dosage regimen of 500 mg/bid, VPA exposure in patients with CYP2C19*2 and/or *3 variants and no co-administered CBZ, PHT, or PB, was approximately 1.74-fold compared to those with CYP2C19*1/*1 genotype and co-administered CBZ + PHT + PB, who would obtain
We simplified the XGBoost model by omitting several predictors that were infrequently measured during TDM (e.g., ALB), or whose clinical values were inaccurate (e.g., blood sampling time), to develop a clinically easy-to-use model. Compared with the initially proposed XGBoost model, the reduced performance of our simplified XGBoost model indicated the important influences of these features, particularly the blood sampling time and ALB, on the model output. Nevertheless, a 60.00% IR of the simplified optimum XGBoost model on our external dataset suggested its good forecasting performance, considering the prediction accuracy of the predicted TDM within ±30% of the actual TDM in many similar studies that utilized XGBoost models, ranging from 40% to 75% (Huang et al., 2021b; Guo et al., 2021; Zheng et al., 2021; Ma et al., 2022). Based on the simplified optimum XGBoost model, we designed an easy-to-use web application by using only CYP2C19 genotypes and some noninvasive clinical parameters as an MIPD tool for personalized dosing adjustments. For instance, VPA is known to have both metabolic and endocrinal side effects, and is likely to induce weight gain, which may influence its value of
Despite these promising results, several limitations should be considered. The first was the relatively small sample size of our independent external dataset for performing model validation. In particular, cases of co-administered CBZ/PHT/PB were lacking due to rather few such cases. The second was that some potential key covariates were not included owing to no related published popPK literature. For example, combination with carbapenems can substantially decrease serum VPA concentrations with a mean difference of -43.98 mg/L (Chai et al., 2021), which might cause a huge prediction bias in our model. Future popPK research is needed to evaluate such covariates. The third was that we could not be able to verify whether the covariates from Model-A and Model-B were (partly) correlated or not in the context of pharmacokinetics since they were not identified in the same study. For example, low ALB concentrations have been proved to be associated with weight gain (Basolo et al., 2021), however, the exact relationship between ALB level and BW level remains unclear among Chinese epileptic patients, thus it is difficult to determine which level of ALB corresponds to which level of BW if considering the covariance of the two covariates when creating a virtual population with both covariates. Notably, our ML-based integration approach assumes the covariates derived from different popPK models are not correlated with each other in the context of pharmacokinetic modeling, considering that this ML method generally requires as many candidate influencing factors as possible. The abundant feature information and the massive volume of data can enhance the performance of the ML because it is data intensive. Moreover, the weight of each feature which presents the contribution of a feature to the final prediction can be updated in the ML model’s self-learning and refinement processes by integrating our simulated dataset with the real-world dataset from the EHR system. Finally, as pharmacometrics data are typically limited in size, the methods of model validation in ML are not routinely used in pharmacometrics. There is also a lack of consensus on the relevant definition and approaches (Sherwin et al., 2012; McComb et al., 2022). Nevertheless, a comparison of the predictive performance of the proposed XGBoost model and the two popPK models may be worthy of further examination. Besides, it is difficult to fairly evaluate and quantify the gain of using a combined dataset to develop the XGBoost model compared to a dataset taken from a single popPK model because both the feature dimensions of different datasets and the predictability of different popPK models are different. Whereas, a comparison of the predictive performance of XGBoost models built by using the combined dataset and a dataset derived from a single popPK model may also deserve further research.
5 Conclusion
Various popPK models for VPA have been reported; however, covariates affecting pharmacokinetic variability of VPA varied considerably between different popPK models. We innovatively proposed a method to integrate these covariates from multiple previously published popPK models using MC simulations to construct a large combined dataset for ML modeling. Our proposed XGBoost model exhibited excellent performance, the prediction behaviors of which were well-explained by the SHAP analysis. In short, our study highlighted the role of ML, presented as a computational bridge between big data and pharmacometrics, in integrating covariates derived from different popPK models.
Data availability statement
The original contributions presented in the study are included in the article/supplementary material, further inquiries can be directed to the corresponding authors.
Ethics statement
The studies involving human participants were reviewed and approved by the Ethics Committee of the Affiliated Brain Hospital of Guangzhou Medical University ([2021] NO.027). Written informed consent from the participants’ legal guardian/next of kin was not required to participate in this study in accordance with the national legislation and the institutional requirements.
Author contributions
YGW and DWS together conceived and designed the study. MZ performed the data collection and data analyses. XQZ wrote the original draft preparation.
Funding
This work was supported by the Science and Technology Plan Project of Guangdong Province (grant number 2019B030316001), Guangzhou municipal key discipline in medicine (2021–2023), Guangzhou Municipal Science and Technology Project for Medicine and Healthcare (grant numbers 20201A011047 and 20202A011016), Natural Science Foundation of Guangdong Province (grant number 2021A1515011325), and Guangdong Provincial Hospital Pharmaceutical Research Fund (grant number 2022A22).
Acknowledgments
We thank International Science Editing (http://www.internationalscienceediting.com) for editing this manuscript.
Conflict of interest
The authors declare that the research was conducted in the absence of any commercial or financial relationships that could be construed as a potential conflict of interest.
Publisher’s note
All claims expressed in this article are solely those of the authors and do not necessarily represent those of their affiliated organizations, or those of the publisher, the editors and the reviewers. Any product that may be evaluated in this article, or claim that may be made by its manufacturer, is not guaranteed or endorsed by the publisher.
References
Basolo, A., Ando, T., Chang, D. C., Hollstein, T., Krakoff, J., Piaggi, P., et al. (2021). Reduced albumin concentration predicts weight gain and higher ad libitum energy intake in humans. Front. Endocrinol. (Lausanne) 12, 642568. doi:10.3389/fendo.2021.642568
Beretta, L., and Santaniello, A. (2016). Nearest neighbor imputation algorithms: A critical evaluation. BMC Med. Inf. Decis. Mak. 16 (3), 74. doi:10.1186/s12911-016-0318-z
Bououda, M., Uster, D. W., Sidorov, E., Labriffe, M., Marquet, P., Wicha, S. G., et al. (2022). A machine learning approach to predict interdose vancomycin exposure. Pharm. Res. 39 (4), 721–731. doi:10.1007/s11095-022-03252-8
Cao, D. S., Xu, Q. S., Liang, Y. Z., Zhang, L. X., and Li, H. D. (2010). The boosting: A new idea of building models. Chemom. Intell. Lab. Syst. 100 (1), 1–11. doi:10.1016/j.chemolab.2009.09.002
Chai, P. Y., Chang, C. T., Chen, Y. H., Chen, H. Y., and Tam, K. W. (2021). Effect of drug interactions between carbapenems and valproate on serum valproate concentration: A systematic review and meta-analysis. Expert Opin. Drug Saf. 20 (2), 215–223. doi:10.1080/14740338.2021.1865307
Chen, C., Zhang, Q., Yu, B., Yu, Z., Lawrence, P. J., Ma, Q., et al. (2020). Improving protein-protein interactions prediction accuracy using XGBoost feature selection and stacked ensemble classifier. Comput. Biol. Med. 123, 103899. doi:10.1016/j.compbiomed.2020.103899
Chen, T., and Guestrin, C. (2016). XGBoost: A scalable tree boosting system. KDD '16 Proc. 22nd ACM SIGKDD Int. Conf. Knowl. Discov. data Min. 2016, 785–794. doi:10.1145/2939672.2939785
Corman, C. L., Leung, N. M., and Guberman, A. H. (1997). Weight gain in epileptic patients during treatment with valproic acid: A retrospective study. Can. J. Neurol. Sci. 24 (3), 240–244. doi:10.1017/s0317167100021879
Correa, T., Rodríguez, I., and Romano, S. (2008). Population pharmacokinetics of valproate in Mexican children with epilepsy. Biopharm. Drug Dispos. 29 (9), 511–520. doi:10.1002/bdd.636
Darwich, A. S., Polasek, T. M., Aronson, J. K., Ogungbenro, K., Wright, D., Achour, B., et al. (2021). Model-informed precision dosing: Background, requirements, validation, implementation, and forward trajectory of individualizing drug therapy. Annu. Rev. Pharmacol. Toxicol. 61, 225–245. doi:10.1146/annurev-pharmtox-033020-113257
Dormann, C. F., Elith, J., Bacher, S., Buchmann, C., Carl, G., Carré, G., et al. (2013). Collinearity: A review of methods to deal with it and a simulation study evaluating their performance. Ecography 36 (1), 27–46. doi:10.1111/j.1600-0587.2012.07348.x
Firman, P., Whitfield, K., Tan, K. S., Clavarino, A., and Hay, K. (2021). The impact of an electronic hospital system on therapeutic drug monitoring. J. Clin. Pharm. Ther. 46 (6), 1613–1621. doi:10.1111/jcpt.13497
Ghodke-Puranik, Y., Thorn, C. F., Lamba, J. K., Leeder, J. S., Song, W., Birnbaum, A. K., et al. (2013). Valproic acid pathway: Pharmacokinetics and pharmacodynamics. Pharmacogenet. Genomics 23 (4), 236–241. doi:10.1097/FPC.0b013e32835ea0b2
Gu, X., Zhu, M., Sheng, C., Yu, S., Peng, Q., Ma, M., et al. (2021). Population pharmacokinetics of unbound valproic acid in pediatric epilepsy patients in China: A protein binding model. Eur. J. Clin. Pharmacol. 77 (7), 999–1009. doi:10.1007/s00228-020-03080-y
Gugler, R., and von Unruh, G. E. (1980). Clinical pharmacokinetics of valproic acid. Clin. Pharmacokinet. 5 (1), 67–83. doi:10.2165/00003088-198005010-00002
Guo, J., Huo, Y., Li, F., Li, Y., Guo, Z., Han, H., et al. (2020). Impact of gender, albumin, and CYP2C19 polymorphisms on valproic acid in Chinese patients: A population pharmacokinetic model. J. Int. Med. Res. 48 (8), 300060520952281. doi:10.1177/0300060520952281
Guo, W., Yu, Z., Gao, Y., Lan, X., Zang, Y., Yu, P., et al. (2021). A machine learning model to predict risperidone active moiety concentration based on initial therapeutic drug monitoring. Front. Psychiatry. 12, 711868. doi:10.3389/fpsyt.2021.711868
Hakami, T. (2021). Neuropharmacology of antiseizure drugs. Neuropsychopharmacol. Rep. 41 (3), 336–351. doi:10.1002/npr2.12196
Hiemke, C., Bergemann, N., Clement, H. W., Conca, A., Deckert, J., Domschke, K., et al. (2018). Consensus guidelines for therapeutic drug monitoring in neuropsychopharmacology: Update 2017. Pharmacopsychiatry 51 (1-02), 9–62. doi:10.1055/s-0043-116492
Ho, P. C., Abbott, F. S., Zanger, U. M., and Chang, T. K. (2003). Influence of CYP2C9 genotypes on the formation of a hepatotoxic metabolite of valproic acid in human liver microsomes. Pharmacogenomics J. 3 (6), 335–342. doi:10.1038/sj.tpj.6500210
Huang, X., Yu, Z., Bu, S., Lin, Z., Hao, X., He, W., et al. (2021b). An ensemble model for prediction of vancomycin trough concentrations in pediatric patients. Drug Des. Devel. Ther. 15, 1549–1559. doi:10.2147/DDDT.S299037
Huang, X., Yu, Z., Wei, X., Shi, J., Wang, Y., Wang, Z., et al. (2021a). Prediction of vancomycin dose on high-dimensional data using machine learning techniques. Expert Rev. Clin. Pharmacol. 14 (6), 761–771. doi:10.1080/17512433.2021.1911642
Jakobsen, M. I., Larsen, J. R., Svensson, C. K., Johansen, S. S., Linnet, K., Nielsen, J., et al. (2017). The significance of sampling time in therapeutic drug monitoring of clozapine. Acta Psychiatr. Scand. 135 (2), 159–169. doi:10.1111/acps.12673
Jiang, D., Bai, X., Zhang, Q., Lu, W., Wang, Y., Li, L., et al. (2009). Effects of CYP2C19 and CYP2C9 genotypes on pharmacokinetic variability of valproic acid in Chinese epileptic patients: Nonlinear mixed-effect modeling. Eur. J. Clin. Pharmacol. 65 (12), 1187–1193. doi:10.1007/s00228-009-0712-x
Johannessen, C. U., and Johannessen, S. I. (2003). Valproate: Past, present, and future. CNS Drug Rev. 9 (2), 199–216. doi:10.1111/j.1527-3458.2003.tb00249.x
Jovanović, M., Sokić, D., Grabnar, I., Vovk, T., Prostran, M., Erić, S., et al. (2015). Application of counter-propagation artificial neural networks in prediction of topiramate concentration in patients with epilepsy. J. Pharm. Pharm. Sci. 18 (5), 856–862. doi:10.18433/j33031
Kalagotla, S. K., Gangashetty, S. V., and Giridhar, K. (2021). A novel stacking technique for prediction of diabetes. Comput. Biol. Med. 135, 104554. doi:10.1016/j.compbiomed.2021.104554
Kishi, T., Ikuta, T., Matsuda, Y., Sakuma, K., Okuya, M., Nomura, I., et al. (2022). Pharmacological treatment for bipolar mania: A systematic review and network meta-analysis of double-blind randomized controlled trials. Mol. Psychiatry 27 (2), 1136–1144. doi:10.1038/s41380-021-01334-4
Kluwe, F., Michelet, R., Mueller-Schoell, A., Maier, C., Klopp-Schulze, L., van Dyk, M., et al. (2021). Perspectives on model-informed precision dosing in the digital health era: Challenges, opportunities, and recommendations. Clin. Pharmacol. Ther. 109 (1), 29–36. doi:10.1002/cpt.2049
Koch, G., Pfister, M., Daunhawer, I., Wilbaux, M., Wellmann, S., and Vogt, J. E. (2020). Pharmacometrics and machine learning partner to advance clinical data analysis. Clin. Pharmacol. Ther. 107 (4), 926–933. doi:10.1002/cpt.1774
Li, W., Yin, Y., Quan, X., and Zhang, H. (2019). Gene expression value prediction based on XGBoost algorithm. Front. Genet. 10, 1077. doi:10.3389/fgene.2019.01077
Li, X., Xu, X., Xie, F., Xu, X., Sun, Y., Liu, X., et al. (2020). A time-phased machine learning model for real-time prediction of sepsis in critical care. Crit. Care Med. 48 (10), e884–e888. doi:10.1097/CCM.0000000000004494
Lin, W. W., Jiao, Z., Wang, C. L., Wang, H. Y., Ma, C. L., Huang, P. F., et al. (2015). Population pharmacokinetics of valproic acid in adult Chinese epileptic patients and its application in an individualized dosage regimen. Ther. Drug Monit. 37 (1), 76–83. doi:10.1097/FTD.0000000000000100
Liu, X. Q., Yin, Y. W., Wang, C. Y., Li, Z. R., Zhu, X., and Jiao, Z. (2021). How to handle the delayed or missed dose of rivaroxaban in patients with non-valvular atrial fibrillation: Model-informed remedial dosing. Expert Rev. Clin. Pharmacol. 14 (9), 1153–1163. doi:10.1080/17512433.2021.1937126
Lopez-Arevalo, I., Aldana-Bobadilla, E., Molina-Villegas, A., Galeana-Zapién, H., Muñiz-Sanchez, V., and Gausin-Valle, S. (2020). A memory-efficient encoding method for processing mixed-type data on machine learning. Entropy (Basel) 22 (12), 1391. doi:10.3390/e22121391
Lundberg, S. M., and Lee, S. I. (2017). A unified approach to interpreting model predictions. Red. Hook. N. Y. U. S. A., 4768–4777. In proceedings of the 31st international conference on neural information processing systems (NIPS'17). Curran Associates Inc. Available at: https://dl.acm.org/doi/pdf/10.5555/3295222.3295230.
Lv, C., Lu, J., Jing, L., Liu, T. T., Chen, M., Zhang, R., et al. (2021). Systematic external evaluation of reported population pharmacokinetic models of vancomycin in Chinese children and adolescents. J. Clin. Pharm. Ther. 46 (3), 820–831. doi:10.1111/jcpt.13363
Ma, P., Liu, R., Gu, W., Dai, Q., Gan, Y., Cen, J., et al. (2022). Construction and interpretation of prediction model of teicoplanin trough concentration via machine learning. Front. Med. (Lausanne). 9, 808969. doi:10.3389/fmed.2022.808969
McComb, M., Bies, R., and Ramanathan, M. (2022). Machine learning in pharmacometrics: Opportunities and challenges. Br. J. Clin. Pharmacol. 88 (4), 1482–1499. doi:10.1111/bcp.14801
Methaneethorn, J. (2018). A systematic review of population pharmacokinetics of valproic acid. Br. J. Clin. Pharmacol. 84 (5), 816–834. doi:10.1111/bcp.13510
Methaneethorn, J. (2017). Population pharmacokinetics of valproic acid in patients with mania: Implication for individualized dosing regimens. Clin. Ther. 39 (6), 1171–1181. doi:10.1016/j.clinthera.2017.04.005
Meyer, A., Zverinski, D., Pfahringer, B., Kempfert, J., Kuehne, T., Sündermann, S. H., et al. (2018). Machine learning for real-time prediction of complications in critical care: A retrospective study. Lancet Respir. Med. 6 (12), 905–914. doi:10.1016/S2213-2600(18)30300-X
Mould, D. R., and Upton, R. N. (2013). Basic concepts in population modeling, simulation, and model-based drug development-part 2: Introduction to pharmacokinetic modeling methods. CPT Pharmacometrics. Syst. Pharmacol. 2 (4), e38. doi:10.1038/psp.2013.14
Ogami, C., Tsuji, Y., Seki, H., Kawano, H., To, H., Matsumoto, Y., et al. (2021). An artificial neural network-pharmacokinetic model and its interpretation using Shapley additive explanations. CPT Pharmacometrics Syst. Pharmacol. 10 (7), 760–768. doi:10.1002/psp4.12643
Radzi, S., Karim, M., Saripan, M. I., Rahman, M., Isa, I., and Ibahim, M. J. (2021). Hyperparameter tuning and pipeline optimization via grid Search method and tree-based autoML in breast cancer prediction. J. Pers. Med. 11 (10), 978. doi:10.3390/jpm11100978
Romoli, M., Mazzocchetti, P., D'Alonzo, R., Siliquini, S., Rinaldi, V. E., Verrotti, A., et al. (2019). Valproic acid and epilepsy: From molecular mechanisms to clinical evidences. Curr. Neuropharmacol. 17 (10), 926–946. doi:10.2174/1570159X17666181227165722
Shapley, L. S. (1953). A value for n-person games. Contributions Theory Games 2, 307–317. doi:10.1515/9781400881970-018
Sherwin, C. M., Kiang, T. K., Spigarelli, M. G., and Ensom, M. H. (2012). Fundamentals of population pharmacokinetic modelling: Validation methods. Clin. Pharmacokinet. 51 (9), 573–590. doi:10.1007/BF03261932
Sibieude, E., Khandelwal, A., Hesthaven, J. S., Girard, P., and Terranova, N. (2021). Fast screening of covariates in population models empowered by machine learning. J. Pharmacokinet. Pharmacodyn. 48 (4), 597–609. doi:10.1007/s10928-021-09757-w
Song, C., Li, X., Mao, P., Song, W., Liu, L., and Zhang, Y. (2022). Impact of CYP2C19 and CYP2C9 gene polymorphisms on sodium valproate plasma concentration in patients with epilepsy. Eur. J. Hosp. Pharm. 29 (4), 198–201. doi:10.1136/ejhpharm-2020-002367
Štrumbelj, E., and Kononenko, I. (2014). Explaining prediction models and individual predictions with feature contributions. Knowl. Inf. Syst. 41, 647–665. doi:10.1007/s10115-013-0679-x
Tang, B. H., Guan, Z., Allegaert, K., Wu, Y. E., Manolis, E., Leroux, S., et al. (2021). Drug clearance in neonates: A combination of population pharmacokinetic modelling and machine learning approaches to improve individual prediction. Clin. Pharmacokinet. 60 (11), 1435–1448. doi:10.1007/s40262-021-01033-x
Wang, C. Y., Jiao, Z., Ding, J. J., Yu, E. Q., and Zhu, G. X. (2020). Remedial dosing recommendations for delayed or missed doses of valproic acid in patients with epilepsy based on Monte Carlo simulations. Epilepsy Behav. 111, 107265. doi:10.1016/j.yebeh.2020.107265
Wang, S., Li, J., Song, M., Yan, P., Ju, X., Liu, J., et al. (2021). Effect of CYP2C19 polymorphisms on serum valproic level acid in Chinese Han patients with schizophrenia. Sci. Rep. 11 (1), 23150. doi:10.1038/s41598-021-02628-x
Woillard, J. B., Labriffe, M., Debord, J., and Marquet, P. (2021a). Tacrolimus exposure prediction using machine learning. Clin. Pharmacol. Ther. 110 (2), 361–369. doi:10.1002/cpt.2123
Woillard, J. B., Labriffe, M., Prémaud, A., and Marquet, P. (2021b). Estimation of drug exposure by machine learning based on simulations from published pharmacokinetic models: The example of tacrolimus. Pharmacol. Res. 167, 105578. doi:10.1016/j.phrs.2021.105578
Xu, S., Chen, Y., Zhao, M., Guo, Y., Wang, Z., and Zhao, L. (2018). Population pharmacokinetics of valproic acid in epileptic children: Effects of clinical and genetic factors. Eur. J. Pharm. Sci. 122, 170–178. doi:10.1016/j.ejps.2018.06.033
Yaman, E., and Subasi, A. (2019). Comparison of bagging and boosting ensemble machine learning methods for automated EMG signal classification. Biomed. Res. Int. 2019, 9152506. doi:10.1016/10.1155/2019/9152506
Yang, C., Chen, M., and Yuan, Q. (2021). The application of XGBoost and SHAP to examining the factors in freight truck-related crashes: An exploratory analysis. Accid. Anal. Prev. 158, 106153. doi:10.1016/j.aap.2021.106153
Zang, Y. N., Guo, W., Dong, F., Li, A. N., de Leon, J., and Ruan, C. J. (2022b). Published population pharmacokinetic models of valproic acid in adult patients: A systematic review and external validation in a Chinese sample of inpatients with bipolar disorder. Expert Rev. Clin. Pharmacol., 1–15. doi:10.1080/17512433.2022.2075849
Zang, Y. N., Guo, W., Niu, M. X., Bao, S., Wang, Q., Wang, Y., et al. (2022a). Population pharmacokinetics of valproic acid in adult Chinese patients with bipolar disorder. Eur. J. Clin. Pharmacol. 78 (3), 405–418. doi:10.1007/s00228-021-03246-2
Zheng, P., Yu, Z., Li, L., Liu, S., Lou, Y., Hao, X., et al. (2021). Predicting blood concentration of tacrolimus in patients with autoimmune diseases using machine learning techniques based on real-world evidence. Front. Pharmacol. 12, 727245. doi:10.3389/fphar.2021.727245
Zhu, X., Huang, W., Lu, H., Wang, Z., Ni, X., Hu, J., et al. (2021a). A machine learning approach to personalized dose adjustment of lamotrigine using noninvasive clinical parameters. Sci. Rep. 11 (1), 5568. doi:10.1038/s41598-021-85157-x
Zhu, X., Xiao, T., Huang, S., Liu, S., Li, X., Shang, D., et al. (2021b). Case report: Predicting the range of lamotrigine concentration using pharmacokinetic models based on Monte Carlo simulation: A case study of antiepileptic drug-related leukopenia. Front. Pharmacol. 12, 706329. doi:10.3389/fphar.2021.706329
Keywords: machine learning, covariate, population pharmacokinetic, valproic acid, therapeutic drug monitoring, XGBoost, shap, Monte Carlo simulation
Citation: Zhu X, Zhang M, Wen Y and Shang D (2022) Machine learning advances the integration of covariates in population pharmacokinetic models: Valproic acid as an example. Front. Pharmacol. 13:994665. doi: 10.3389/fphar.2022.994665
Received: 15 July 2022; Accepted: 03 October 2022;
Published: 17 October 2022.
Edited by:
Zinnia P Parra-Guillen, University of Navarra, SpainReviewed by:
Tingjie Guo, Leiden University, NetherlandsEleni Karatza, University of North Carolina at Chapel Hill, United States
Copyright © 2022 Zhu, Zhang, Wen and Shang. This is an open-access article distributed under the terms of the Creative Commons Attribution License (CC BY). The use, distribution or reproduction in other forums is permitted, provided the original author(s) and the copyright owner(s) are credited and that the original publication in this journal is cited, in accordance with accepted academic practice. No use, distribution or reproduction is permitted which does not comply with these terms.
*Correspondence: Yuguan Wen, d2VueXVndWFuZGVkZUAxNjMuY29t; Dewei Shang, c2hhbmdfZGV3ZWlAMTYzLmNvbQ==
†These authors contributed equally to this work.