 Xue Ran
 Junyi Shi†
 Yalan Chen
 Kui Jiang
- Department of Medical Informatics, Nantong University, Nantong, China
Neuroimaging has been widely used as a diagnostic technique for brain diseases. With the development of artificial intelligence, neuroimaging analysis using intelligent algorithms can capture more image feature patterns than artificial experience-based diagnosis. However, using only single neuroimaging techniques, e.g., magnetic resonance imaging, may omit some significant patterns that may have high relevance to the clinical target. Therefore, so far, combining different types of neuroimaging techniques that provide multimodal data for joint diagnosis has received extensive attention and research in the area of personalized medicine. In this study, based on the regularized label relaxation linear regression model, we propose a multikernel version for multimodal data fusion. The proposed method inherits the merits of the regularized label relaxation linear regression model and also has its own superiority. It can explore complementary patterns across different modal data and pay more attention to the modal data that have more significant patterns. In the experimental study, the proposed method is evaluated in the scenario of Alzheimer’s disease diagnosis. The promising performance indicates that the performance of multimodality fusion via multikernel learning is better than that of single modality. Moreover, the decreased square difference between training and testing performance indicates that overfitting is reduced and hence the generalization ability is improved.
1 Introduction
Neuroimaging technologies are currently the most widely used methods to study brain diseases, and they can directly or indirectly image the nervous system. Common neuroimaging techniques include structural magnetic resonance imaging (sMRI), which can provide rich morphological features of brain tissues; functional magnetic resonance imaging (fMRI), which not only provides anatomical information but also shows the response mechanism of the nervous system; positron emission tomography (PET), which is the only novel imaging technique that can display biomolecular metabolism, receptors, and neuromediator activity in vivo; diffusion tensor imaging (DTI), which can reflect the structure of white matter fibrin in the brain, etc (Klöppel et al., 2012; Friston, 2009). Neuroimaging technologies play a very important role in the research of Alzheimer’s disease (AD) (Bao et al., 2021; Karikari et al., 2021; Zhang et al., 2021). Previous studies on AD and mild cognitive impairment (MCI) were often based on a single neuroimaging technique (single modality data). However, single modality data have obvious defects; they can only provide information on local brain abnormalities, which will affect the diagnostic accuracy of AD and MCI. In recent years, many studies have found that multimodal data have the advantage of realizing information complementation (Zhang et al., 2022a). The features of multimodal data can be combined to obtain more comprehensive disease information, which is of great significance for the early diagnosis and treatment of AD. In particular, with the development of artificial intelligence (AI) technologies, multimodal fusion has been developed rapidly for AD diagnosis studies. For example, Kohannim et al. (2010) used support vector machines (SVMs) to classify AD. When using MRI as single-modal data for experiments, the classification accuracy of AD vs. normal control (NC) and that of MCI vs. NC were 79.07% and 71.21%, respectively. When experiments were performed after combining MRI, fluorodeoxyglucose-PET, and cerebrospinal fluid (CSF), the classification accuracy of AD vs. NC and that of MC vs. NC were 90.70% and 75.76%, respectively. Compared to single modality, the classification accuracy is improved by 5–10%. Zhang et al. (2011) combined MRI, PET, and CSF for AD classification. A multikernel SVM was taken as the classifier. The classification accuracy of AD vs. NC was 93.2%. Compared with using single-modal data, the accuracy was improved by 7–10%. The accuracy of MCI vs. NC was 76.4%, which was an improvement of 4.4–5% compared to using single modality data. Buvaneswari and Gayathri (2021) combined the features extracted from DTI and fMRI into a multikernel SVM for AD classification, and the accuracy of AD vs. NC was 98.4%; however, when the two modalities were used alone for classification, the highest achieved accuracy was only 90.9%. The above research further verifies that in the classification of AD, compared with single-modal data, the use of multimodal data can obtain richer and more valuable features, and the classifier can obtain higher classification accuracy.
From existing studies regarding multimodality fusion, we found that classifiers based on multikernel learning were commonly used. This is because each modality can be mapped into the kernel space by a kernel function. Therefore, multikernel learning actually provides a natural framework for multimodality fusion. However, when multikernel learning is applied to practice, e.g., medical data analysis, overfitting often exists. Therefore, to overcome overfitting and to obtain promising prediction performance, in this study, according to regularized label relaxation linear regression (Fang et al., 2017), we integrate label relaxation and compactness graph mechanisms into multikernel learning and propose a new multikernel learning algorithm for AD diagnosis.
The main differences with the existing studies can be summarized as follows.
(1) Unlike the modality-consistent regularization used in previous studies (Jiang et al., 2016), the “all-single” fusion strategy is introduced so that every single feature and the possible combinations are all considered so that the complementary information can be fully explored.
(2) We extend the compactness graph mechanism from the linear space to the multikernel space so that the overfitting problems can be reduced in the multikernel space.
The remaining article is organized into four sections. In Section 2, we will state some related work regarding AI-assisted AD diagnosis based on multimodality fusion. In Section 3, we will present our new method and its optimization. In Section 4, we will report our experimental results and in the last, we will conclude our study and indicate our future work.
2 Related work
Multimodality fusion strategies can be divided into three levels: pixel-level fusion, feature-level fusion, and decision-level fusion (Xia et al., 2020). Pixel-level fusion is to directly perform pixel-related fusion based on strict registration. Feature-level fusion refers to transforming different modal data into high-dimensional feature spaces and then merging them before or during modeling. Decision-level fusion is to use certain strategies, such as voting, to fuse the decision result of each modal, to obtain the globally optimal result. In Table 1, we summarize some representative previous works belonging to these three categories.
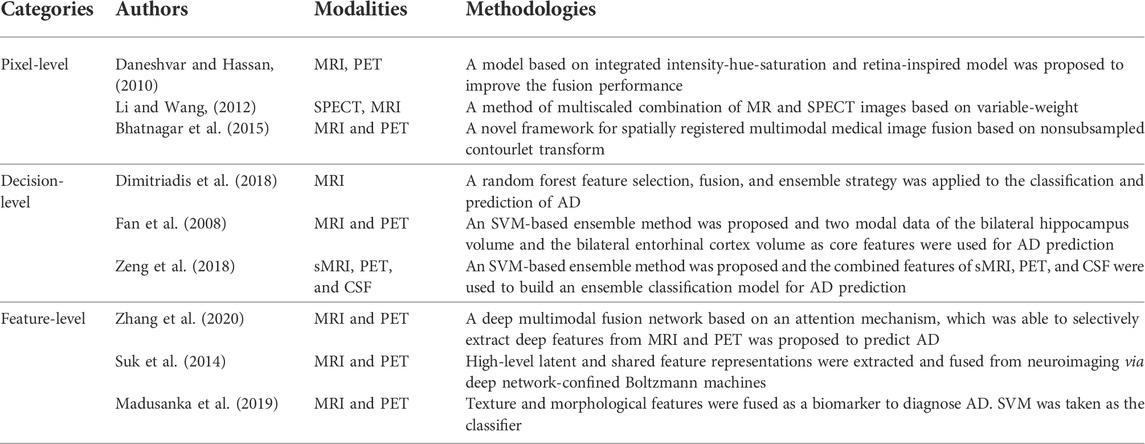
TABLE 1. Representative works of multimodality fusion.
Strict registration plays a key role in pixel-level fusion. For example, Daneshvar et al. proposed a fusion strategy based on integrated intensity-hue-saturation and retina-inspired model to improve the fusion performance. The strategy often used in decision-level fusion is ensemble learning. In the early studies of AD diagnosis, the most commonly used learning components in ensemble learning were SVM (Shukla et al., 2020) and also linear classifiers (Jiang et al., 2020), Bayesian networks (Zhang et al., 2017), decision trees (Zhang et al., 2020), etc. For example, Fan et al. (2008) took the two-modal data of the bilateral hippocampus volume and the bilateral entorhinal cortex volume as core features and used SVM as the learning component. The accuracies of AD vs. MCI, AD vs. NC, and MCI vs. NC are 58.30%, 82.00%, and 76.00% respectively.
Feature-level fusion has been widely used in AD studies. For example, Suk et al. (2014) obtained high-level latent and shared feature representations from neuroimaging via deep network-confined Boltzmann machines. In the binary classification of AD vs. NC and MCI vs. NC, maximum accuracies of 95.35% and 85.67% were finally obtained, respectively. Madusanka et al. (2019) used the fusion of texture and morphological features as a biomarker to diagnose AD and used SVM as the classifier. The classification accuracy reached 86.61%. Zhang et al. (2020) proposed a deep multimodal fusion network based on an attention mechanism, which was able to selectively extract deep features from MRI and PET, while suppressing irrelevant information. In the attention mechanism-based model, the fusion ratio of each modality is automatically assigned according to the importance of the modality. In addition, a hierarchical fusion method was adopted to ensure the effectiveness of multimodal data fusion. The final classification accuracies of NC vs. AD and SMCI vs. PMCI were 95.21% and 89.79%, respectively.
In this study, we also focus on feature-level fusion. From previous studies regarding feature-level fusion, we find that there are still some issues that should be addressed in the future.
(1) Most of the previous studies only direct concatenate features from different modalities and then input them into a model for AD prediction. This strategy does not consider complementary patterns across different modalities.
(2) Some multikernel-based studies achieved promising performance and also consider complementary patterns across different modalities. However, with a sparse or small training set, overfitting often occurs.
Therefore, to address the abovementioned issues, in this study, we will propose a novel multimodality fusion model at the feature-fusion level.
3 Data and methods
3.1 Data
The data (MRI and PET) used in this study were collected from Alzheimer’s Disease Neuroimaging Initiative. There are 103 subjects in the dataset, where 51 subjects were organized into the NC group and 52 subjects were organized into the AD group. We used the following workflows (Zhang et al., 2021), as shown in Figure 1, to perform data preprocessing.
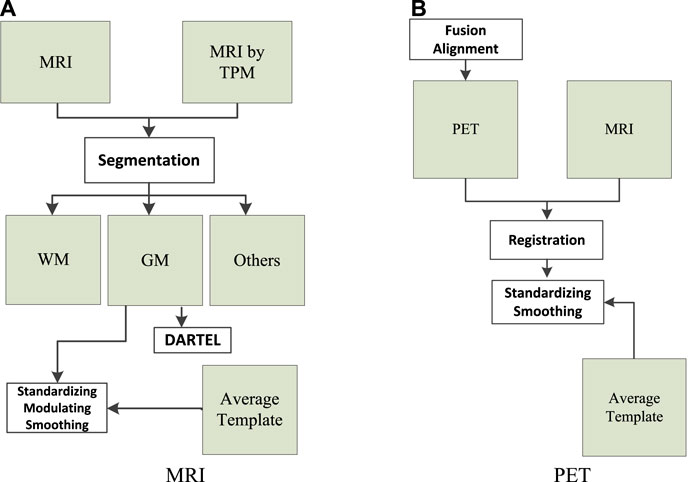
FIGURE 1. Data preprocessing: (A) magnetic resonance imaging (MRI) and (B) positron emission tomography (PET).
As can be seen from Figure 1A, the tissue probability map template was first used to segment the original MRI into white matter (WM), gray matter (GM), and other tissues. In particular, WM and GM tissues were mapped into the Montreal Neurological Institute (MNI) space during preprocessing. Second, diffeomorphic anatomical registration through exponentiated lie algebra (DARTEL) was employed to create average templates for the obtained WM and GM tissues. In the last, GM was modulated to transform the density information into volume information. In addition, GM was smoothed (8 mm Gaussian) to avoid the influences caused by noises.
As can be seen from Figure 1B, SPM-12 was employed to fuse these PET images (one subject has 96 images) to construct a 3-D image that provides brain spatial information and the feature information between tissue structures was also retained. Moreover, head motion was corrected. After fusion alignment, MRI and PET of each subject were registered and affinely aligned. In the last, the average template data generated in Figure 1A were used to spatially normalize all PET images to the standard MNI space. PET images were also smoothed (8 mm Gaussian) to avoid the influences caused by noises.
3.2 Methods
3.2.1 Kernelized regularized label relaxation
A regularized label relaxation (RLR) linear regression model was proposed to address the overfitting problem (Fang et al., 2017). The objective function is defined as follows:
where
where
In Eq. 3,
3.2.2 Multikernel kernelized regularized label relaxation
We know that multikernel learning provides us a natural framework for multimodal data fusion (Wang et al., 2021). Therefore, we can extend KRLR to its multikernel version by adjusting the generation way of the kernel Gram matrix. In this study, a linear combination is used to generate the new kernel Gram matrix in the multikernel space, that is,
By substituting Eq. 4 into Eq. 2, we can obtain the objective function of multikernel KRLR,
In Eq. 5, three components are required to be optimized; they are the transformation matrix
To devise the updating rule regarding the transformation matrix
By setting the derivation of Eq. 6 with respect to the transformation matrix
To devise the updating rule regarding the relaxation matrix
The solution of M can be finally obtained as follows:
To devise the updating rule regarding the kernel combination coefficient
From Eq. 10, it can be seen that the analytical solution of
where
3.3 Algorithm
Based on the solutions to the transformation matrix
Algorithm 1.
Input: Multi-modal training data
Output: Transformation matrix
Use “All-single” fusion strategy to obtain input data from
Randomize
Repeat
Update
Update
Update
Update
Set
Repeat
Update
Update
Update
Update
Update
Update
Until (
Until (convergence)
The time complexity of Algorithm 1 consists of 3 parts: the computation of4 Experimental results
4.1 Settings
The original features extracted from sMRI and PET images were represented in a very high-dimensional feature space. Therefore, the direct use of high-dimensional features for modeling will lead to the curse of dimensionality (Chandrashekar and Sahin, 2014). That is to say, samples become very sparse in the high-dimensional space, so the discriminability between samples will be significantly reduced. Therefore, before modeling, feature selection was performed to reduce the dimension of feature spaces. In this study, the Fish score was employed as the supervised method to reduce the irrelevant features to the outcome. In Fish score, we select the first 30 features with the highest-ranking values for the next unsupervised feature selection. Person score was employed as the unsupervised method to reduce the redundancy between features. In Person score, the threshold is set to 0.4.
Regarding multikernel learning, the “all-single” strategy, as shown in Figure 2, was adopted to fuse sMRI features and PET features. In Figure 3, “A” represents the combined features of sMRI and PET, “S” represents each sMRI or PET feature, and “KM” denotes the kernel matrix. Suppose we had a dataset
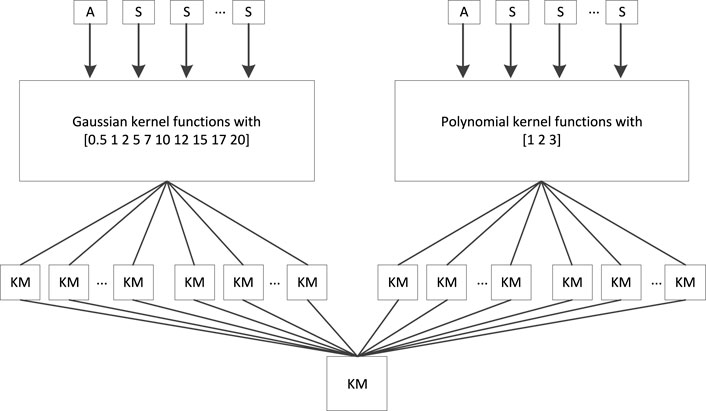
FIGURE 2. “All-single” fusion strategy.
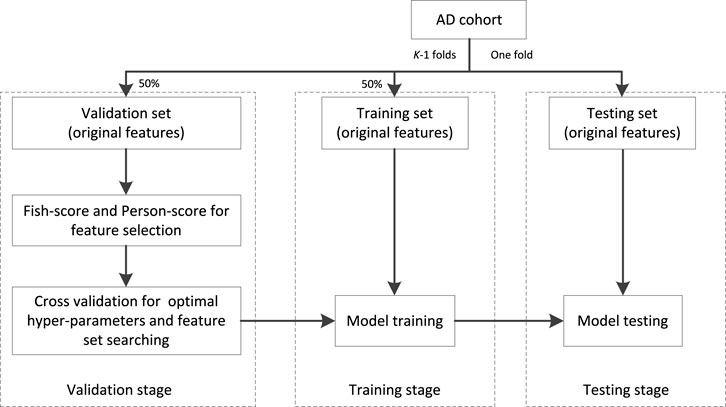
FIGURE 3. Workflow of training.
The workflow chart of training is shown in Figure 3. The AD cohort is first partitioned into K (K = 5 in our study) folds, one is taken as the testing set and the remaining are taken as the validation set (50%) and training set (50%). At the stage of validation, the Fish score is employed as the supervised method to reduce the irrelevant features to the outcome. Person score is employed as the unsupervised method to reduce the redundancy between features. Then the cross-validation (5-CV) strategy is used to determine the optimal feature set and hyper parameters (the regularized parameter
To highlight the performance of our multimodality fusion method, a single modality model ridge regression (RR) and 4 multimodality fusion models, i.e., MV-TSK-FS (Jiang et al., 2016), simpleMKL (Rakotomamonjy et al., 2008), RFF-MKL (Liu et al., 2013), and MV-L2-SVM (Wang et al., 2015), are introduced for comparison study. Table 2 shows the parameter settings of RR and our method.
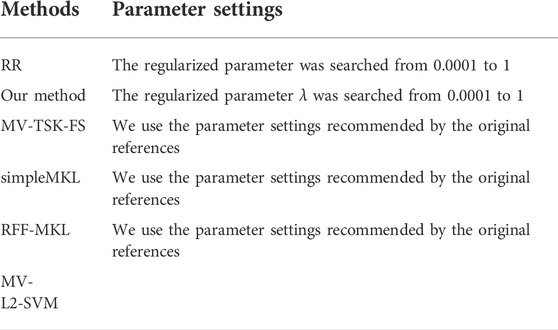
TABLE 2. Parameter settings.
4.2 Result analysis
The experimental results were reported from three aspects, i.e., feature selection of every single modality, comparison between single modality and multimodality in terms of AUC, and overfitting analysis in terms of the discrepancy between training and testing.
4.2.1 Feature selection of every single modality
In this study, before modality fusion, we have to select the best model for every single modality. That is to say, we should find an optimal feature subset for each modality. As we stated before, the Fish score was employed as the supervised method to reduce the irrelevant features to the outcome. Person score was employed as the unsupervised method to reduce the redundancy between features. After the two-step feature selection, we select the optimal feature set that deduces the best training AUC. As shown in Figure 4, for sMRI, it can be found that the first 6 features were selected for the following modality fusion, and for PET, the first 7 features were selected for the following modality fusion.
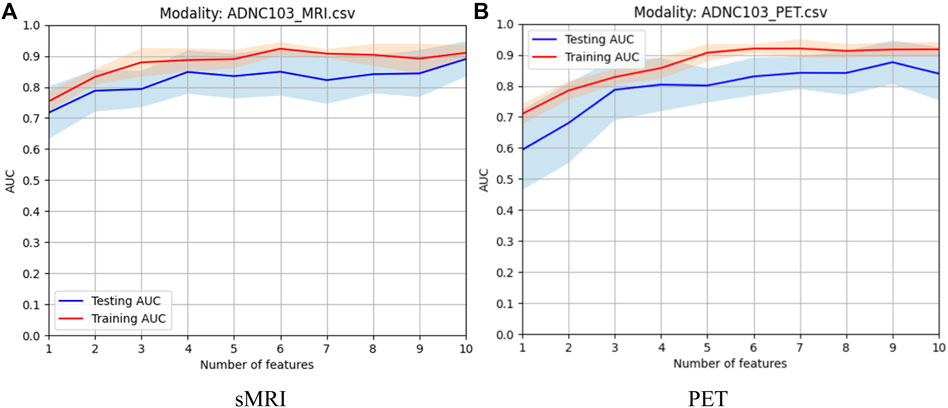
FIGURE 4. Model selection of every single modality: (A) sMRI and (B) PET.
4.2.2 Comparison between single modality and multimodality
When the optimal feature sets of sMRI and PET were combined, feature redundancy between different modalities may also exist. Therefore, Person score was also employed as the unsupervised method to reduce the redundancy across different modalities. After this procedure, the best model can be obtained by finding the best training AUC. As shown in Figure 5, the first 12 features can generate the best model.
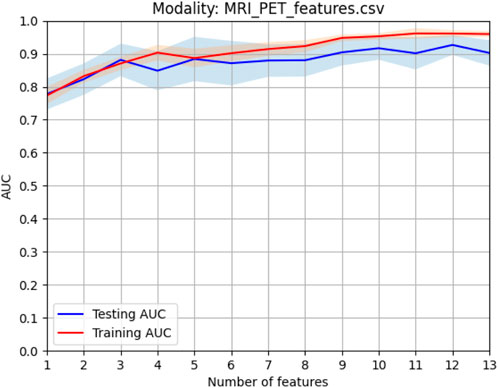
FIGURE 5. Model selection of combined features.
Figure 6 shows the comparison results in terms of the ROC curve of sMRI, PET, and their combination. It can be found that the testing AUC of multimodality fusion is 0.9188, which is better than that of every single modality. This is because each modality is mapped into the kernel space and multikernel learning can explore the complementary information between the two modalities. In addition, from Eq. 10, we can see that the coefficient of the kernel matrix is sparse so that the modality which contains more patterns is endowed with more attention.
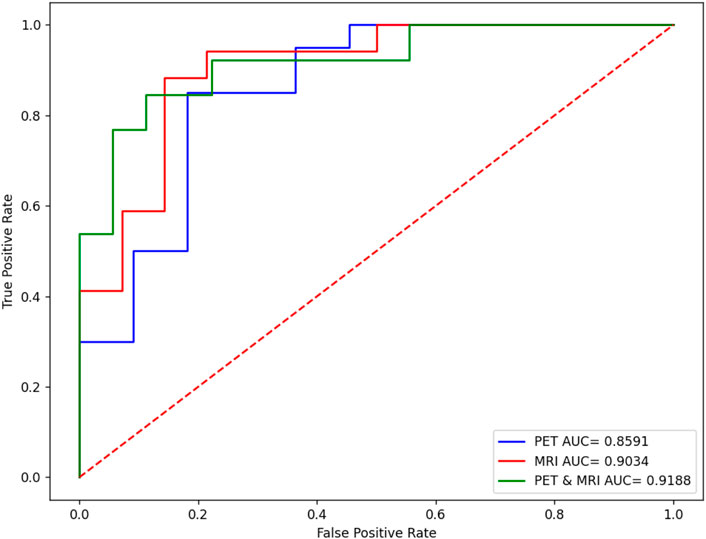
FIGURE 6. Performance comparison of sMRI, PET, and their combination.
4.2.3 Comparison with state-of-art multimodality methods
To highlight the promising performance of the proposed method, we introduce 4 state-of-art multimodality fusion methods for comparison studies. In addition to AUC, accuracy is also introduced to measure the classification performance. Table 3 shows the comparison results in terms of both accuracy and AUC, where the best results are marked in bold, and “*” means that the difference between state-of-art methods and the proposed method is significant.
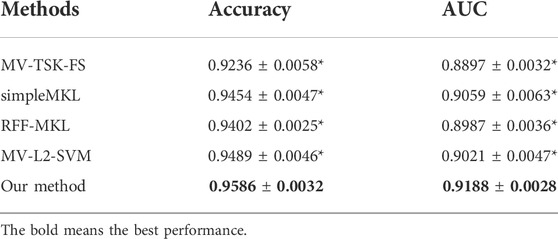
TABLE 3. Comparison with state-of-art multimodality methods in terms of accuracy and AUC.
From Table 3, we can find that our method achieves the best performance. In particular, simpleMKL and RFF-MKL are also multikernel-based methods, but both of them perform worse than our method. This phenomenon indicates that label relaxation and compactness graph mechanisms are useful to improve the classification performance. In addition, we see that MV-TSK-FS and MV-L2-SVM perform worse than multikernel-based methods. This is because MV-TSK-FS and MV-L2-SVM both used modality-consistent regularization to achieve multimodality fusion, which did not consider the complementary information across different modalities. With the “all-single” fusion strategy used in multikernel-based methods, every single feature and the possible combinations are all considered so that the complementary information can be fully explored.
4.2.4 Overfitting analysis
From Eq. 10, we can see that
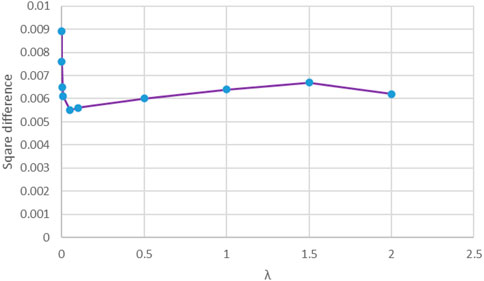
FIGURE 7. Square difference against the regularized parameter
5 Conclusion
In the area of personalized medicine, multimodal neuroimage data fusion plays a significant role in brain disease diagnosis. Multikernel learning actually provides a natural framework for multimodality fusion. However, when multikernel learning is applied to practice, e.g., medical data analysis, overfitting often exists. Therefore, in this study, according to RLR linear regression, we integrate label relaxation and compactness graph mechanisms into multikernel learning and propose a new multikernel learning algorithm for AD diagnosis. In the experimental study, the proposed method is evaluated in the scenario of AD diagnosis. The promising performance indicates the advantages of our method. However, from Figure 2, we can find that there are many kernel matrices generated during model training, which may consume a lot of CPU seconds and storage memory. Therefore, how to speed up the training and reduce storage memory is a hot topic in our future work.
Data availability statement
Publicly available datasets were analyzed in this study. The data are available on http://adni.loni.usc.edu/about/.
Author contributions
XR and JS contributed to coding and manuscript writing. YC contributed to data preprocessing. KJ supervised the whole study.
Funding
This work was partly supported by the Postgraduate Research & Practice Innovation Program of Jiangsu Province (No. KYCX21_3105).
Acknowledgments
We thank the reviewers whose comments and suggestions helped improve this manuscript.
Conflict of interest
The authors declare that the research was conducted in the absence of any commercial or financial relationships that could be construed as a potential conflict of interest.
Publisher’s note
All claims expressed in this article are solely those of the authors and do not necessarily represent those of their affiliated organizations, or those of the publisher, the editors, and the reviewers. Any product that may be evaluated in this article, or claim that may be made by its manufacturer, is not guaranteed or endorsed by the publisher.
References
Bao, W., Xie, F., Zuo, C., Guan, Y., and Huang, Y. H. (2021). PET neuroimaging of Alzheimer's disease: radiotracers and their utility in clinical research. Front. Aging Neurosci. 13, 624330. doi:10.3389/fnagi.2021.624330
Bhatnagar, Gaurav, Wu, Q. M. Jonathan, and Zheng, Liu (2015). A new contrast based multimodal medical image fusion framework. Neurocomputing 157, 143–152. doi:10.1016/j.neucom.2015.01.025
Buvaneswari, P. R., and Gayathri, R. (2021). Detection and Classification of Alzheimer’s disease from cognitive impairment with resting-state fMRI. Neural Comput. Appl., 1–16. doi:10.1007/s00521-021-06436-2
Chandrashekar, G., and Sahin, F. (2014). A survey on feature selection methods. Comput. Electr. Eng. 40 (1), 16–28. doi:10.1016/j.compeleceng.2013.11.024
Daneshvar, Sabalan, and Hassan, Ghassemian (2010). MRI and PET image fusion by combining IHS and retina-inspired models. Inf. fusion 11 (2), 114–123. doi:10.1016/j.inffus.2009.05.003
Dimitriadis, Stavros I., Liparas, D., and Tsolaki, M. N. (2018). Random forest feature selection, fusion and ensemble strategy: Combining multiple morphological MRI measures to discriminate among healthy elderly, MCI, cMCI and Alzheimer's disease patients: From the Alzheimer's disease neuroimaging initiative (ADNI) database. J. Neurosci. Methods 302, 14–23. doi:10.1016/j.jneumeth.2017.12.010
Fan, Y., Batmanghelich, N., Clark, C. M., and Davatzikos, C. (2008). Spatial patterns of brain atrophy in MCI patients, identified via high-dimensional pattern classification, predict subsequent cognitive decline. Neuroimage 39 (4), 1731–1743. doi:10.1016/j.neuroimage.2007.10.031
Fang, X., Xu, Y., Li, X., Lai, Z., Wong, W. K., Fang, B., et al. (2017). Regularized label relaxation linear regression. IEEE Trans. Neural Netw. Learn. Syst. 29 (4), 1006–1018. doi:10.1109/TNNLS.2017.2648880
Friston, K. J. (2009). Modalities, modes, and models in functional neuroimaging. Science 326 (5951), 399–403. doi:10.1126/science.1174521
Jiang, Y., Deng, Z., Chung, F. L., Wang, G., Qian, P., Choi, K. S., et al. (2016). Recognition of epileptic EEG signals using a novel multiview TSK fuzzy system. IEEE Trans. Fuzzy Syst. 25 (1), 3–20. doi:10.1109/tfuzz.2016.2637405
Jiang, Y., Zhang, Y., Lin, C., Wu, D., and Lin, C. T. (2020). EEG-based driver drowsiness estimation using an online multi-view and transfer TSK fuzzy system. IEEE Trans. Intell. Transp. Syst. 22 (3), 1752–1764. doi:10.1109/tits.2020.2973673
Karikari, T. K., Benedet, A. L., Ashton, N. J., Lantero Rodriguez, J., Snellman, A., Suarez-Calvet, M., et al. (2021). Diagnostic performance and prediction of clinical progression of plasma phospho-tau181 in the Alzheimer’s Disease Neuroimaging Initiative. Mol. Psychiatry 26 (2), 429–442. doi:10.1038/s41380-020-00923-z
Klöppel, S., Abdulkadir, A., Jack, C. R., Koutsouleris, N., Mourão-Miranda, J., Vemuri, P., et al. (2012). Diagnostic neuroimaging across diseases. Neuroimage 61 (2), 457–463. doi:10.1016/j.neuroimage.2011.11.002
Kohannim, O., Hua, X., Hibar, D. P., Lee, S., Chou, Y. Y., Toga, A. W., et al. (2010). Boosting power for clinical trials using classifiers based on multiple biomarkers. Neurobiol. Aging 31, 1429–1442. doi:10.1016/j.neurobiolaging.2010.04.022
Li, Tianjie, and Wang, Yuanyuan (2012). Multiscaled combination of MR and SPECT images in neuroimaging: a simplex method based variable-weight fusion. Comput. Methods Programs Biomed. 105 (1), 31–39. doi:10.1016/j.cmpb.2010.07.012
Liu, F., Zhou, L., Shen, C., and Yin, J. (2013). Multiple kernel learning in the primal for multimodal Alzheimer’s disease classification. IEEE J. Biomed. Health Inf. 18 (3), 984–990. doi:10.1109/JBHI.2013.2285378
Madusanka, N., Choi, H. K., So, J. H., and Choi, B. K. (2019). Alzheimer's Disease classification based on multi-feature fusion. Curr. Med. Imaging Rev. 15 (2), 161–169. doi:10.2174/1573405614666181012102626
Rakotomamonjy, A., Bach, F., Canu, S., and Grandvalet, Y. (2008). SimpleMKL. J. Mach. Learn. Res. 9, 2491–2521.
Shukla, P., Verma, A., Verma, S., and Kumar, M. (2020). Interpreting SVM for medical images using Quadtree. Multimed. Tools Appl. 79 (39), 29353–29373. doi:10.1007/s11042-020-09431-2
Suk, H. I., Lee, S. W., and Shen, D. (2014). Hierarchical feature representation and multimodal fusion with deep learning for AD/MCI diagnosis. NeuroImage 101, 569–582. doi:10.1016/j.neuroimage.2014.06.077
Wang, G., Deng, Z., and Choi, K. S. (2015). “Detection of epileptic seizures in EEG signals with rule-based interpretation by random forest approach,” in International Conference on Intelligent Computing, Fuzhou, China, 20-23 Aug 2015 (Cham: Springer), 738–744.
Wang, P., Qiu, C., Wang, J., Wang, Y., Tang, J., Huang, B., et al. (2021). Multimodal data fusion using non-sparse multi-kernel learning with regularized label softening. IEEE J. Sel. Top. Appl. Earth Obs. Remote Sens. 14, 6244–6252. doi:10.1109/jstars.2021.3087738
Xia, K., Zhang, Y., Jiang, Y., Qian, P., Dong, J., Yin, H., et al. (2020). TSK fuzzy system for multi-view data discovery underlying label relaxation and cross-rule & cross-view sparsity regularizations. IEEE Trans. Ind. Inf. 17 (5), 3282–3291. doi:10.1109/tii.2020.3007174
Xiang, S., Nie, F., Meng, G., Pan, C., and Zhang, C. (2012). Discriminative least squares regression for multiclass classification and feature selection. IEEE Trans. Neural Netw. Learn. Syst. 23 (11), 1738–1754. doi:10.1109/TNNLS.2012.2212721
Zeng, N., Qiu, H., Wang, Z., Liu, W., Zhang, H., Li, Y., et al. (2018). A new switching-delayed-PSO-based optimized SVM algorithm for diagnosis of Alzheimer’s disease. Neurocomputing 320, 195–202. doi:10.1016/j.neucom.2018.09.001
Zhang, D., Wang, Y., Zhou, L., Yuan, H., and Shen, D. (2011). Multimodal classification of Alzheimer’s disease and mild cognitive impairment. Neuroimage 55 (3), 856–867. doi:10.1016/j.neuroimage.2011.01.008
Zhang, Y., Chung, F. L., and Wang, S. (2020). Clustering by transmission learning from data density to label manifold with statistical diffusion. Knowledge-Based Syst. 193, 105330. doi:10.1016/j.knosys.2019.105330
Zhang, Y., Ishibuchi, H., and Wang, S. (2017). Deep Takagi–Sugeno–Kang fuzzy classifier with shared linguistic fuzzy rules. IEEE Trans. Fuzzy Syst. 26 (3), 1535–1549. doi:10.1109/tfuzz.2017.2729507
Zhang, Y., Xia, K., Jiang, Y., Qian, P., Cai, W., Qiu, C., et al. (2022a). Multi-modality fusion & inductive knowledge transfer underlying non-sparse multi-kernel learning and distribution adaption. IEEE/ACM Trans. Comput. Biol. Bioinform., 1. doi:10.1109/TCBB.2022.3142748
Zhang, Y., Lam, S., Yu, T., Teng, X., Zhang, J., Lee, F. K. H., et al. (2022b). Integration of an imbalance framework with novel high-generalizable classifiers for radiomics-based distant metastases prediction of advanced nasopharyngeal carcinoma. Knowledge-Based Syst. 235, 107649. doi:10.1016/j.knosys.2021.107649
Keywords: neuroimaging, personalized medicine, multimodal data fusion, multikernel learning, magnetic resonance imaging, positron emission tomography
Citation: Ran X, Shi J, Chen Y and Jiang K (2022) Multimodal neuroimage data fusion based on multikernel learning in personalized medicine. Front. Pharmacol. 13:947657. doi: 10.3389/fphar.2022.947657
Received: 19 May 2022; Accepted: 28 June 2022;
Published: 17 August 2022.
Edited by:
Khairunnisa Hasikin, University of Malaya, MalaysiaReviewed by:
Wei Hong Lim, UCSI University, MalaysiaJerline Sheebha Anni D, KMCT College of Engineering for Women, India
Copyright © 2022 Ran, Shi, Chen and Jiang. This is an open-access article distributed under the terms of the Creative Commons Attribution License (CC BY). The use, distribution or reproduction in other forums is permitted, provided the original author(s) and the copyright owner(s) are credited and that the original publication in this journal is cited, in accordance with accepted academic practice. No use, distribution or reproduction is permitted which does not comply with these terms.
*Correspondence: Kui Jiang, a3VpakBudHUuZWR1LmNu
†These authors have contributed equally to this work.