
94% of researchers rate our articles as excellent or good
Learn more about the work of our research integrity team to safeguard the quality of each article we publish.
Find out more
ORIGINAL RESEARCH article
Front. Pharmacol. , 22 August 2022
Sec. Renal Pharmacology
Volume 13 - 2022 | https://doi.org/10.3389/fphar.2022.931282
Background: Diabetic kidney disease (DKD) is the leading cause of end-stage renal disease. This study explored the core genes and pathways associated with DKD to identify potential diagnostic and therapeutic targets.
Methods: We downloaded microarray datasets GSE96804 and GSE104948 from the Gene Expression Omnibus (GEO) database. The dataset includes a total of 53 DKD samples and 41 normal samples. Differentially expressed genes (DEGs) were identified using the R package “limma”. The Metascape database was subjected to Gene Ontology (GO) function and Kyoto Encyclopedia of Genes and Genomes (KEGG) pathway enrichment analyses to identify the pathway and functional annotations of DEGs. A WGCAN network was constructed, the hub genes in the turquoise module were screened, and the core genes were selected using LASSO regression to construct a diagnostic model that was then validated in an independent dataset. The core genes were verified by in vitro and in vivo experiments.
Results: A total of 430 DEGs were identified in the GSE96804 dataset, including 285 upregulated and 145 downregulated DEGs. WGCNA screened out 128 modeled candidate gene sets. A total of eight genes characteristic of DKD were identified by LASSO regression to build a prediction model. The results showed accuracies of 99.15% in the training set (GSE96804) and 94.44% and 100%, respectively, in the test (GSE104948-GPL22945 and GSE104948-GPL24120). Three core genes (OAS1, SECTM1, and SNW1) with high connectivity were selected among the modeled genes. In vitro and in vivo experiments confirmed the upregulation of these genes.
Conclusion: Bioinformatics analysis combined with experimental validation identified three novel DKD-specific genes. These findings may advance our understanding of the molecular basis of DKD and provide potential therapeutic targets for its clinical management.
Diabetic kidney disease (DKD) is one of the most common microvascular complications of diabetes and the leading cause of end-stage renal disease (ESRD) worldwide (Alicic et al., 2017). The main lesion of DKD is located in the glomeruli and is characterized by extracellular matrix deposition and thickening of the basement membrane (Wada and Makino, 2013). The etiology and pathogenesis of DKD are not yet fully understood. The early diagnosis of DKD has traditionally been made based on the presence of microalbuminuria (MA) and the course of diabetes mellitus (DM) (Papadopoulou-Marketou et al., 2017). However, this method is not accurate since only 30% of cases were confirmed by pathology, while others were primary glomerular diseases superimposed on DM (Oh et al., 2012). Therefore, the early diagnosis of DKD based on clinical indicators is insufficient and biomarkers are lacking.
In recent decades, an increasing number of biomarkers for DKD have been reported (Levey et al., 2011; Van et al., 2017). Bioinformatics technology has also been used to identify biomarkers that are closely related to disease progression and to find new targets for the early diagnosis and treatment of diseases (Udhaya Kumar et al., 2020).
The present study analyzed the GEO database (GSE96804, GSE104948 datasets) to find potential biomarkers for DKD. We also constructed diabetic nephropathy models in mice and mesangial cells. We further performed in vivo and in vitro experiments to verify the reliability of the core genes as DKD biomarkers. The results of this study may provide new clues for the diagnosis and potential therapeutic targets of DKD.
We downloaded the Series Matrix Files of GSE96804 and GSE104948 from the GEO database (http://www.ncbi.nlm.nih.gov/geo). GSE96804 included 41 DKD kidney tissue samples and 20 control samples based on the GPL1261 annotation platform. GSE104948 contains two annotation platform files. GSE104948-GPL22945 included seven DKD kidney tissue samples and 18 control samples. GSE104948-GPL24120 included five DKD kidney tissue samples and three control samples. Based on the above datasets, this study included a total of 53 DKD and 41 healthy control glomerular samples. Differential analysis was performed using the R package “limma” to explore the differences in the molecular mechanisms of DKD.
Differential genes were functionally annotated using the Metascape database (http://metascape.org) to comprehensively explore their functional relevance. Gene ontology (GO) and Kyoto Encyclopedia of Genomes (KEGG) pathway analyses were performed on specific genes. A minimum overlap ≥3 and p ≤ 0.01 were considered statistically significant.
After identifying differential genes, LASSO regression was used to further construct a prediction model. After incorporating the expression values for each gene, a scoring formula for each patient was constructed and weighted by its estimated regression coefficients in a LASSO regression analysis. According to the scoring formula, the median risk score value was used as the cut-off point. The patients were divided into high-scoring and low-scoring groups. ROC curves were used to assess the accuracy of the model prediction.
We constructed a weighted gene co-expression network to search for co-expressed gene modules. We further explored the relationships between gene networks, phenotypes, and the core genes. Co-expression networks of differential genes in the GSE96804 dataset were constructed using the WGCNA-R package, with the soft threshold set to eight (Chen et al., 2019). The weighted adjacency matrix was transformed into a topological overlap matrix (TOM) to estimate the degree of network connectivity. The hierarchical clustering method was used to construct the clustering tree structure of the TOM matrix. Different branches and colors of the clustering tree represented different gene modules. Genes were classified according to their expression patterns based on their weighted correlation coefficients. Genes with similar patterns were grouped into a module such that all genes were divided into multiple modules based on the gene expression patterns.
Based on the similarity in GO semantics for gene annotation, we ranked proteins according to the functional similarities between them and their interacting partners. GO semantic similarity has been validated by correlation with gene expression profiles, providing a basis for the functional comparison of gene products. Thus, it has been widely used in bioinformatics, such as in protein-protein interaction analysis, pathway analysis, and gene function prediction. In the present study, we measured the functional similarity between proteins. Functional similarity was defined as the geometric mean of the semantic similarity of GO in terms of molecular function (MF) and biological pathway (BP). The aim was to measure the strength of the relationship between each protein and its interacting proteins by considering the function and pathway. Semantic similarity between interacting histones in MF and BP was assessed by using the GOSe disease im package, which was performed more accurately by considering the GO topology (Wang et al., 2007). Functional similarity was further estimated based on the geometric mean of semantic similarity in MF and BP.
CIBERSORT is a widely used evaluation method for immune cell types in the micro-environment. This method is based on the principle of support vector regression to perform a deconvolution analysis of the expression matrix of immune cell subtypes. CIBERSORT contains 547 biomarkers that distinguish 22 human immune cell phenotypes, including T, B, plasma, and myeloid subsets. In this study, we applied the CIBERSORT algorithm to analyze patient data to infer the relative proportions of the 22 types of immune infiltrating cells and to perform Spearman correlation analyses of gene expression and immune cell content.
GSEA analysis uses a predefined set of genes. It ranks genes according to their degree of differential expression in two types of samples and then tests whether the predefined gene set is enriched at the top or bottom of the ranking list. In this study, GSEA was used to compare the differences in the KEGG signaling pathway between the high expression group and the low expression group, and to explore the molecular mechanism of the core genes in the two groups of patients. The number of substitutions was set to 1,000, and the substitution type was set to phenotype.
Competing endogenous RNA (ceRNA) has attracted research attention in recent years. They represent a completely new mode of gene expression regulation. Compared to the miRNA regulatory network, the ceRNA regulatory network is more elaborate and complex. It involves many more RNA molecules, including mRNA, pseudogenes encoding genes, miRNAs, lncRNAs, etc. The NPInter database is commonly used to query the relationship between lncRNAs and miRNAs. We used the NPInter database to predict lncRNA-miRNA interaction pairs. In addition, we also used the combined miRcode database to back-predict mRNA-miRNA interactions. A lncRNA-miRNA-mRNA network was then established by combining lncRNA-miRNA and mRNA-miRNA interactions and visualized using Cytoscape.
Male C57BL/6 mice (6–8 weeks) were used to construct the diabetes model. Each group included five mice. The grouping was randomized.
The mouse model of diabetes was induced by intraperitoneal injection of STZ (Sigma-Aldrich) at 50 mg/kg body weight in 100 mmol/L sodium citrate (pH 4.5) for five consecutive days (n = 5). All mice were euthanized at the 20th week, the fasting blood glucose levels of all groups were measured, and 24 h urine and kidney tissue were collected. All animal experimental protocols were approved by the Animal Care and Use Committee of Zhengzhou University (2019-KY-43).
Human mesangial cells (HMC) were purchased from the American Type Culture Collection. Cells were cultured in DMEM medium (Gibco) containing 10% fetal bovine serum (FBS, Gibco) at 37°C in a 5% CO2 atmosphere. HMCs were cultured in normal glucose (5.5 mmol/L) or high D-glucose (40 mmol/L) medium for 24 h.
Immunohistochemical staining was performed using standard protocols. Sections were prepared for immunohistochemistry with primary antibodies for rabbit polyclonal anti-SNW1 (ab167165, Abcam), anti-OAS1 (14955-1-AP, Proteintech), anti-SECTM1 (bs-10153R, Bioss), anti-CD4 (ab183685, Abcam), and secondary antibodies for Goat anti-Rabbit IgG.
RNA was extracted using Takara RR420 and RR036A isolation kits according to the manufacturer’s instructions. First-strand cDNA synthesis was performed using PrimeScript reverse transcriptase (Takara RR420). qPCR was performed using the Takara RR036A kit. β-Actin was used as an internal reference. The relative expression levels of the target genes were calculated using the 2−ΔΔCt method. A p-value < 0.05 was considered significant. The primer sequences are summarized in Supplementary Table S1. All PCR reactions were conducted in triplicate.
Total proteins were extracted from cells and tissues using RIPA buffer. Proteins of different molecular weights were separated by SDS-PAGE. The proteins were then electrotransferred onto PVDF membranes, which were placed in 5% nonfat milk and blocked for 1 h at room temperature before incubation with specific primary antibodies, including anti-SNW1 (ab167165, Abcam), anti-OAS1 (14955-1-AP, Proteintech), anti-SECTM1 (bs-10153R, Bioss) overnight at 4°C. The membranes were then incubated with secondary antibody (ab205718, Abcam) for 1.5 h at room temperature. The protein bands were visualized and analyzed using enhanced chemiluminescence reagents (UElandy) and ImageJ (National Institutes of Health, V1.8.0).
All statistical analyses were performed in R (version 3.6). All statistical tests were two-sided and p < 0.05 was considered statistically significant.
Figure 1 shows the workflow of the present study. We downloaded the GSE96804 dataset from the NCBI GEO public database. The 61 groups included 20 in the normal group and 41 in the DKD group. We used the limma package to calculate the differential genes between the two groups (p < 0.05 and |Log2FC|>1). A total of 430 differential genes were screened, including 285 upregulated genes and 145 downregulated genes, as shown by the Volcano map and differential gene heatmap (Figures 2A, B). Enrichment analysis of these 430 differential genes through the Metascape online database showed that these genes were mainly enriched in unsaturated fatty acid biosynthetic process, positive regulation of receptor signaling pathway via JAK-STAT, carbohydrate metabolic processing, protein processing in the endoplasmic reticulum, and prion diseases (Figures 3A, B).
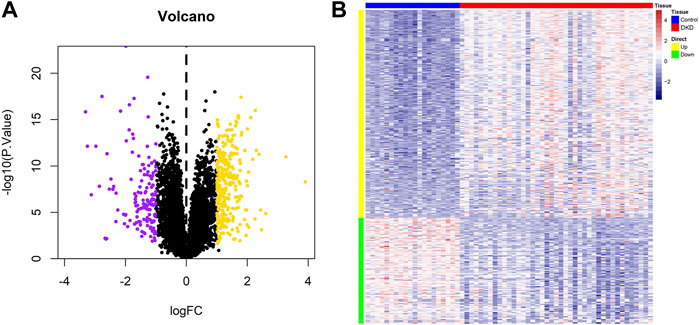
FIGURE 2. Identification of differential genes in DKD. (A) Volcano plot of the differential expression of GSE96804. Purple and yellow indicate the down-regulation and upregulation of differential expression, respectively (screening conditions: p < 0.05 and |Log2FC|>0.585). (B) Heatmap of differential gene expression.
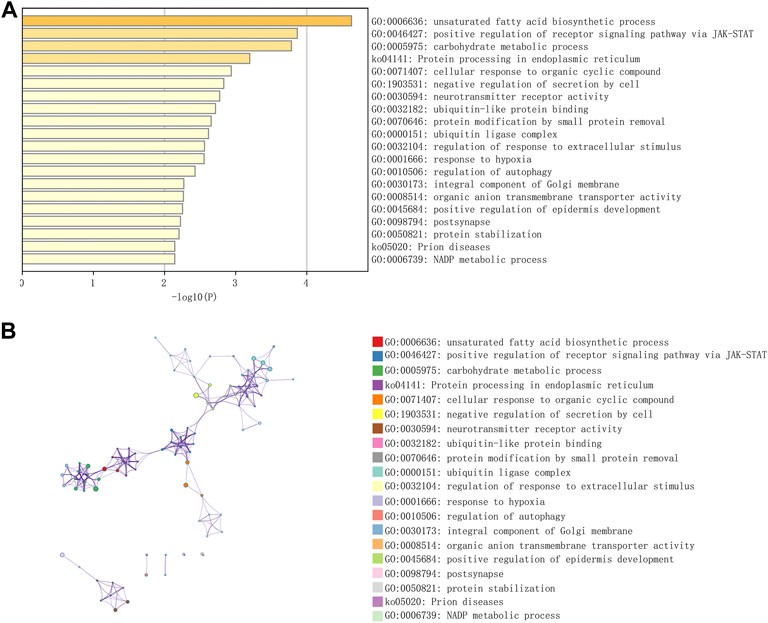
FIGURE 3. Functional enrichment of differential genes in DKD. (A) GO-KEGG enrichment analysis of differential genes from the Metascape database. (B) A cluster network of enriched pathways, in which nodes that share the same cluster are often located close to each other.
To identify the key genes in the differential gene set, we constructed a WGCNA network based on the differential genes in GSE96804. The soft threshold was set to 8, as determined by the “sft$powerEstimate” function. The gene modules were then detected based on the tom matrix. A total of four gene modules were detected: blue (82), brown (67), grey (12), and turquoise (268). The turquoise module showed the highest correlation [cor = 0.85, p = (2e−18)]. We screened the hub genes in the turquoise module based on the criteria of |MM|>0.8 and |GS|>0.5. A total of 128 genes were eligible and were modeled as a candidate gene set (Figures 4A–E).
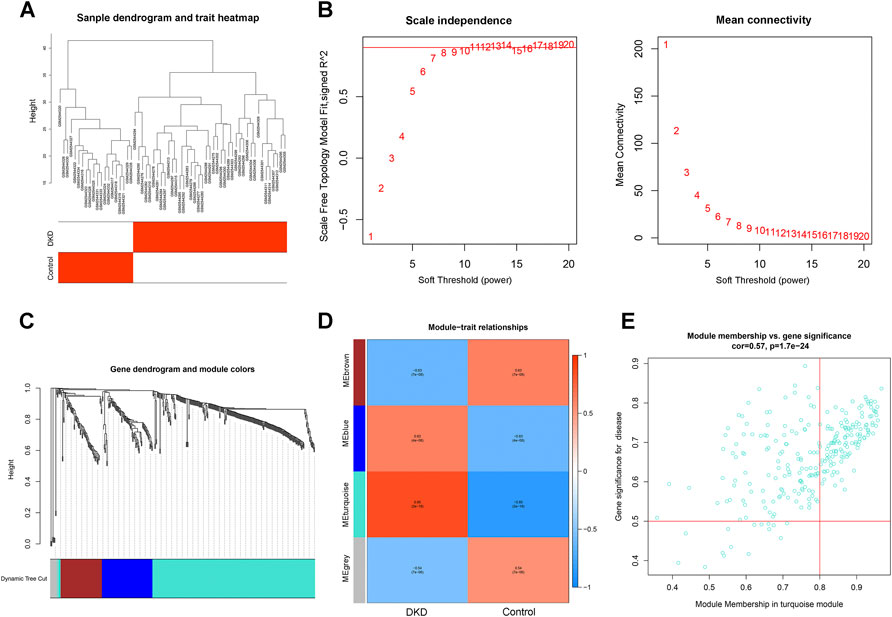
FIGURE 4. Construction of a WGNCA network. (A) Clustering heatmap of control and DKD samples. (B) Scale-free exponent and average connectivity for each soft threshold. (C) Dendrogram of gene clusters, with different colors representing different modules. (D) Heatmap of the correlations between module eigengenes and DKD. Blue and red indicate negative and positive correlations, respectively. The turquoise module with the highest correlation was selected for subsequent analysis. (E) Scatter plot of genes in the turquoise module. The hub genes in the turquoise module were screened according to the criteria of |MM|>0.8 and |GS|>0.5.
Dataset GSE96804 was defined as the training set, while datasets GSE104948-GPL22945 and GSE104948-GPL24120 were defined as the validation sets. We selected the candidate genes for modeling in previous steps for feature screening through LASSO regression. The results of the LASSO regression identified eight genes as characteristic genes of DKD. Using these core genes, we performed follow-up studies and built a prediction model (Figures 5A–C). The model formula is: RiskScore = AVP x 0.0109739762830633 + ATP2B1 × 0.0224961639594229 + PON2 × 0.032598603699068 + SNW1 × 0.0403490710844676 + SLC35A1 × 0.0440058992110305 + SECTM1 × 0.0521504470451128 + ZNF280B × 0.0528500171681807 + OAS1 × 0.0521504470451128 + ZNF280B × 0.0528500171681807 + OAS1 × 0.0521504470451128. The results showed the good diagnostic performance of the prediction model based on eight genes, with an area under the AUC curve of 0.9915 (Figure 5D). We further used the GSE104948-GPL22945 and GSE104948-GPL24120 datasets as validation sets. As an external dataset for further validation of the diagnostic model, the results showed that the model has strong stability. The areas under the AUC curves of GSE104948-GPL22945 and GSE104948-GPL24120 were 0.9444 and 1, respectively (Figures 5E, F).
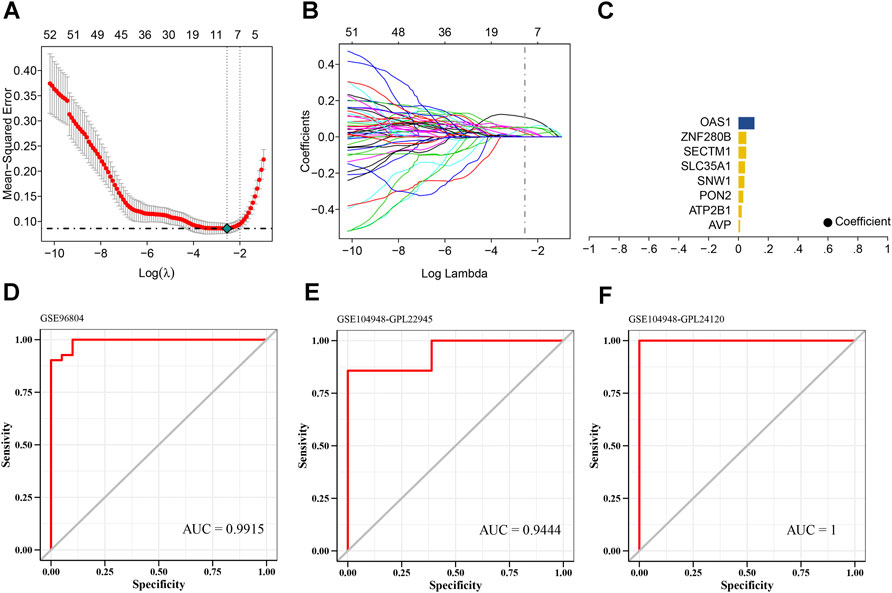
FIGURE 5. Screening of core genes in DKD. (A) Ten cross-validations of tuning parameter selection in the LASSO model to determine the minimum lambda value. (B) Distribution of LASSO coefficients for differential genes. (C) Coefficients of LASSO genes. (D–F) ROC curves of the eight LASSO genes in the training and validation sets. The areas under the AUC curve are all >0.9 and the model has good predictive performance.
To further identify the core genes playing key roles in DKD, we performed a lasso analysis of 128 genes with |MM|>0.8 and |GS|>0.5 in the turquoise module of the WGCNA analysis. The results revealed eight lasso genes. The semantic similarity and geometric means of these eight genes between BP, CC, and MF were calculated using the mgeneSim function to obtain the final score. Finally, the DKD signature genes were ranked according to the average functional similarity relationship between the proteins. The results showed that SNW1, SECTM1, and OAS1 were the top three proteins in DKD. Therefore, we defined these three genes as the core genes of DKD and conducted follow-up studies (Figure 6).
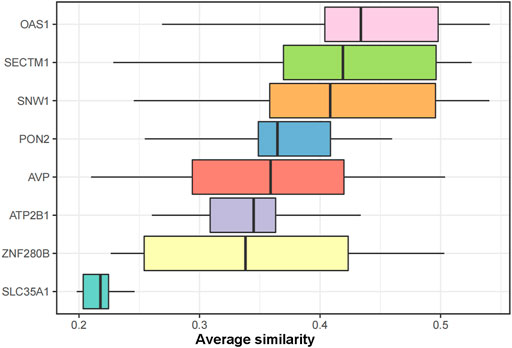
FIGURE 6. GO functional similarity ranking of the LASSO genes. The similarities in gene function distributions are summarized as boxplots. The line in the middle of the box represents the median, while the upper and lower boundaries show the upper and lower quartiles, respectively. The top three proteins with average functional similarity were defined as the core genes.
The microenvironment is mainly composed of immune cells, extracellular matrix, growth factors, inflammatory factors, and special physical and chemical characteristics, which significantly affect the diagnosis of diseases and the sensitivity of clinical treatment. By analyzing the relationship between core genes and immune infiltration in the dataset, the underlying molecular mechanisms by which core genes affect DKD progression were further explored. The content and interactions between immune cells are shown in Figures 7A,B. The results showed that compared to unaffected patients, patients with DKD showed significantly higher levels of resting CD4 memory T cells and a lower number of resting Mast cells (Figure 7C). Immunohistochemical analysis showed increased CD4 expression levels in DKD mice (Figure 7D). The three core genes were strongly correlated with immune cells (Figures 7E–G).
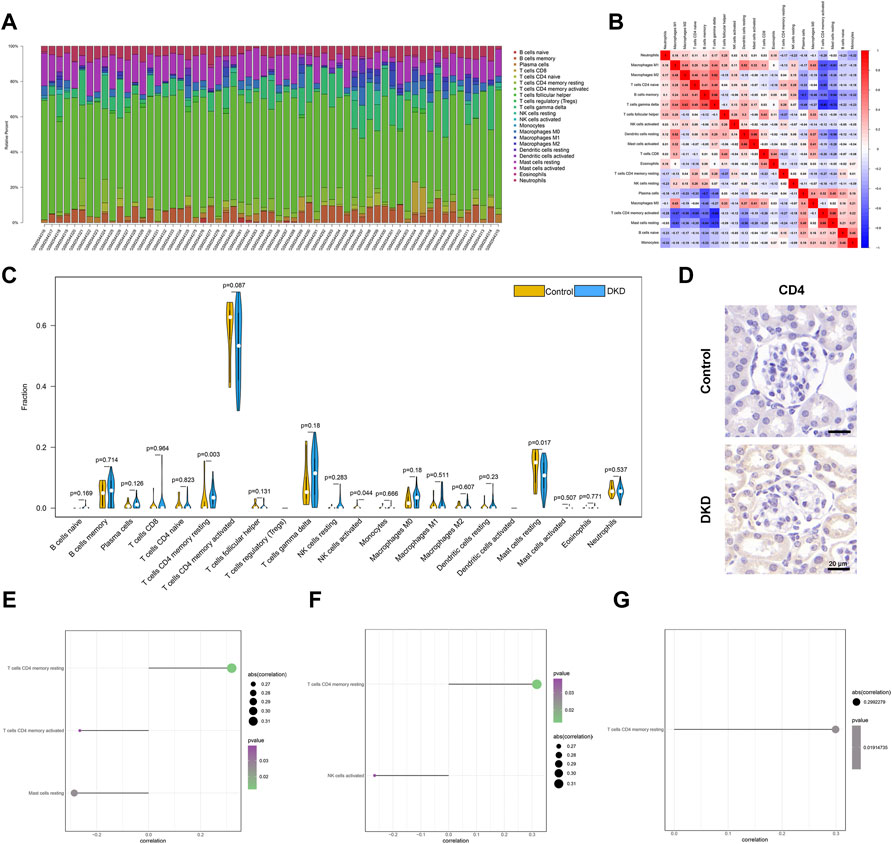
FIGURE 7. Immune infiltration of all samples. (A) Relative percentages of 22 immune cell subsets across all samples. (B) Pearson correlations between 22 immune cells. Blue and red indicate positive and negative correlations, respectively. (C) Differences in immune cell content between normal patients (yellow) and patients with DKD (blue). p < 0.05 is considered statistically significant. (D) Representative IHC staining of CD4 in the control and DKD groups. (E–G) Spearman correlations of OAS1, SECTM1, SNW1 gene expression and immune cell content.
We next studied the specific signaling pathways enriched by the three core genes and explored the potential molecular mechanisms of the core genes affecting DKD progression. The GSEA results showed that the main enriched pathways for high OAS1 expression were ARGININE AND PROLINE METABOLISM, LINOLEIC ACID METABOLISM, and MATURITY ONSET DIABETES OF THE YOUNG (Figure 8A). The main enriched pathways for high SECTM1 expression were CALCIUM SIGNALING PATHWAY, ARGININE AND PROLINE METABOLISM, and ANTIGEN PROCESSING AND PRESENTATION (Figure 8B). Finally, the main enriched pathways for high SNW1 expression were HOMOLOGOUS RECOMBINATION, HEDGEHOG SIGNALING PATHWAY, and INTESTINAL IMMUNE NETWORK FOR IGA PRODUCTION (Figure 8C).
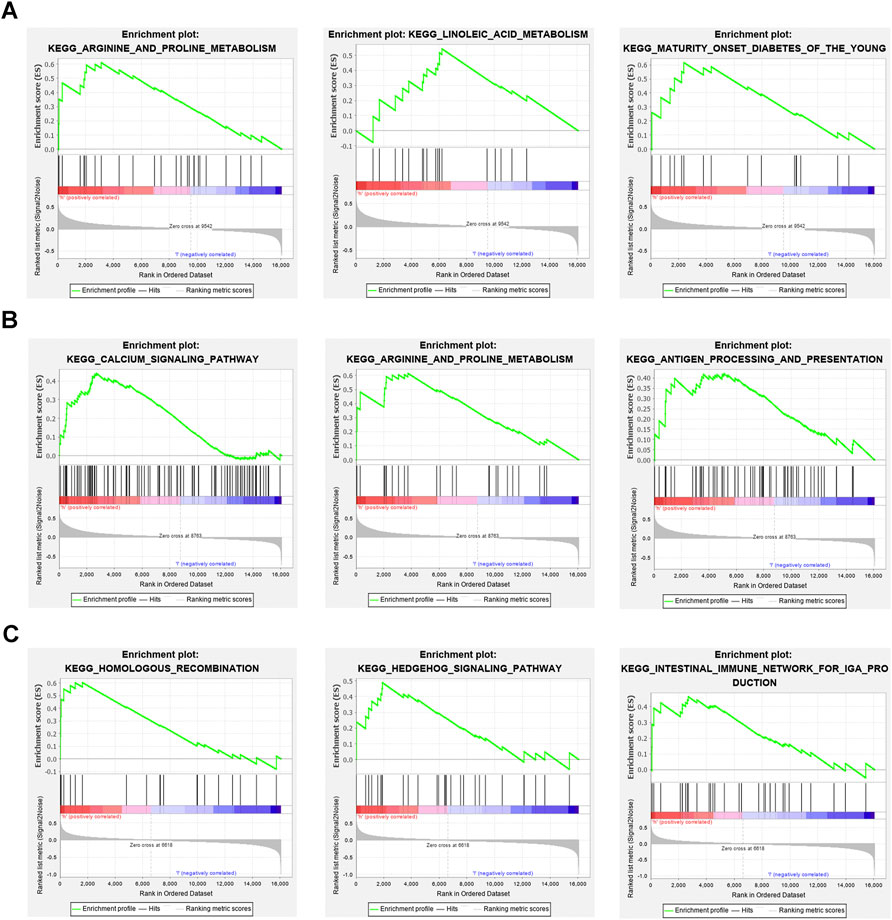
FIGURE 8. GSEA enrichment analysis of three core genes (A) The main enriched pathways with high expression for OAS1 are ARGININE AND PROLINE METABOLISM, LINOLEIC ACID METABOLISM, and MATURITY ONSET DIABETES OF THE YOUNG. (B) The main enriched pathways of high expression for SECTM1 are CALCIUM SIGNALING PATHWAY, ARGININE AND PROLINE METABOLISM, and ANTIGEN PROCESSING AND PRESENTATION. (C) The main enriched pathways with high expression in SNW1 are HOMOLOGOUS RECOMBINATION, HEDGEHOG SIGNALING PATHWAY, and INTESTINAL IMMUNE NETWORK FOR IGA PRODUCTION.
We obtained the disease-regulating genes of DKD through the Genecard database and performed differential analysis. The results showed that GCK, HNF1A, L6, INSR, PDX1, and TCF7L2 differed significantly between the two groups of patients (Figure 9A). To explore the relationship between the core genes and DKD regulation, we performed a correlation analysis of the core and DKD-regulated genes. The results showed that SECTM1 was significantly positively correlated with PDX1 (Pearson r = 0.73), while SNW1 was significantly negatively correlated with INSR (Pearson r = -0.71, Figure 9B). We also inversely predicted the targeted miRNAs of the three core genes through the mircode database and identified 104 miRNAs and 143 miRNA-mRNA relationship pairs. The 104 miRNAs were then inversely predicted through NPInter database, which revealed 2,690 lncRNAs and 4,549 miRNA-lncRNA relationship pairs. Combining these two results, we obtained 6,403 lncRNA-miRNA relationship pairs to construct the ceRNA network of core genes (Figure 10).
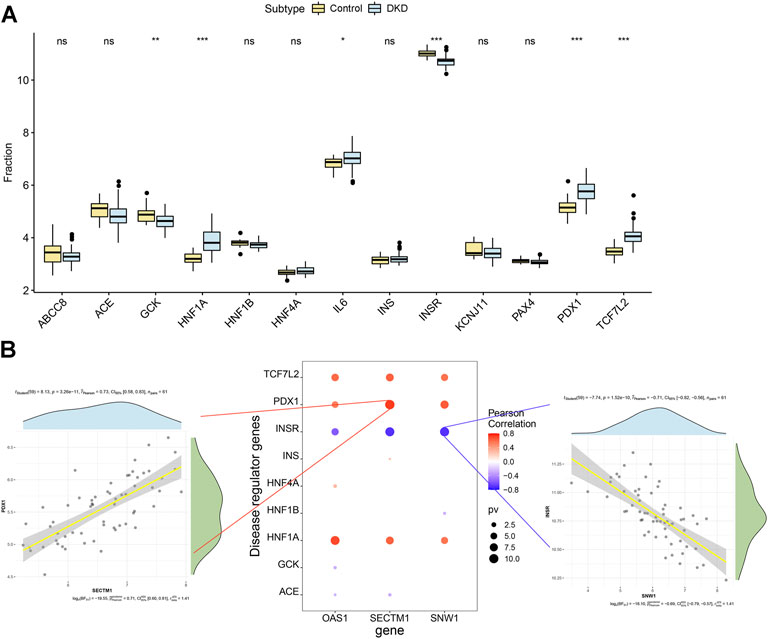
FIGURE 9. Correlation analysis of DKD-regulated genes. (A) Differences in the expression of DKD-regulated genes in control patients (yellow) and patients with DKD (blue). (B) Pearson correlation analysis of DKD-regulated and core genes. Blue and red indicate negative and positive correlations, respectively.
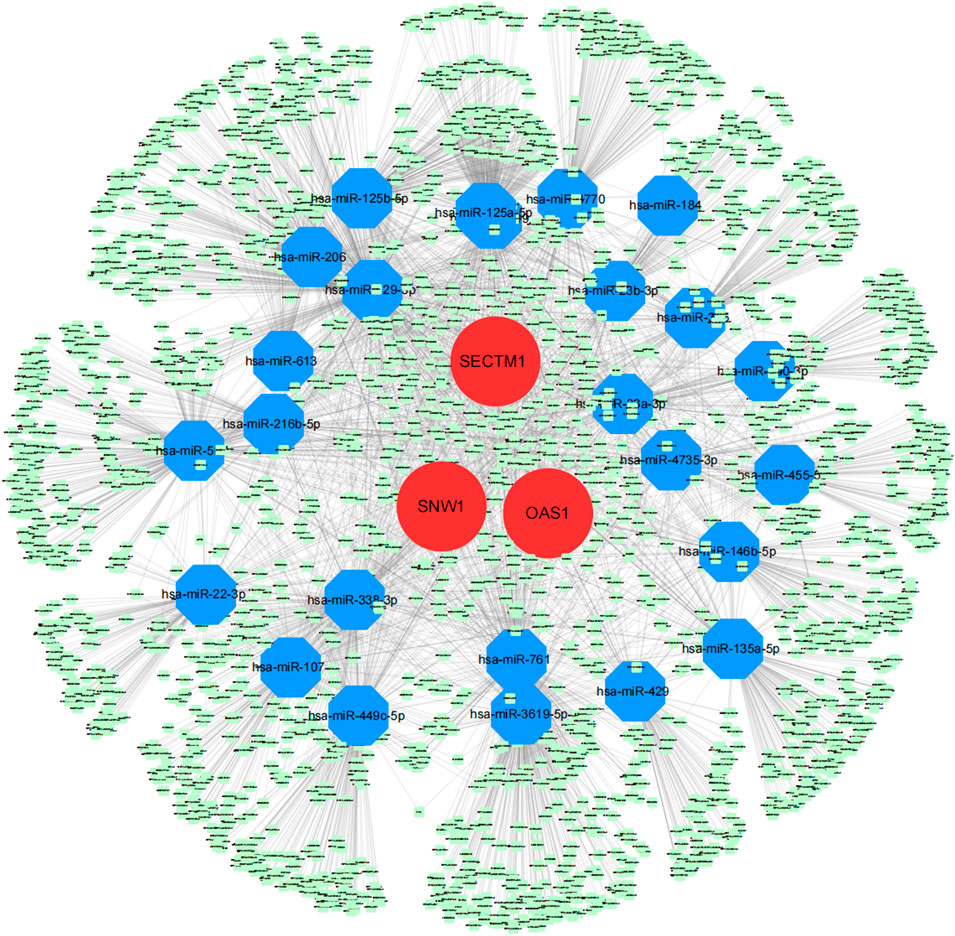
FIGURE 10. Core genes related to the ceRNA regulatory network. Red, blue, and green represent mRNA, miRNA, and lncRNA, respectively.
The renal tissue of diabetic mice was observed by Masson staining. The results showed typical damage and severe collagen deposition in the renal tissue, indicating the successful construction of the diabetic mouse model (Figure 11A). In addition, the blood glucose level (Figure 11B), serum creatinine (Figure 11C), and urine albumin/creatinine levels of the diabetic mice were significantly increased compared to those in the control group (Figure 11D), further confirming the successful establishment of the diabetic mouse model.
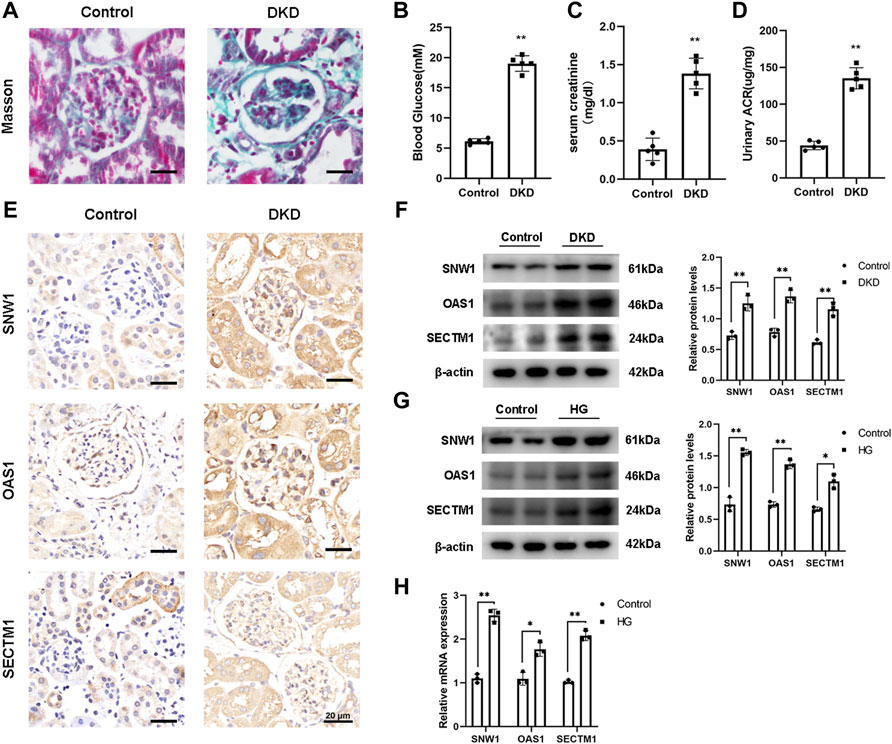
FIGURE 11. Validation of core gene expression. (A) Masson staining shows typical glomerular changes in DKD. (B–D) Detection of blood glucose and serum creatinine levels and urine albumin to creatinine ratio in mice. (E) Representative IHC staining of OAS1, SNW1, and SECTM1 in the control and DKD groups. (F–H) Detection of OAS1, SNW1, and SECTM1 expression by Western blot and qRT-PCR. ∗p < 0.05, ∗∗p < 0.01 vs. control.
Based on the results of bioinformatics analysis, we selected OAS1, SECTM1, and SNW1 as candidate biomarkers. To examine their roles in DKD, we successfully constructed a DKD mice model and validated these genes in vivo. Immunohistochemical experiments showed decreased expression levels of OAS1, SECTM1, and SNW1 in DKD mice (Figure 11E). Western blot analysis (Figure 11F) also showed significantly reduced expression levels of OAS1, SECTM1, and SNW1 in DKD mice compared to normal controls. A DKD mesangial cell model was also established in vitro. After 24 h of culture in high-glucose medium, the protein levels of OAS1, SECTM1, and SNW1 were reduced compared to those in normal glucose medium (Figure 11G). Testing of treated HMCs for OAS1, SECTM1, and SNW1 mRNA expression by qRT-PCR showed substantially reduced expression of OAS1, SECTM1, and SNW1 mRNA in high-glucose-stimulated HMCs (Figure 11H). These results suggested that OAS1, SECTM1, and SNW1 should be considered as biomarkers for the early detection of DKD in clinical trials.
In the early detection of DKD, multi-factorial interventions targeting major risk factors (hyperglycemia, hypertension, dyslipidemia, and smoking) (Nathan et al., 1993; Gross et al., 2002; Mogensen, 2003) and the use of drugs with renoprotective effects (ACE inhibitors and/or ARBs) can reduce the progression of nephropathy (Viberti and Wheeldon, 2002; Mogensen, 2003). However, even with active treatment of known risk factors, some patients still develop DKD or eventually proceed to end-stage renal disease (Fioretto et al., 2006). Once in ESRD, patients require renal replacement therapy; however, the 5-year survival rate is <50% (Blumenthal, 2011). The main causes of DKD are the disturbance of glucose metabolism, oxidative stress, and altered renal hemodynamics (Wada and Makino, 2013). Nevertheless, the exact molecular mechanism is not clear and effective treatment options are lacking. Therefore, the identification of new targets is urgently needed to prevent the occurrence and development of DKD.
The rapid development of bioinformatics has helped us to explore the pathogenesis and related molecular pathways of DKD, and further seek potential new biomarkers of this disease. In this study, by analyzing differentially expressed genes (DEGs) in the GSE96804 datasets, LASSO regression identified eight characteristic genes (AVP, ATP2B1, PON2, SNW1, SLC35A1, SECTM1, ZNF280B, and OAS1) to construct a diagnostic model of DKD. This diagnostic model based on eight key genes distinguished healthy control (HC) from DKD samples with high accuracy (99.15%), strongly supported by the 94.52% AUC and 100% AUC in two separate external validation cohorts. Some of these eight genes have been confirmed to play important roles in the pathogenesis of DKD. AVP is a small peptide composed of nine amino acids that is synthesized in specific neurons in the paraventricular and supraoptic nucleus, stored in the neurohypophysis, and exerts different physiological effects by binding to different receptor subtypes (Rotondo et al., 2016). (Tahara et al. (2008)found that AVP can promote extracellular matrix (ECM) synthesis by regulating the secretion of TGF-β in rat mesangial cells (RMC), which leads to glomerulosclerosis in DKD. PON2 is the oldest member of the paraoxonase family and plays an integral role in the control of oxidative stress, inhibition of apoptosis, and progression of various malignancies (Manco et al., 2021). Pinizzotto et al., (2001) demonstrated that polymorphisms in PON2 were significantly associated with DKD independently of the traditional risk factors for type II diabetes (T2DM) In our study, metascape enrichment analysis revealed DEGs that may affect the development of DKD through a variety of signal pathways and targets in biological processes, mainly including unsaturated fatty acid biosynthetic process, positive regulation of receptor signaling pathways via JAK-STAT, carbohydrate metabolic process, protein processing in the endoplasmic reticulum, and prion diseases. Notably, the JAK-STAT signaling pathway plays important roles in regulating various pathophysiological processes, such as inflammation, homeostasis, cell proliferation, and apoptosis (Banerjee et al., 2017; Seif et al., 2017). The activity of the JAK-STAT pathway is enhanced in DKD animal models. Inhibition of this activity suppressed STZ-induced renal damage in DKD mice (Lu et al., 2009), while activation of the JAK-STAT signaling cascade can stimulate the excessive proliferation and growth of glomerular mesangial cells, which leads to DKD (Amiri et al., 2002).
Immune cell infiltration is significantly associated with the pathogenesis of metabolic disorders such as T2DM, obesity, and metabolic syndrome. Phenotypic changes in immune cells and inflammatory infiltration precede the development of metabolic disorders (Guzik and Cosentino, 2018). Accumulating evidence indicates the important role of immune cell infiltration and inflammation in the pathogenesis of DKD (Tesch, 2017). The present study identified the infiltration of 22 immune cell types in DKD by CIBERSORT. The DKD group showed a higher proportion of CD4 memory resting T cells and a lower proportion of resting mast cells. CD4+ T cells are central regulators in chronic metabolic inflammation, involved in the mediation of macrophages and other T and B cell-dependent inflammatory responses (Trifari et al., 2009). Orban et al. (2014) reported that CD4+ memory T cells are intimately involved in the pathogenesis of type Ⅰdiabetes (T1DM) and may be a potential immune marker for the diagnosis of T1DM. Lin et al. (2021) reported increased levels of CD4 memory resting T cells in diabetic neuropathy, which may be related to disease progression. Major histocompatibility complexes (MHCs) are related to the immune response, immune regulation, and the production of certain pathological conditions. Mast cells are a type of innate immune cell that can express MHC molecules (Agier et al., 2021). Mast cells are also functional negative regulators in T1DM and other autoimmune-related diseases (Geoffrey et al., 2006; Fehervari, 2018). Okoń and Stachura (2007) demonstrated that mast cells are closely related to serum creatinine and urea levels in patients with DKD. The results of our study showed a comparatively large proportion of mast cells in the HC samples, possibly due to a potential limitation of the CIBERSORT algorithm. The high ratio of CD4+ memory T cells in patients with DKD makes the ratio of other immune cells, including mast cells, appear relatively low. Meanwhile, we further confirmed the correlation between three core genes (OAS1, SECTM1, and SNW1) and immune cell infiltration. Our results suggested that the three core genes were consistently associated with immune infiltration and were closely related to resting memory T cells, activated T cells, resting mast cells, and activated NK cells. These results provide further evidence of the important role of the core genes and immune infiltration in DKD progression.
Among these core genes, OAS1 encodes a protein of the 2’, 5’-oligoadenylate synthase family, a group of enzymes that play an important role in innate antiviral defense (Justesen et al., 2000). Field et al. (2005) proposed that OAS1 activation may promote β-cell apoptosis, thereby enhancing susceptibility to T1DM. Pedersen et al. (2021) showed upregulation of OAS1 in the islets of T1DM. OAS1 is also relevant in multiple sclerosis, and hepatitis C virus infection (García-Álvarez et al., 2017; O'Brien et al., 2010). SECTM1 is a type I transmembrane glycoprotein, located in the Golgi apparatus, with transmembrane and soluble forms (Slentz-Kesler et al., 1998). Targeting SECTM1-CD7 interactions may be used to prevent allogeneic T cell responses, autoimmune diseases, and IFN-γ (Wang et al., 2012). SNW1 is a multifunctional protein that plays a role in disease through direct protein interactions, mRNA splicing regulation, or transcriptional control (Verma et al., 2019). SNW1 overexpression is a marker of increased cancer aggressiveness and has been confirmed in a variety of cancers, including breast cancer, hepatocellular carcinoma, and prostate cancer (Liu et al., 2013; Liu et al., 2014; Höflmayer et al., 2019). Our in vivo and in vitro experiments demonstrated that the relative transcript levels of core genes showed the same expression trends as those in the bioinformatics analysis, with significantly increased DKD expression. Moreover, GSEA revealed specific signalling pathways of the three core genes that may participate in the development of DKD, providing a direction for further exploration of DKD pathogenesis.
In this study, we identified regulatory genes correlated with DKD through the Genecard database. Six genes (GCK, HNF1A, L6, INSR, PDX1, and TCF7L2) differed significantly between the HC and DKD groups. PDX1 (pancreatic and duodenal homeobox 1) and INSR (insulin receptor) are known genes that modulate DKD. PDX1, one of the earliest active pancreatic transcription factors, directs beta-cell differentiation and physiological insulin gene transcription (Zhu et al., 2017). PDX1 knockout resulted in early DKD features such as glomerular basement membrane (GBM) thickening and glomerular hypertrophy in the zebrafish pronephros, while PDX1 overexpression inhibited the progression of diabetic kidney damage (Wiggenhauser et al., 2022). INSR encodes the insulin receptor and plays an important role in the insulin signaling pathway (Payankaulam et al., 2019). Gatica et al. (2013) reported that INSR is highly expressed in the kidney tissue of patients with DKD, suggesting its role in the development of DKD. Our analysis of the correlations between three core genes and DKD regulatory genes revealed intimate connections among them. While the mechanism of the three core genes and DKD regulatory genes in the pathogenesis of DKD is unclear, the above evidence implies that the related regulatory genes of DKD may participate in the development of DKD by regulating the expression of the core genes. In addition, we also constructed a ceRNA network of core genes by combining the NPInter and miRcode databases. Although less information is reported on the association of these miRNAs and lncRNAs with the progression of DKD and other renal diseases, these lncRNAs, miRNAs, and mRNAs may play potential and important roles in the regulation of renal function.
We analyzed the DEGs related to DKD in the GEO database based on only eight signature genes that could be used to construct a diagnostic model with high accuracy. We discovered three core genes (OAS1, SECTM1, and SNW1) that may be related to the pathogenesis of DKD and further revealed that they may influence DKD progression through various biological functions and pathways. These findings provide new ideas for the pathogenesis and treatment of DKD.
The datasets presented in this study can be found in online repositories. The names of the repository/repositories and accession number(s) can be found in the article/Supplementary Material.
The animal study was reviewed and approved by the Ethics Committee of Scientific Research and Clinical Trials of the First Affiliated Hospital of Zhengzhou University.
WY analyzed the findings and drafted the manuscript; TW analyzed the data and revised the statistical methods; FW and YZ revised the manuscript; JS and ZZ designed the study, revised the manuscript, and interpreted the results.
This work was supported by the National Natural Science Foundation of China (Grant Nos. 81873611 and 82170738).
The authors declare that the research was conducted in the absence of any commercial or financial relationships that could be construed as a potential conflict of interest.
All claims expressed in this article are solely those of the authors and do not necessarily represent those of their affiliated organizations, or those of the publisher, the editors, and the reviewers. Any product that may be evaluated in this article, or claim that may be made by its manufacturer, is not guaranteed or endorsed by the publisher.
The Supplementary Material for this article can be found online at: https://www.frontiersin.org/articles/10.3389/fphar.2022.931282/full#supplementary-material
Agier, J., Brzezińska-Błaszczyk, E., Witczak, P., Kozłowska, E., and Żelechowska, P. (2021). The impact of TLR7 agonist R848 treatment on mast cell phenotype and activity. Cell. Immunol. 359, 104241. doi:10.1016/j.cellimm.2020.104241
Alicic, R. Z., Rooney, M. T., and Tuttle, K. R. (2017). Diabetic kidney disease: Challenges, progress, and possibilities. Clin. J. Am. Soc. Nephrol. 12, 2032–2045. doi:10.2215/CJN.11491116
Amiri, F., Shaw, S., Wang, X., Tang, J., Waller, J. L., Eaton, D. C., et al. (2002). Angiotensin II activation of the JAK/STAT pathway in mesangial cells is altered by high glucose. Kidney Int. 61, 1605–1616. doi:10.1046/j.1523-1755.2002.00311.x
Banerjee, S., Biehl, A., Gadina, M., Hasni, S., and Schwartz, D. M. (2017). JAK-STAT signaling as a target for inflammatory and autoimmune diseases: Current and future prospects. Drugs 77, 521–546. doi:10.1007/s40265-017-0701-9
Blumenthal, S. S. (2011). Evolution of treatment for diabetic nephropathy: Historical progression from RAAS inhibition and onward. Postgrad. Med. 123, 166–179. doi:10.3810/pgm.2011.11.2506
Chen, S., Yang, D., Lei, C., Li, Y., Sun, X., Chen, M., et al. (2019). Identification of crucial genes in abdominal aortic aneurysm by WGCNA. PeerJ 7, e7873. doi:10.7717/peerj.7873
Fehervari, Z. (2018). Mast cells in autoimmune disease. Nat. Immunol. 19, 316. doi:10.1038/s41590-018-0080-8
Field, L. L., Bonnevie-Nielsen, V., Pociot, F., Lu, S., Nielsen, T. B., and Beck-Nielsen, H. (2005). OAS1 splice site polymorphism controlling antiviral enzyme activity influences susceptibility to type 1 diabetes. Diabetes 54, 1588–1591. doi:10.2337/diabetes.54.5.1588
Fioretto, P., Bruseghin, M., Berto, I., Gallina, P., Manzato, E., and Mussap, M. (2006). Renal protection in diabetes: Role of glycemic control. J. Am. Soc. Nephrol. 17, S86–S89. doi:10.1681/ASN.2005121343
García-Álvarez, M., Berenguer, J., Jiménez-Sousa, M. A., Pineda-Tenor, D., Aldámiz-Echevarria, T., Tejerina, F., et al. (2017). Mx1, OAS1 and OAS2 polymorphisms are associated with the severity of liver disease in HIV/HCV-coinfected patients: A cross-sectional study. Sci. Rep. 7, 41516. doi:10.1038/srep41516
Gatica, R., Bertinat, R., Silva, P., Carpio, D., Ramírez, M. J., Slebe, J. C., et al. (2013). Altered expression and localization of insulin receptor in proximal tubule cells from human and rat diabetic kidney. J. Cell. Biochem. 114, 639–649. doi:10.1002/jcb.24406
Geoffrey, R., Jia, S., Kwitek, A. E., Woodliff, J., Ghosh, S., Lernmark, A., et al. (2006). Evidence of a functional role for mast cells in the development of type 1 diabetes mellitus in the BioBreeding rat. J. Immunol. 177, 7275–7286. doi:10.4049/jimmunol.177.10.7275
Gross, J. L., Zelmanovitz, T., Moulin, C. C., De Mello, V., Perassolo, M., Leitão, C., et al. (2002). Effect of a chicken-based diet on renal function and lipid profile in patients with type 2 diabetes: A randomized crossover trial. Diabetes care 25, 645–651. doi:10.2337/diacare.25.4.645
Guzik, T. J., and Cosentino, F. (2018). Epigenetics and immunometabolism in diabetes and aging. Antioxid. Redox Signal. 29, 257–274. doi:10.1089/ars.2017.7299
Höflmayer, D., Willich, C., Hube-Magg, C., Simon, R., Lang, D., Neubauer, E., et al. (2019). SNW1 is a prognostic biomarker in prostate cancer. Diagn. Pathol. 14, 33. doi:10.1186/s13000-019-0810-8
Justesen, J., Hartmann, R., and Kjeldgaard, N. O. (2000). Gene structure and function of the 2'-5'-oligoadenylate synthetase family. Cell. Mol. Life Sci. 57, 1593–1612. doi:10.1007/pl00000644
Levey, A. S., de Jong, P. E., Coresh, J., El Nahas, M., Astor, B. C., Matsushita, K., et al. (2011). The definition, classification, and prognosis of chronic kidney disease: A KDIGO controversies conference report. Kidney Int. 80, 17–28. doi:10.1038/ki.2010.483
Lin, Y., Wang, F., Cheng, L., Fang, Z., and Shen, G. (2021). Identification of key biomarkers and immune infiltration in sciatic nerve of diabetic neuropathy BKS-db/db mice by bioinformatics analysis. Front. Pharmacol. 12, 682005. doi:10.3389/fphar.2021.682005
Liu, G., Huang, X., Cui, X., Zhang, J., Wei, L., Ni, R., et al. (2013). High SKIP expression is correlated with poor prognosis and cell proliferation of hepatocellular carcinoma. Med. Oncol. 30, 537. doi:10.1007/s12032-013-0537-4
Liu, X., Ni, Q., Xu, J., Sheng, C., Wang, Q., Chen, J., et al. (2014). Expression and prognostic role of SKIP in human breast carcinoma. J. Mol. Histol. 45, 169–180. doi:10.1007/s10735-013-9546-z
Lu, T. C., Wang, Z. H., Feng, X., Chuang, P. Y., Fang, W., Shen, Y., et al. (2009). Knockdown of Stat3 activity in vivo prevents diabetic glomerulopathy. Kidney Int. 76, 63–71. doi:10.1038/ki.2009.98
Manco, G., Porzio, E., and Carusone, T. M. (2021). Human Paraoxonase-2 (PON2): Protein Functions and Modulation, 10.Antioxidants (Basel)
Mogensen, C. E. (2003). Microalbuminuria and hypertension with focus on type 1 and type 2 diabetes. J. Intern. Med. 254, 45–66. doi:10.1046/j.1365-2796.2003.01157.x
Nathan, D. M., Genuth, S., Lachin, J., Cleary, P., Crofford, O., Davis, M., et al. (1993). The effect of intensive treatment of diabetes on the development and progression of long-term complications in insulin-dependent diabetes mellitus. N. Engl. J. Med. 329, 977–986. doi:10.1056/NEJM199309303291401
O'Brien, M., Lonergan, R., Costelloe, L., O'Rourke, K., Fletcher, J. M., Kinsella, K., et al. (2010). OAS1: A multiple sclerosis susceptibility gene that influences disease severity. Neurology 75, 411–418. doi:10.1212/WNL.0b013e3181ebdd2b
Oh, S. W., Kim, S., Na, K. Y., Chae, D. W., Kim, S., Jin, D. C., et al. (2012). Clinical implications of pathologic diagnosis and classification for diabetic nephropathy. Diabetes Res. Clin. Pract. 97, 418–424. doi:10.1016/j.diabres.2012.03.016
Okoń, K., and Stachura, J. (2007). Increased mast cell density in renal interstitium is correlated with relative interstitial volume, serum creatinine and urea especially in diabetic nephropathy but also in primary glomerulonephritis. Pol. J. Pathol. 58, 193–197.
Orban, T., Beam, C. A., Xu, P., Moore, K., Jiang, Q., Deng, J., et al. (2014). Reduction in CD4 central memory T-cell subset in costimulation modulator abatacept-treated patients with recent-onset type 1 diabetes is associated with slower C-peptide decline. Diabetes 63, 3449–3457. doi:10.2337/db14-0047
Papadopoulou-Marketou, N., Kanaka-Gantenbein, C., Marketos, N., Chrousos, G. P., and Papassotiriou, I. (2017). Biomarkers of diabetic nephropathy: A 2017 update. Crit. Rev. Clin. Lab. Sci. 54, 326–342. doi:10.1080/10408363.2017.1377682
Payankaulam, S., Raicu, A. M., and Arnosti, D. N. (2019). Transcriptional regulation of INSR, the insulin receptor gene. Genes (Basel) 10, E984. doi:10.3390/genes10120984
Pedersen, K., Haupt-Jorgensen, M., Krogvold, L., Kaur, S., Gerling, I. C., Pociot, F., et al. (2021). Genetic predisposition in the 2'-5'A pathway in the development of type 1 diabetes: Potential contribution to dysregulation of innate antiviral immunity. Diabetologia 64, 1805–1815. doi:10.1007/s00125-021-05469-5
Pinizzotto, M., Castillo, E., Fiaux, M., Temler, E., Gaillard, R. C., and Ruiz, J. (2001). Paraoxonase2 polymorphisms are associated with nephropathy in Type II diabetes. Diabetologia 44, 104–107. doi:10.1007/s001250051586
Rotondo, F., Butz, H., Syro, L. V., Yousef, G. M., Di Ieva, A., Restrepo, L. M., et al. (2016). Arginine vasopressin (AVP): A review of its historical perspectives, current research and multifunctional role in the hypothalamo-hypophysial system. Pituitary 19, 345–355. doi:10.1007/s11102-015-0703-0
Seif, F., Khoshmirsafa, M., Aazami, H., Mohsenzadegan, M., Sedighi, G., and Bahar, M. (2017). The role of JAK-STAT signaling pathway and its regulators in the fate of T helper cells. Cell Commun. Signal. 15, 23. doi:10.1186/s12964-017-0177-y
Slentz-Kesler, K. A., Hale, L. P., and Kaufman, R. E. (1998). Identification and characterization of K12 (SECTM1), a novel human gene that encodes a Golgi-associated protein with transmembrane and secreted isoforms. Genomics 47, 327–340. doi:10.1006/geno.1997.5151
Tahara, A., Tsukada, J., Tomura, Y., Yatsu, T., and Shibasaki, M. (2008). Vasopressin increases type IV collagen production through the induction of transforming growth factor-beta secretion in rat mesangial cells. Pharmacol. Res. 57, 142–150. doi:10.1016/j.phrs.2008.01.003
Tesch, G. H. (2017). Diabetic nephropathy - is this an immune disorder? Clin. Sci. 131, 2183–2199. doi:10.1042/CS20160636
Trifari, S., Kaplan, C. D., Tran, E. H., Crellin, N. K., and Spits, H. (2009). Identification of a human helper T cell population that has abundant production of interleukin 22 and is distinct from T(H)-17, T(H)1 and T(H)2 cells. Nat. Immunol. 10, 864–871. doi:10.1038/ni.1770
Udhaya Kumar, S., Rajan, B., Thirumal Kumar, D., Anu Preethi, V., Abunada, T., Younes, S., et al. (2020). Involvement of essential signaling cascades and analysis of gene networks in diabesity. Genes (Basel) 11, E1256. doi:10.3390/genes11111256
Van, J. A., Scholey, J. W., and Konvalinka, A. (2017). Insights into diabetic kidney disease using urinary proteomics and bioinformatics. J. Am. Soc. Nephrol. 28, 1050–1061. doi:10.1681/ASN.2016091018
Verma, S., De Jesus, P., Chanda, S. K., and Verma, I. M. (2019). SNW1, a novel transcriptional regulator of the NF-κB pathway. Mol. Cell. Biol. 39, e00415-18. doi:10.1128/MCB.00415-18
Viberti, G., and Wheeldon, N. M.MicroAlbuminuria Reduction With VALsartan MARVAL Study Investigators (2002). Microalbuminuria reduction with valsartan in patients with type 2 diabetes mellitus: A blood pressure-independent effect. Circulation 106, 672–678. doi:10.1161/01.cir.0000024416.33113.0a
Wada, J., and Makino, H. (2013). Inflammation and the pathogenesis of diabetic nephropathy. Clin. Sci. 124, 139–152. doi:10.1042/CS20120198
Wang, J. Z., Du, Z., Payattakool, R., Yu, P. S., and Chen, C. F. (2007). A new method to measure the semantic similarity of GO terms. Bioinformatics 23, 1274–1281. doi:10.1093/bioinformatics/btm087
Wang, T., Huang, C., Lopez-Coral, A., Slentz-Kesler, K. A., Xiao, M., Wherry, E. J., et al. (2012). K12/SECTM1, an interferon-γ regulated molecule, synergizes with CD28 to costimulate human T cell proliferation. J. Leukoc. Biol. 91, 449–459. doi:10.1189/jlb.1011498
Wiggenhauser, L. M., Metzger, L., Bennewitz, K., Soleymani, S., Boger, M., Tabler, C. T., et al. (2022). pdx1 knockout leads to a diabetic nephropathy- like phenotype in zebrafish and identifies phosphatidylethanolamine as metabolite promoting early diabetic kidney damage. Diabetes 71, 1073–1080. doi:10.2337/db21-0645
Keywords: key biomarkers, diabetic kidney disease, diagnostic model, differential genes, immune infiltration
Citation: Yu W, Wang T, Wu F, Zhang Y, Shang J and Zhao Z (2022) Identification and validation of key biomarkers for the early diagnosis of diabetic kidney disease. Front. Pharmacol. 13:931282. doi: 10.3389/fphar.2022.931282
Received: 28 April 2022; Accepted: 22 July 2022;
Published: 22 August 2022.
Edited by:
Norberto Perico, Mario Negri Pharmacological Research Institute (IRCCS), ItalyReviewed by:
Luis Miguel Ruilope, University Hospital October 12, SpainCopyright © 2022 Yu, Wang, Wu, Zhang, Shang and Zhao. This is an open-access article distributed under the terms of the Creative Commons Attribution License (CC BY). The use, distribution or reproduction in other forums is permitted, provided the original author(s) and the copyright owner(s) are credited and that the original publication in this journal is cited, in accordance with accepted academic practice. No use, distribution or reproduction is permitted which does not comply with these terms.
*Correspondence: Zhanzheng Zhao, emhhbnpoZW5nemhhb0B6enUuZWR1LmNu; Jin Shang, ZmNjc2hhbmdqMkB6enUuZWR1LmNu
†These authors have contributed equally to this work
Disclaimer: All claims expressed in this article are solely those of the authors and do not necessarily represent those of their affiliated organizations, or those of the publisher, the editors and the reviewers. Any product that may be evaluated in this article or claim that may be made by its manufacturer is not guaranteed or endorsed by the publisher.
Research integrity at Frontiers

Learn more about the work of our research integrity team to safeguard the quality of each article we publish.