 Tingting Zhao1‡Xuening Li1‡Yanwei Chen2‡Jie Du1Xiaodong Chen1Dalong Wang1Liyan Wang2Shan Zhao3Changyuan Wang1,4
 Qiang Meng1,4
 Huijun Sun1,4
 Kexin Liu1,4
 Jingjing Wu1,4*
- 1Department of Clinical Pharmacology, College of Pharmacy, Dalian Medical University, Dalian, China
- 2Department of Pharmacy, The First Affiliated Hospital of Dalian Medical University, Dalian, China
- 3Dalian Institute of Chemical Physics, Chinese Academy of Sciences, Dalian, China
- 4Provincial Key Laboratory for Pharmacokinetics and Transport, Liaoning Dalian Medical University, Dalian, China
Cancer patients generally has a high risk of thrombotic diseases. However, anticoagulant therapy always aggravates bleeding risks. Rivaroxaban is one of the most widely used direct oral anticoagulants, which is used as anticoagulant treatment or prophylaxis in clinical practice. The present study aimed to systemically estimate the combination safety of rivaroxaban with tyrosine kinase inhibitors (TKIs) based on human cytochrome P450 (CYPs) and efflux transporters and to explore the drug–drug interaction (DDI) mechanisms in vivo and in vitro. In vivo pharmacokinetic experiments and in vitro enzyme incubation assays and bidirectional transport studies were conducted. Imatinib significantly increased the rivaroxaban Cmax value by 90.43% (p < 0.05) and the area under the curve value by 119.96% (p < 0.01) by inhibiting CYP2J2- and CYP3A4-mediated metabolism and breast cancer resistance protein (BCRP)- and P-glycoprotein (P-gp)-mediated efflux transportation in the absorption phase. In contrast, the combination of sunitinib with rivaroxaban reduced the exposure in vivo by 62.32% (p < 0.05) and the Cmax value by 72.56% (p < 0.05). In addition, gefitinib potently inhibited CYP2J2- and CYP3A4-mediated rivaroxaban metabolism with Ki values of 2.99 μΜ and 4.91 μΜ, respectively; however, it almost did not affect the pharmacokinetics of rivaroxaban in vivo. Taken together, clinically significant DDIs were observed in the combinations of rivaroxaban with imatinib and sunitinib. Imatinib increased the bleeding risks of rivaroxaban, while sunitinib had a risk of reducing therapy efficiency. Therefore, more attention should be paid to aviod harmful DDIs in the combinations of rivaroxaban with TKIs.
1 Introduction
Thrombotic complications are becoming increasingly common among cancer patients, but anticoagulant therapy always aggravates bleeding risks. The venous thromboembolism (VTE) risk of cancer patients in the tumor active period is approximately 5–6 folds greater than that of common patients (Wysokinski et al., 2019), and pulmonary embolism (PE) is the second leading cause of death in cancer patients (Hutten et al., 2000). Meanwhile, approximately 60% of cancer patients who die from PE have complications of tumor development or metastasis (Kakkar et al., 2003). In addition, the VTE recurrence ratio of patients with tumors is 2–9 folds greater than that of those without (Chee et al., 2014), and the mortality is increased by approximately three times after VTE recurrence (Khorana et al., 2007). Recent clinical guidance has suggested that no less than 6 months of anticoagulant therapy should be given for cancer-related VTE (Ca-VTE) patients; however, the consequent bleeding risk is largely increased (Farge et al., 2016). The major bleeding risk of Ca-VTE patients is increased by 2–3 times compared with that of VTE patients without tumors, which limits the clinical prognosis (Hutten et al., 2000; Chee et al., 2014). VTE shortens the overall survival of cancer patients (Kakkar et al., 2003; Song et al., 2019).
In recent years, the efficiency of direct oral anticoagulants (DOACs) applied as anticoagulant treatment or prophylaxis has been continuously confirmed, while the safety is still to be investigated. Large randomized clinical trials have also demonstrated that DOACs combined with validated risk assessment scores were a reasonable choice for the primary thromboprophylaxis of cancer patients instead of low-molecular-weight heparin (LMWH) (Song et al., 2019). Moreover, multiple clinical retrospective analyses showed that DOACs had excellent outcomes for thrombotic diseases in cancer patients; the VTE recurrence rate in cancer patients within 6 months was significantly lower than that in the LMWH group. However, the proportion of patients with major bleeding and clinically related non-major bleeding increased significantly (Li et al., 2019). The risk factors that induce bleeding in cancer patients include chronic nephrosis, thrombocytopenia, metastatic disease, and primary gastrointestinal diseases (Angelini et al., 2019). In addition to individual variation among patients, the multidrug regimen is also one of the risk factors. Rivaroxaban was recommended for the treatment of superficial vein thrombosis and VTE prophylaxis following discharge by the National Comprehensive Cancer Network of America in 2020 in the clinical practice guidelines for Ca-VTE (Streiff et al., 2020). Thus, determining the combination safety of rivaroxaban should be given high priority.
Rivaroxaban is one of the most widely used DOACs in clinical practice (Hill et al., 2020). It has been reported that rivaroxaban is the substrate of CYP2J2 and CYP3A4 and also of breast cancer resistance protein (BCRP) and P-glycoprotein (P-gp) (Mueck et al., 2014). The dominant roles of CYP2J2 and CYP3A4 in the in vivo metabolism (Zhao et al., 2022). However, it has been observed that simple CYP modulators, like fluconazole, did not significantly affect the pharmacokinetics of rivaroxaban in clinical trials (Mueck et al., 2013). In contrast, when CYP and transporter multitarget inhibitors were combined with rivaroxaban, like ritonavir, significant clinical changes were observed in the pharmacokinetics of rivaroxaban (Mueck et al., 2013). Thus, we speculated that transporters play a key role in the disposition of rivaroxaban in vivo.
Tyrosine kinase inhibitors (TKIs) compete with tyrosine protein kinases for ATP phosphorylation sites to reduce the phosphorylation of tyrosine protein kinases, which exert potent antitumor activity (Jiao et al., 2018). Imatinib, sunitinib, and gefitinib have been the mainstay treatments for various solid tumors and malignant blood diseases since they were launched in 2000 (Cheng et al., 2013; Tirumani et al., 2013; Burotto et al., 2015; Kuczynski et al., 2015; Wertheimer et al., 2015). Imatinib, which was almost the first TKI drug that gained approval by the US Food and Drug Administration (FDA), has become the first-line clinical drug for treating gastrointestinal stromal tumors and chronic myeloid leukemia (Von Mehren and Widmer, 2011; O’brien et al., 2003). However, due to the long treatment cycle, the safety of imatinib in combination with other drugs is particularly important (Nebot et al, 2010; Guilhot, 2004). As a multitargeted TKI, sunitinib exerts strong angiogenesis inhibitory activity. It was approved by the FDA in 2006 as a first-line drug for treating metastatic renal cell carcinoma, and it was also used as a second-line drug for treating imatinib-resistant patients (Kalra et al., 2015). Gefitinib is the first TKI to gain approval in the US and Japan for treating advanced non–small-cell lung cancer (NSCLC) and can significantly prolong the progression-free survival of NSCLC patients (Dhillon, 2015). It has been reported these three TKIs inhibit efflux transporters, including BCRP and P-gp, to augment anticancer activity (Dohse et al., 2010; Shen et al., 2009; Tang et al., 2012). Moreover, these three TKIs also affect CYP3A activity in reversible or irreversible modes (Filppula et al., 2012; Filppula et al., 2014). However, the combination safety of rivaroxaban with TKIs remains unknown. Therefore, the safety of rivaroxaban combined with TKIs deserves further evaluation.
The combinations of rivaroxaban with TKIs have a profound clinical foundation, and the safety may be related to pharmacokinetic targets. The present study focused on CYP2J2, CYP3A4, BCRP, and P-gp to predict the combination safety and to uncover the potential DDI mechanism based on in vivo and in vitro pharmacokinetic experiments.
2 Materials and methods
2.1 Chemicals
Rivaroxaban, sunitinib, sunitinib malate, imatinib mesylate, and NADPH were purchased from Shanghai Yuanye Bio-Technology Co., Ltd. Imatinib and gefitinib were obtained from Sigma-Aldrich (Missouri, United States). Danazol was purchased from TargetMol (United States). cDNA-expressed recombinant human CYP3A4, CYP2J2, and pooled human liver microsomes (HLM) were purchased from Cypex Ltd. (Dundee, United Kingdom). All analytical reagent-grade and high-performance liquid chromatography (HPLC)–grade solvents were from Tedia, Inc. (Ohio, United States). HPLC was performed using an Agilent MSD/MS system controller, two 1,260 series pumps, a 1,200 series autosampler, and a 1,200 series variable wavelength detector. An API 3200 triple-quadrupole mass spectrometer (Applied Biosystems, Ontario, Canada) was used for LC-MS analysis. Ionization was conducted using an electron spray interface in the positive ion mode for detecting rivaroxaban. Cell Counting Kit-8 (CCK-8) was purchased from TargetMol, United States. Dulbecco’s modified Eagle medium (DMEM) was purchased from Beijing Solarbio Science and Technology Co., Ltd. All other materials were commercially available unless otherwise stated.
2.2 Quantitative determination
The formation of the main metabolite of rivaroxaban in the CYP inhibition assays was quantitatively determined using HPLC. The mobile phase consisted of 60% methanol (A pump) and 40% pure water with 0.2% formic acid (B pump) with isocratic elution. The flow rate was set as 0.5 ml/min, and detection was achieved at 240 nm. Detailed methods have been described in our prior study (Zhao et al., 2022).
The LC-MS/MS method was used to quantitatively determine rivaroxaban for cell and animal experiments. LC-MS/MS analysis was performed using an API 3200 triple-quadrupole mass spectrometer (Applied Biosystems, Concord, Ontario, Canada) and an Agilent LC system Agilent HP1200 (Agilent Technology Inc. CA, United States). The column was a Hypersil ODS-BP column (150 mm × 2.1 mm, 5 μm; Dalian Elite Analytical Instruments Co. Ltd. China). The selected transition of m/z was m/z 436.1 → 145.3 for rivaroxaban (collision energy 43 eV) under the positive ion mode. The flow rate of the mobile phase was 0.4 ml/min. The mobile phase contained acetonitrile and water with 0.2% (v/v) formic acid at 65:35 (v/v) for rivaroxaban in cell experiments. The determination of rivaroxaban in the blood was achieved by gradient elution methods with a mobile phase of acetonitrile (A) and pure water with 10 mM ammonium acetate (B). The gradient program was as follows: 0–2 min, 20% A; 2–3 min, 20–80% A; 3–5.5 min, 80% A; 5.5–6.5 min, 80–20% A; 6.5–10 min, 20% A.
2.3 In vitro CYP inhibition assay
2.3.1 In vitro CYP incubation
The inhibitory effect of the TKIs on the metabolism of rivaroxaban in recombined P450 isoforms and HLM incubations was compared by quantifiably detecting the production of the major metabolite using HPLC. The concentrations of HLM, CYP2J2, and CYP3A4 were 0.3, 0.4, and 0.6 mg mL−1, respectively. The selection of the rivaroxaban concentration depended on the Km values of the kinetic studies (22.81, 19.37, and 46.98 μM for HLM, CYP2J2, and CYP3A4, respectively) (Zhao et al., 2022). The detailed method can be found in our previous publication (Zhao et al., 2022). Briefly, after 5-min preincubation of potential inhibitors with isoforms, NADPH was added to initiate the reaction. The reaction mixture was incubated at 37°C for 60 min, and ice acetonitrile was used for terminating the reaction. The ratio of major metabolite production of rivaroxaban in the TKI incubation group to that obtained in the control group represents the inhibitory activity.
2.3.2 Initial inhibition screening
To explore the inhibitory effects of the three TKIs on rivaroxaban metabolism, three concentrations of TKIs (1, 10, and 100 μM) were used to perform the in vitro enzyme incubations. The ratio of the rivaroxaban main metabolite formation in the incubation with the TKIs to that without inhibitors represented the inhibitory activity.
2.3.3 IC50 determination
The concentrations of imatinib, sunitinib, and gefitinib were 0–5 μM, 0–90 μM, and 0–10 μM, respectively, in the incubation with HLM; 0–9 μM, 0–250 μM, and 0–9 μM, respectively, in the incubation with CYP2J2; and 0–15 μM, 0–30 μM, and 0–20 μM, respectively, in the incubation with CYP3A4. The IC50 values were obtained by nonlinear fitting of the TKI concentration and the remaining enzyme activity.
2.3.4 Reversible inhibition kinetic analysis
The incubation system with CYP3A4 included rivaroxaban (0–400 μM), potential inhibitors (imatinib: 0–10 μM; gefitinib: 0–10 μM; sunitinib: 0–20 μM), NADPH, and PBS. The incubation system with CYP2J2 included rivaroxaban (0–100 μM), potential inhibitors (imatinib, gefitinib, and sunitinib), NADPH, and PBS. The inhibition constant (Ki) was determined using various concentrations of inhibitors and rivaroxaban. Ki was calculated by three inhibition mode formulas (competitive, noncompetitive, and mixed-mode) using Prism v.6.0 (GraphPad, San Diego, CA, United States).
2.3.5 Time-dependent inhibition analysis
The two-step incubation method was performed to estimate the time-dependent inhibition (TDI). Inhibitors that caused a decrease greater than 1.5-fold in the IC50 value of the 30-min preincubation experiment compared with the common experiment were identified as time-dependent inhibitors.
To investigate the TDI of CYP3A4 by sunitinib, seven gradient concentrations (0–5 μM) and six time points (0–20 min) were used. It is worth noting that a higher substrate concentration than its Michaelis–Menten constant (Ki value) is required to reduce reversible inhibition. The data were then fitted to a linear regression model, which reflected the linear relation between “ln remaining activity” and “inactivation concentration” (I). The negative slope of this linear relationship reflected the observed inactivation rate (Kobs) values, which could be plotted against I to allow the fitting of the inactivation kinetic parameters KI and Kinact to the nonlinear least-squares regression based on Eq. 1. using Prism v.6.0 (GraphPad, San Diego, CA, United States).
2.3.6 Quantitative prediction of drug–drug interaction risk
Kinetic constants were included in the mechanistic static model to explore reversible inhibition and the TDI. This static model was previously developed and refined by Fahmi et al. (2008) and Isoherranen et al. (2012) to account for the inhibition of multiple P450 isoforms. In the present study, this model was designed to explore the contributions of enzyme inhibition in the prediction of DDI risk. The area under the curve ratio (AUC ratio/AUCR) in the presence of a pharmacokinetic DDI was used as the index, as described by Eq. 2.
Here, A is the TDI of each P450 isoform that was observed in the liver, as described by Eq. 3.
Here, B is the reversible inhibition of each P450 isoform that was observed in the liver, as described by Eq. 4. The degradation rates (Kdeg) of CYP2J2 and CYP3A4 were 0.00026 and 0.00032 min−1, respectively (Cheong et al., 2017), where I represents the in vivo concentration of inhibitors in healthy and solid tumor patients. In addition, the fraction of rivaroxaban metabolized by CYP2J2 or CYP3A4 was input from our previous study (Zhao et al., 2022), which was 0.95 for CYP2J2 and 0.025 for CYP3A4.
2.4 In vitro transporter inhibition assay
2.4.1 Cell culture
MDR1–Madin-Darby Canine Kidney cell (type Ⅱ MDCK cell), mock-MDCK cells (provided by Professor Su Zeng, College of Pharmacy, Zhejiang University, China) and ABCG2-MDCK, mock-MDCK cells (provided by Hanbio Tech (Shanghai, China)) were commonly maintained in DMEM with 10% fetal bovine serum (heat-inactivated) at 37°C with a 5% CO2 atmosphere. Detailed information is present in the supplementary files. The media contained a 1% non-essential amino acid solution, 100 U/ml penicillin, and 0.1 mg/ml streptomycin.
2.4.2 Cell Counting Kit-8 assay for cell viability
All cells were seeded into a 96-well plate at a density of 6 × 10⁴ cells/ml. After 24 h, the complete medium was replaced with the serum-free medium containing various concentrations of TKIs for 4 h. Then, the medium containing the TKIs was discarded, and 100 μl of serum-free medium containing 10 μl of CCK-8 solution was added per well. The cells were incubated for 2 h at 37°C, and the absorbance was assessed at 450 nm using a microplate reader (Tecan, Austria). The incubation concentrations of the TKIs were determined by the clinical plasma concentrations, and the time course was determined by the subsequent experiments. The IC50 value was calculated using Prism GraphPad.
2.4.3 Initial inhibition screening
MDR1-MDCK and ABCG2-MDCK cells were seeded in a 96-well plate at the density of 8 × 10⁴ cells/ml. After 24-h training, the complete medium was discarded and cells were washed twice with PBS buffer. Various concentrations of the TKIs were diluted using serum-free medium and given to cells for 1.5-h preincubation. Then, rhodamine123 (10 μM) or mitoxantrone (4 μM) was added into the cells with the drug-containing medium, and this was allowed to incubate for 2.5 h. Finally, the cells were washed three times with PBS buffer, and the fluorescence intensity was detected using the fluorescence reader (Tecan Trading AG, Switzerland). The excitation wavelength and emission wavelength of rhodamine 123 were 485 and 546 nm, respectively, and of mitoxantrone were 600 and 680 nm, respectively.
2.4.4 Intracellular accumulation of rhodamine 123
Mock-MDCK and MDR1-MDCK cells were seeded in six-well plates and grown to 80% confluency. After approximately 24 h, the complete medium was replaced with the serum-free medium with the TKIs, and this was cultured for 1.5 h. Then, rhodamine 123 (final concentration: 10 μM) was added, and incubation was continued for 2.5 h at 37°C. At last, the medium containing rhodamine 123 was discarded, and Hochest33342 was used to stain the cell nuclei at 37°C for 10 min intracellular accumulation of rhodamine 123 was determined using an inverted fluorescence microscope.
2.4.5 Bidirectional transport studies
Mock-MDCK, MDR1-MDCK, and ABCG2-MDCK cells were seeded in 24-well transwell inserts (0.33 cm2, 0.4 μm) at a density of 2.5 × 10⁵ cells/ml, and cells were allowed to culture for 3–5 days to form cell monolayers. The Millicell-ERS system was used to measure the TEER (Trans Epithelial Electric Resistance) values of the monolayers. The small hole with a TEER value of more than 300 Ω cm2 was ready for the experiments. Bidirectional transport studies were conducted using the method described previously (Jin et al., 2020). Briefly, the monolayer was washed gently using 37°C HBSS (pH 7.4) and preincubated with HBSS for 10 min at 37°C. Then, various concentrations of TKIs were added to the HBSS on either the basolateral (total volume of 800 μl) or apical (total volume of 200 μl) side of the monolayers, and the cells in the transwell inserts were allowed to further incubate at 37°C for 2 h. At last, a 100-μl solution was taken from the other side for quantitative analysis by LC-MS/MS.
2.5. In vivo pharmacokinetic experiments
To further investigate the DDI risk between rivaroxaban and the TKIs, the pharmacokinetic parameters were measured in Wistar rats (male, 160–200 g). The experiments were reviewed and approved by the Experimental Animal Centre of Dalian Medical University. All rats were obtained from Liaoning Changsheng Biotechnology Co., Ltd. All animal experiments complied with the ARRIVE guidelines and were carried out in accordance with the National Institutes of Health guide for the care and use of laboratory animals (NIH Publications No. 8023, revised 1978). All rats had free access to food and water and were fed adaptively for 7 days. The rats fasted for 24 h with free access to water before the experiments. Thirty-six rats were divided into six groups randomly. For oral administration in the pharmacokinetic experiment, the groups were as follows: group A: normal saline + rivaroxaban (2.1 mg/kg); group B: imatinib mesylate (43 mg/kg) + rivaroxaban (2.1 mg/kg); group C: gefitinib (22.5 mg/kg) + rivaroxaban (2.1 mg/kg); group D: sunitinib malate (6.0 mg/kg) + rivaroxaban (2.1 mg/kg). Blood was collected at the 15, 45, 75, 120, 180, 240, 360, 720, and 1,440 min after rivaroxaban was given. For intravenous administration in the pharmacokinetic experiment, the groups were as follows: group A: normal saline + rivaroxaban (0.4 mg/kg); group B: imatinib mesylate (10.08 mg/kg) + rivaroxaban (2.1 mg/kg). Blood was collected at the 1, 3, 5, 7, 10, 15, 30, 45, 60, 90, 120, 240, 360, and 720 min after rivaroxaban was given. After centrifugation, the plasma proteins were precipitated using acetonitrile, followed by vortexing and centrifugation.
2.6 Computer-aided molecular docking simulation
The CYP2J2 crystal structure homology model from the Clustal Omega web server (https://www.ebi.ac.uk/Tools/msa/clustalo/) was used to conduct docking simulations between the TKIs and rivaroxaban in SYBYL (X-1.1) (Ning et al., 2019). The PDB ID of CYP3A4, BCRP and P-gp crystal structure was 4D7D, 6VXH and 6C0V, respectively. The 3D structures of the TKIs were subjected to energy minimization using the default Tripos force field parameters, and the Gasteiger-Hückel charges were calculated for each compound. The Surflex-Dock mode was used to generate binding conformations of the TKIs with P450 isozyme and transporters. The optimal conformations were determined by their empirical functions ChemScore. The PyMOL Molecular Graphics System v.16.1.0.15350 (DeLano Scientific LLC) was used to visualize the docking results.
2.7 Data analysis
All pharmacokinetic parameters in the present study were analyzed using the Drug and Statistics software (DAS 2.0, Windows). In the bidirectional experiments, the apparent permeability values (Papp), efflux ratio (ER), and net flux ratio were calculated by Eqs. 5–7 (FDA, 2020). The transport of rivaroxaban was assessed to determine apparent Michaelis–Menten constants (Km,app). The Km,app of rivaroxaban in MDCK-MDR1 and ABCG2-MDCK models was calculated by fitting a maximum effect model to the plots of the net flux ratio versus rivaroxaban concentration, according to Eq. 8 (Jacqueroux et al., 2020).
where dQ/dt is the rate of drug accumulation during the study period, A is the effective growth area of cells (cm2), and C0 is the primary concentration of the drug. AP is transported from the apical to the basolateral side, and BL is transported from the basolateral to the apical side. Net flux ratiomax is the maximal effect, C is the concentration of rivaroxaban, and h is the Hill coefficient of the sigmoid model.
In general, the data are presented as the mean ± standard deviation and were analyzed using the Prism program (version 6.0, GraphPad, San Diego, CA). Statistically significant differences were determined using one-way ANOVA, followed by Tukey’s post hoc tests or unpaired t-tests. Statistically significant differences were indicated by p < 0.05.
3 Results
3.1 Effects of tyrosine kinase inhibitors on CYP-mediated rivaroxaban metabolism in vitro
3.1.1 Initial inhibition screening
To investigate the inhibition of TKIs on rivaroxaban metabolism, three concentrations, 1, 10, and 100 μM, were first used to conduct the CYP inhibition experiments. Imatinib and gefitinib showed potent inhibition of rivaroxaban metabolism in the incubation with HLM, CYP2J2, and CYP3A4 (Figures 1A, B), while sunitinib showed moderate inhibition when incubated with HLM and CYP3A4 (Figures 1A, C) and even less than 50% inhibition of CYP2J2 in a 100-μM incubation (Figure 1B). Gradient concentrations were used to determine the IC50 values of the three TKIs. Imatinib showed the most potent inhibition of rivaroxaban metabolism in HLM with an IC50 value of 1.70 μM (Figure 1D). Moreover, imatinib also exerted the strongest inhibitory effect on CYP3A4-mediated rivaroxaban metabolism with an IC50 value of 4.35 μM (Figure 1F). In CYP2J2-mediated rivaroxaban metabolism, gefitinib showed the strongest inhibitory activity with an IC50 value of 3.72 μM (Figure 1E). In general, both imatinib and gefitinib showed strong inhibitory effects on rivaroxaban metabolism mediated by CYP3A4 and CYP2J2. In contrast, sunitinib only exerted an inhibitory effect against CYP3A4, while the effect on CYP2J2 was almost imperceptible (Figures 1H, I). Detailed IC50 values are shown in Table 1.
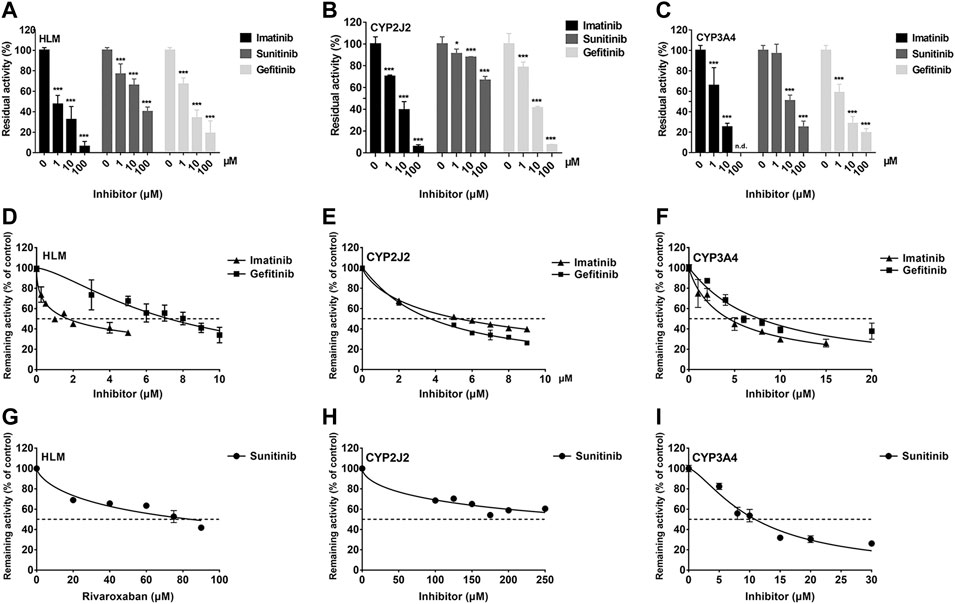
FIGURE 1. Initial inhibition screening of three tyrosine kinase inhibitors (TKIs) on CYP-mediated rivaroxaban metabolism. Inhibitory effects of three-point concentrations of TKIs on rivaroxaban metabolism with HLM (A), CYP2J2 (B), and CYP3A4 (C). Dose–response curves of TKI inhibition with HLM (D,G), CYP2J2 (E,H), and CYP3A4 (F,I). Results are shown as the mean ± S.D. of at least five determinations. N.D: not detectable.
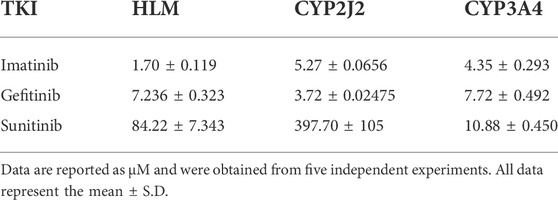
TABLE 1. IC50 values of tyrosine kinase inhibitors (TKI) inhibition of rivaroxaban metabolism.
3.1.2 Reversible inhibition behavior analysis
The Ki value of the TKIs was fitted from the kinetic curve, and the R2 values and inhibition modes are shown in Table 2. As sunitinib did not exert more than 50% inhibition toward CYP2J2 even at 250 μM, the Ki value was not measured. All inhibitions of the three TKIs exerted on CYP2J2 and CYP3A4 were in a noncompetitive mode (Figures 2, 3). The results were corroborated by the respective Dixon and Lineweaver–Burk plots. Similar to the IC50 results, gefitinib and imatinib showed the strongest inhibition for CYP2J2 and CYP3A4 with Ki values of 2.99 and 1.92 μM, respectively.
TABLE 2. Reversible inhibition kinetic parameters for rivaroxaban metabolism mediated by CYP2J2 and CYP3A4.
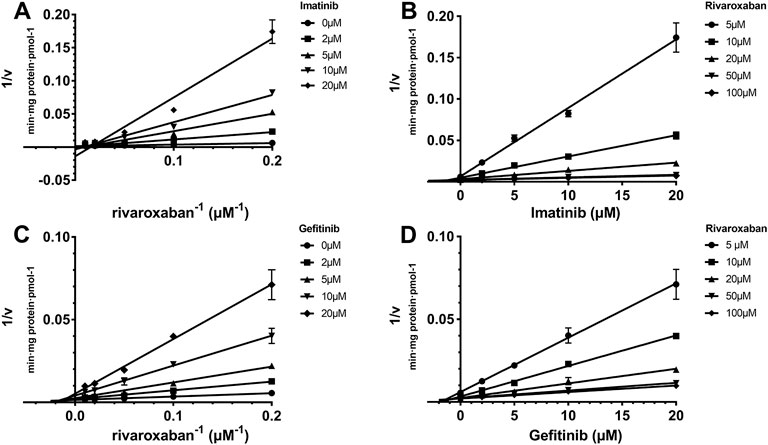
FIGURE 2. Reversible inhibition of CYP2J2 by imatinib and gefitinib. Lineweaver–Burk plots for the inhibition of imatinib (A) and gefitinib (C) on CYP2J2-mediated rivaroxaban metabolism; (B) and (D) are the corresponding Dixon plots. Data represent the mean ± S.D.
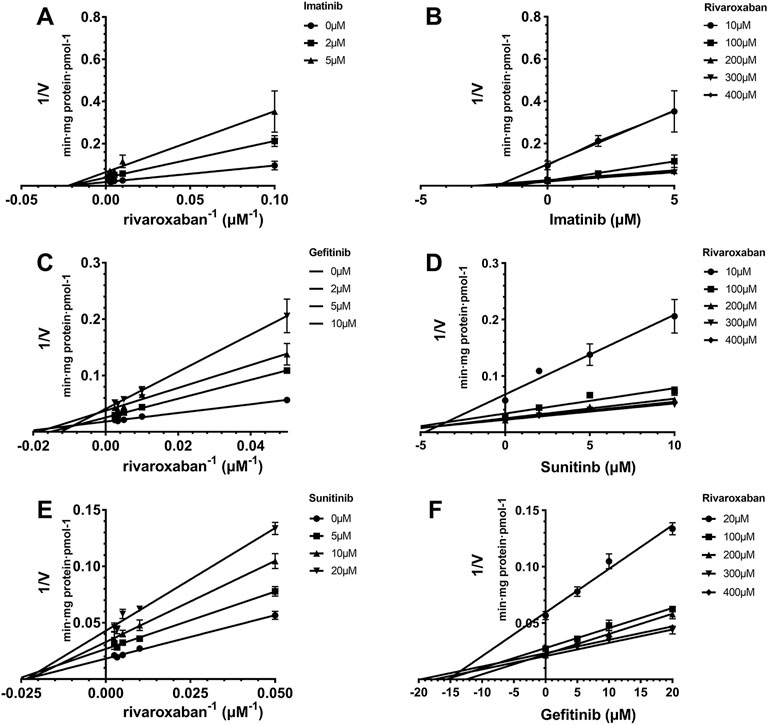
FIGURE 3. Reversible inhibition of CYP3A4 by imatinib, gefitinib, and sunitinib. Lineweaver–Burk plots for the inhibition of imatinib (A), gefitinib (C), and sunitinib (E) on CYP3A4-mediated rivaroxaban metabolism; (B), (D), and (F) are the corresponding Dixon plots. Data represent the mean ± S.D.
3.1.3 Time-dependent inhibition judgment
IC50 shift assays of CYP2J2 and CYP3A4 were performed to explore the TDI. Compared with direct inhibition, the 30-min preincubation of TKIs with NADPH did not significantly affect the inhibition of CYP2J2, in which all IC50 value changes were less than 1.5 folds (Figures 4A–C; Table 3). In contrast, all IC50 values for the inhibition of CYP3A4 were decreased by more than 1.5 folds (Table 3). In particular, sunitinib showed the largest change in the IC50 shift (Figure 4F), with the IC50 value decreasing by 3.99 folds from 10.88 to 2.73 μM following the 30-min preincubation (Table 3).
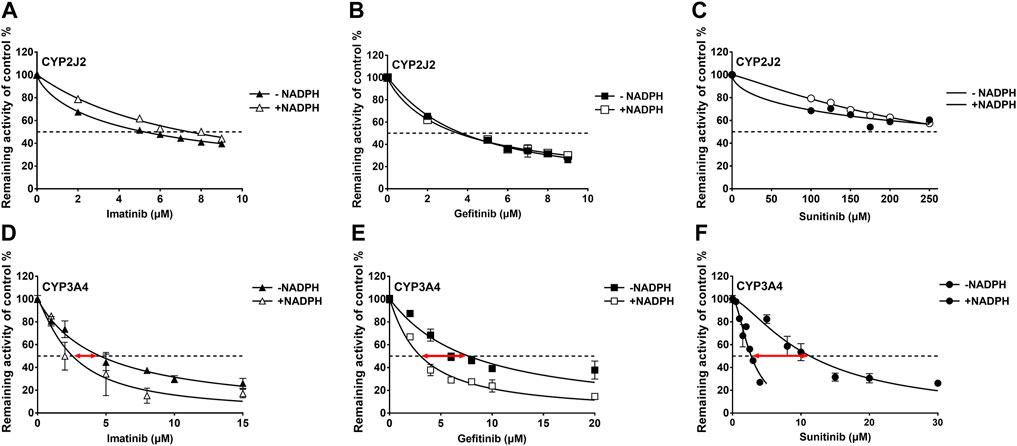
FIGURE 4. Effects of imatinib, gefitinib, and sunitinib on rivaroxaban metabolism mediated by CYP2J2 (A–C) and CYP3A4 (D–F) with or without a 30-min preincubation in the presence of NADPH. Data points are from three independent experiments.
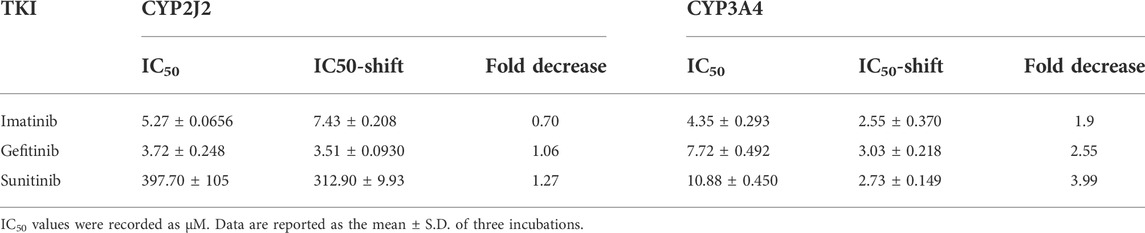
TABLE 3. IC50 shifts initiated by preincubation of the three TKIs with NADPH in CYP2J2 and CYP3A4 incubations.
3.1.4 Time-dependent inhibition of CYP3A4 by sunitinib
Given the 3.99-fold IC50 decrease of sunitinib on CYP3A4 following a 30-min preincubation with NADPH, TDI constants were further determined (Figure 5A). The maximum inactivation rate (Kinact) and the inhibitor concentration needed to produce half of Kinact (KI) were fitted using the nonlinear regression method. As shown in Figure 5B, the Kinact and KI values of sunitinib were 0.0339 min−1 and 2.901 μM, respectively. The Kinact value indicated that approximately 3.4% of CYP3A4 was inactivated per minute when it was incubated with the saturating concentration of sunitinib.
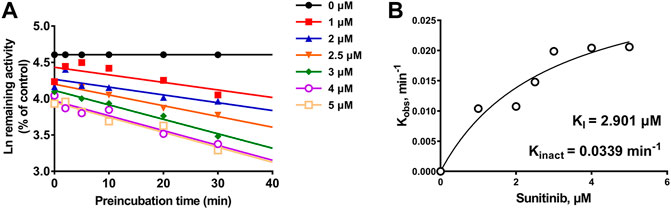
FIGURE 5. (A) Time- and concentration-dependent inactivation of CYP3A4-mediated rivaroxaban metabolism by sunitinib. (B) Observed inactivation rates (Kobs) are plotted against the sunitinib concentration to calculate the inactivation kinetic constants KI and Kinact. Data are reported from three incubations.
3.1.5 Estimation of the drug–drug interaction risk between rivaroxaban and TKIs based on CYP inhibition
According to the inhibition constants of the TKIs for CYP2J2- and CYP3A4-mediated rivaroxaban metabolism, the AUC changes when the TKIs were combined with rivaroxaban were predicted. Imatinib was predicted to cause a 244% increase in rivaroxaban exposure at most based on CYP inhibition (Table 4), while sunitinib and gefitinib were predicted not to cause a significant change in rivaroxaban exposure.
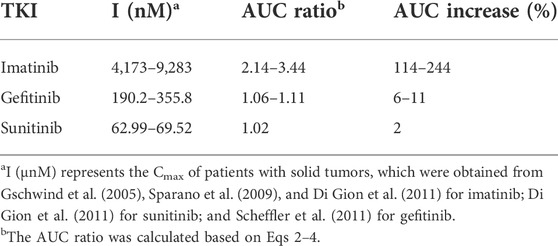
TABLE 4. Prediction of drug–drug interaction risk in vivo arising from inhibition of CYP2J2 and CYP3A4.
3.2 Effects of tyrosine kinase inhibitors on transporter-mediated rivaroxaban efflux transportation in vitro
3.2.1 Cytotoxicity of the three tyrosine kinase inhibitors on the stably transfected cells
To explore the effects of the three TKIs on the two efflux transporters, BCRP and P-gp, MDR1-MDCK and ABCG2-MDCK cells were used to conduct the subsequent experiments. The safety ranges of the three TKIs on these two stably transfected cells were determined. As shown in Figures 6A and B, all the three TKIs showed no cytotoxicity to these two cell lines in the concentration range 0.1–5 μM for 4 h.
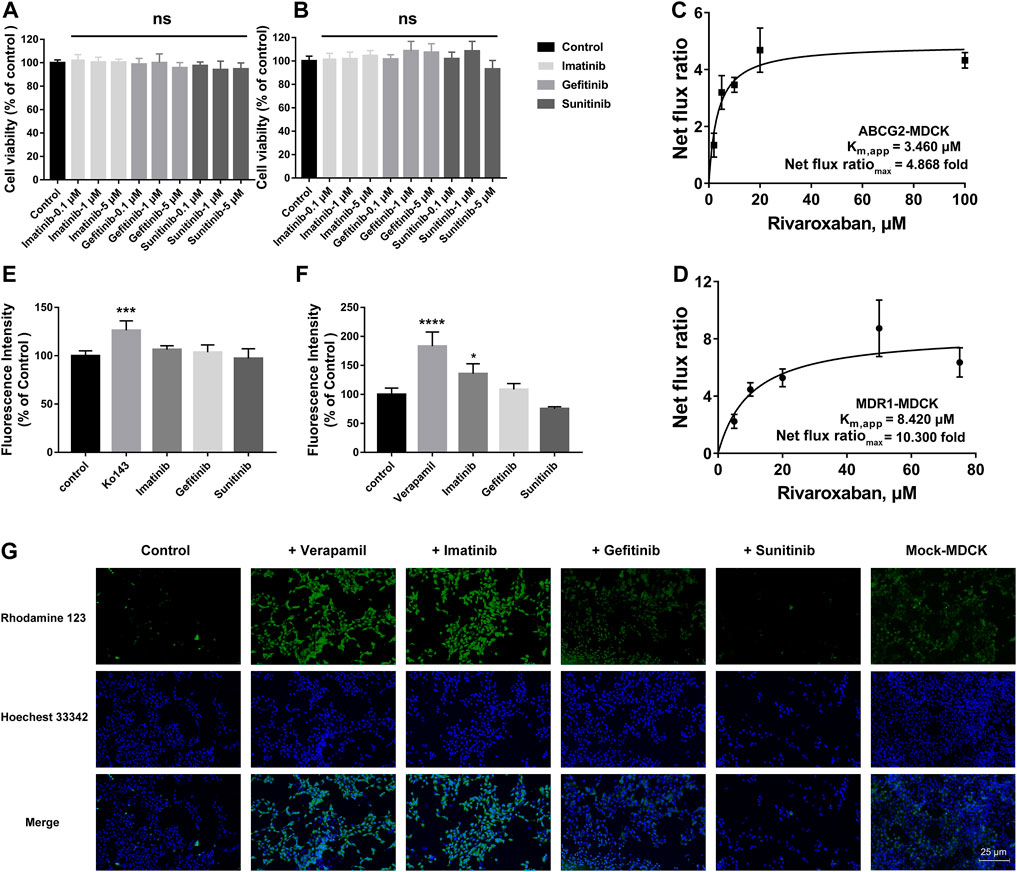
FIGURE 6. Effects of TKIs on BCRP and P-gp. Cytotoxicity of TKIs on ABCG2-MDCK cells (A) and MDR1-MDCK cells (B). Apparent binding constant Km (Km, app) and net flux ratio determination of rivaroxaban across ABCG2-MDCK cells (C) and MDR1-MDCK cells (D). Inhibition screening of three TKIs on mitoxantrone efflux by BCRP (E) and rhodamine 123 efflux by P-gp (F). Accumulation of rhodamine 123 in mock-MDCK and MDR1-MDCK cells using an inverted fluorescence microscope (100× magnification). The control group was incubated with a serum-free medium. In the inhibition screening and fluorescence imaging, 5 μM was used for the three TKIs and rhodamine 123 and 200 μM was used for verapamil. Data are expressed as the mean ± S.D. ∗p < 0.05, ∗∗∗∗p < 0.0001 compared with the control group. ns: not significant, p > 0.05 vs. the control group, n = 3.
3.2.2 Efflux transportation kinetics comparison
The in vivo disposition of rivaroxaban was related to BCRP and P-gp; thus, the efflux transportation kinetics mediated by these two transporters were measured and compared. BCRP showed a higher affinity to rivaroxaban than P-gp, in which the Km,app values were 3.460 and 8.420 μM, respectively. P-gp showed a higher ER than BCRP, in which the net flux ratiomax values were 10.300 and 4.868 folds, respectively (Figures 6C, D).
3.2.3 Initial screening of inhibition on efflux transporters
To determine whether the three TKIs inhibited BCRP and P-gp, the fluorescence substrates mitoxantrone and rhodamine 123 were used. According to the safety range of the TKIs, 5 μM of TKIs was used. Ko 143 (20 μM) and verapamil (200 μM) were used as the positive group for inhibiting BCRP and P-gp, respectively. Ko 143 and verapamil significantly inhibited the fluorescence substrate efflux transportation mediated by BCRP and P-gp, respectively (Figures 6E, F). Imatinib potently inhibited rho-123 efflux transportation mediated by P-gp, but imatinib did not show effect on BCRP-mediated transportation. Gefitinib caused a slight increase in the intracellular rhodamine 123 fluorescence intensity in the MDR1-MDCK cells but without statistical differences. On the contrary, sunitinib decreased the intracellular rhodamine 123 fluorescence intensity but also without statistical differences.
3.2.4 Effects of tyrosine kinase inhibitors on intracellular accumulation of rhodamine 123
To more intuitively observe the inhibition effect, rhodamine 123 was used as the fluorescent probe to perform fluorescence imaging in the MDR1-MDCK and mock-MDCK cells. Obvious differences were observed in the intracellular fluorescence accumulation between MDR1-MDCK and mock-MDCK cells when they were incubated with rhodamine 123. The fluorescence intensity in the MDR1-MDCK cells was significantly weaker than that in the mock-MDCK cells (Figure 6G). Verapamil, one of the classical inhibitors of P-gp, significantly increased the intracellular accumulation of rhodamine 123 in the MDR1-MDCK cells. This suggested that P-gp mediated the efflux transportation of rhodamine 123. In particular, imatinib also significantly increased the intracellular fluorescence intensity. Gefitinib also showed a slight increase in the fluorescence intensity in the MDR1-MDCK cells. On the contrary, the fluorescence intensity in cells incubated with sunitinib was similar to that in the control group.
3.2.5 Effects of tyrosine kinase inhibitors on bidirectional transportation of rivaroxaban
To study the effects of the TKIs on the efflux function of BCRP and P-gp, bidirectional transportation inhibition assays were used. Rivaroxaban was used as the substrate to conduct the bidirectional transportation study in the MDR1-MDCK, ABCG2-MDCK, and mock-MDCK cells. The net flux ratio values of rivaroxaban in the transportation mediated by BCRP and P-gp were more than 2 folds, which indicated that rivaroxaban was the substrate of these two transporters. Ko 143 and verapamil significantly inhibited rivaroxaban efflux transportation mediated by BCRP and P-gp, respectively. When rivaroxaban was incubated with 5 μM imatinib, the net flux ratio of rivaroxaban mediated by BCRP significantly decreased (Figure 7A). In addition, 1 and 5 μM imatinib significantly inhibited rivaroxaban efflux transportation mediated by P-gp (Figure 7D). Notably, the inhibition of imatinib on BCRP- and P-gp-mediated rivaroxaban efflux transportation was in a dose-dependent manner (Figures 7A, D). In contrast, 1 μM gefitinib increased the rivaroxaban efflux transportation mediated by P-gp (Figure 7E). In addition, 0.1 μM sunitinib increased the net flux ratio of rivaroxaban mediated by BCRP (Figure 7C).
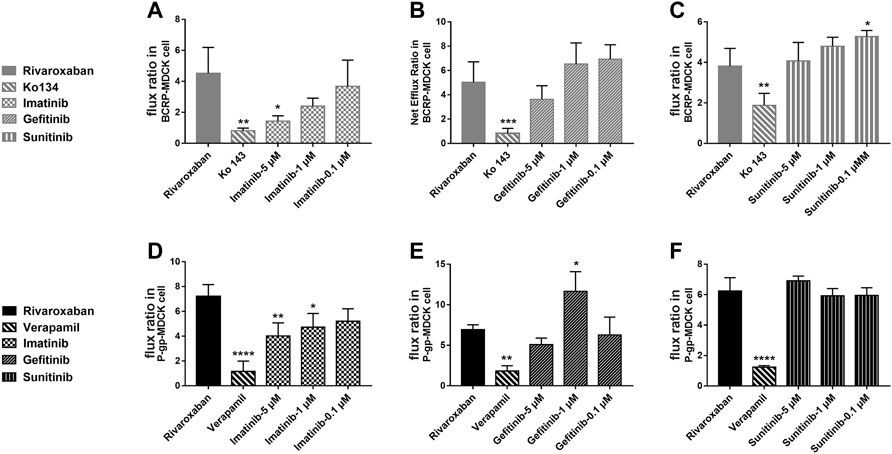
FIGURE 7. Inhibition of the three TKIs on rivaroxaban efflux transported by BCRP (A–C) and P-gp (D–F). Data are expressed as the mean ± S.D. ∗p < 0.05, ∗∗p < 0.01, ∗∗∗∗p < 0.0001 compared with the control group; n = 3.
3.3 Effects of tyrosine kinase inhibitors on rivaroxaban pharmacokinetics in vivo
3.3.1 Effects of tyrosine kinase inhibitors on rivaroxaban pharmacokinetics by oral administration in vivo
To further evaluate the combination safety of rivaroxaban and the three TKIs, the in vivo pharmacokinetics of rivaroxaban combined with the TKIs through oral administration were measured. As shown in Figure 8A, the rivaroxaban exposure of the imatinib coadministration group was significantly increased. Coadministered with imatinib, the Cmax value of rivaroxaban was increased from 129.7 ng/mL to 281.4 ng/mL (p < 0.01), which was a 119.96% increase. Imatinib oral administration also caused a 90.43% increase in the AUC value, which increased from 1.547 ug/ml h to 2.946 ug/ml h (p < 0.05). In addition, imatinib shortened the rivaroxaban time to peak by 1 h. On the contrary, sunitinib significantly reduced rivaroxaban exposure in vivo (Figure 8A). The AUC value of the group co-administrated with sunitinib coadministration group was approximately 37.68% (p < 0.01) to that of the rivaroxaban alone group. The Cmax value of rivaroxaban was deceased by 72.56% (p < 0.01). The gefitinib coadministration group did not show obvious changes in rivaroxaban exposure. Gefitinib shortened the time to peak by 1 h. Detailed pharmacokinetic parameters are shown in Table 5.
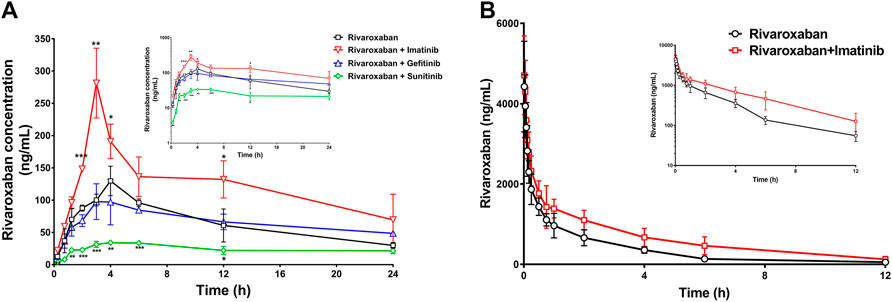
FIGURE 8. Mean plasma concentration–time curves of rivaroxaban when rivaroxaban was administered alone or coadministered with TKIs after oral administration (A) and intravenous administration (B) in rats. Data are expressed as the mean ± S.D. ∗p < 0.05, ∗∗p < 0.01, ∗∗∗p < 0.001 compared with the control group; n = 5.
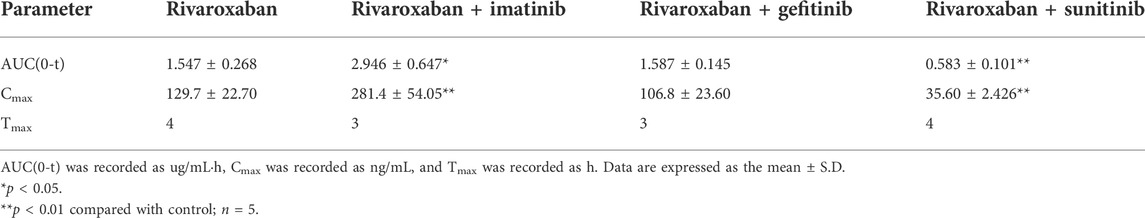
TABLE 5. Pharmacokinetic parameters of rivaroxaban per p.o. administration.
3.3.2 Effects of imatinib on rivaroxaban pharmacokinetics by intravenous administration in vivo
To further investigate the DDI mechanism between imatinib and rivaroxaban, the in vivo pharmacokinetics of rivaroxaban combined with imatinib through intravenous administration were measured. The mean plasma concentrations of rivaroxaban were weakly increased by imatinib but without statistical differences (Figure 8B). In addition, the AUC value was increased by 72.99% (4.648 ug/ml h to 8.041 ug/ml h; p < 0.01). Moreover, the CL value of rivaroxaban was decreased from 0.083 L/h/kg to 0.047 L/h/kg (p < 0.001), which was reduced by 43.38%. Furthermore, the t1/2 and Cmax values were slightly increased but without statistical differences (p > 0.05). Detailed pharmacokinetic parameters are shown in Table 6.
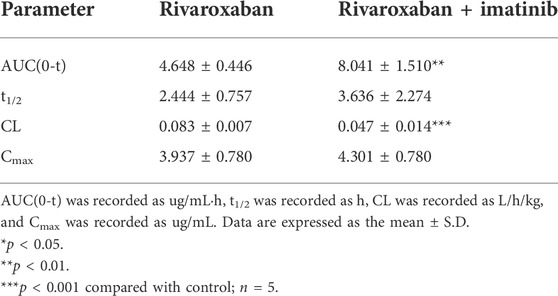
TABLE 6. Pharmacokinetic parameters of rivaroxaban per i.v. administration.
3.4 Molecular docking simulations
Molecular docking simulations were used to elucidate the binding conformations for the interactions between the TKIs and CYP2J2, CYP3A4, BCRP, and P-gp. In the docking simulations between CYP2J2 and the TKIs, gefitinib had the lowest ChemScore value, followed by imatinib and then sunitinib. The ChemScore ranking was consistent with the inhibition intensity. Likewise, imatinib had the lowest ChemScore value in the docking simulation with CYP3A4, followed by gefitinib and then sunitinib, which was also consistent with the inhibition intensity of these TKIs on CYP3A4. Moreover, imatinib had the lowest ChemScore values in the docking simulations with BCRP and P-gp, which was in accordance with the most potent inhibition among these three TKIs on BCRP and P-gp. Detailed ChemScore values are shown in Table 7. Molecule docking simulations of the TKIs with CYPs are shown in Supplementary Figure S1.
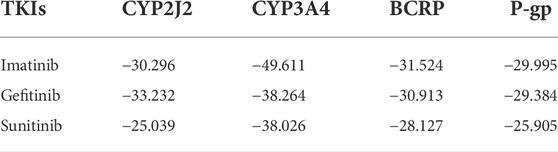
TABLE 7. Comparison of ChemScore values of TKIs binding to CYP2J2, CYP3A4, BCRP, and P-gp.
4 Discussion
The medication safety of rivaroxaban has mostly focused on patients coadministered with cardiovascular drugs, while little attention has been given to cancer patients. Abnormal hemodynamics and physiological disorders of cancer patients lead to a high incidence of thrombotic diseases. Thus, anticoagulation prevention or treatment is necessary, and the combination of rivaroxaban with anticancer drugs has a profound clinical basis. The present study found that clinically significant DDIs exist in the combination of rivaroxaban with imatinib and sunitinib. Imatinib significantly increased rivaroxaban exposure in vivo and also caused a change in the pharmacokinetic absorption parameters, Tmax and Cmax, which may increase bleeding risks (Figure 8). Imatinib showed more than 50% inhibition on BCRP-mediated rivaroxaban efflux at a concentration of 5 μM and also inhibited approximately 20% P-gp-mediated rivaroxaban efflux in a dose-dependent manner (Figures 7A, D). The intestinal concentration of imatinib was predicted to be in the range of 3.2–6.4 mM according to the FDA guidance document published in 2012, under which imatinib may interact with rivaroxaban based on BCRP and P-gp in the intestine. In addition, the inhibition constants of imatinib on CYPs (Ki and IC50) were lower than its plasma concentration (Tables 1, 2, and 4), which may inhibit rivaroxaban metabolism in vivo (Table 6). In contrast to imatinib, sunitinib significantly decreased rivaroxaban exposure when they were combined, which may be caused by sunitinib promoting BCRP efflux transportation. The promotion of sunitinib at 0.1 μM was stronger than that at 1 and 5 μM (Figure 7C). The promotion at 0.1 μM was stronger than that at 1 and 5 μM (Figure 7C). According to the sunitinib clinical oral dose of 50 mg/d, the maximum plasma concentration was approximately 70 nM (Di Gion et al., 2011), which was similar to the concentration of promoting BCRP but much higher than that of inhibiting CYP2J2 or CYP3A4 (Tables 1, 2 and Tables 3, 4). Therefore, we speculated that sunitinib decreased exposure by promoting BCRP efflux transportation and then increasing rivaroxaban excretion. Lafaie et al. also evaluated the DDI risks in combinations of DOACs with TKIs using in vitro cell models (Lafaie et al., 2022). Imatinib was also predicted to have intestinal DDI risks based on P-gp when combined with rivaroxaban. While sunitinib showed little inhibition on P-gp, the intestinal DDIs of sunitinib with rivaroxaban might be less risky. The prediction was in accordance with our results. In particular, endogenous canine transporters of MDCK, such as canine Mdr1, may influence the in vitro results. Therefore, all results obtained in overexpression cells should be compared with the results of the mock-MDCK group to eliminate the effect of carrier cells.
Regarding the combination safety of rivaroxaban, numerous studies have focused on the metabolic enzyme and transporter, but the contribution of the target itself remains unknown. Cheong et al. (2017) predicted a moderate DDI risk in the combinations of rivaroxaban with antiarrhythmic agents, amiodarone and dronedarone, based on the mechanism of inhibition on CYP2J2, CYP3A4, and P-gp in vitro. In addition, the antiplatelet drug ticagrelor was reported to increase the AUC of rivaroxaban by two folds in rats (Chong et al., 2020). Another DDI study showed that enalapril increased the Cmax and AUC values of rivaroxaban by 20%, which suggested to decrease the rivaroxaban dose when it was combined with enalapril for the treatment of hypertensive patients with atrial fibrillation (Zheng et al., 2019). However, there were many pharmacokinetic targets in rivaroxaban-related DDIs, and their contributions remained unclear. It has been reported that ketoconazole or ritonavir, potent CYP3A4 and P-gp dual inhibitors, cause clinically significant and harmful DDIs with rivaroxaban (Mueck et al., 2013). Notably, ketoconazole and ritonavir could also potently inhibit CYP2J2 and BCRP (Lee et al., 2012; Kaspera et al., 2014; Vermeer et al., 2016). Combined with our results, in which CYP2J2 showed approximately 39-fold catalytic efficiency to CYP3A4 and BCRP showed a higher affinity than P-gp, the roles of CYP2J2 and BCRP among the DDIs related to rivaroxaban cannot be excluded (Zhao et al., 2022). In addition, approximately 14% of the dose is eliminated via hydrolysis of the amide bonds (Mueck et al., 2013). Thus, human carboxylesterase may also contribute to the metabolism of rivaroxaban, which is worthy of further study.
Although there are numerous DDI studies related to rivaroxaban, it is still difficult to gauge the relative contribution of the different mechanisms to DDIs. Since various pharmacokinetic targets participate in the disposition of rivaroxaban, we have evaluated every single factor quantitatively in vitro and overall in vivo. Our results showed that clinically relevant DDIs may occur in the combination of rivaroxaban with imatinib and sunitinib. Our results may be of great value to guide the risk assessment of rivaroxaban combined with TKIs. Thus, clinical studies are warranted to investigate these harmful interactions. However, at present, the relative contributions of the different mechanisms to the DDI risk cannot be evaluated. In vitro cell models or CYP incubation assays cannot simulate the specific organs or physiological processes. Therefore, it is of potential significance to develop the physiologically based pharmacokinetic model (PBPK) of rivaroxaban based on specific biological factors. The metabolic activity of the enzyme and the transport activity of the transporter could be detected using probe drugs to develop individualized combined medication DDI risk prediction models, which would predict the contributions of various mechanisms in DDIs. Moreover, the data obtained from human clinical trials based on the present in vitro and in vivo results will be of great significance for PBPK to predict DDI risks between rivaroxaban and TKIs, which is the focus of our further study. Those results would contribute to the realization of formulating individualized dosing regimens. In fact, Cheong et al. have developed and verified such a model, which would make the basic study more clinically significant (Cheong et al., 2019).
In conclusion, the combination safety of rivaroxaban with TKI drugs was comprehensively evaluated in vivo and in vitro. Imatinib significantly increased rivaroxaban exposure by inhibiting CYP2J2, CYP3A4, BCRP, and P-gp, while sunitinib significantly decreased rivaroxaban exposure by promoting the efflux transportation of rivaroxaban mediated by BCRP. Therefore, clinical studies are warranted to investigate these harmful interactions.
Data availability statement
The raw data supporting the conclusions of this article will be made available by the authors, without undue reservation.
Ethics statement
The animal study was reviewed and approved by the Experimental Animal Centre of Dalian Medical University.
Author contributions
TZ: Software, Validation, Formal analysis, Investigation, Writing-original draft. XL: Investigation. YC: Formal analysis, Investigation. JW: Conceptualization, Supervision, Writing-review, Editing. JD: Investigation. XC: Investigation. DW: Software, Formal analysis. LW: Supervision. SZ: Supervision, Data curation. CW: Project administration. QM: Supervision. HS: Supervision. KL: Supervision.
Funding
This work was supported by the National Natural Science Foundation of China (81403003, 81702995, and U1608283) and the LiaoNing Revitalization Talents Program (XLYC1907103).
Conflict of interest
The authors declare that the research was conducted in the absence of any commercial or financial relationships that could be construed as a potential conflict of interest.
Publisher’s note
All claims expressed in this article are solely those of the authors and do not necessarily represent those of their affiliated organizations, or those of the publisher, the editors, and the reviewers. Any product that may be evaluated in this article, or claim that may be made by its manufacturer, is not guaranteed or endorsed by the publisher.
Supplementary material
The Supplementary Material for this article can be found online at: https://www.frontiersin.org/articles/10.3389/fphar.2022.914842/full#supplementary-material
References
Angelini, D. E., Radivoyevitch, T., Mccrae, K. R., and Khorana, A. A. (2019). Bleeding incidence and risk factors among cancer patients treated with anticoagulation. Am. J. Hematol. 94 (7), 780–785. doi:10.1002/ajh.25494
Burotto, M., Manasanch, E. E., Wilkerson, J., and Fojo, T. (2015). Gefitinib and erlotinib in metastatic non-small cell lung cancer: a meta-analysis of toxicity and efficacy of randomized clinical trials. Oncologist 20 (4), 400–410. doi:10.1634/theoncologist.2014-0154
Chee, C. E., Ashrani, A. A., Marks, R. S., Petterson, T. M., Bailey, K. R., Melton, L. J., et al. (2014). Predictors of venous thromboembolism recurrence and bleeding among active cancer patients: a population-based cohort study. Blood 123 (25), 3972–3978. doi:10.1182/blood-2014-01-549733
Cheng, A. L., Kang, Y. K., Lin, D. Y., Park, J. W., Kudo, M., Qin, S., et al. (2013). Sunitinib versus sorafenib in advanced hepatocellular cancer: results of a randomized phase III trial. J. Clin. Oncol. 31 (32), 4067–4075. doi:10.1200/JCO.2012.45.8372
Cheong, E. J., Goh, J. J., Hong, Y., Venkatesan, G., Liu, Y., Chiu, G. N., et al. (2017). Application of static modeling --in the prediction of in vivo drug-drug interactions between rivaroxaban and antiarrhythmic agents based on in vitro inhibition studies. Drug Metab. Dispos. 45 (3), 260–268. doi:10.1124/dmd.116.073890
Cheong, E. J. Y., Teo, D. W. X., Chua, D. X. Y., and Chan, E. C. Y. (2019). Systematic development and verification of a physiologically based pharmacokinetic model of rivaroxaban. Drug Metab. Dispos. 47 (11), 1291–1306. doi:10.1124/dmd.119.086918
Chong, J., Chen, H., Dai, D., Wang, S., Zhou, Q., Liu, J., et al. (2020). Effects of ticagrelor on the pharmacokinetics of rivaroxaban in rats. Pharm. Biol. 58 (1), 630–635. doi:10.1080/13880209.2020.1785510
Dhillon, S. (2015). Gefitinib: a review of its use in adults with advanced non-small cell lung cancer. Target. Oncol. 10 (1), 153–170. doi:10.1007/s11523-015-0358-9
Di Gion, P., Kanefendt, F., Lindauer, A., Scheffler, M., Doroshyenko, O., Fuhr, U., et al. (2011). Clinical pharmacokinetics of tyrosine kinase inhibitors: focus on pyrimidines, pyridines and pyrroles. Clin. Pharmacokinet. 50 (9), 551–603. doi:10.2165/11593320-000000000-00000
Dohse, M., Scharenberg, C., Shukla, S., Robey, R. W., Volkmann, T., Deeken, J. F., et al. (2010). Comparison of ATP-binding cassette transporter interactions with the tyrosine kinase inhibitors imatinib, nilotinib, and dasatinib. Drug Metab. Dispos. 38 (8), 1371–1380. doi:10.1124/dmd.109.031302
Fahmi, O. A., Maurer, T. S., Kish, M., Cardenas, E., Boldt, S., Nettleton, D., et al. (2008). A combined model for predicting CYP3A4 clinical net drug-drug interaction based on CYP3A4 inhibition, inactivation, and induction determined in vitro. Drug Metab. Dispos. 36 (8), 1698–1708. doi:10.1124/dmd.107.018663
Farge, D., Bounameaux, H., Brenner, B., Cajfinger, F., Debourdeau, P., Khorana, A. A., et al. (2016). International clinical practice guidelines including guidance for direct oral anticoagulants in the treatment and prophylaxis of venous thromboembolism in patients with cancer. Lancet. Oncol. 17 (10), e452–e466. doi:10.1016/S1470-2045(16)30369-2
FDA (2020). Vitro drug interaction studies — cytochrome P450 enzyme- and transporter-mediated drug interactions guidance for Industry. Silver spring. MD: Food and Drug Administration.
Filppula, A. M., Laitila, J., Neuvonen, P. J., and Backman, J. T. (2012). Potent mechanism-based inhibition of CYP3A4 by imatinib explains its liability to interact with CYP3A4 substrates. Br. J. Pharmacol. 165 (8), 2787–2798. doi:10.1111/j.1476-5381.2011.01732.x
Filppula, A. M., Neuvonen, P. J., and Backman, J. T. (2014). In vitro assessment of time-dependent inhibitory effects on CYP2C8 and CYP3A activity by fourteen protein kinase inhibitors. Drug Metab. Dispos. 42 (7), 1202–1209. doi:10.1124/dmd.114.057695
Gschwind, H. P., Pfaar, U., Waldmeier, F., Zollinger, M., Sayer, C., Zbinden, P., et al. (2005). Metabolism and disposition of imatinib mesylate in healthy volunteers. Drug Metab. Dispos. 33 (10), 1503–1512. doi:10.1124/dmd.105.004283
Guilhot, F. (2004). Indications for imatinib mesylate therapy and clinical management. Oncologist 9 (3), 271–281. doi:10.1634/theoncologist.9-3-271
Hill, N. R., Sandler, B., Bergrath, E., Milenković, D., Ashaye, A. O., Farooqui, U., et al. (2020). A systematic review of Network meta-analyses and real-world evidence comparing apixaban and rivaroxaban in nonvalvular atrial fibrillation. Clin. Appl. Thromb. Hemost. 26, 1076029619898764. doi:10.1177/1076029619898764
Hutten, B. A., Prins, M. H., Gent, M., Ginsberg, J., Tijssen, J. G., Büller, H. R., et al. (2000). Incidence of recurrent thromboembolic and bleeding complications among patients with venous thromboembolism in relation to both malignancy and achieved international normalized ratio: a retrospective analysis. J. Clin. Oncol. 18 (17), 3078–3083. doi:10.1200/JCO.2000.18.17.3078
Isoherranen, N., Lutz, J. D., Chung, S. P., Hachad, H., Levy, R. H., Ragueneau-Majlessi, I., et al. (2012). Importance of multi-p450 inhibition in drug-drug interactions: evaluation of incidence, inhibition magnitude, and prediction from in vitro data. Chem. Res. Toxicol. 25 (11), 2285–2300. doi:10.1021/tx300192g
Jacqueroux, E., Mercier, C., Margelidon-Cozzolino, V., Hodin, S., Bertoletti, L., Delavenne, X., et al. (2020). In vitro assessment of P-gp and BCRP transporter-mediated drug-drug interactions of riociguat with direct oral anticoagulants. Fundam. Clin. Pharmacol. 34 (1), 109–119. doi:10.1111/fcp.12504
Jiao, Q., Bi, L., Ren, Y., Song, S., Wang, Q., Wang, Y. S., et al. (2018). Advances in studies of tyrosine kinase inhibitors and their acquired resistance. Mol. Cancer 17 (1), 36. doi:10.1186/s12943-018-0801-5
Jin, H., Zhu, Y., Wang, C., Meng, Q., Wu, J., Sun, P., et al. (2020). Molecular pharmacokinetic mechanism of the drug-drug interaction between genistein and repaglinide mediated by P-gp. Biomed. Pharmacother. 125, 110032. doi:10.1016/j.biopha.2020.110032
Kakkar, A. K., Levine, M., Pinedo, H. M., Wolff, R., and Wong, J. (2003). Venous thrombosis in cancer patients: insights from the FRONTLINE survey. Oncologist 8 (4), 381–388. doi:10.1634/theoncologist.8-4-381
Kalra, S., Rini, B. I., and Jonasch, E. (2015). Alternate sunitinib schedules in patients with metastatic renal cell carcinoma. Ann. Oncol. 26 (7), 1300–1304. doi:10.1093/annonc/mdv030
Kaspera, R., Kirby, B. J., Sahele, T., Collier, A. C., Kharasch, E. D., Unadkat, J. D., et al. (2014). Investigating the contribution of CYP2J2 to ritonavir metabolism in vitro and in vivo. Biochem. Pharmacol. 91 (1), 109–118. doi:10.1016/j.bcp.2014.06.020
Khorana, A. A., Francis, C. W., Culakova, E., Kuderer, N. M., and Lyman, G. H. (2007). Thromboembolism is a leading cause of death in cancer patients receiving outpatient chemotherapy. J. Thromb. Haemost. 5 (3), 632–634. doi:10.1111/j.1538-7836.2007.02374.x
Kuczynski, E. A., Lee, C. R., Man, S., Chen, E., and Kerbel, R. S. (2015). Effects of sorafenib dose on acquired reversible resistance and toxicity in hepatocellular carcinoma. Cancer Res. 75 (12), 2510–2519. doi:10.1158/0008-5472.CAN-14-3687
Lafaie, L., Hodin, S., Saïb, S., Bin, V., Bertoletti, L., Delavenne, X., et al. (2022). Tyrosine kinase inhibitors and direct oral anticoagulants: In vitro evaluation of drug-drug interaction mediated by P-glycoprotein. Fundam. Clin. Pharmacol. doi:10.1111/fcp.12769
Lee, C. A., Jones, J. P., Katayama, J., Kaspera, R., Jiang, Y., Freiwald, S., et al. (2012). Identifying a selective substrate and inhibitor pair for the evaluation of CYP2J2 activity. Drug Metab. Dispos. 40 (5), 943–951. doi:10.1124/dmd.111.043505
Li, A., Garcia, D. A., Lyman, G. H., and Carrier, M. (2019). Direct oral anticoagulant (DOAC) versus low-molecular-weight heparin (LMWH) for treatment of cancer associated thrombosis (CAT): a systematic review and meta-analysis. Thromb. Res. 173, 158–163. doi:10.1016/j.thromres.2018.02.144
Mueck, W., Kubitza, D., and Becka, M. (2013). Co-administration of rivaroxaban with drugs that share its elimination pathways: pharmacokinetic effects in healthy subjects. Br. J. Clin. Pharmacol. 76 (3), 455–466. doi:10.1111/bcp.12075
Mueck, W., Stampfuss, J., Kubitza, D., and Becka, M. (2014). Clinical pharmacokinetic and pharmacodynamic profile of rivaroxaban. Clin. Pharmacokinet. 53 (1), 1–16. doi:10.1007/s40262-013-0100-7
Nebot, N., Crettol, S., D'esposito, F., Tattam, B., Hibbs, D. E., Murray, M., et al. (2010). Participation of CYP2C8 and CYP3A4 in the N-demethylation of imatinib in human hepatic microsomes. Br. J. Pharmacol. 161 (5), 1059–1069. doi:10.1111/j.1476-5381.2010.00946.x
Ning, J., Liu, T., Dong, P., Wang, W., Ge, G., Wang, B., et al. (2019). Molecular design strategy to construct the near-infrared fluorescent probe for selectively sensing human cytochrome P450 2J2. J. Am. Chem. Soc. 141 (2), 1126–1134. doi:10.1021/jacs.8b12136
O'brien, S. G., Guilhot, F., Larson, R. A., Gathmann, I., Baccarani, M., Cervantes, F., et al. (2003). Imatinib compared with interferon and low-dose cytarabine for newly diagnosed chronic-phase chronic myeloid leukemia. N. Engl. J. Med. 348 (11), 994–1004. doi:10.1056/NEJMoa022457
Scheffler, M., Di Gion, P., Doroshyenko, O., Wolf, J., and Fuhr, U. (2011). Clinical pharmacokinetics of tyrosine kinase inhibitors: focus on 4-anilinoquinazolines. Clin. Pharmacokinet. 50 (6), 371–403. doi:10.2165/11587020-000000000-00000
Shen, J., Carcaboso, A. M., Hubbard, K. E., Tagen, M., Wynn, H. G., Panetta, J. C., et al. (2009). Compartment-specific roles of ATP-binding cassette transporters define differential topotecan distribution in brain parenchyma and cerebrospinal fluid. Cancer Res. 69 (14), 5885–5892. doi:10.1158/0008-5472.CAN-09-0700
Song, A. B., Rosovsky, R. P., Connors, J. M., and Al-Samkari, H. (2019). Direct oral anticoagulants for treatment and prevention of venous thromboembolism in cancer patients. Vasc. Health Risk Manag. 15, 175–186. doi:10.2147/VHRM.S132556
Sparano, B. A., Egorin, M. J., Parise, R. A., Walters, J., Komazec, K. A., Redner, R. L., et al. (2009). Effect of antacid on imatinib absorption. Cancer Chemother. Pharmacol. 63 (3), 525–528. doi:10.1007/s00280-008-0778-7
Streiff, M. B., Holmstrom, B., Angelini, D., Ashrani, A., Bockenstedt, P. L., Chesney, C., et al. (2020). NCCN guidelines insights: Cancer-associated venous thromboembolic disease, version 2.2018. J. Natl. Compr. Canc. Netw. 16 (11), 1289–1303. doi:10.6004/jnccn.2018.0084
Tang, S. C., Lagas, J. S., Lankheet, N. A., Poller, B., Hillebrand, M. J., Rosing, H., et al. (2012). Brain accumulation of sunitinib is restricted by P-glycoprotein (ABCB1) and breast cancer resistance protein (ABCG2) and can be enhanced by oral elacridar and sunitinib coadministration. Int. J. Cancer 130 (1), 223–233. doi:10.1002/ijc.26000
Tirumani, S. H., Jagannathan, J. P., Krajewski, K. M., Shinagare, A. B., Jacene, H., Ramaiya, N. H., et al. (2013). Imatinib and beyond in gastrointestinal stromal tumors: A radiologist's perspective. AJR. Am. J. Roentgenol. 201 (4), 801–810. doi:10.2214/AJR.12.10003
Vermeer, L. M., Isringhausen, C. D., Ogilvie, B. W., and Buckley, D. B. (2016). Evaluation of ketoconazole and its alternative clinical CYP3A4/5 inhibitors as inhibitors of drug transporters: The in vitro effects of ketoconazole, ritonavir, clarithromycin, and itraconazole on 13 clinically-relevant drug transporters. Drug Metab. Dispos. 44 (3), 453–459. doi:10.1124/dmd.115.067744
Von Mehren, M., and Widmer, N. (2011). Correlations between imatinib pharmacokinetics, pharmacodynamics, adherence, and clinical response in advanced metastatic gastrointestinal stromal tumor (GIST): an emerging role for drug blood level testing? Cancer Treat. Rev. 37 (4), 291–299. doi:10.1016/j.ctrv.2010.10.001
Wertheimer, C., Siedlecki, J., Kook, D., Mayer, W. J., Wolf, A., Klingenstein, A., et al. (2015). EGFR inhibitor Gefitinib attenuates posterior capsule opacification in vitro and in the ex vivo human capsular bag model. Graefes Arch. Clin. Exp. Ophthalmol. 253 (3), 409–417. doi:10.1007/s00417-014-2875-0
Wysokinski, W. E., Houghton, D. E., Casanegra, A. I., Vlazny, D. T., Bott-Kitslaar, D. M., Froehling, D. A., et al. (2019). Comparison of apixaban to rivaroxaban and enoxaparin in acute cancer-associated venous thromboembolism. Am. J. Hematol. 94 (11), 1185–1192. doi:10.1002/ajh.25604
Zhao, T., Chen, Y., Wang, D., Wang, L., Dong, P., Zhao, S., et al. (2022). Identifying the dominant contribution of human cytochrome P450 2J2 to the metabolism of rivaroxaban, an oral anticoagulant. Cardiovasc. Drugs Ther. 36 (1), 121–129. doi:10.1007/s10557-020-07129-z
Zheng, S., Luo, S. B., Mei, Y. B., Guo, J., Tong, L. J., Zhang, Q., et al. (2019). Simultaneous determination of rivaroxaban and enalapril in rat plasma by UPLC-MS/MS and its application to A pharmacokinetic interaction study. Eur. J. Drug Metab. Pharmacokinet. 44 (2), 229–236. doi:10.1007/s13318-018-0504-8
Keywords: rivaroxaban, drug–drug interaction, CYP2J2, CYP3A4, BCRP, P-gp
Citation: Zhao T, Li X, Chen Y, Du J, Chen X, Wang D, Wang L, Zhao S, Wang C, Meng Q, Sun H, Liu K and Wu J (2022) Risk assessment and molecular mechanism study of drug-drug interactions between rivaroxaban and tyrosine kinase inhibitors mediated by CYP2J2/3A4 and BCRP/P-gp. Front. Pharmacol. 13:914842. doi: 10.3389/fphar.2022.914842
Received: 07 April 2022; Accepted: 14 July 2022;
Published: 22 August 2022.
Edited by:
Yan Li, Auckland University of Technology, New ZealandReviewed by:
Karen Rowland-Yeo, Simcyp, United KingdomJi He, Auckland University of Technology, New Zealand
Copyright © 2022 Zhao, Li, Chen, Du, Chen, Wang, Wang, Zhao, Wang, Meng, Sun, Liu and Wu. This is an open-access article distributed under the terms of the Creative Commons Attribution License (CC BY). The use, distribution or reproduction in other forums is permitted, provided the original author(s) and the copyright owner(s) are credited and that the original publication in this journal is cited, in accordance with accepted academic practice. No use, distribution or reproduction is permitted which does not comply with these terms.
*Correspondence: Jingjing Wu, d2pqQGRtdS5lZHUuY24=
†ORCID: Jingjing Wu, orcid.org/0000-0002-5046-9996
‡These authors have contributed equally to this work