
94% of researchers rate our articles as excellent or good
Learn more about the work of our research integrity team to safeguard the quality of each article we publish.
Find out more
ORIGINAL RESEARCH article
Front. Pharmacol. , 09 June 2022
Sec. Ethnopharmacology
Volume 13 - 2022 | https://doi.org/10.3389/fphar.2022.910923
This article is part of the Research Topic Applications of Herbal Medicine to Control Chronic Kidney Disease: Volume II View all 30 articles
 Wei Wu1,2Rui Cheng1,2
 Hamza Boucetta1,2Lei Xu1,2Jing–ru Pan1,2Min Song1,2Yu–ting Lu1,2*
 Tai–jun Hang1,2*
Tripterygium glycosides tablets (TGT) are widely used for treating nephrotic syndrome (NS), but hepatotoxicity is frequently reported. The presence of underlying disease(s) can alter the disposition of drugs and affect their efficacy and toxicity. However, no studies have reported the impact of NS on the ADME profiles of TGT or its subsequent impact on the efficacy and toxicity. Thus, the efficacy and hepatotoxicity of TGT were evaluated in normal and NS rats after oral administration of TGT (10 mg/kg/day) for 4 weeks. The corresponding ADME profiles of the six key TGT components (triptolide (TPL), wilforlide A (WA), wilforgine (WFG), wilfortrine (WFT), wilfordine (WFD), and wilforine (WFR)) were also measured and compared in normal and NS rats after a single oral gavage of 10 mg/kg TGT. Canonical correlation analysis (CCA) of the severity of NS and the in vivo exposure of the six key TGT components was performed to screen the anti–NS and hepatotoxic material bases of TGT. Finally, the efficacy and hepatotoxicity of the target compounds were evaluated in vitro. The results showed that TGT decreased the NS symptoms in rats, but caused worse hepatotoxicity under the NS state. Significant differences in the ADME profiles of the six key TGT components between the normal and NS rats were as follows: higher plasma and tissue exposure, lower urinary and biliary excretion, and higher fecal excretion for NS rats. Based on CCA and in vitro verification, TPL, WA, WFG, WFT, WFD, and WFR were identified as the anti–NS material bases of TGT, whereas TPL, WFG, WFT, and WFD were recognized as the hepatotoxic material bases. In conclusion, NS significantly altered the ADME profiles of the six key TGT components detected in rats, which were related to the anti–NS and hepatotoxic effects of TGT. These results are useful for the rational clinical applications of TGT.
Nephrotic syndrome (NS) is a refractory and complex chronic kidney disease (CKD) characterized by massive proteinuria, hypoalbuminemia, hyperlipidemia, and edema (Wang and Greenbaum, 2019). Tripterygium wilfordii Hook. F is a well–known traditional Chinese medicine (TCM) with prominent anti–inflammatory and immunosuppressive effects (Chen et al., 2013). Tripterygium glycosides tablets (TGT) formulated with only Tripterygium wilfordii Hook. F chloroform extract have been widely used for the treatment of NS in clinical settings for many years (Zhu et al., 2013; Wang et al., 2020). Nevertheless, TGT may also lead to adverse events, particularly hepatic injuries, due to its narrow therapeutic window (Peng et al., 2021; Zhang et al., 2021). These adverse events then restrict its clinical applicability.
Triptolide (TPL), wilforlide A (WA), and four sesquiterpene pyridine alkaloids, wilforgine (WFG), wilfortrine (WFT), wilfordine (WFD), and wilforine (WFR) (Figure 1), have been identified as the major bioactive components of TGT (Gao et al., 2015; Wang et al., 2018; Tong et al., 2021). To ensure the safety of this medicine, the Chinese National Medical Products Administration has released the quality control standard of TGT (WS3–B–3350–98–2011), requiring that the amount of TPL in TGT should not exceed 10 μg/tablet, while that of WA should not be less than 10 μg/tablet (Chinese Pharmacopoeia Commission, 2011). A recent study suggested that WFR could also serve as a quality marker of TGT (Gao et al., 2019). Moreover, researchers have found sesquiterpene pyridine alkaloids have inhibitory effects on the production of nitric oxide and cytokines (Duan et al., 2001; Gao et al., 2015). However, growing evidence shows that these components can also cause serious toxicity. Recently, two studies reported hepatotoxic effects associated with TPL, WFG, and WFR administration in mice (Li et al., 2015; Yuan et al., 2020). Thus, subtle changes in the disposition of these bioactive ingredients in vivo could affect both the efficacy and toxicity of TGT, due to their narrow therapeutic windows.
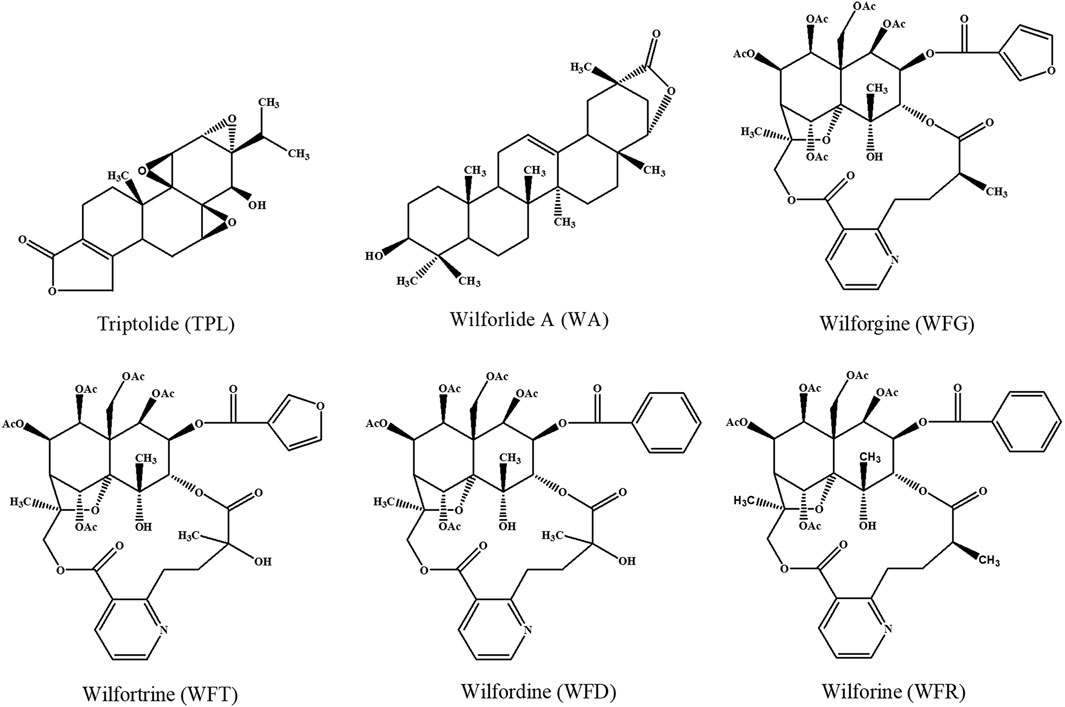
FIGURE 1. Chemical structures of the six key TGT components.
Since drugs are used to treat diseases, patients are their ultimate consumers. However, the pathological status and the severity of disease will affect the drug disposition. These effects can be explained by the altered activities and expression of typical drug transporters and cytochrome P450s (CYP450s), as well as gastrointestinal lesions caused by diseases (Evers et al., 2018; Storelli et al., 2018; Vinarov et al., 2021). Previous studies have shown that CKD affects the disposition of other TCMs (Zhao et al., 2015a; Zhao et al., 2015b). Ultimately, alterations in drug disposition converge to affect clinical outcomes. In response to these changes, clinicians must adjust dosing regimens rationally based on therapeutic drug monitoring, especially for drugs with narrow therapeutic windows. Thus, to better understand the mechanism(s) of action of TGT in the treatment of CKD and support its rational use in the clinic, it is necessary to compare the ADME profiles of the six key TGT components in healthy and CKD states. Although researchers have studied the pharmacokinetic and toxicological characteristics of some TGT components (Du et al., 2018), to our knowledge no studies have reported the detailed ADME profiles of the six key TGT components after oral TGT, or performed a comparative ADME study between healthy and CKD states.
To address these issues, we comparatively investigated the ADME profiles of the six key TGT components in normal and NS rats after oral gavage of TGT using a validated UHPLC–MS/MS method for the bioassay. The therapeutic efficacy and side effects of TGT in NS rats were also evaluated. Based on the results of canonical correlation analysis (CCA) and cell experiments, the anti–NS and hepatotoxic material bases were further confirmed. These results are useful for the rational clinical applications of TGT.
TPL (Lot: 111,567–202,005) and irbesartan (as the IS for the MS/MS determination, Lot: 100,607–201,804) reference substances (content >99%) were obtained from National Institute for Food and Drug Control (Beijing, China). WA (Lot: wkq20040901), WFG (Lot: wkq20040804), WFT (Lot: wkq20040203), WFD (Lot: wkq20040702), and WFR (Lot: wkq20040205) reference substances (content >98%) were purchased from Sichuan Weikeqi Biological Technology Co., Ltd. (Sichuan, China). Adriamycin (ADR) hydrochloride for injection (Lot: 2007E1) was provided by Shenzhen Main Luck Pharmaceuticals Inc. (Shenzhen, China). Assay kits for the measurement of proteinuria, blood albumin (ALB), total protein (TP), total triglycerides (TG), and total cholesterol (TC) were purchased from Nanjing Jiancheng Biological Engineering Institute (Nanjing, China). Lipopolysaccharide (LPS, Escherichia coli 0111: B4) was obtained from Sigma–Aldrich (St. Louis, MO, United States ). The Cell Counting Kit–8 (CCK–8) was purchased from Beyotime Institute Biotechnology (Shanghai, China). HPLC–grade methanol and acetonitrile were obtained from Tedia Company, Inc. (Fairfield, OH, United States ). Analytical grade ethyl acetate, ammonium acetate, and formic acid were supplied by Nanjing Chemical Reagent Co. Ltd. (Nanjing, China). Ultrapure water was prepared using a Millipore purification system (Millipore, MA, United States ).
TGT (Lot: 200,701, containing 10 mg Tripterygium wilfordii Hook. F chloroform extract per tablet), a commercially available TCM preparation, were purchased from Jiangsu Meitong Pharmaceutical Co. Ltd. (Jiangsu, China). Each tablet was measured as containing 5.90 μg TPL, 25.4 μg WA, 148 μg WFG, 86.0 μg WFT, 122 μg WFD, and 175 μg WFR, using our previously validated method (Su et al., 2015b). The content of TPL was less than 10 μg, while that of WA was more than 10 µg per tablet, which met the quality control standard for TGT, WS3-B-3350–98-2011 (Chinese Pharmacopoeia Commission, 2011).
A UHPLC–MS/MS system (TSQ Quantis, Thermo Scientific, San Jose, CA, United States ) equipped with an electrospray ionization interface (ESI) operating in the positive ion mode was used for analysis. Chromatographic separation was achieved on a BDS Hypersil™ C8 column (150 × 2.1 mm, 2.4 µm) with linear gradient elution at 0.5 ml/min using 10 mM ammonium acetate buffer solution and methanol containing 0.1% formic acid as the mobile phases A and B, respectively. The elution program was set as follows (A:B): 0 min (40:60) → 2 min (40:60) → 3 min (0:100) → 9 min (0:100) → 9.1 min (40:60) → 10 min (40:60). The column temperature was maintained at 40°C and the sample injection volume was 20 µl. The MS/MS conditions were optimized as follows: spray voltage of 4.5 KV; ion transfer tube temperature of 350°C; vaporizer temperature of 150°C; nitrogen sheath gas of 241 kPa; and auxiliary gas of 158 kPa. The quantification analysis was conducted under the multiple reaction monitoring (MRM) mode with the argon gas collision–induced dissociation (CID) pressure set at 0.3 Pa. The ion reactions were m/z Mzc4LjM0QDExZVY= → 361.10 for TPL, m/z NDcyLjQ2QDEyZVY= → 437.30 for WA, m/z ODU4LjM1QDU1ZVY= → 178.08 for WFG, m/z ODc0LjMyQDI0ZVY= → 846.25 for WFT, m/z ODg0LjM3QDI0ZVY= → 856.25 for WFD, m/z ODY4LjQxQDU1ZVY= → 178.08 for WFR, and m/z NDI5LjMxQDIzZVY= → 207.00 for IS.
Approximately 165 healthy male Sprague–Dawley rats (6–8 weeks, 200 ± 20 g) were obtained from Shanghai SIPPR–BK laboratory animal Co. Ltd. (Shanghai, China, SCXK (Hu) 2018–0006) and used in this study. All rats were acclimatized in the laboratory for a week and kept under specific pathogen–free conditions: 25 ± 5°C, 50 ± 20% humidity, 12/12 h light/dark cycle, with free access to food and water. All animal experiments were approved by the Animal Ethics Committee of the China Pharmaceutical University (approval number: 2021–09–007).
Since adriamycin–induced nephropathy in rats is a classical animal model of NS and the renal pathological changes are similar to those in patients with NS (Bertani et al., 1982), three types of rats (n = 42 in each type) were established: normal control rats (Con), early–stage NS rats (M1), and advanced–stage NS rats (M2). For rats, the optimal intravenous dose of adriamycin used to induce NS ranges from 1.5 to 7.5 mg/kg (Lee and Harris, 2011). The M1 rats were induced with a 4 mg/kg dose of adriamycin through tail vein injection on day 1 and an additional 2 mg/kg dose of adriamycin after 1 week (Li et al., 2019; Li et al., 2020), while the M2 rats were induced with a single 7.5 mg/kg intravenously dose of adriamycin (Guo et al., 2014; Ni et al., 2018). The Con rats were injected with an equal volume of sterile saline. At the end of the fourth week after the first adriamycin injection, 24 h urine samples from all rats were collected, and their volumes were recorded. After centrifugating the samples at 1,500 ×g for 5 min, we measured the 24 h urinary protein level to evaluate the extent of NS. Approximately 100 μL of blood from all rats was also collected in tubes without anticlotting reagents via the orbital venous plexus, and the corresponding serum samples were separated by 1,100 ×g centrifugation for 10 min at 4 °C for the analysis of blood biochemical indices (ALB, TP, TG, TC).
In this study, we administered oral doses of 10, 30, and 90 mg/kg/day (calculated using Tripterygium wilfordii Hook. F chloroform extract). The 10 mg/kg/day dose for rats was equivalent to the clinical maximum dose of 1.5 mg/kg/day for humans recommended by the current Chinese National Drug Standard of TGT, WS3–B–3350–98–2011 (Chinese Pharmacopoeia Commission, 2011), which was calculated by the body surface area dosage conversion factors (Nair et al., 2018) and in consistence with the other reports (Shan et al., 2016; Gao et al., 2019). The 30 and 90 mg/kg doses were selected based on a literature (Gao et al., 2019).
Since the administration volume was set at 10 ml/kg/day, the TGT suspensions of 1.0, 3.0, and 9.0 mg extract per mL were freshly prepared by mixing an accurately weighed amount of the tablets powder with 0.5% CMC–Na solution through sonication for 30 min. The suspensions were efficiently vortex–mixed to ensure uniform dispersion before oral gavage administration.
Successful induction of adriamycin–induced NS in rats (M1 and M2) was confirmed based on typical NS symptoms of oliguria, massive proteinuria, hypoalbuminemia, and hyperlipidemia (Supplementary Figure S1). The rats were then divided into six groups with seven rats each: three reference groups (Con, M1, M2) and three TGT treatment groups (Con + TGT, M1+TGT, and M2+TGT). The rats in the TGT treatment groups were administered TGT (10 mg/kg) by oral gavage once daily in the morning for 4 weeks, whereas the other rats received only the vehicle (0.5% CMC–Na solution) (Figure 2). Twenty–4 hours after the last dose (8 weeks after the first adriamycin injection), approximately 100 μl of blood was collected from all rats, followed by the immediate collection of 24 h urine samples for the determination of serum biochemical indices and urinary protein, respectively. After 24 h urine collection, each rat in the three TGT treatment groups received a single TGT oral gavage dose of 10 mg/kg and was sacrificed 1 h after administration. The kidney and liver samples from all groups were immediately harvested for histopathological examination and determination of the six key TGT components.
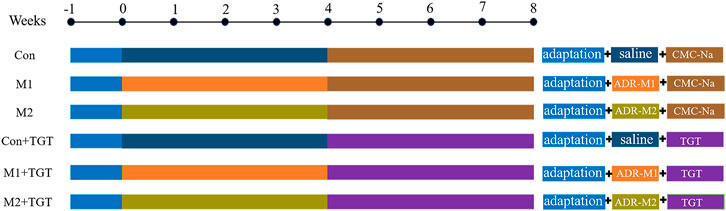
FIGURE 2. The experimental scheme for evaluating the efficacy and hepatotoxicity of TGT in adriamycin-induced-NS rats.
Twenty–four–hour urinary protein (proteinuria) and serum biochemical indices (ALB, TP, TG, and TC) were determined using the corresponding kits according to the manufacturer’s instructions, on an Envision multimode microplate monitoring system. Kidney and liver tissue samples were fixed in 10% neutral buffered formalin, dehydrated in graded alcohol, embedded in paraffin, and sliced. The sliced 4 μm sections were subjected to routine hematoxylin and eosin (HE) staining and observed under a light microscope (Leica, Germany) for histopathological evaluation.
New sets of normal controls and two types of model rats in the three TGT treatment groups (n = 7) were included in the pharmacokinetic study of the six key TGT components. Before the experiment, all rats were fasted overnight with free access to water only. Each rat then received a single TGT oral gavage dose of 10 mg/kg. To determine the correlation between the contents of six TGT components in TGT and in vivo exposure, an additional 14 normal control rats were divided into two groups (n = 7) and given a single TGT dose of 30 or 90 mg/kg. Approximately 150 μl of blood was collected from the orbital venous plexus into heparinized tubes at 0, 0.083, 0.167, 0.25, 0.5, 0.75, 1, 2, 4, 6, 8, 10, 24, 34, and 48 h after administration. The technical personnel were well–trained in performing orbital venous plexus blood draws using a technique that imparts minimal pain to animals. All rats were intragastrically administered 1 ml of water after collection time points of 0.25, 0.5, 2, 4, and 6 h, and were allowed free access to water for fluid replacement throughout the experiment. The plasma was harvested by centrifuging the blood sample at 1,100 ×g for 10 min at 4°C, and then stored at –80°C until analysis.
A 70 μL aliquot of plasma was spiked with 10 μL of IS working solution (200 ng/ml in methanol) and 1 ml of acetonitrile solution. The mixture was then vortexed for 5 min and centrifuged at 16,000 ×g at 4°C for 10 min to extract the analytes and precipitate the endogenous protein materials. Next, 900 μL of the supernatant was collected and evaporated to dryness at 40 °C using a ZLS–1 vacuum centrifugal concentrator. The residue was reconstituted with 100 μl of methanol–water solution (60:40, v/v), and a 20 μl aliquot of the resulting supernatant after centrifugation was injected into the UHPLC–MS/MS system for analysis.
For the tissue distribution study, new sets of normal controls and two types of model rats were assigned to the three TGT treatment groups (n = 7). Each rat was administered a single TGT oral gavage dose of 10 mg/kg after an overnight fast. Rats were sacrificed while under urethane anesthesia, by bleeding from the abdominal aorta 1 h after oral administration of TGT. Subsequently, the tissues (heart, liver, spleen, lung, kidney, and brain) were harvested, rinsed with ice–cold saline, blotted with filter paper, and weighed. Tissue samples were homogenized in ice–cold saline at a weight/volume (w/v) ratio of 1:9 using a JXFSTPRP–24 homogenizer (Shanghai, China).
To improve the recovery of the six key TGT components in tissues, liquid–liquid extraction was used for the pretreatment of the tissue samples as follows: a 70 µl aliquot of tissue homogenate was mixed with 10 μl of IS solution (200 ng/ml in methanol) and extracted with 1 ml of ethyl acetate solution by vortex–mixing for 5 min. A procedure similar to that used for plasma samples was then used to prepare the tissue samples for UHPLC–MS/MS analysis.
For urine and feces excretion studies, new sets of normal controls and two types of model rats assigned to the three TGT treatment groups (n = 7) were housed individually in metabolic cages, and each rat received a single TGT oral gavage dose of 10 mg/kg. Urine and fecal samples were collected at time windows of 0–6, 6–12, 12–24, 24–48, and 48–72 h after administration. The urine volume was measured and recorded, and the fecal samples were dried at 40°C, weighed accurately, pulverized into powder, and then homogenized in ice–cold saline (1:9, w/v).
For the bile excretion study, new sets of normal controls and two types of model rats assigned to the three TGT treatment groups (n = 7) were anesthetized by intraperitoneal injection of urethane solution. An abdominal incision was made, and a cannula was implanted into the bile duct. The incision was then closed by suturing. Blank bile samples were collected within 1 h before drug administration, and the drug–containing bile samples were harvested at time segments of 0–1, 1–2, 2–4, 4–6, 6–9, 9–24, and 24–33 h after a single TGT oral gavage dose of 10 mg/kg. Urine, fecal, and bile samples were prepared using a similar sample preparation procedure as tissue samples.
The selectivity, linearity, accuracy, precision, recovery, matrix effects, and stability of the developed method for the quantification of the six key TGT components in rat bio–samples were validated according to the FDA guidelines for bioanalytical method validation (Food and Drug Administration, 2018). The results of the method validation are summarized in Supplementary Figure S2–Supplementary Figure S6 and Supplementary Table S1–Supplementary Table S15.
CCA is a multivariate statistical model that identifies statistical dependencies between pairs of multivariate data. Two sets of variables can be converted into multiple pairs of canonical variates using the CCA. Among the canonical variate pairs, the first pair has the highest correlation (Koide-Majima and Majima, 2021). In this study, CCA was conducted to analyze the overall correlation between the severity of NS (proteinuria, ALB, TP, TC, and TG) and the PK characteristics (C max, AUC0–t, C kidney or C liver) of the six key TGT components. Before the data mining application, the original NS data were normalized using min-max normalization to enable comparisons of these data by different units of measures. When the correlation significance level was less than 0.05, we considered the response data significant (Yu et al., 2017). In addition, the canonical loadings, which represent the correlation between an original variable and its canonical variable, contribute to determining the critical factors in each group of variables. As a rule, canonical loading with an absolute value greater than 0.3 was used to select the original variables that were thought to have a meaningful interpretation of the related canonical variables (Lambert and Durand, 1975).
The mouse macrophage cell line RAW 264.7 (obtained from the Cell Bank of Chinese Academy of Sciences, Shanghai, China) was cultured in DMEM medium (Gibco, United States ) supplemented with 10% fetal bovine serum (FBS, Biological Industries, Israel) and 1% penicillin–streptomycin (P/S, Biological Industries, Israel) at 37°C in a humidified incubator with 5% CO2.
The inhibitory effects of the six target compounds (TPL, WA, WFG, WFT, WFD, and WFR) on the proliferation of LPS–stimulated RAW264.7 cells were examined by CCK8 assay. RAW 264.7 cells were seeded in 96–well plates (2×10⁴ cells/well) for 12 h, and then co–cultured with LPS (1 μg/ml) (Dai et al., 2021) and the six target compounds at different concentrations for 24 h. The medium was then removed and 10% CCK–8 working solution was added to each well, followed by incubation for 1 h. The optical density (OD) value of each well was measured at 450 nm using a microplate reader (Thermo Fisher, United States ). Cell viability was calculated as follows: cell viability (%) = (OD sample—OD blank)/(OD control—OD blank) × 100.
The normal human liver cell line L02 (purchased from the Cell Bank of Chinese Academy of Sciences, Shanghai, China) was cultured in RPMI 1640 medium (Gibco, United States) containing 10% FBS and 1% P/S in a 5% CO2 incubator at 37°C.
To evaluate the hepatotoxicity, the effects of the four target compounds (TPL, WFG, WFT, and WFD) on L02 cell viability were determined using a CCK8 assay. Briefly, cells were cultured overnight in a 96–well plate (6×10³ cells/well), after which they were treated with TPL, WFG, WFT, and WFR in a series of concentrations for 48 h. Cell viability was determined according to the procedure described in Section 2.10.
WinNonlin (version 7.0, Pharsight, St. Louis, MO, United States ) was used to analyze pharmacokinetic parameters. CCA was performed using SPSS Statistics 24.0 (IBM, United States ). Statistical differences between two groups were determined using GraphPad Prism 8.0 (GraphPad Software, Inc., San Diego, CA) via a two–tailed Student’s t–test. p < 0.05 was considered as statistical significance.
As shown in Figures 3A,B, the NS model rats (M1 and M2 groups) showed significant weight loss and kidney hyperplasia compared to the normal control rats (Con group). After treatment with TGT for 4 weeks, the weight loss and kidney hyperplasia in the M1+TGT and M2+TGT groups were decreased in comparison to those in the corresponding model control groups.
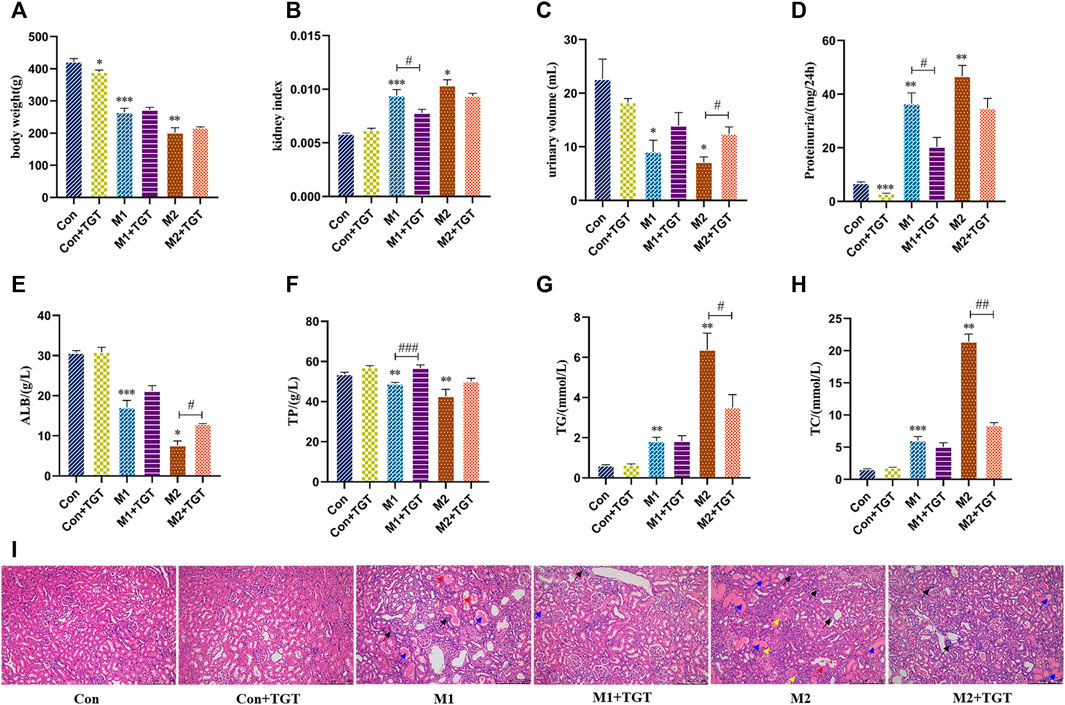
FIGURE 3. TGT ameliorated the symptoms of NS and renal pathological injuries in adriamycin-induced-NS rats after TGT oral gavage dose of 10 mg/kg/day for 4 weeks (means ± SD, n = 7). The body weight (A), the kidney index (B), the urine volume (C), the 24-h proteinuria (D), the serum ALB (E), the serum TP (F), the serum TG (G), and the serum TC (H), *p < 0.05, **p < 0.01, ***p < 0.005 versus Con, #p < 0.05, ##p < 0.01, ###p < 0.005 versus M1 or M2. HE staining of the same field of section sample in kidney tissues (I), interstitial inflammatory infiltrate (black arrow ↗), protein casts (blue arrow  ), degeneration of renal tubular epithelial cells (red arrow
  ), contraction of Bowman’s capsule (yellow arrow
  ) (magnification: ×100).
Oliguria and proteinuria are diagnostic markers of glomerular filtration barrier dysfunction (Meyrier and Niaudet, 2018). In comparison with the corresponding control group, as shown in Figures 3C,D, the urine volumes of the NS model control rats (M1 and M2 groups) decreased significantly, while the 24 h urine protein excretion increased significantly. After treatment with TGT for 4 weeks, a significant increase in urine volume in the M2+TGT group and a remarkable decrease in urine protein excretion in the M1+TGT group were observed, indicating that TGT relieved the symptoms of oliguria and proteinuria in NS rats.
Hypoproteinemia and hyperlipidemia are also major clinical symptoms of NS (Shin et al., 2018). As shown in Figures 3E–H, the levels of serum ALB and TP declined significantly in the M1 and M2 group, whereas the serum TG and TC levels were significantly elevated. After treatment with TGT for 4 weeks, the ALB level in the M2+TGT group and the TP level in the M1+TGT group increased significantly, whereas the levels of TG and TC in the M2+TGT group decreased significantly, suggesting that TGT possessed therapeutic efficacy against hypoalbuminemia and hyperlipidemia in NS rats.
As shown in Figure 3I, there was pronounced kidney pathology characterized by interstitial inflammatory infiltrates, protein casts, degeneration of renal tubular epithelial cells, and contraction of Bowman’s capsule. These changes were observed in the NS model rats (M1 and M2 groups), particularly in group M2. After treatment with TGT for 4 weeks, the pathological damage in the M1+TGT and M2+TGT groups was lower than that in the M1 and M2 groups.
The histopathological micrographs of the livers in the three reference (Con, M1, M2), and three TGT treatment (Con + TGT, M1+TGT, and M2+TGT) groups are shown in Figure 4. In the Con, M1, and M2 groups, all rats presented intact liver architecture with no significant pathology except for slight interstitial inflammatory cell infiltration in group M2. After treatment with TGT for 4 weeks, mild interstitial inflammatory cell infiltration was observed in the Con + TGT group, which became more prominent in the M1 + TGT group. In addition to extensive inflammatory cell infiltration, severe hepatocyte degeneration was observed in the M2 + TGT group. These results suggested that NS, particularly advanced–stage NS, aggravated the hepatotoxicity caused by TGT.
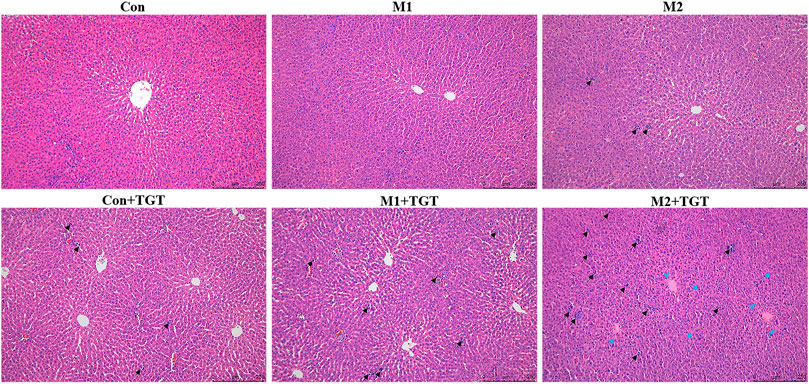
FIGURE 4. Representative pictures of HE staining of the liver tissues in the normal and two types of adriamycin-induced-NS rats assigned to three reference (Con, M1, M2), and three TGT treatment (Con + TGT, M1+TGT, and M2+TGT) groups after TGT oral gavage dose of 10 mg/kg/day for 4 weeks, inflammatory cell infiltration (black arrow ↗), degeneration of hepatocytes (blue arrow  ) (magnification: ×100).
The mean plasma concentration–time curves and pharmacokinetic parameters of the six key TGT components (TPL, WA, WFG, WFT, WFD, and WFR) in normal and two types of NS rats assigned to the three TGT treatment groups (Con + TGT, M1+TGT, and M2+TGT) after a single TGT oral gavage dose of 10 mg/kg are shown in Figure 5 and Table 1, respectively. NS significantly altered the pharmacokinetic behavior of the six key TGT components. In the M1+TGT and M2+TGT groups, particularly in the M2+TGT group, higher plasma exposure of five key TGT components (TPL, WFG, WFT, WFD, and WFR) was found in the rats, characterized by higher Cmax, larger AUCs, smaller volume of distributions (Vd), and slower clearance rates (CL) than those in the normal rats (Con + TGT), whereas the WA showed the opposite trend.
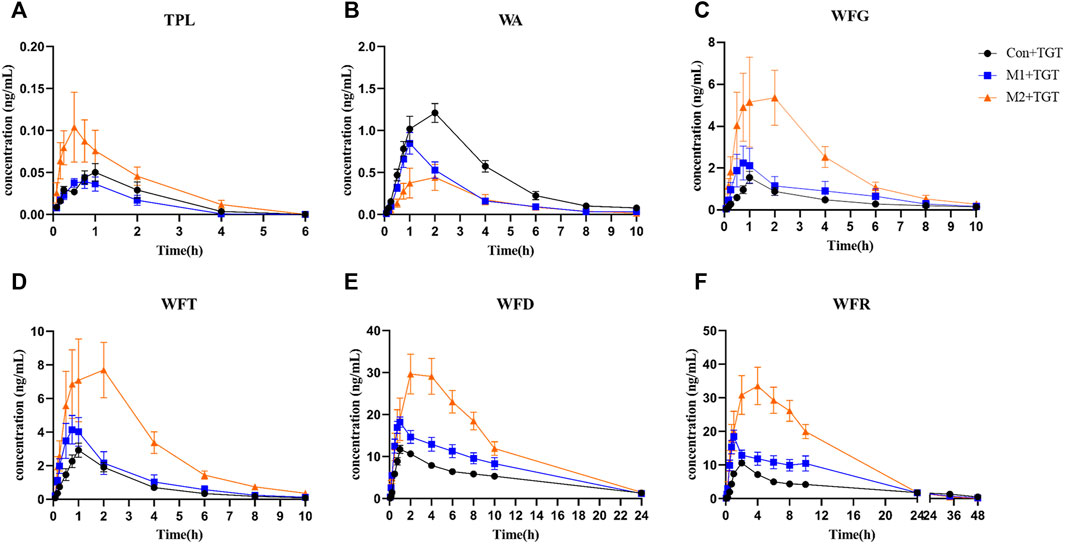
FIGURE 5. Plasma concentration–time profiles of the six key TGT components in the normal and two types of adriamycin-induced-NS rat after a single TGT oral gavage dose of 10 mg/kg (mean ± SD, n = 7). The normal rats, Con + TGT, black circle ●; the early-stage NS rats, M1+TGT, blue square  ; the advanced-stage NS rats, M2+TGT, orange triangle
  . TPL (A), WA (B), WFG (C), WFT (D), WFD (E), WFR (F).
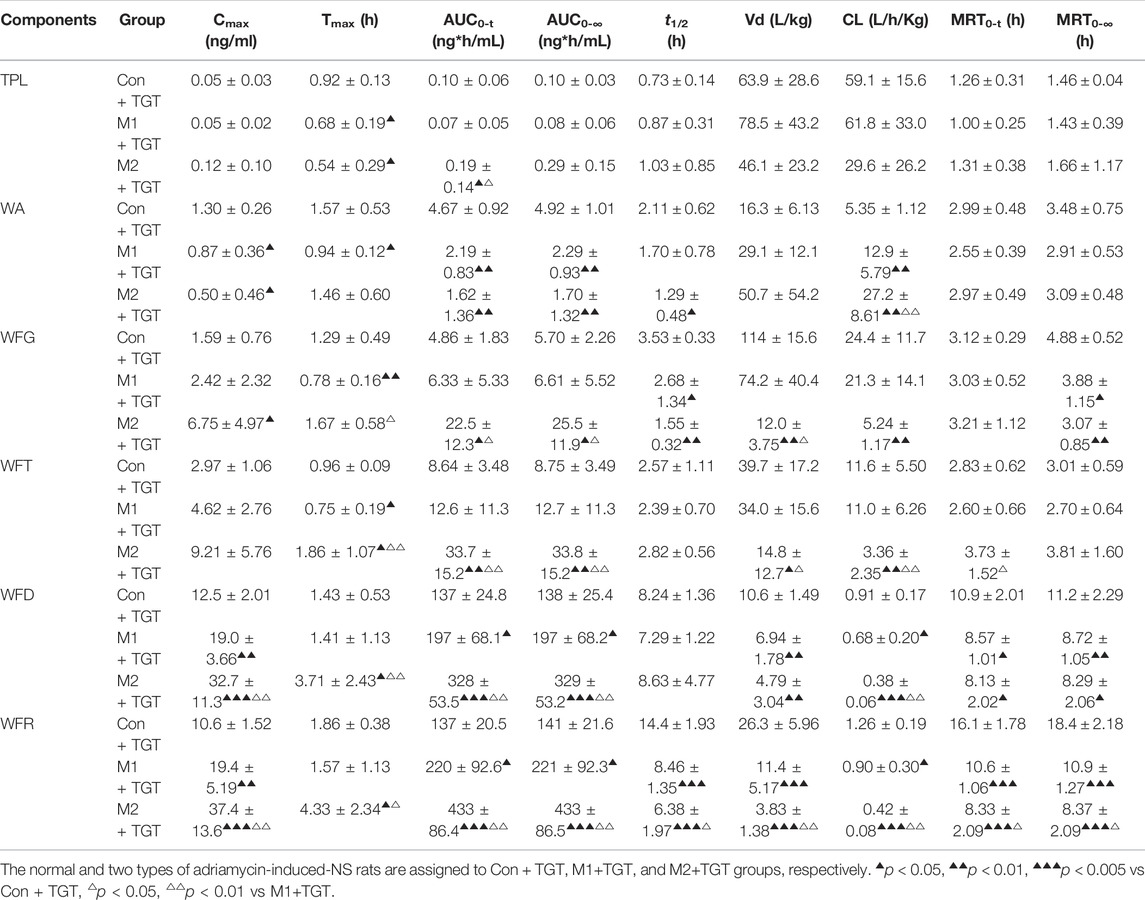
TABLE 1. Pharmacokinetic parameters of the six key TGT components in the normal and two types of adriamycin-induced-NS rats after a single TGT oral gavage dose of 10 mg/kg (n = 7).
The plasma concentration–time profiles and corresponding pharmacokinetic parameters of the six TGT components in normal rats after a single oral gavage dose of 10, 30, or 90 mg/kg TGT are illustrated in Supplementary Figure S7 and Supplementary Table S16, respectively. The in vivo exposure of the six key TGT components showed a dose–dependent trend and increased correspondingly with an increase in dose.
The tissue contents of the six key TGT components (TPL, WA, WFG, WFT, WFD, and WFR) in the normal and two types of NS rats assigned to the three TGT treatment groups (Con + TGT, M1+TGT, and M2+TGT) 1 h after a single TGT oral gavage dose of 10 mg/kg are shown in Figure 6. The contents of these six components were highest in the liver, followed by the kidney, spleen, lung, heart, and brain. The levels of WA, WFG, WFT, and WFD in the liver were elevated in the M1+TGT and M2+TGT groups, especially in the M2+TGT group. The renal contents of WA, WFG, and WFT in the M2+TGT group were significantly higher than those in the Con + TGT and M1+TGT groups, whereas the WFR in the M2+TGT group was significantly lower than that in the Con + TGT group.
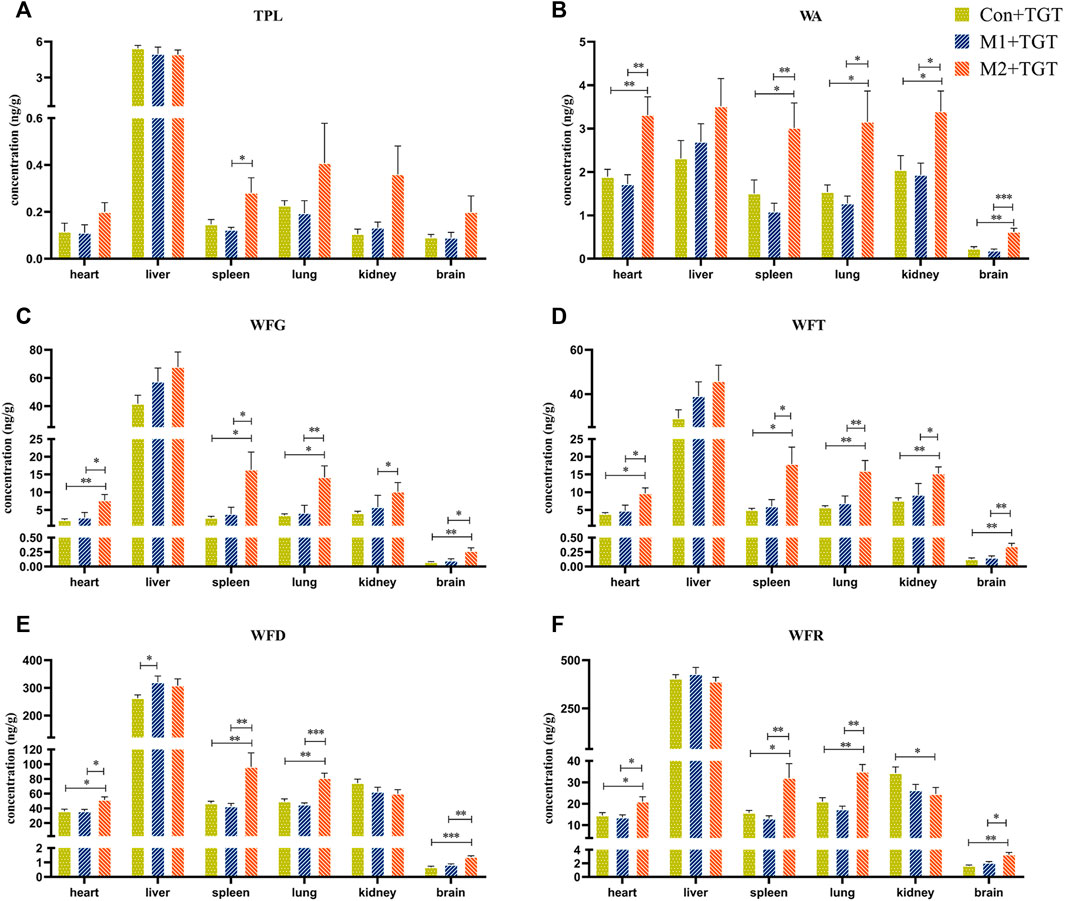
FIGURE 6. Tissue distributions of the six key TGT components in the normal and two types of adriamycin-induced-NS rats 1 hour after a single TGT oral gavage dose of 10 mg/kg (mean ± SD, n = 7). Con + TGT, the normal rats; M1 + TGT, the early-stage NS rats; M2 + TGT, the advanced-stage NS rats. TPL (A), WA (B), WFG (C), WFT (D), WFD (E), WFR (F), ∗p < 0.05, ∗∗p < 0.01, ∗∗∗p < 0.005 versus Con + TGT or M1+TGT.
The WA, WFG, WFT, WFD, and WFR contents in the heart, spleen, lung, and brain were significantly higher in the M2+TGT group than those in the other two treatment groups. In addition, a significantly elevated TPL content in the spleen was observed in the M2+TGT group compared to that in the M1+TGT group.
Collectively, these data showed that the tissue contents of the six key TGT components in the heart, liver, spleen, lung, kidney, and brain increased in NS rats, particularly in advanced–stage NS rats after single–dose TGT administration.
Figure 7 shows the cumulative exposure of the six key TGT components in the kidney and liver in the three TGT treatment (Con + TGT, M1+TGT, and M2+TGT) groups after once daily oral gavage dosing with 10 mg/kg TGT for 4 weeks. Compared with the Con + TGT group, the cumulative exposure of TPL, WA, WFG, WFT, and WFD in the kidney, and TPL, WFG, WFT, and WFD in the liver increased significantly in the M1+TGT and M2+TGT groups, particularly in the M2+TGT group. The increased exposure of these key TGT components in the kidney and liver with the aggravation of NS status likely contributed to the anti–NS effects as well as the obvious hepatotoxicity described in Section 3.2.
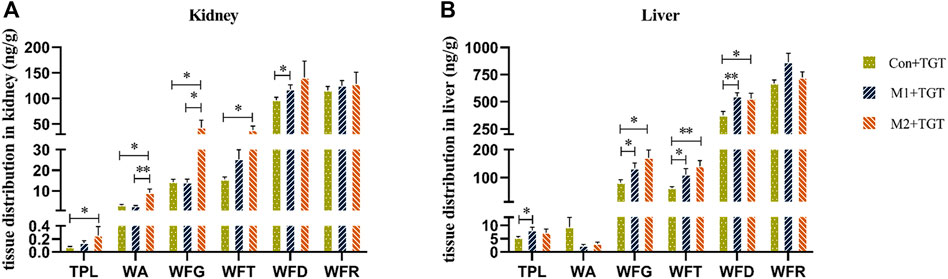
FIGURE 7. Tissue distributions of the six key TGT components in the normal and two types of adriamycin-induced-NS rats 1 hour following the last dose after TGT oral gavage dose of 10 mg/kg/day for 4 weeks (means ± SD, n = 7). Con + TGT, the normal rats; M1 + TGT, the early-stage NS rats; M2 + TGT, the advanced-stage NS rats. Kidney (A), Liver (B), ∗p < 0.05, ∗∗p < 0.01 versus Con + TGT or M1+TGT.
The urine, feces, and bile excretion profiles of six key TGT components in normal and two types of NS rats assigned to the three TGT treatment groups (Con + TGT, M1+TGT, and M2+TGT) after a single TGT oral gavage dose of 10 mg/kg are illustrated in Figures 8–10. When the normal and NS rats were administered the TGT, only four key TGT components (WFG, WFT, WFD, and WFR) of six tested were detected in the urine, feces, and bile samples. By contrast, TPL and WA were not detected or were below the limit of quantitation in all three bio–samples throughout the validated concentration ranges. Therefore, metabolism is a major method of excretion for these components.
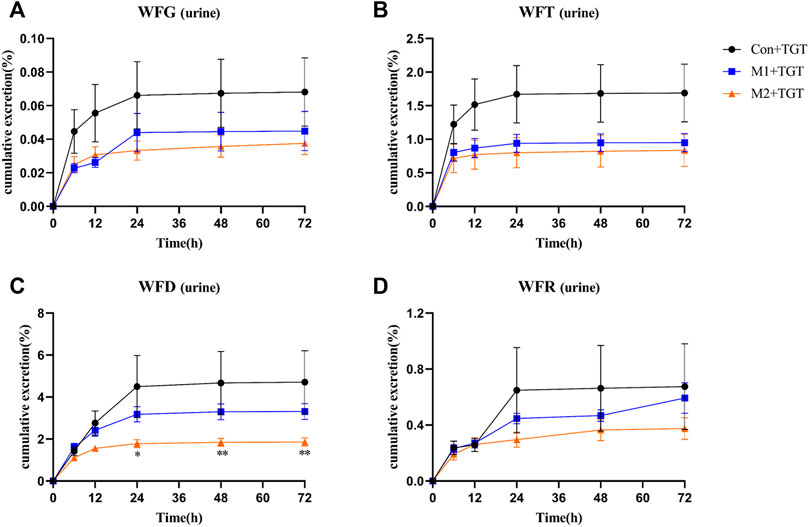
FIGURE 8. The cumulative urine excretion ratios of the four key TGT components in the normal and two types of adriamycin-induced-NS rats after a single TGT oral gavage dose of 10 mg/kg (mean ± SD, n = 7). The normal rats, Con + TGT, black circle ●; the early-stage NS rats, M1+TGT, blue square ; the advanced-stage NS rats, M2+TGT, orange triangle . WFG (A), WFT (B), WFD (C), WFR (D), ∗p < 0.05, ∗∗p < 0.01 versus Con + TGT.
As shown in Figure 8, only a small amount of the detected TGT components (WFG, WFT, WFD, and WFR) were excreted in their original form through urine. The 72 h cumulative urine excretion ratios of the detected TGT components further decreased with the increased severity of NS in rats.
The amounts of the detected TGT components (WFG, WFT, WFD, and WFR) excreted in their original form through feces were higher than those excreted in urine. However, the 72 h cumulative feces excretion ratios of the detected TGT components further increased with the increased severity of NS in rats (Figure 9).
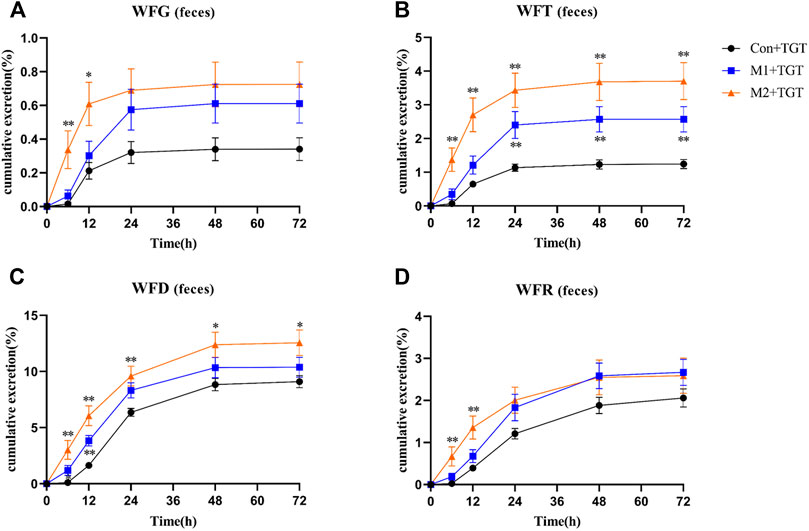
FIGURE 9. The cumulative feces excretion ratios of the four key TGT components in the normal and two types of adriamycin-induced-NS rats after a single TGT oral gavage dose of 10 mg/kg (mean ± SD, n = 7). The normal rats, Con + TGT, black circle ●; the early-stage NS rats, M1+TGT, blue square ; the advanced-stage NS rats, M2+TGT, orange triangle . WFG (A), WFT (B), WFD (C), WFR (D), ∗p < 0.05, ∗∗p < 0.01 versus Con + TGT.
Only a small portion of the detected TGT components (WFG, WFT, WFD, and WFR) were excreted into the bile in their original form. In addition, the 33 h cumulative bile excretion ratios of the detected TGT components also further decreased with the increased severity of NS in rats (Figure 10).
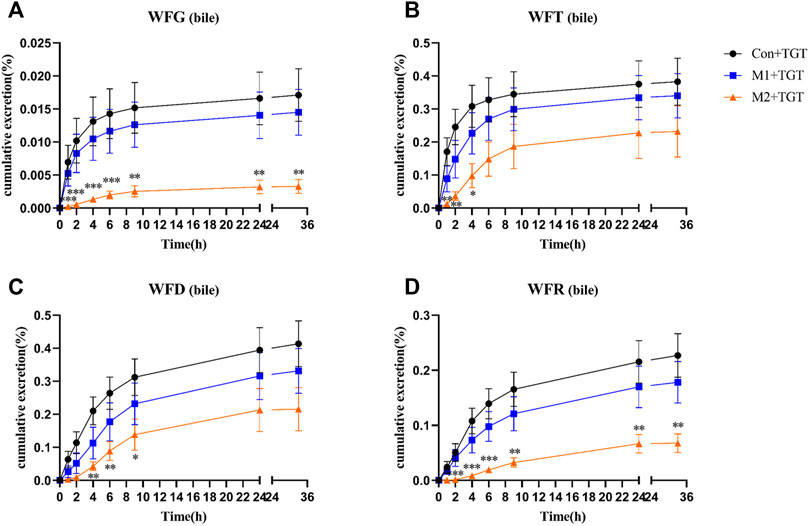
FIGURE 10. The cumulative bile excretion ratios of the four key TGT components in the normal and two types of adriamycin-induced-NS rats after a single TGT oral gavage dose of 10 mg/kg (mean ± SD, n = 7). The normal rats, Con + TGT, black circle ●; the early-stage NS rats, M1+TGT, blue square ; the advanced-stage NS rats, M2+TGT, orange triangle . WFG (A), WFT (B), WFD (C), WFR (D), ∗p < 0.05, ∗∗p < 0.01, ∗∗∗p < 0.005 versus Con + TGT.
The correlations of the first canonical variate pair between NS and Cmax, NS and AUC0–t, NS and Ckidney, and NS and Cliver were statistically significant (F = 3.105, p < 0.05; F = 2.825, p < 0.05; F = 3.859, p < 0.05; F = 2.201, p < 0.05, respectively). The first canonical correlation coefficients were 0.929, 0.933, 0.982, and 0.951, respectively, indicating that the four sets of first canonical variate pairs were positively correlated.
Subsequently, the original variables of canonical loadings with absolute values greater than 0.3 were selected as the key factors in each group of variables. As shown in Table 2, for NS and Cmax, five NS indicators (proteinuria, ALB, TP, TC, and TG) affected the peak exposure of the six TGT components in plasma (TPL, WA, WFG, WFT, WFD, WFR). For NS and AUC0–t, five NS indicators (proteinuria, ALB, TP, TC, and TG) collectively affected the total exposure of the five TGT components (WA, WFG, WFT, WFD, WFR) in plasma. For NS and Ckidney, three NS indicators (proteinuria, ALB, and TG) affected the exposure of the six TGT components (TPL, WA, WFG, WFT, WFD, and WFR) in the kidney. For NS and Cliver, five NS indicators (proteinuria, ALB, TP, TC, and TG) also affected the exposure of the four TGT components (TPL, WFG, WFT, and WFD) in the liver.
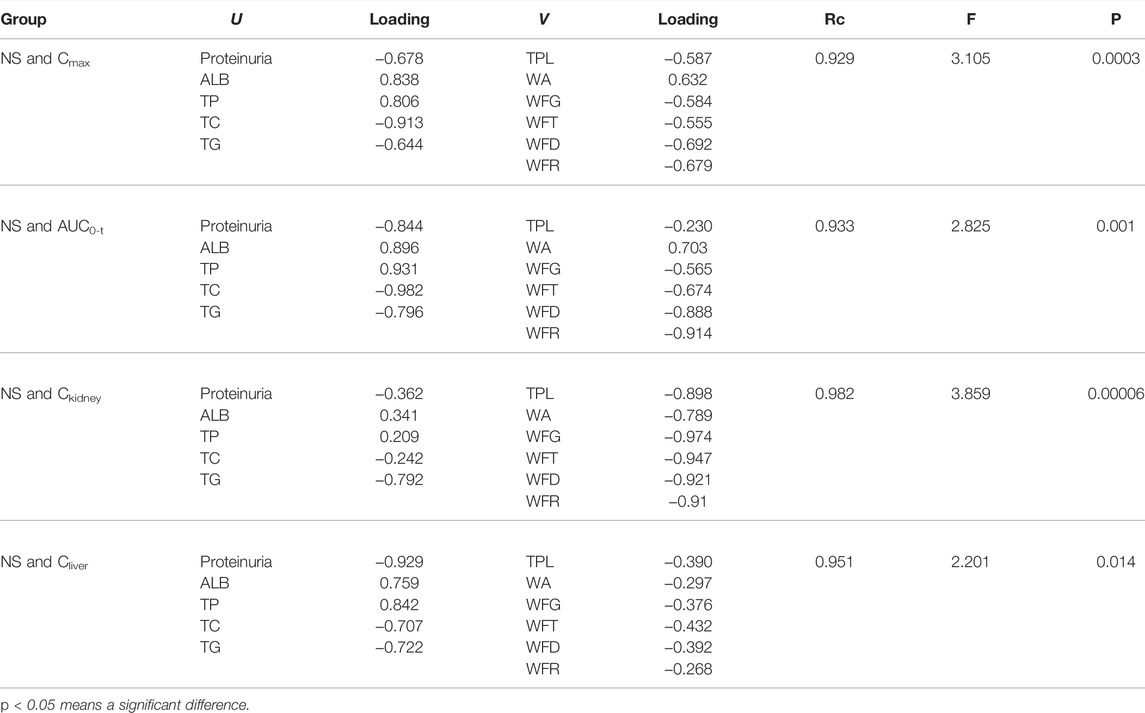
TABLE 2. Canonical structures of the first pair of canonical variables between the severity of NS and in vivo exposure of six key TGT key components (n = 7).
The inhibitory effects of the six target compounds on the proliferation of LPS–stimulated RAW264.7 cells are shown in Supplementary Figure S8. The results showed that TPL (5–100 nM), WFT (50–2,500 nM), and WFD (0.25–2.5 μM) exhibited strong immune–suppressive activities (p < 0.05) in a dose–dependent manner. WA at a concentration of 5 μM, as well as WFG and WFR at a concentration of 25 μM significantly suppressed the proliferation of LPS–stimulated RAW264.7 cells.
The half maximal inhibitory concentration (IC50) values of the four target compounds were finally calculated from the concentration–cell viability curves. As shown in Supplementary Figure S9, TPL had a low IC50 value of 26.8 nM in L02 cells, exhibiting extremely strong hepatotoxic potential. In addition, WFG, WFT, and WFD also showed potent hepatotoxicity with single–digit micromolar IC50 values of 2.6, 2.3, and 1.3 μM, respectively.
TGT have been prescribed for patients with CKD for more than 4 decades with sufficient clinical efficacy (Shao et al., 2021). In this study, the efficacy of TGT on the early–and advanced–stage NS rats was further confirmed (Figure 3). However, when a drug with a narrow therapeutic window is used clinically, other adverse effects can appear. Liver injuries were observed in rats after oral administration of TGT for 4 weeks (Figure 4), which is consistent with a previous report (Zhu et al., 2013). In addition, our group found that liver damage caused by TGT was further aggravated by the progression of NS in rats (Figure 4).
The pharmacokinetic behavior of the key bioactive components in TCMs has been used to predict their efficacy and potential toxicity (Zhang et al., 2018; Gopi and Balakrishnan, 2021). Previous studies on TGT pharmacokinetics have mainly focused on healthy animals, or animals with rheumatoid arthritis. Of note, the severity of rheumatoid arthritis was positively correlated with plasma exposure to WFG and WFR in rats after TGT administration (Su et al., 2015a; Lin et al., 2021; Zhao et al., 2021). Thus, it is rational to investigate the influence of NS on the key TGT components, as NS is another clinical indication for TGT.
NS can cause a gradual loss of renal function and a reduction in glomerular filtration rate, which then decreases the renal clearance of drugs (Torres et al., 2021; Politano et al., 2020). This may explain the significant decrease in urinary excretion ratios of the four detected TGT components (WFG, WFT, WFD, and WFR) that we observed in NS rats (Figure 8). Kidney disease can change not only the renal elimination but also the non–renal disposition of drugs (Lalande et al., 2014). The metabolism of key TGT components is primarily mediated by hepatic cytochrome P450 (CYP450) enzymes (Li et al., 2015). For example, CYP3A4 is predominantly involved in the metabolism of TPL (Xu et al., 2018). Researchers have found that the gene expression of some CYP450 enzyme isoforms (CYP3A4, CYP1A2, CYP2C9, et al.) and the activity of some CYP450 enzyme isoforms (CYP3A subtypes) decrease in kidney disease (Dong et al., 2020; Ladda and Goralski, 2016), leading to a reduction in drug metabolism and bile excretion in their prototypic or metabolite form. Consistent with previous reports, we found that the bile excretion ratios of the four detected key TGT components (WFG, WFG, WFD, and WFR) in their original form were significantly reduced in NS rats (Figure 10). Additionally, the decrease in the expression of some kidney uptake transporters (Oat1 and Oct2) and liver uptake transporters (Oatp1, 2, and 4) in nephropathy rats (Sun et al., 2006) may also reduce drug clearance.
Reducing both renal and non–renal elimination of key TGT components likely changes the in vivo exposure of these components. The plasma exposure of five key TGT components (TPL, WFG, WFT, WFD, and WFR) and the tissue contents of six key TGT components (TPL, WA, WFG, WFT, WFD, and WFR) in the heart, liver, spleen, lung, kidney, and brain increased significantly after single–dose TGT administration in NS rats (Figures 5, 6 and Table 1), consistent with previous reports that the plasma exposure of certain drugs increased when kidney function declined (Albrecht et al., 2017; van der Aart-van der Beek et al., 2021). Furthermore, the cumulative exposure of four key TGT components (TPL, WFG, WFT, and WFD) in the kidney and liver also increased after multi–dose TGT administration in NS rats, particularly advanced–stage NS rats (Figure 7). Drug accumulation in the target tissues could enhance therapeutic efficacy, but also result in unexpected toxicity (Pellegatti and Pagliarusco, 2011), which may account for the production of anti–NS effects and the increased hepatotoxicity of TGT with the increased severity of NS.
In this study, the NS rat model was induced with adriamycin, a routine chemotherapy agent that commonly causes gastrointestinal injuries (Kaczmarek et al., 2012). Small intestinal damage characterized by a decrease in the length and number of villi in the jejunum and ileum was also observed in NS rats (Supplementary Figure S10), which may be responsible for the increase in fecal excretion of four detected key TGT components (WFG, WFT, WFD, and WFR) in NS rats (Figure 9). Although the absorption of these four TGT components was reduced in the NS state, elimination was slowed leading to high exposure in vivo. Excessive or long–term use of TGT for the treatment of NS may still pose hazardous risks.
CCA was used to screen the TGT active components related to their anti–NS and hepatotoxic effects in this study, and the immunosuppressive activity and hepatotoxicity were verified in vitro. TPL, WA, WFG, WFT, WFD, and WFR were identified as the material bases for the treatment of NS, while TPL, WFG, WFT, and WFD were recognized as hepatotoxic material bases (Table 2, Supplementary Figure S8, Supplementary Figure S9). These results would help to better understand the mechanisms of the action of TGT.
Due to the narrow therapeutic window of TGT, unexpected tissue toxicity, particularly hepatotoxicity, need to be considered when treating NS patients. In addition, therapeutic drug monitoring of key TGT components should be included in clinical practice to reduce the risk of adverse reactions. Finally, the pharmacokinetic study of TGT in the clinic should consider the pathological status for further credible guidance information on clinical medication.
In summary, TGT exhibited clear therapeutic efficacy in NS rats, but aggravated hepatotoxicity under the NS state. The potential mechanism was related to the significant increase of in vivo exposure of the six key TGT components in NS rats. TPL, WA, WFG, WFT, WFD, and WFR were identified as the anti–NS material bases of TGT, whereas TPL, WFG, WFT, and WFD were recognized as hepatotoxic material bases. This work will be helpful for the rational clinical applications of TGT.
The original contributions presented in the study are included in the article/Supplementary Material, further inquiries can be directed to the corresponding authors.
The animal study was reviewed and approved by the Animal Ethics Committee of China Pharmaceutical University.
T-jH and WW conceived and designed the experiments. WW, RC, HB, LX, and J-rP performed the experiments. WW, and RC analyzed the data. WW wrote the original draft. T-jH, Y-tL, and MS supervised the investigation. T-jH, and Y-tL reviewed and edited the manuscript.
This work was financially supported by the National Science Foundation of China (No. 30973931/81673678).
The authors declare that the research was conducted in the absence of any commercial or financial relationships that could be construed as a potential conflict of interest.
All claims expressed in this article are solely those of the authors and do not necessarily represent those of their affiliated organizations, or those of the publisher, the editors and the reviewers. Any product that may be evaluated in this article, or claim that may be made by its manufacturer, is not guaranteed or endorsed by the publisher.
The Supplementary Material for this article can be found online at: https://www.frontiersin.org/articles/10.3389/fphar.2022.910923/full#supplementary-material
Albrecht, D., Turakhia, M. P., Ries, D., Marbury, T., Smith, W., Dillon, D., et al. (2017). Pharmacokinetics of Tecarfarin and Warfarin in Patients with Severe Chronic Kidney Disease. Thromb. Haemost. 117, 2026–2033. doi:10.1160/th16-10-0815
Bertani, T., Poggi, A., Pozzoni, R., Delaini, F., Sacchi, G., Thoua, Y., et al. (1982). Adriamycin-induced Nephrotic Syndrome in Rats: Sequence of Pathologic Events. Lab. Invest 46, 16–23.
Chen, Y., Gong, Z., Chen, X., Tang, L., Zhao, X., Yuan, Q., et al. (2013). Tripterygium Wilfordii Hook F (A Traditional Chinese Medicine) for Primary Nephrotic Syndrome. Cochrane Database Syst. Rev. 11, Cd008568. doi:10.1002/14651858.CD008568.pub2
Chinese Pharmacopoeia Commission (2011). Drug Standards of the Ministry of Health of the People's Republic of China. Beijing, China: People 's medical Publishing House.
Dai, L., He, J., Miao, X., Guo, X., Shang, X., Wang, W., et al. (2021). Multiple Biological Activities of Rhododendron Przewalskii Maxim. Extracts and UPLC-ESI-Q-TOF/MS Characterization of Their Phytochemical Composition. Front. Pharmacol. 12, 599778. doi:10.3389/fphar.2021.599778
Dong, Y., Gong, L., Lu, X., Ye, M., Lin, Y., Xie, S., et al. (2020). Changes of Transporters and Drug-Metabolizing Enzymes in Nephrotic Syndrome. Curr. Drug Metab. 21, 368–378. doi:10.2174/1389200221666200512113731
Du, X., Nyagblordzro, M., An, L., Gao, X., Du, L., Wang, Y., et al. (2018). Pharmacokinetic and Toxicological Characteristics of Tripterigium Glycosides and Their Derivatives. Curr. Drug Metab. 19, 605–627. doi:10.2174/1389200219666180302152752
Duan, H., Takaishi, Y., Momota, H., Ohmoto, Y., Taki, T., Jia, Y., et al. (2001). Immunosuppressive Sesquiterpene Alkaloids from Tripterygium Wilfordii. J. Nat. Prod. 64, 582–587. doi:10.1021/np000504a
Evers, R., Piquette-Miller, M., Polli, J. W., Russel, F. G. M., Sprowl, J. A., Tohyama, K., et al. (2018). Disease-Associated Changes in Drug Transporters May Impact the Pharmacokinetics And/or Toxicity of Drugs: A White Paper from the International Transporter Consortium. Clin. Pharmacol. Ther. 104, 900–915. doi:10.1002/cpt.1115
Food and Drug Administration (2018). Bioanalytical Method Validation Guidance for Industry. Available at: https://www.fda.gov/regulatory-information/search-fda-guidance documents/bioanalytical -method-validation-guidance-industry (Accessed May, 2018).
Gao, C., Huang, X. X., Bai, M., Wu, J., Li, J. Y., Liu, Q. B., et al. (2015). Anti-inflammatory Sesquiterpene Pyridine Alkaloids from Tripterygium Wilfordii. Fitoterapia 105, 49–54. doi:10.1016/j.fitote.2015.06.003
Gao, X., Du, X., An, L., Wang, Y., Wang, L., Wu, Z., et al. (2019). Wilforine, the Q-Marker and PK-Maker of Tripterygium Glycosides Tablet: Based on Preparation Quantitative Analysis and PK-PD Study. Phytomedicine 54, 357–364. doi:10.1016/j.phymed.2018.03.031
Gopi, S., and Balakrishnan, P. (2021). Evaluation and Clinical Comparison Studies on Liposomal and Non-liposomal Ascorbic Acid (Vitamin C) and Their Enhanced Bioavailability. J. Liposome Res. 31, 356–364. doi:10.1080/08982104.2020.1820521
Guo, J., Zou, Y., Wu, Z., Wu, W., Xu, Z., Hu, H., et al. (2014). Protective Effects of Mesenchymal Stromal Cells on Adriamycin-Induced Minimal Change Nephrotic Syndrome in Rats and Possible Mechanisms. Cytotherapy 16, 471–484. doi:10.1016/j.jcyt.2013.08.002
Kaczmarek, A., Brinkman, B. M., Heyndrickx, L., Vandenabeele, P., and Krysko, D. V. (2012). Severity of Doxorubicin-Induced Small Intestinal Mucositis Is Regulated by the TLR-2 and TLR-9 Pathways. J. Pathol. 226, 598–608. doi:10.1002/path.3009
Koide-Majima, N., and Majima, K. (2021). Quantum-inspired Canonical Correlation Analysis for Exponentially Large Dimensional Data. Neural Netw. 135, 55–67. doi:10.1016/j.neunet.2020.11.019
Ladda, M. A., and Goralski, K. B. (2016). The Effects of CKD on Cytochrome P450-Mediated Drug Metabolism. Adv. Chronic Kidney Dis. 23, 67–75. doi:10.1053/j.ackd.2015.10.002
Lalande, L., Charpiat, B., Leboucher, G., and Tod, M. (2014). Consequences of Renal Failure on Non-renal Clearance of Drugs. Clin. Pharmacokinet. 53, 521–532. doi:10.1007/s40262-014-0146-1
Lambert, Z. V., and Durand, R. M. (1975). Some Precautions in Using Canonical Analysis. J. Mark. Res. 12, 468–475. doi:10.1177/002224377501200411
Lee, V. W., and Harris, D. C. (2011). Adriamycin Nephropathy: a Model of Focal Segmental Glomerulosclerosis. Nephrol. Carlt. 16, 30–38. doi:10.1111/j.1440-1797.2010.01383.x
Li, A. P., Yang, L., Zhang, L. C., He, S. S., Jia, J. P., and Qin, X. M. (2020). Evaluation of Injury Degree of Adriamycin-Induced Nephropathy in Rats Based on Serum Metabolomics Combined with Proline Marker. J. Proteome Res. 19, 2575–2584. doi:10.1021/acs.jproteome.9b00785
Li, W., He, W., Xia, P., Sun, W., Shi, M., Zhou, Y., et al. (2019). Total Extracts of Abelmoschus Manihot L. Attenuates Adriamycin-Induced Renal Tubule Injury via Suppression of ROS-Erk1/2-Mediated NLRP3 Inflammasome Activation. Front. Pharmacol. 10, 567. doi:10.3389/fphar.2019.00567
Li, X. X., Du, F. Y., Liu, H. X., Ji, J. B., and Xing, J. (2015). Investigation of the Active Components in Tripterygium Wilfordii Leading to its Acute Hepatotoxicty and Nephrotoxicity. J. Ethnopharmacol. 162, 238–243. doi:10.1016/j.jep.2015.01.004
Lin, J., Gao, L., Lin, Y., Wang, S., Yang, Z., Ren, S., et al. (2021). Pharmacokinetics-Based Chronoefficacy of Semen Strychni and Tripterygium Glycoside Tablet against Rheumatoid Arthritis. Front. Pharmacol. 12, 673263. doi:10.3389/fphar.2021.673263
Meyrier, A., and Niaudet, P. (2018). Acute Kidney Injury Complicating Nephrotic Syndrome of Minimal Change Disease. Kidney Int. 94, 861–869. doi:10.1016/j.kint.2018.04.024
Nair, A., Morsy, M. A., and Jacob, S. (2018). Dose Translation between Laboratory Animals and Human in Preclinical and Clinical Phases of Drug Development. Drug Dev. Res. 79, 373–382. doi:10.1002/ddr.21461
Ni, Y., Wang, X., Yin, X., Li, Y., Liu, X., Wang, H., et al. (2018). Plectin Protects Podocytes from Adriamycin-Induced Apoptosis and F-Actin Cytoskeletal Disruption through the Integrin α6β4/FAK/p38 MAPK Pathway. J. Cell Mol. Med. 22, 5450–5467. doi:10.1111/jcmm.13816
Pellegatti, M., and Pagliarusco, S. (2011). Drug and Metabolite Concentrations in Tissues in Relationship to Tissue Adverse Findings: a Review. Expert Opin. Drug Metab. Toxicol. 7, 137–146. doi:10.1517/17425255.2011.545053
Peng, W., Dai, M. Y., Bao, L. J., Zhu, W. F., and Li, F. (2021). FXR Activation Prevents Liver Injury Induced by Tripterygium Wilfordii Preparations. Xenobiotica 51, 716–727. doi:10.1080/00498254.2021.1900626
Politano, S. A., Colbert, G. B., and Hamiduzzaman, N. (2020). Nephrotic Syndrome. Prim. Care 47, 597–613. doi:10.1016/j.pop.2020.08.002
Shan, P., Lu, Z., Ye, L., Fang, Y., Tan, S., Xuan, G., et al. (2016). Effect of Tripterygium Wilfordii Polyglycoside on Experimental Prostatitis Caused by Ureaplasma Urealyticum in Rats. Med. Sci. Monit. 22, 3722–3726. doi:10.12659/msm.897360
Shao, M., Ye, C., Bayliss, G., and Zhuang, S. (2021). New Insights into the Effects of Individual Chinese Herbal Medicines on Chronic Kidney Disease. Front. Pharmacol. 12, 774414. doi:10.3389/fphar.2021.774414
Shin, J. I., Kronbichler, A., Oh, J., and Meijers, B. (2018). Nephrotic Syndrome: Genetics, Mechanism, and Therapies. Biomed. Res. Int. 2018, 6215946. doi:10.1155/2018/6215946
Storelli, F., Samer, C., Reny, J. L., Desmeules, J., and Daali, Y. (2018). Complex Drug-Drug-Gene-Disease Interactions Involving Cytochromes P450: Systematic Review of Published Case Reports and Clinical Perspectives. Clin. Pharmacokinet. 57, 1267–1293. doi:10.1007/s40262-018-0650-9
Su, M. X., Song, M., Yang, D. S., Shi, J. F., Di, B., and Hang, T. J. (2015a). Simultaneous LC-MS/MS Determination of Five Tripterygium Pyridine Alkaloids in Dog Plasma and its Application to Their Pharmacokinetic Study after Oral Administration of Tripterygium Glycosides Tablets. J. Chromatogr. B Anal. Technol. Biomed. Life Sci. 990, 31–38. doi:10.1016/j.jchromb.2015.03.011
Su, M. X., Zhou, W. D., Lan, J., Di, B., and Hang, T. J. (2015b). Rapid and Sensitive Analysis of Multiple Bioactive Constituents in Tripterygium Glycosides Tablets Using Liquid Chromatography Coupled with Time-Of-Flight Mass Spectrometry. J. Sep. Sci. 38, 804–812. doi:10.1002/jssc.201400946
Sun, H., Frassetto, L., and Benet, L. Z. (2006). Effects of Renal Failure on Drug Transport and Metabolism. Pharmacol. Ther. 109, 1–11. doi:10.1016/j.pharmthera.2005.05.010
Tong, L., Zhao, Q., Datan, E., Lin, G. Q., Minn, I., Pomper, M. G., et al. (2021). Triptolide: Reflections on Two Decades of Research and Prospects for the Future. Nat. Prod. Rep. 38, 843–860. doi:10.1039/d0np00054j
Torres, A. M., Dnyanmote, A. V., Granados, J. C., and Nigam, S. K. (2021). Renal and Non-renal Response of ABC and SLC Transporters in Chronic Kidney Disease. Expert Opin. Drug Metab. Toxicol. 17, 515–542. doi:10.1080/17425255.2021.1899159
van der Aart-van der Beek, A. B., Koomen, J. V., Dekkers, C. C. J., Barbour, S. J., Boulton, D. W., Gansevoort, R. T., et al. (2021). Evaluation of the Pharmacokinetics and Exposure-Response Relationship of Dapagliflozin in Patients without Diabetes and with Chronic Kidney Disease. Clin. Pharmacokinet. 60, 517–525. doi:10.1007/s40262-020-00956-1
Vinarov, Z., Abdallah, M., Agundez, J. A. G., Allegaert, K., Basit, A. W., Braeckmans, M., et al. (2021). Impact of Gastrointestinal Tract Variability on Oral Drug Absorption and Pharmacokinetics: An UNGAP Review. Eur. J. Pharm. Sci. 162, 105812. doi:10.1016/j.ejps.2021.105812
Wang, C. S., Troost, J. P., Greenbaum, L. A., Srivastava, T., Reidy, K., Gibson, K., et al. (2019). Text Messaging for Disease Monitoring in Childhood Nephrotic Syndrome. Kidney Int. Rep. 4, 1066–1074. doi:10.1016/j.ekir.2019.04.026
Wang, X. W., Tian, R. M., Yang, Y. Q., Wang, K., Li, E. N., Han, X. D., et al. (2020). Tripterygium Glycoside Fraction N2 Ameliorates Adriamycin-Induced Nephrotic Syndrome in Rats by Suppressing Apoptosis. J. Ethnopharmacol. 257, 112789. doi:10.1016/j.jep.2020.112789
Wang, Z., Yeung, S., Chen, S., Moatazedi, Y., and Chow, M. S. S. (2018). Bioavailability of Wilforlide A in Mice and its Concentration Determination Using an HPLC-APCI-MS/MS Method. J. Chromatogr. B Anal. Technol. Biomed. Life Sci. 1090, 65–72. doi:10.1016/j.jchromb.2018.05.018
Xu, Y., Zhang, Y. F., Chen, X. Y., and Zhong, D. F. (2018). CYP3A4 Inducer and Inhibitor Strongly Affect the Pharmacokinetics of Triptolide and its Derivative in Rats. Acta Pharmacol. Sin. 39, 1386–1392. doi:10.1038/aps.2017.170
Yu, N., Zhang, Q., Zhang, L., He, T., Liu, Q., and Zhang, S. (2017). Canonical Correlation Analysis (CCA) of Anthropometric Parameters and Physical Activities with Blood Lipids. Lipids Health Dis. 16, 236. doi:10.1186/s12944-017-0630-3
Yuan, Z., Yuan, Z., Hasnat, M., Zhang, H., Liang, P., Sun, L., et al. (2020). A New Perspective of Triptolide-Associated Hepatotoxicity: the Relevance of NF- κ B and NF- κ B-Mediated Cellular FLICE-Inhibitory Protein. Acta Pharm. Sin. B 10, 861–877. doi:10.1016/j.apsb.2020.02.009
Zhang, M., Lin, L., Lin, H., Qu, C., Yan, L., and Ni, J. (2018). Interpretation the Hepatotoxicity Based on Pharmacokinetics Investigated through Oral Administrated Different Extraction Parts of Polygonum Multiflorum on Rats. Front. Pharmacol. 9, 505. doi:10.3389/fphar.2018.00505
Zhang, Y., Mao, X., Li, W., Chen, W., Wang, X., Ma, Z., et al. (2021). Tripterygium Wilfordii: An Inspiring Resource for Rheumatoid Arthritis Treatment. Med. Res. Rev. 41, 1337–1374. doi:10.1002/med.21762
Zhao, J., Zhang, F., Xiao, X., Wu, Z., Hu, Q., Jiang, Y., et al. (2021). Tripterygium Hypoglaucum (Lévl.) Hutch and its Main Bioactive Components: Recent Advances in Pharmacological Activity, Pharmacokinetics and Potential Toxicity. Front. Pharmacol. 12, 715359. doi:10.3389/fphar.2021.715359
Zhao, M., Qian, D., Liu, P., Shang, E. X., Jiang, S., Guo, J., et al. (2015a). Comparative Pharmacokinetics of Catalpol and Acteoside in Normal and Chronic Kidney Disease Rats after Oral Administration of Rehmannia Glutinosa Extract. Biomed. Chromatogr. 29, 1842–1848. doi:10.1002/bmc.3505
Zhao, M., Qian, D., Shang, E. X., Jiang, S., Guo, J., Liu, P., et al. (2015b). Comparative Pharmacokinetics of the Main Compounds of Shanzhuyu Extract after Oral Administration in Normal and Chronic Kidney Disease Rats. J. Ethnopharmacol. 173, 280–286. doi:10.1016/j.jep.2015.07.037
Keywords: tripterygium glycosides tablets, nephrotic syndrome, pharmacokinetics, tissue distribution, excretions, efficacy, hepatotoxicity
Citation: Wu W, Cheng R, Boucetta H, Xu L, Pan J–r, Song M, Lu Y–t and Hang T–j (2022) Differences in Multicomponent Pharmacokinetics, Tissue Distribution, and Excretion of Tripterygium Glycosides Tablets in Normal and Adriamycin–Induced Nephrotic Syndrome Rat Models and Correlations With Efficacy and Hepatotoxicity. Front. Pharmacol. 13:910923. doi: 10.3389/fphar.2022.910923
Received: 01 April 2022; Accepted: 06 May 2022;
Published: 09 June 2022.
Edited by:
Jianping Chen, Shenzhen Traditional Chinese Medicine Hospital, ChinaReviewed by:
Dingkun Gui, Shanghai Jiao Tong University, ChinaCopyright © 2022 Wu, Cheng, Boucetta, Xu, Pan, Song, Lu and Hang. This is an open-access article distributed under the terms of the Creative Commons Attribution License (CC BY). The use, distribution or reproduction in other forums is permitted, provided the original author(s) and the copyright owner(s) are credited and that the original publication in this journal is cited, in accordance with accepted academic practice. No use, distribution or reproduction is permitted which does not comply with these terms.
*Correspondence: Yu–ting Lu, bHV5dEBjcHUuZWR1LmNu; Tai–jun Hang, aGFuZ3RqQGNwdS5lZHUuY24=
Disclaimer: All claims expressed in this article are solely those of the authors and do not necessarily represent those of their affiliated organizations, or those of the publisher, the editors and the reviewers. Any product that may be evaluated in this article or claim that may be made by its manufacturer is not guaranteed or endorsed by the publisher.
Research integrity at Frontiers
Learn more about the work of our research integrity team to safeguard the quality of each article we publish.