 Zhenpeng Zhu1
 Zhenchuan Lei2Jinqin Qian1Cuijian Zhang1
 Yanqing Gong1Guicao Yin1
 Yifan Li1*
 Xuesong Li1
 Jian Lin1*
 Liqun Zhou1
- 1National Urological Cancer Center, Department of Urology, Institute of Urology, Clinical Research Cooperation Network of Urology of the Peking University First Hospital, The Peking University First Hospital, Peking University, Beijing and the Affiliated Hospital of Yangzhou University, Yangzhou University, Yangzhou, China
- 2School of Biomedical Sciences, Heart and Vascular Institute and Li Ka Shing Institute of Health Sciences, The Chinese University of Hong Kong, Hong Kong, China
Background: Early detection and precise prognostic evaluation of clear cell renal cell carcinoma (ccRCC) are crucial for patient life expectancy. Ion channel-related genes (ICRGs) are of great diagnostic and prognostic value as components that maintain the normal structure of the kidney. Therefore, we systematically explored the diagnostic, prognostic, and therapeutic value of ICRGs in ccRCC using the multi-database.
Methods: RNA transcriptome profiles and clinical data of ccRCC patients were extracted and integrated from public databases including The Cancer Genome Atlas, ICGC, GEO, and E-MTAB databases. Ion channel-related genes were obtained from the literature collection. The diagnostic signature was performed using the LASSO and SVM-REF analyses. Meanwhile, the prognostic signature was conducted using the LASSO analyses. Molecular subtyping was performed using the ConsensusClusterPlus and the corresponding therapeutic targets were evaluated using the pRRophetic package. In addition, a prognostic nomogram was constructed based on the results of cox regression analyses.
Results: We successfully constructed diagnostic signatures for five ICRGs and prognostic signatures for 10 ICRGs with AUC values greater than 0.7, showing good predictive performance. Based on the median risk score, we found that high-risk patients had a significantly worse prognosis. We also divided ccRCC patients into two clusters according to prognostic ICRGs, and there was a significant survival outcome between the two clusters and different sensitivity to diverse clinical therapeutic strategies. Meanwhile, we constructed a nomogram based on clinical molecules and signatures, and its predictive efficacy was better than the signature or the present tumor-node-metastasis staging system.
Conclusion: In this study, we established useful signatures for early detection, prognosis evaluation, and individualized treatment for ccRCC. Moreover, KCNJ16 deserves to be explored comprehensively in the future.
Introduction
As the major histological subtype of renal cell carcinoma (RCC), clear cell renal cell carcinoma (ccRCC) is one of the common genitourinary tumors with high morbidity and mortality rate, accounting for 2% of the global cancer burden (Turajlic et al., 2018; Siegel et al., 2021). Patients with ccRCC diagnosed at an early stage are often intended for a preferred outcome, while once metastasis occurs, their survival expectation decreased significantly (Cohen and McGovern 2005). In clinical practice, medical imaging is the primary tool for diagnosing, yet it has little effect on early-stage ccRCC. Moreover, it seems insufficient to predict outcomes of ccRCC by tumor-node-metastasis (TNM) staging alone (Barata and Rini 2017). Hence, early detection of ccRCC and proper assessment of its prognosis remains a challenge for urologists.
As an important site for ion exchange in the body, the kidney is dotted with numerous ion channels. Ion channels play vital roles in substance metabolism, signal transmission, and energy exchanging. In many kidney diseases, alterations in ion channels influence the disease processes (Devuyst 2018; Sudarikova et al., 2021). During the development of kidney cancer, the destruction of a large number of kidney units leads to alterations in ion channels. Meanwhile, multiple ion channels are disrupted and altered during the development of ccRCC (Cecconi and Jäättelä 2014; Moosavi and Elham 2020; Li et al., 2020). Therefore, exploring the alteration of ion channels in the development of ccRCC may facilitate the diagnosis and evaluation and the corresponding treatment.
This study used multi-omics databases to screen and validate ion channel-related genes’ (ICRGs) diagnostic and prognostic roles. We successfully developed corresponding diagnostic and prognostic signatures, and both signatures showed good predictive performances. Furthermore, we molecularly subtyped the samples in TCGA and explored the effects of immunotherapy and drugs on ccRCC patients with two clusters. In conclusion, our study was the first to explore the impact of ICRGs on the diagnosis, prediction, and individualized treatment of ccRCC.
Materials and Methods
Data Collection and Processing
The mRNA transcriptomic profile and corresponding clinical data of ccRCC samples were downloaded from The Cancer Genome Atlas (TCGA), including 72 normal controls and 539 cancer samples. The detailed information of patients’ information has been showed in the Table 1. Duplicate samples and those with an overall survival time of fewer than 30 days were excluded. Later, when building the LASSO regression model, we retained TCGA samples containing both RNA-seq profiles and survival data for analysis. We installed a 3:2 ratio to randomly group these samples as the training cohort (n = 315) and internal validation cohort (n = 208). Furthermore, expression profiling and clinical information on the validation cohorts were downloaded from the ICGC and E-MTAB databases. All data were processed through R (version 4.0.3) and converted to FPKM value format. In addition, we obtained eight ccRCC datasets from the GEO database, transformed the data to the Z score, and validated the expression levels of KNCJ16. We built an outline diagram for the whole process of the study (Figure 1).

TABLE 1. Clinical information of 530 ccRCC patients.
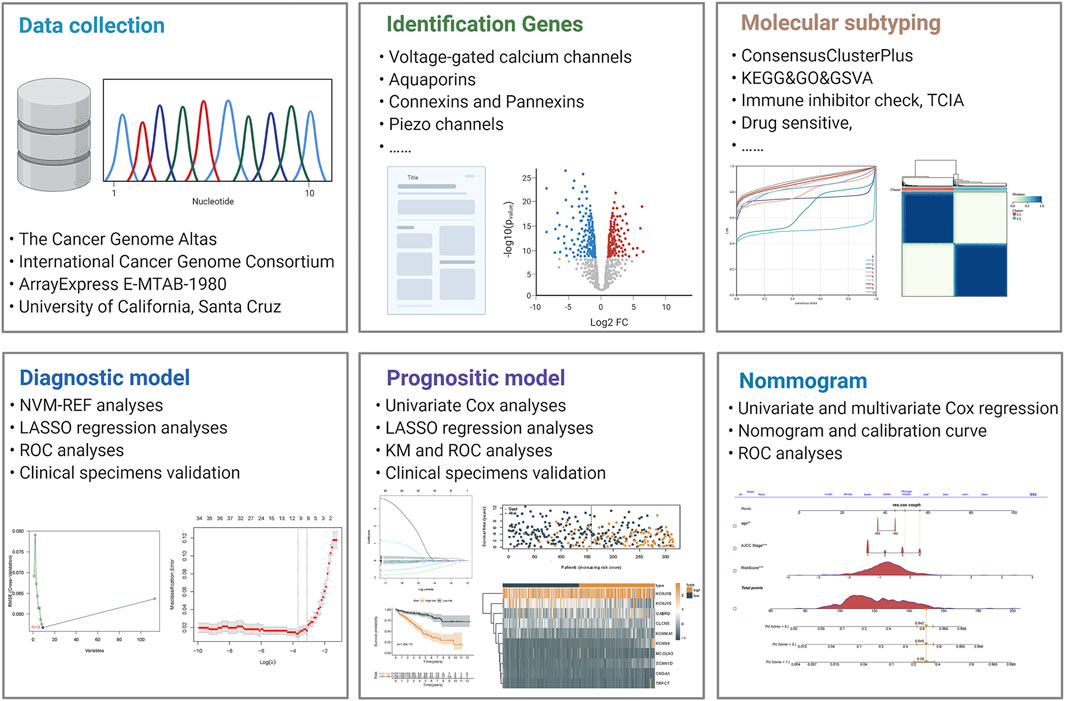
FIGURE 1. Graphical outline diagram of the entire process of this study.
Identification of Differentially Expressed and Prognostic Ion Channel-Related Genes
We first screened and documented ion channel-related genes (ICRGs) through an extensive literature review. The detailed list of the ICRGs is given in Supplementary Table S1. The differentially expressed genes (DEGs) between tumor and normal samples were screened using R studio’s “Limma” package. |Log2FC| > 1, p < 0.05, and false discovery rate (FDR) < 0.05 were set as the cutoffs for the DEGs in both TCGA and ICGC cohorts. An interaction network between the DEGs was mapped by GeneMANIA website (Warde-Farley et al., 2010). The DEGs that were significant in both cohorts were used for subsequent analysis. Univariate Cox regression was used to identify the prognostic ICRGs. Genes with a p-value less than .05 in Cox regression were identified as prognostic genes for further LASSO regression analysis.
Construction and Validation of the Diagnostic Signature
Based on the previously obtained DEGs, we used both the least absolute shrinkage and selection operator (LASSO) and support vector machine recursive feature elimination (SVM-REF) to identify diagnostic models in ccRCC and normal tissues (Xia et al., 2020). The genes obtained by the two methods were taken as intersections and validated with ROC curves. The expression of intersecting differential genes in ccRCC and normal tissues was also explored in the Human Protein Atlas (HPA) database.
Molecular Subtyping and Therapeutic Prediction
To subtype patients and thus proceed with individualized treatment, we performed molecular subtyping of patients in TCGA based on prognostic ICRGs using the ConsensusClusterPlus package (Wilkerson and Hayes 2010). The RNA matrix was calculated using the k-means algorithm on a fraction of probes (0.8) with 1,000 repeats. Meanwhile, unsupervised clustering and corresponding representative figures were generated with the ggplot2 package (Ito and Murphy 2013). Then, a single-sample Gene Set Enrichment Analysis (ssGSEA) was performed to identify immune cell infiltration between the two clusters. The potential molecular enrichment of the two clusters was annotated with the ClueGO plugin (Bindea et al., 2009). The pRRophetic algorithm was performed to calculate the half-maximal inhibitory concentration (IC50) of chemotherapeutic drugs in clusters (Geeleher et al., 2014). At the same time, we applied The Cancer Immunome Atlas (TCIA) database to observe the response to immunotherapy between the two clusters.
Gene Pathway Enrichment Analyses
The pathway enrichment analyses were conducted using the ClusterProfiler packages to explore the potential functions, and the Gene Ontology (GO) and Kyoto Encyclopedia of Genes and Genomes (KEGG) were chosen as the background databases (Yu et al., 2012). The Gene Ontology (GO) analysis identified biological processes (BPs), molecular functions (MFs), and cell components (CCs) enriched for each set of genes.
Construction and Validation of the Prognostic Signature
To assess the value of ICRGs as a guide to the prognosis of ccRCC, we first divided the samples in TCGA into a training and validation set on a 3:2 basis while employing the E-MTAB-1980 database as an external validation set. Furthermore, we trained the prognostic ICRGs on LASSO with maxit = 1,000 and constructed a 10-gene prognostic model. ROC curves and K–M survival plots were condemned to assess the predictive value of prognostic models using survival and time ROC packages.
Establishment of the ICRG-Based Nomogram
To better assess clinical prognosis and provide timely intervention, we combined risk scores and clinical parameters to construct the nomogram. The “rms” package was used to establish the nomogram of multivariable models for 1-, 3-, and 5-year OS prediction. Furthermore, the calibration curve was carried out for the constructed nomogram, and the discriminative performance is quantified using the area under the curve (AUC).
Statistical Analysis
In the results of this study, continuous variables are described by mean ± S.D, while categorical variables are characterized by frequency (n) and proportion (%). Univariate and multivariate Cox regression analyses were used to detect independent factors. The survival analysis evaluated the correlation between the characteristics and overall survival by LASSO regression models. Kaplan–Meier survival curves and time-dependent ROC curves were drawn and compared among subgroups. In addition, statistical analyses were performed using R version 4.0.3 and GraphPad 9.0. A p-value of less than .05 was considered statistically significant.
Results
Identification of Differentially Expressed Ion Channel-Related Genes
The expression levels of ICRGs were analyzed between ccRCC and normal samples in both TCGA and ICGC databases with a p-value < 0.05 and absolute log2FoldChange >1. The volcano plot exhibited the DEGs in TCGA and identified the five most significantly up- and downregulated genes (Figure 2A). Afterward, we considered 113 genes altered considerably in both datasets as DEGs in ccRCC (Figure 2B). Subsequently, to understand the correlation between these differential genes, we constructed a gene interaction network by GENEMANIA (Figure 2C). The interaction network demonstrated a variety of potential connections between DEGs, including potential interaction links such as co-expression and co-localization. Then, the GO enrichment analysis showed an enrichment of GO terms indicative of functional maturation, such as ion transport or ion channel composition, which is consistent with the function of these ICGRs (Figure 2D). In addition, the analysis based on KEGG pathways identified several significant enrichments, such as nicotine addiction and the calcium signaling pathway (Figure 2E).
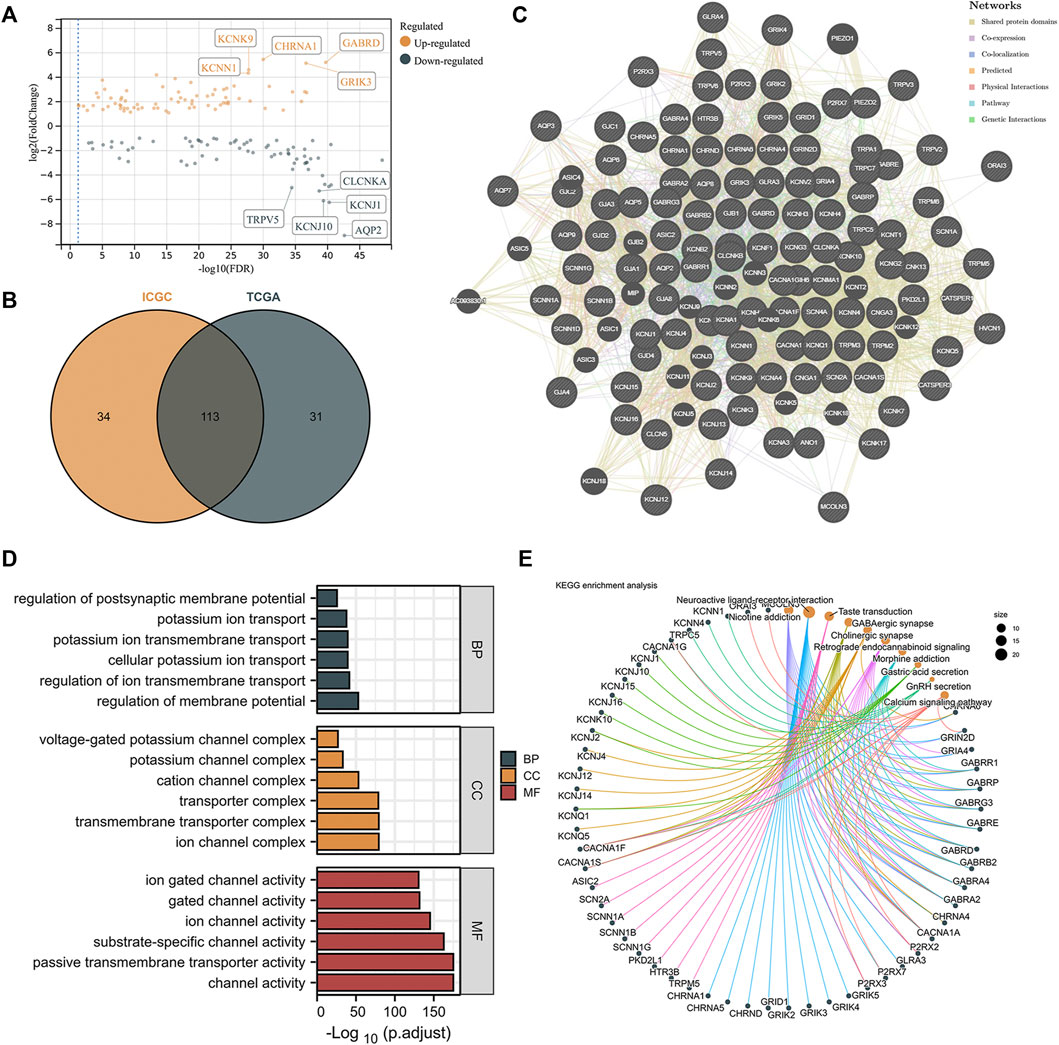
FIGURE 2. Identification and functional enrichment of differentially expressed ICRGs. (A) Volcano map on differentially expressed ICRGs in TCGA cohort. The five most significant up- and downregulated genes were labeled separately. (B) VENN plots of the same differential genes in ICGC and TCGA databases. (C) PPI network created by GeneMANIA showing the interactions of the ICRGs. (D) Bar plot for GO pathways in TCGA cohort (the longer bar means the more significantly enrichment). (E) Circle diagram of the KEGG pathway analysis (larger pathway point size indicates more IRCGs are included).
Construction and Validation of the Diagnostic Signature
The DEGs were obtained and their potential associations and enriched pathways were analyzed. Next, we explored whether ICRGs could be used as a diagnostic model to determine ccRCC. We screened 10 and nine ICRGs by LASSO regression and SVM-REF analyses, respectively (Figures 3A, B). We then selected the intersecting genes of the two methods as diagnostically relevant genes, which were KCNJ1, KCNJ10, KCNJ16, TRPV6, and GABRA2 (Figure 3C). Subsequently, we evaluated the predictive diagnostic value of these five ICRGs by AUC values in TCGA and ICGC databases, and the results showed a good predictive value in ccRCC or RCC (Figures 3D, E). Subsequently, we explored the protein expression levels of these genes in the HPA database. It could be seen that KCNJ1, KCNJ10, KCNJ16, and TPRV6 expression levels were all significantly upregulated in normal tissues compared with tumor tissues and distributed in different normal tissue structures (Figure 3F). Due to the lack of relevant IHC staining for GABRA2 in the database, the IHC image of GABRA2 has not been exhibited. Corresponding informations has been changed in the manuscript too.
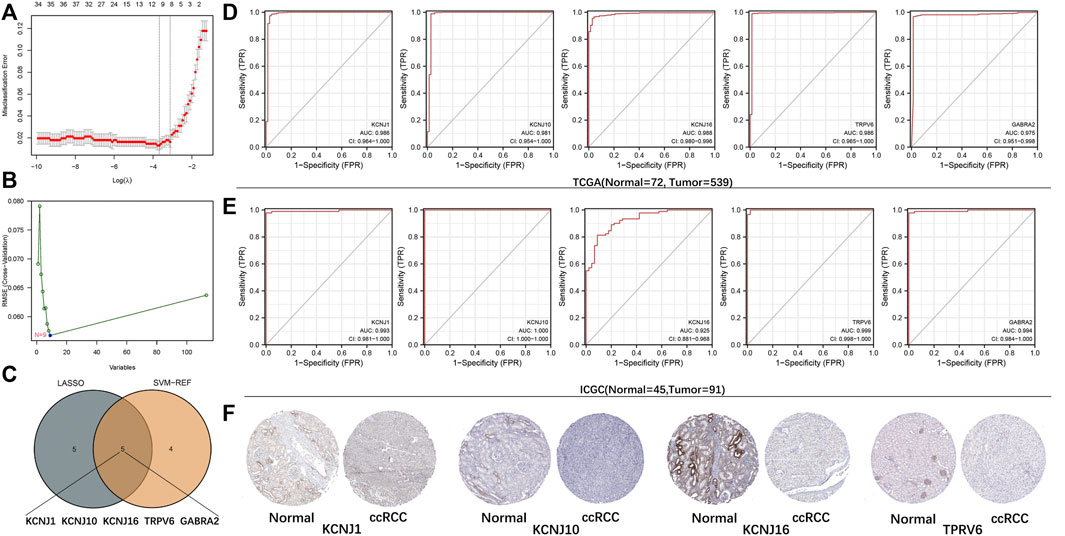
FIGURE 3. Establishment and validation of the diagnostic signature based on ICRGs. (A) LASSO regression to identify signature genes in ccRCC and normal samples. (B) SVM-REF approach to identify signature genes in ccRCC and normal samples. (C) Venn diagram based on the intersection of the two algorithms with five genes. (D) ROC curves of five signature genes for predicting the diagnostic value in TCGA cohort. (E) ROC curves of five signature genes for predicting the diagnostic value in the ICGC cohort. (F) Expression trends of four signature genes (except for GABRA2) were observed in protein expression data based on the HPA database.
Molecular Subtyping and Therapeutic Target Screening
Molecular subtyping could provide insights into tumor biology for potential therapeutic targets. So, in this section, we explored whether ICRGs could be used in molecular subtyping for ccRCC patients. First, by performing the Univariate Cox analysis, we screened out 33 ICRGs significantly associated with OS and defined them as prognostic ICGRs. The mRNA expression level of 33 prognostic ICRGs between ccRCC and normal samples was exhibited (Figure 4A). We then conducted the ConsensusClusterPlus package and identified two clusters (C1 and C2), according to the consensus distribution function plot (Figures 4B, C). Principal component analysis (PCA) showed good separation between the two classifications and the survival showed a worse prognosis for patients in C2 than in C1. We then drew a heatmap of the composite clinical information based on the clusters. The gene expression differences between the two clusters and the corresponding clinical grading and staging distribution can be apparently shown (Figure 4E).
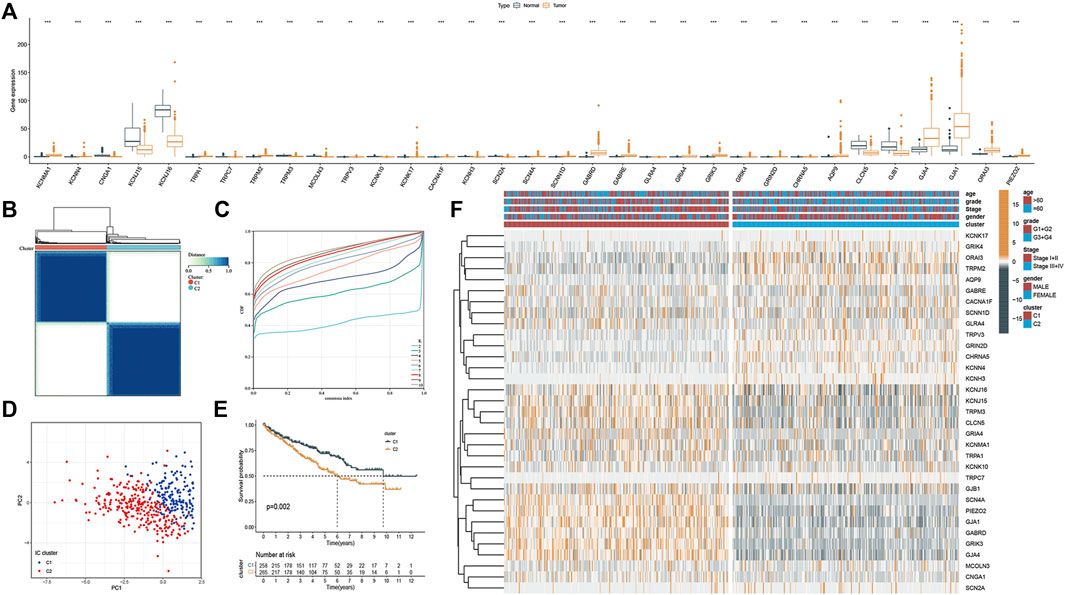
FIGURE 4. Molecular subtyping based on the ICRGs in TCGA cohort. (A) Box plot of the 33 DEGs between tumor and normal samples. (B) Total of 374 ccRCC patients were identified into two clusters according to the consensus clustering matrix (k = 2). (C) Relative changes in the area under the CDF curve by group number (MaxK = 10). (D) Principal component analysis on the two clusters based on the 33 DEGs. (E) Kaplan–Meier survival curves for the two clusters (p = 0.002). (F) Heatmap and the clinical parameters of the two clusters established by 33 DEGs (the more yellow the color, the higher the level of gene expression. The bluer the color, the lower the level of gene expression.).
Phenotypic Differences Between Clusters and Potential Individualized Treatment
To explore potential features between the two clusters, we identified gene expression differences between the clusters by using the limma package and performed functional enrichment using the ClueGO plugin. We found that patients in cluster one were significantly associated with connexin complex, nicotine addiction, and positive regulation of potassium ion transmembrane transport, while patients in cluster two were significantly correlated with TRP channels (Figure 5A). Subsequently, we explored the sensitivity of the two clusters to drugs commonly used in clinically advanced ccRCC by pRRophetic. The results showed that the patients in cluster1 were more sensitive to Axitinib and Cytarabine, while the patients in cluster 2 were more sensitive to the remaining four drugs (Figure 5B). Subsequently, differences in immune cell infiltration were explored between our two clusters. Immune cell infiltration was more abundant in cluster 2 (Figure 5C). Also, we explored the responsiveness to immunotherapy in the TCIA database. More patients in cluster two were PD-1 positive or PD-1/CTLA-4 double positive and may have benefited more from immunotherapy (Figure 5D).
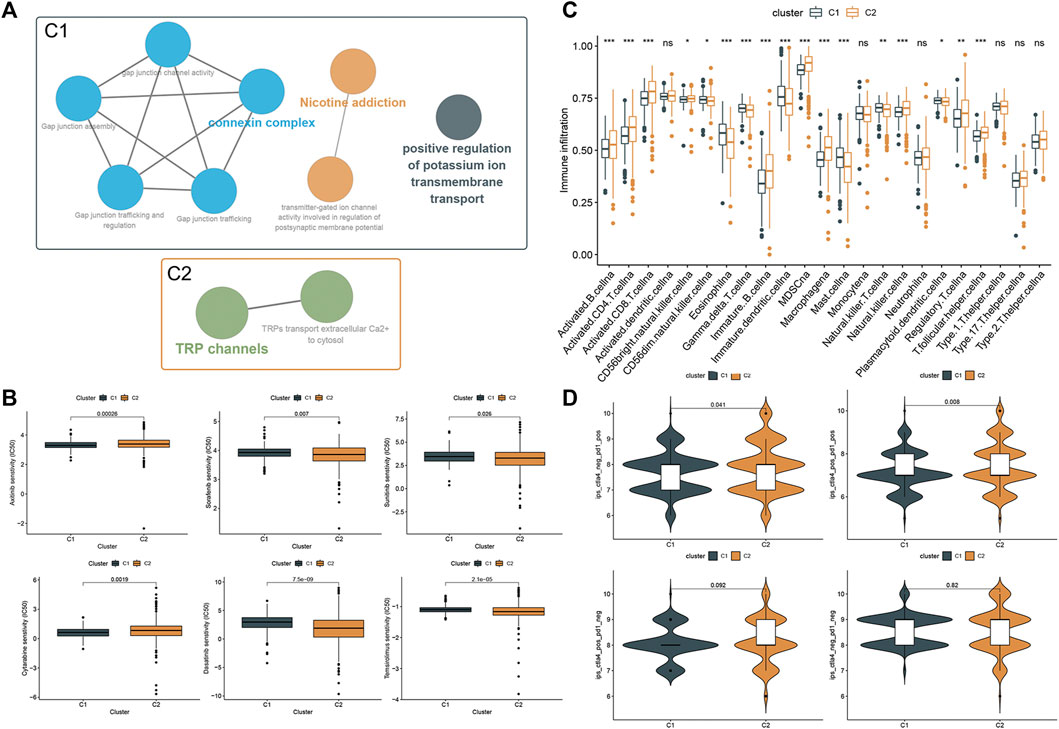
FIGURE 5. Phenotypic differences between clusters and potential individualized treatment. (A) Biological functional annotation of differentially expressed genes between two clusters. (B) Drug sensitivity of commonly clinically used drugs for advanced ccRCC between clusters. (C) Differential analysis of immune cell infiltration between the two clusters using the ssGSEA method. (D) Relationship between differences in PD-1 and CTLA-4 responsiveness between the two groups, based on the TCIA database.
Construction and Validation of the Prognostic Signature
Based on the aforementioned prognostic ICRGs, we further evaluated the prognostic value of ICRGs in ccRCC patients. The model coefficients were solved by LASSO regression (Figure 6A, B). The detailed information on the ICRGs from the signature is shown in Table 2. The risk score is constructed according to the following formula mentioned in the Methods section. Based on the calculated median risk score cut-off, patients were divided into high- and low-risk groups. Furthermore, the Kaplan–Meier log-rank test and the time-dependent ROC curve were used to evaluate the predictive ability and accuracy of the prognostic signature. The outcome of the Kaplan–Meier log-rank test showed that the high-risk group had a significantly worse OS compared with the low-risk group in TCGA training set (Figure 6C), TCGA validation set (Supplementary Figure S1A), and E-MTAB validation set (Supplementary Figure S1C). Meanwhile, the time-dependent ROC curve proved the 1-, 3-, and 5-year predictive accuracy of the signature for OS (Figure 6D; Supplementary Figures S1B, D). In addition, the risk score distribution, survival status, and expression of ICRGs from the signatures are exhibited in TCGA training set, TCGA validation set, and E-MTAB validation set (Figure 6E; Supplementary Figures S1E, F).
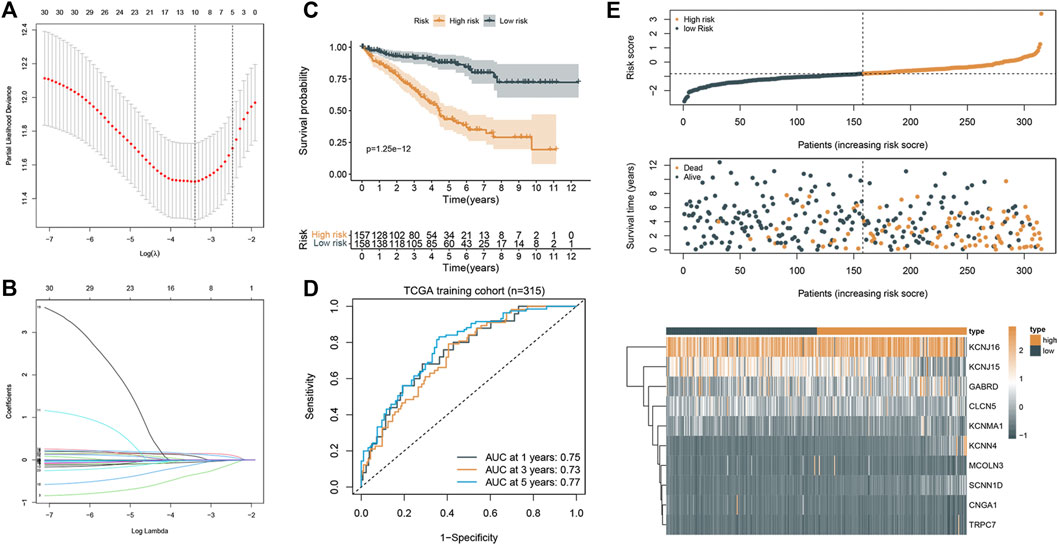
FIGURE 6. Construction and validation of the prognostic signature. (A) Cross-validation of the parameter selection in the LASSO regression. (B) LASSO regression of the 10 ICRGs related to the OS. (C) Kaplan–Meier survival curves between high- and low-risk groups (p < 0.001). (D) ROC curves of the prognostic signature for predicting 1-year, 3-year, and 5-year OS in TCGA cohort. (E) Signature gene expression patterns and the distribution of survival status and risk score in TCGA training cohort.
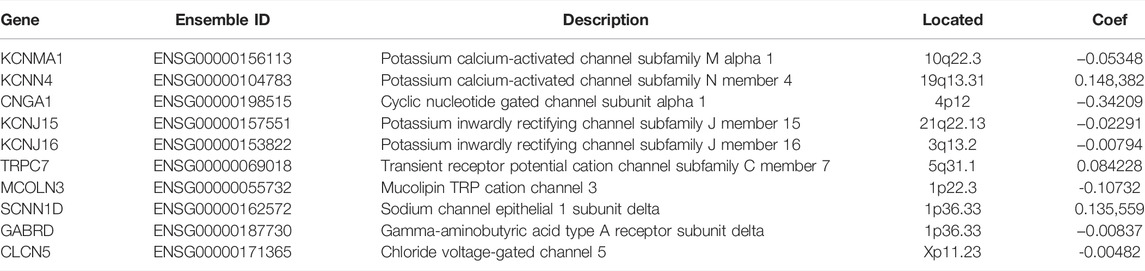
TABLE 2. Detailed information of the ICRGs in the prognostic signature.
Construction and Validation of the Nomogram
To better predict the prognosis of patients, we combined clinical factors and risk signatures to construct the nomogram. Univariate Cox regression analysis was performed to screen out the significant factors with OS (Figure 7A). Afterward, multivariate Cox regression analysis showed that the AJCC stage, age, and risk score could be the independent factors for OS of ccRCC patients (Table 3). Combining the risk score and clinical parameters, we established the nomogram with a C-index of 0.774 (Figure 7B). Then, we performed the calibration curves to verify the predictive efficacy of the nomogram for 1-, 3-, and 5-year OS (Figure 7C). We also performed ROC curves, and the AUC values indicated that the predictive efficacy of the nomogram was significantly better than that of the present AJCC stage or ISUP grade and the prognostic signature alone (Figure 7D).
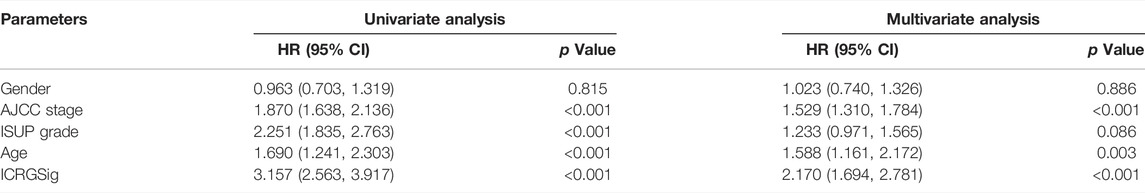
TABLE 3. Univariate and multivariate Cox analyses of clinical parameters and risk signatures.
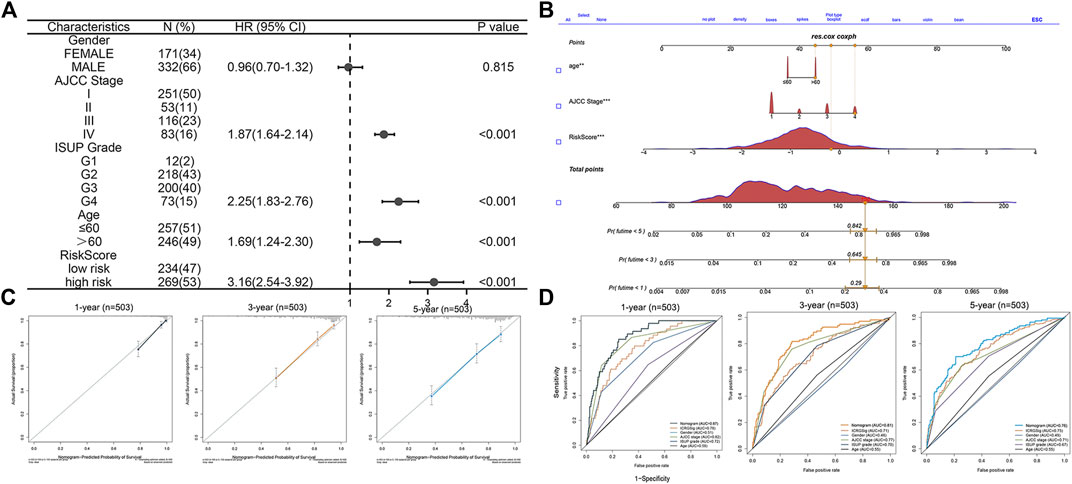
FIGURE 7. Construction and validation of the prognostic nomogram. (A) Forest plot of the significant clinical parameters in the univariate Cox regression. (B) Nomogram based on the significant clinical parameters and risk signatures. (C) Calibration curves of the nomogram for 1-, 3-, and 5-year survival prediction. (D) Predictive value of the nomogram, risk signature, and clinical parameters.
Further Exploration of the KCNJ16 Gene
We then analyzed the KNCJ16 gene, an ICRG that we had previously derived to be significant in both diagnostic and predictive models. First, we found that the KCNJ16 expression level was significantly altered in a variety of cancers by pan-cancer analysis, using the SangerBox and was more apparent in ccRCC (Figure 8A). We then compared the expression levels of KCNJ16 in cancer and normal tissues in eight GEO databases and found that the expression levels of KNCJ16 were significantly upregulated in normal tissues (Figure 8B). Based on the aforementioned results, we wanted to clarify exactly in which structure of the kidney that the KCNJ16 expression levels are upregulated, and we explored this with single-cell data from the HPA database. We found that the KCNJ16 gene was mainly upregulated in the proximal tubular cells and collecting duct cells (Figure 8C). Meanwhile, we screened out the relationship between KNCJ16 and immune cell infiltration using the TIMER database. Consistent with the HPA database, the correlation between KCNJ16, T cells, and B cells was not significant, while mainly affecting macrophage components (Figure 8D). Furthermore, we explored the potential biological functions of KCNJ16. GSEA enrichment analyses showed that high KCNJ16 expression was significantly associated with protein secretion, p53 pathway, and so on (Figure 8E). Meanwhile, GO and KEGG enrichment analyses indicated that KCNJ16 was closely related to the transmembrane transport function and cell structure maintenance (Figure 8F).
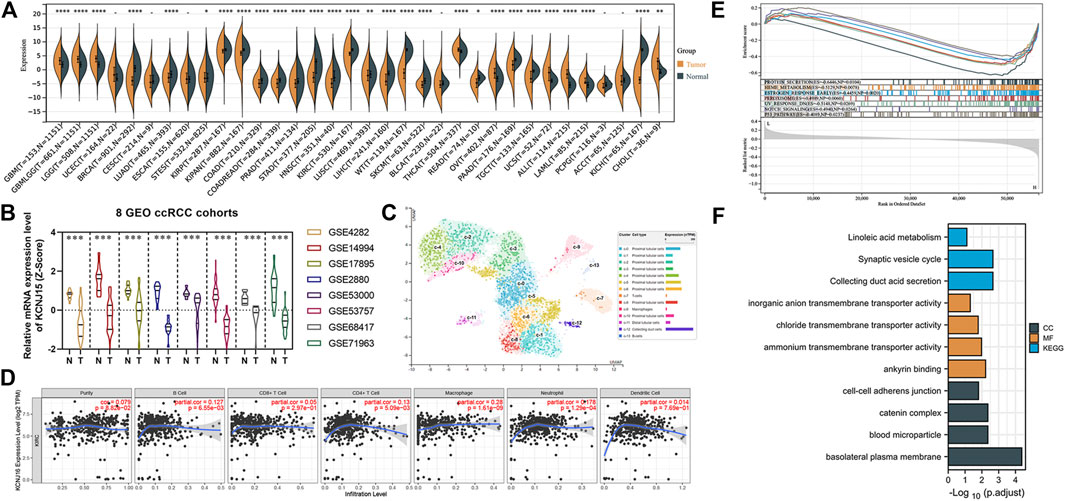
FIGURE 8. Further exploration of the KCNJ16. (A) Pan-cancer analysis of the KCNJ16 mRNA expression among 33 types of cancers. (B) Analysis of eight GEO datasets regarding KCNJ16 expression in ccRCC and normal samples. (C) Single-cell analysis of the KCNJ16 expression in kidney tissues. (D) Association of the KCNJ16 expression level with immune infiltration abundance in ccRCC was evaluated using the TIMER database. (E) Multiple GSEA analysis on potential biological mechanisms between low- and high-risk groups. (F) GO and KEGG enrichment analyses between high- and low-risk groups.
Discussion
Early detection and prognostic evaluation of ccRCC is crucial, however, there were certain shortcomings in either imaging or the tumor-node-metastasis (TNM) staging system at present (Jonasch et al., 2021). Finding suitable biomarkers is of utmost importance. As an important organ for nutrient absorption and substance metabolism, numerous ion channels and corresponding proteins are widely distributed in the kidney (Valinsky et al., 2018; Su et al., 2020). Meanwhile, during the development of ccRCC, the destruction of a large number of normal structures makes ion channels possible detective and prognostic markers of kidney carcinogenesis and progression. Therefore, using the ICRGs for the diagnosis and evaluation of ccRCC might be promising.
Previous reports have shown that ICRGs may play important roles in ccRCC. Some ICRGs have been reported to be aberrantly expressed in ccRCC and were closely correlated with the prognosis of ccRCC patients (Rabjerg et al., 2015; Lkhagvadorj et al., 2016; Xu et al., 2019). TRPM7 can regulate tumor growth by modulating the AKT/FOXO1 axis (Zhao et al., 2018). TRPM3, on the other hand, affects the tumor progression of ccRCC by regulating autophagy (Hall et al., 2014). Interestingly, due to the imbalance between the tumor proliferation rate and oxygen supply, there is widespread hypoxia, and consequently, lactate accumulation in solid tumors. ICRGs can modulate the tumor microenvironment through the action of ion channels, which in turn affects immune cell infiltration and immunotherapy (Gerlinger et al., 2012; Muz et al., 2015; Li et al., 2015). Hence, in this study, we systematically explored the diagnostic and prognostic value of ICRGs through multiple ccRCC databases and established the corresponding signature. Then, we evaluated immune infiltration and potential individualized therapeutic targets by establishing molecular subtyping.
We first screened five ICRGs that were closely associated with the diagnosis of ccRCC by the SVM-REF and LASSO methods. With the exception of GABRA2, the remaining four genes are thought to be markers for certain specificities in normal kidney tissues (Nijenhuis et al., 2003; Welling 2016). Consistent with our previous speculation, the massive destruction of normal tissues during the development of ccRCC leads to abnormal alterations of these marker genes. Detection of the expression of these marker genes might provide a new insight for the diagnosis of ccRCC. Furthermore, previous studies have revealed that Kir5.1 and Kir4.1 potassium channels played important roles in the immune regulation of tuberous sclerosis (Schirmer et al., 2014). In the kidney, the proteins that make up these potassium channels can be used as diagnostic markers, which may be an interesting phenomenon. Subsequently, we screened the ICRGs that were significantly associated with OS by Cox regression and identified them as prognostic ICRGs. We then divided the samples in TCGA into two clusters by consensus clustering, which showed significant differences between the two clusters. We then analyzed immune infiltration and efficacy against immune checkpoint therapy between the two clusters. Patients in C1 might be more sensitive to treatment with PD-1 and CTLA-4. Meanwhile, for the present clinical application of TKIs drugs for the treatment of advanced ccRCC, we explored the sensitivity of patients to these drugs in the two clusters through the GDSC database. We found that C1 patients were more sensitive to Axitinib and Cytarabine, while C2 patients were more sensitive to Sorafenib, Dasatinib, Temsirolimus, and Sunitinib. This difference in sensitivity to drugs can provide some reference for individualized patient treatment.
We then constructed a 10-ICRG-based signature using LASSO regression (KCNMA1, KCNN4, CNGA1, KCNJ15, KCNJ16, TRPC7, MCOLN3, SCNN1D, GABRD, and CLCN5). In addition to showing better predictive performance, most of the genes have shown a close relationship with cancer in previous studies. KCNMA1 has been used as a prognosis-related biomarker in several tumors and is strongly correlated with tumor metastasis and calcium channels (Khaitan et al., 2009; Zhang and Yan 2014; Wang et al., 2018). GABRD is widely reported to be closely associated with colon cancer (Niu et al., 2020; Wu et al., 2020). KCNJ15 has been closely related to potassium channels and identified as a molecular marker by investigators in ccRCC (Liu et al., 2019; Zhang J. et al., 2021). Furthermore, we also focused on exploring KCNJ16, which was significant in both diagnostic and prognostic signatures. Previous studies have shown that KCNJ16 is a component protein of the Kir5.1 potassium channel, which regulates pH and responds to hypoxia in vivo. Interestingly, KCNJ16 is highly expressed in the renal tubule and collecting duct system, and renal clear cell carcinoma occurs in these sites (Zhang Y. et al., 2021). This indicated that KCNJ16 expression played an important role in the development of ccRCC. Moreover, the TIMER database shows a high correlation between KCNJ16 and macrophage infiltration. Previous studies suggested that the activation of potassium channels could affect the immune function of macrophages via NLRP3 (Drinkall et al., 2022). In contrast, macrophages can reshape the tumor microenvironment of ccRCC and thus influence tumor immunity (Koh et al., 2021; Dong et al., 2022). There might be some important associations between KCJN16 regulation of potassium channels and macrophages affecting tumor immunity. However, its role in ccRCC remains to be explored.
There are some shortcomings in this study. First of all, our study is based on various published databases, and it was difficult to completely eliminate these effects because of batch effects and differences between the databases. Second, our sample size is still small, which inevitably constrained the prediction performance because of the limitation of sample size when performing model training and validation. Finally, some of the genes we identified need further validation in vitro and in vivo, such as KCNJ16.
Conclusion
In conclusion, we were the first to systematically elucidate the diagnostic and prognostic value of ICRGs. Through prognostic ICRGs, molecular subtyping and drug sensitivity exploration was performed for patients in different clusters. In this study, we established useful signatures for early detection, prognosis evaluation, and individualized treatment for ccRCC.
Data Availability Statement
The original contributions presented in the study are included in the article/Supplementary Material; further inquiries can be directed to the corresponding author.
Author Contributions
LZ, XL, YL, and JL contributed to the study design. ZZ, JQ, CZ, YG, and YL contributed to data collection. ZZ and CY performed statistical analysis and interpretation. ZZ and ZL drafted the manuscript. All authors contributed to the critical revision of the final manuscript and approved the final version.
Funding
This study was funded by the National Natural Science Foundation of China (82070704, 82002675), Clinical Medicine Plus X-Young Scholars Project, Peking University (PKU2021LCXQ026), Jiangsu Natural Science Research of Colleges and Universities-General Project (20KJB320014), Jiangsu Science and Technology Program-Youth Fund Project (BK2020938), Yangzhou Key Research and Development-Social Development Project (YZ2020110), Yangzhou Soft Science Research Program (YZ2020258), Jiangsu Postdoctoral Research Funding Program (2020Z268), and Yangzhou University High-level Talent Research Start-up Fund (2019LYF).
Conflict of Interest
The authors declare that the research was conducted in the absence of any commercial or financial relationships that could be construed as a potential conflict of interest.
Publisher’s Note
All claims expressed in this article are solely those of the authors and do not necessarily represent those of their affiliated organizations, or those of the publisher, the editors, and the reviewers. Any product that may be evaluated in this article, or claim that may be made by its manufacturer, is not guaranteed or endorsed by the publisher.
Supplementary Material
The Supplementary Material for this article can be found online at: https://www.frontiersin.org/articles/10.3389/fphar.2022.889142/full#supplementary-material
References
Barata, P. C., and Rini, B. I. (2017). Treatment of Renal Cell Carcinoma: Current Status and Future Directions. CA Cancer J. Clin. 67 (6), 507–524. doi:10.3322/caac.21411
Bindea, G., Mlecnik, B., Hackl, H., Charoentong, P., Tosolini, M., Kirilovsky, A., et al. (2009). ClueGO: a Cytoscape Plug-In to Decipher Functionally Grouped Gene Ontology and Pathway Annotation Networks. Bioinformatics 25 (8), 1091–1093. doi:10.1093/bioinformatics/btp101
Cecconi, F., and Jäättelä, M. (2014). Targeting Ions-Induced Autophagy in Cancer. Cancer Cell 26 (5), 599–600. doi:10.1016/j.ccell.2014.10.014
Cohen, H. T., and McGovern, F. J. (2005). Renal-cell Carcinoma. N. Engl. J. Med. 353 (23), 2477–2490. doi:10.1056/NEJMra043172
Devuyst, O. (2018). Genetics of Kidney Diseases in 2017: Unveiling the Genetic Architecture of Kidney Disease. Nat. Rev. Nephrol. 14 (2), 80–82. doi:10.1038/nrneph.2017.177
Dong, K., Chen, W., Pan, X., Wang, H., Sun, Y., Qian, C., et al. (2022). FCER1G Positively Relates to Macrophage Infiltration in Clear Cell Renal Cell Carcinoma and Contributes to Unfavorable Prognosis by Regulating Tumor Immunity. BMC Cancer 22 (1), 140. doi:10.1186/s12885-022-09251-7
Drinkall, S., Lawrence, C. B., Ossola, B., Russell, S., Bender, C., Brice, N. B., et al. (2022). The Two Pore Potassium Channel THIK ‐1 Regulates NLRP3 Inflammasome Activation. Glia 70, 1301–1316. doi:10.1002/glia.24174
Geeleher, P., Cox, N., and Huang, R. S. (2014). pRRophetic: an R Package for Prediction of Clinical Chemotherapeutic Response from Tumor Gene Expression Levels. PloS one 9 (9), e107468. doi:10.1371/journal.pone.0107468
Gerlinger, M., Santos, C. R., Spencer-Dene, B., Martinez, P., Endesfelder, D., Burrell, R. A., et al. (2012). Genome-wide RNA Interference Analysis of Renal Carcinoma Survival Regulators Identifies MCT4 as a Warburg Effect Metabolic Target. J. Pathol. 227 (2), 146–156. doi:10.1002/path.4006
Hall, D. P., Cost, N. G., Hegde, S., Kellner, E., Mikhaylova, O., Stratton, Y., et al. (2014). TRPM3 and miR-204 Establish a Regulatory Circuit that Controls Oncogenic Autophagy in Clear Cell Renal Cell Carcinoma. Cancer Cell 26 (5), 738–753. doi:10.1016/j.ccell.2014.09.015
Ito, K., and Murphy, D. (2013). Application of Ggplot2 to Pharmacometric Graphics. CPT Pharmacometrics Syst. Pharmacol. 2, e79. doi:10.1038/psp.2013.56
Jonasch, E., Walker, C. L., and Rathmell, W. K. (2021). Clear Cell Renal Cell Carcinoma Ontogeny and Mechanisms of Lethality. Nat. Rev. Nephrol. 17 (4), 245–261. doi:10.1038/s41581-020-00359-2
Khaitan, D., Sankpal, U. T., Weksler, B., Meister, E. A., Romero, I. A., Couraud, P. O., et al. (2009). Role of KCNMA1 Gene in Breast Cancer Invasion and Metastasis to Brain. BMC cancer 9, 258. doi:10.1186/1471-2407-9-258
Koh, M. Y., Sayegh, N., and Agarwal, N. (2021). Seeing the Forest for the Trees-Single-Cell Atlases Link CD8+ T Cells and Macrophages to Disease Progression and Treatment Response in Kidney Cancer. Cancer Cell 39 (5), 594–596. doi:10.1016/j.ccell.2021.03.008
Li, W., Yang, F. Q., Sun, C. M., Huang, J. H., Zhang, H. M., Li, X., et al. (2020). circPRRC2A Promotes Angiogenesis and Metastasis through Epithelial-Mesenchymal Transition and Upregulates TRPM3 in Renal Cell Carcinoma. Theranostics 10 (10), 4395–4409. doi:10.7150/thno.43239
Li, Y., Xu, G., Huang, K., Wang, J., Zhang, J., Liu, J., et al. (2015). Alteration of ASIC1 Expression in Clear Cell Renal Cell Carcinoma. Onco Targets Ther. 8, 2121–2127. doi:10.2147/OTT.S86927
Liu, Y., Wang, H., Ni, B., Zhang, J., Li, S., Huang, Y., et al. (2019). Loss of KCNJ15 Expression Promotes Malignant Phenotypes and Correlates with Poor Prognosis in Renal Carcinoma. Cancer Manag. Res. 11, 1211–1220. doi:10.2147/CMAR.S184368
Lkhagvadorj, S., Kim, J. H., Oh, S. S., Lee, M. R., Jung, J. H., Chung, H. C., et al. (2016). Orai1 Expression Is Closely Related with Favorable Prognostic Factors in Clear Cell Renal Cell Carcinoma. J. Korean Med. Sci. 31 (6), 879–885. doi:10.3346/jkms.2016.31.6.879
Moosavi, M. S., and Elham, Y. (2020). Aquaporins 1, 3 and 5 in Different Tumors, Their Expression, Prognosis Value and Role as New Therapeutic Targets. Pathol. Oncol. Res. 26 (2), 615–625. doi:10.1007/s12253-019-00646-9
Muz, B., de la Puente, P., Azab, F., and Azab, A. K. (2015). The Role of Hypoxia in Cancer Progression, Angiogenesis, Metastasis, and Resistance to Therapy. Hypoxia (Auckl) 3, 83–92. doi:10.2147/HP.S93413
Nijenhuis, T., Hoenderop, J. G., van der Kemp, A. W., and Bindels, R. J. (2003). Localization and Regulation of the Epithelial Ca2+ Channel TRPV6 in the Kidney. J. Am. Soc. Nephrol. 14 (11), 2731–2740. doi:10.1097/01.asn.0000094081.78893.e8
Niu, G., Deng, L., Zhang, X., Hu, Z., Han, S., Xu, K., et al. (2020). GABRD Promotes Progression and Predicts Poor Prognosis in Colorectal Cancer. Open Med. Wars. Pol. 15 (1), 1172–1183. doi:10.1515/med-2020-0128
Rabjerg, M., Oliván-Viguera, A., Hansen, L. K., Jensen, L., Sevelsted-Møller, L., Walter, S., et al. (2015). High Expression of KCa3.1 in Patients with Clear Cell Renal Carcinoma Predicts High Metastatic Risk and Poor Survival. PloS one 10 (4), e0122992. doi:10.1371/journal.pone.0122992
Schirmer, L., Srivastava, R., Kalluri, S. R., Böttinger, S., Herwerth, M., Carassiti, D., et al. (2014). Differential Loss of KIR4.1 Immunoreactivity in Multiple Sclerosis Lesions. Ann. Neurol. 75 (6), 810–828. doi:10.1002/ana.24168
Siegel, R. L., Miller, K. D., Fuchs, H. E., and Jemal, A. (2021). Cancer Statistics, 2021. CA A Cancer J. Clin. 71 (1), 7–33. doi:10.3322/caac.21654
Su, W., Cao, R., Zhang, X. Y., and Guan, Y. (2020). Aquaporins in the Kidney: Physiology and Pathophysiology. Am. J. Physiol. Ren. Physiol. 318 (1), F193–F203. doi:10.1152/ajprenal.00304.2019
Sudarikova, A. V., Vasileva, V. Y., Sultanova, R. F., and Ilatovskaya, D. V. (2021). Recent Advances in Understanding Ion Transport Mechanisms in Polycystic Kidney Disease. Clin. Sci. (Lond) 135 (21), 2521–2540. doi:10.1042/CS20210370
Turajlic, S., Swanton, C., and Boshoff, C. (2018). Kidney Cancer: The Next Decade. J. Exp. Med. 215 (10), 2477–2479. doi:10.1084/jem.20181617
Valinsky, W. C., Touyz, R. M., and Shrier., A. (2018). Aldosterone, SGK1, and Ion Channels in the Kidney. Clin. Sci. (Lond) 132 (2), 173–183. doi:10.1042/CS20171525
Wang, F., Chen, Q., Huang, G., Guo, X., Li, N., Li, Y., et al. (2018). BKCa Participates in E2 Inducing Endometrial Adenocarcinoma by Activating MEK/ERK Pathway. BMC cancer 18 (1), 1128. doi:10.1186/s12885-018-5027-9
Warde-Farley, D., Donaldson, S. L., Comes, O., Zuberi, K., Badrawi, R., Chao, P., et al. (2010). The GeneMANIA Prediction Server: Biological Network Integration for Gene Prioritization and Predicting Gene Function. Nucleic acids Res. 38, W214–W220. doi:10.1093/nar/gkq537
Welling, P. A. (2016). Roles and Regulation of Renal K Channels. Annu. Rev. Physiol. 78, 415–435. doi:10.1146/annurev-physiol-021115-105423
Wilkerson, M. D., and Hayes, D. N. (2010). ConsensusClusterPlus: a Class Discovery Tool with Confidence Assessments and Item Tracking. Bioinformatics 26 (12), 1572–1573. doi:10.1093/bioinformatics/btq170
Wu, M., Kim, K. Y., Park, W. C., Ryu, H. S., Choi, S. C., Kim, M. S., et al. (2020). Enhanced Expression of GABRD Predicts Poor Prognosis in Patients with Colon Adenocarcinoma. Transl. Oncol. 13 (12), 100861. doi:10.1016/j.tranon.2020.100861
Xia, J., Sun, L., Xu, S., Xiang, Q., Zhao, J., Xiong, W., et al. (2020). A Model Using Support Vector Machines Recursive Feature Elimination (SVM-RFE) Algorithm to Classify whether COPD Patients Have Been Continuously Managed According to GOLD Guidelines. Int. J. Chron. Obstruct Pulmon Dis. 15, 2779–2786. doi:10.2147/COPD.S271237
Xu, W. H., Shi, S. N., Xu, Y., Wang, J., Wang, H. K., Cao, D. L., et al. (2019). Prognostic Implications of Aquaporin 9 Expression in Clear Cell Renal Cell Carcinoma. J. Transl. Med. 17 (1), 363. doi:10.1186/s12967-019-2113-y
Yu, G., Wang, L. G., Han, Y., and He, Q. Y. (2012). clusterProfiler: an R Package for Comparing Biological Themes Among Gene Clusters. OMICS 16 (5), 284–287. doi:10.1089/omi.2011.0118
Zhang, J., and Yan., J. (2014). Regulation of BK Channels by Auxiliary γ Subunits. Front. Physiol. 5, 401. doi:10.3389/fphys.2014.00401
Zhang, J., Han, J., Li, L., Zhang, Q., Feng, Y., Jiang, Y., et al. (2021). Inwardly Rectifying Potassium Channel 5.1: Structure, Function, and Possible Roles in Diseases. Genes & Dis. 8 (3), 272–278. doi:10.1016/j.gendis.2020.03.006
Zhang, Y., Narayanan, S. P., Mannan, R., Raskind, G., Wang, X., Vats, P., et al. (2021). Single-cell Analyses of Renal Cell Cancers Reveal Insights into Tumor Microenvironment, Cell of Origin, and Therapy Response. Proc. Natl. Acad. Sci. U.S.A. 118 (24). doi:10.1073/pnas.2103240118
Keywords: clear cell renal cell carcinoma, ion channel-related genes, prognosis, diagnosis, nomogram
Citation: Zhu Z, Lei Z, Qian J, Zhang C, Gong Y, Yin G, Li Y, Li X, Lin J and Zhou L (2022) The Ion Channel-Related Gene Signatures Correlated With Diagnosis, Prognosis, and Individualized Treatment in Patients With Clear Cell Renal Cell Carcinoma. Front. Pharmacol. 13:889142. doi: 10.3389/fphar.2022.889142
Received: 08 March 2022; Accepted: 06 May 2022;
Published: 01 June 2022.
Edited by:
Shaogang Wang, Huazhong University of Science and Technology, ChinaReviewed by:
Qi-Dong Xia, Huazhong University of Science and Technology, ChinaTianxin Lin, Sun Yat-sen Memorial Hospital, China
Copyright © 2022 Zhu, Lei, Qian, Zhang, Gong, Yin, Li, Li, Lin and Zhou. This is an open-access article distributed under the terms of the Creative Commons Attribution License (CC BY). The use, distribution or reproduction in other forums is permitted, provided the original author(s) and the copyright owner(s) are credited and that the original publication in this journal is cited, in accordance with accepted academic practice. No use, distribution or reproduction is permitted which does not comply with these terms.
*Correspondence: Yifan Li, eWZsaUBiam11LmVkdS5jbg==; Jian Lin, bGluamlhbmJqQDE2My5jb20=