
95% of researchers rate our articles as excellent or good
Learn more about the work of our research integrity team to safeguard the quality of each article we publish.
Find out more
ORIGINAL RESEARCH article
Front. Pharmacol. , 17 May 2022
Sec. Ethnopharmacology
Volume 13 - 2022 | https://doi.org/10.3389/fphar.2022.865586
This article is part of the Research Topic Development, Assessment, Improvement, and Standardization of Methods in Herbal Drug Research View all 12 articles
 Jianping Hu1
 Dan Wu1,2Yanping Sun1Hongquan Zhao1Yangyang Wang1Wensen Zhang1Fazhi Su1Bingyou Yang1Qiuhong Wang3*
 Haixue Kuang1*
Eleutherococcus senticosus (Rupr. & Maxim.) Maxim. leaves (ESL) have long been people’s favorite as a natural edible green vegetable, in which phenols and saponins are the main characteristic and bioactive components. This study was first carried out to comprehensively analyze the phenols and saponins in ESL, including phytochemical, qualitative, quantitative, and bioactivity analysis. The results showed that 30 compounds, including 20 phenolic compounds and 7 saponins, were identified. Twelve of them were isolated from Eleutherococcus Maxim. for the first time. In the qualitative analysis, 30 phenolic compounds and 28 saponins were accurately detected. Their characteristic cleavage processes were described by UPLC-QTOF-MS/MS. Ten representative ingredients were quantitated in 29 different regions via a 4000 QTRAP triple quadrupole tandem mass spectrometer (UPLC-QTRAP-MS/MS), and it was found that S19 (69.89 ± 1.098 mg/g) and S1 (74.28 ± 0.733 mg/g) had the highest contents of total phenols and saponins, respectively. The newly developed analysis method for the quantitative determination was validated for linearity, precision, and limits of detection and quantification, which could be applied to the quality assessment of ESL. In vitro experiment, the α-glucosidase inhibitory effect of the phenolic fraction was higher than others, indicating that the phenolic content may be related to the hypoglycemic activity. It was also suggested that ESL could be developed as a natural potential effective drug or functional food.
Eleutherococcus senticosus (Rupr. & Maxim.) Maxim. (syn. Acanthopanax senticosus (Rupr. & Maxim.) Harms, http://www.theplantlist.org), a perennial herb belonging to the Araliaceae family, is mainly distributed in Russia, China, Korea, and Japan, especially in Heilongjiang, Jilin, and Liaoning provinces of the northeast of China (Jia et al., 2021). Eleutherococcus senticosus (ES), also called Acanthopanax senticosus, Siberian ginseng, or Ciwujia, known as a famous adaptogen—a herbal medicine that has a non-specific inter-system anti-stress effect throughout the human body (Panossian et al., 2021), first appeared in the Pharmacopoeia of the Union of Soviet Socialist Republics (USSR) as a medicinal plant in 1962. ES was approved by monographed in Russian State Pharmacopoeia (Shikov et al., 2021) and to treat symptoms of asthenia by the European Medicines Agency (EMA), its efficacy has been proved in clinical trials (Gerontakos et al., 2021). According to Chinese Pharmacopoeia, ES is efficient in invigorating the kidney and liver, replenishing the vital essence, and calming the mind (Committee, 2020). Modern pharmacological studies have shown that it tends to stimulate immunity, prevent diseases caused by stress, and treat diseases of the cardio-cerebrovascular system (Kim et al., 2010; Liang et al., 2010; Meng et al., 2018; Xie et al., 2015). While, as a delicious renewable green vegetable and functional tea, ESL is also deeply concerned and loved by the Chinese.
Until now, most phytochemical studies have focused on the isolation and identification from ES and demonstrated that it commonly contains saponins, flavonoids, phenylpropanoids, and polysaccharides (Yang et al., 2012; Han et al., 2016; Lau et al., 2019). A few studies have currently been conducted on phenolic constituents and saponins from ESL. The intake of natural phenolic and saponin substances has considerable health benefits, especially for cardiovascular diseases, metabolic diseases, and tumors (Costa et al., 2017; Dong et al., 2019; Singh et al., 2020; Zlab et al., 2020). As the main components in ESL, phenols and saponins possess beneficial effects in vivo and in vitro, such as anti-cancer (Hayakawa et al., 2020), antiviral (Yan et al., 2018), antibacterial (Lee et al., 2003; Zhou et al., 2017), antioxidative (Tosovic et al., 2017), and inhibitory activities on nitrite production (Lee et al., 2008), and are considered as important active constituents. However, the overall analysis of the composition and content of phenols and saponins in ESL has not been reported. This study mainly investigates the composition analysis, structure cracking law, and quality evaluation of phenols and saponins of ESL (Figure 1).
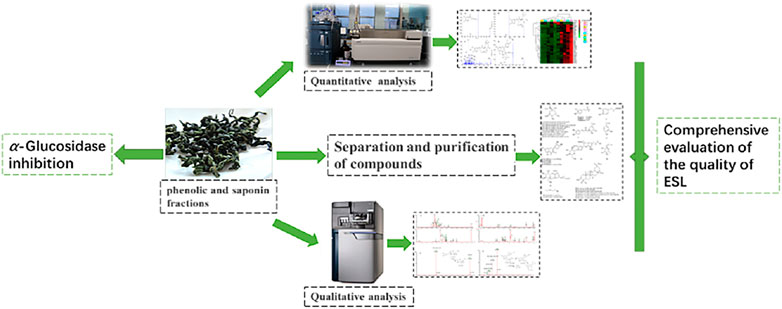
FIGURE 1. The brief route of experimental research.
Due to the diversity, similarity, and complexity of chemical structures, the analysis of compounds becomes a great challenge. Liquid chromatography-electrospray ionization tandem mass spectrometry (LC-MS/MS) is a powerful tool for analyzing compounds (Wang et al., 2016). Because MS can provide the information of molecular formula and fragmentation ions, researchers have identified 42 phenolic compounds in 15 min and 131 ginsenosides in 10 min by an LC-MS/MS method (Wang et al., 2016; Ren et al., 2020), which proved to be an efficient and rapid method for the characterization of compounds. Normally, the long analytical time and low sensitivity are not convenient to rapidly qualify the chemical substances in ESL. To rapidly clarify and analyze the basic chemical substances of ESL, in this study, a new rapid and sensitive ultra-high-performance liquid chromatography-triple quadrupole tandem mass spectrometry (UPLC-MS/MS) method for the thorough detection of major or trace components was firstly established to characterize and quantify phenols and saponins of ESL. Moreover, a total of 30 monomers were isolated, of which 12 compounds (1–4, 9, 10, 12, 14, 19, 21–23) were obtained from Eleutherococcus Maxim. for the first time and 10 compounds, including five phenols and five saponins, were used for quantitative analysis of ESL. This newly developed qualitative and quantitative method based on UPLC-MS/MS could be applied to the quality assessment of ESL. Furthermore, we also firstly compared the α-glucosidase inhibitory effect of four different active fractions of ESL in vitro. Overall, this study enriches the material basis of ESL to some extent and provides a standard reference for its further rational development and utilization.
The dried ESL were collected in December 2019, Changbai Mountain, Jilin province, and identified by professor Zhenyue Wang of the School of Pharmacy, Chinese Medicine Resources Center, Heilongjiang University of Chinese Medicine.
Ten reference standards of phenols and saponins, including protocatechuic acid (13), chlorogenic acid (7), methyl 5-O-feruloylquinate (3), hyperoside (15), rutin (18), 3-O-α-L-rhamnopyranosyl-(1→2)-α-L-arabinopyranoside-29-hydroxy oleanolic acid (24), 3-O-β-D-glucopyranosyl-(1→2)-α-L-arabinopyranoside-29-hydroxy oleanolic acid (26), ciwujianoside C4 (28), saponin PE (29), and ciwujianoside K (30) were isolated from ESL in our previous research. Their chemical structures were determined by 1D, 2D NMR spectra, and MS. The purities of all standards were above 98.0%, as elucidated by an HPLC-ELSD method. MS spectra were acquired using a Waters Synapt G2-SI Accurate-Mass Q-TOF (Waters Corp., Milford, MA, United States) and 4000 QTRAP LC/MS system (AB SCIEX, Framingham, United States). 1H-NMR (600 MHz) and 13C-NMR (150 MHz) data were obtained by a Bruker DPX-600 Spectrometer (Switzerland, Germany). Silica gel (200–300 mesh, Qingdao Haiyang Co., China) and ODS resin (YMC Co., Japan) were used in liquid column chromatography. The preparative HPLC column was a Diamonsil® C18 (5 µm, 10*250 mm) column (DiKMA Co., China). An ACQUITY UPLC HSS T3 column (1.8 μm, 2.1*100 mm, Waters, United States) was used to perform LC-MS analysis. LC-MS grade acetonitrile and formic acid were purchased from Thermo Fisher Scientific (Waltham, United States). Water for UPLC was purified by a Milli-Q water purification system (Darmstadt, Germany). Other reagents and solvents were of analytical grades.
The dried ESL (5.0 kg) were extracted with 70% ethanol (2 h, three times) under reflux. After recovering ethanol under reduced pressure, the concentrated extract of 2.006 kg (40%) was obtained. The extract was suspended with 12 L water and then successively extracted with petroleum ether and water-saturated n-butanol in a 1:1 volume ratio to obtain the n-butanol extract. The partial n-butanol layer was subjected to PH 2-3 (337.0 g) and eluted by AB-8 macroporous adsorption resin with 30% ethanol solvent to obtain phenolic fraction (96.4 g). In the other part, the saponin fraction (109.1 g) was yielded by elution AB-8 macroporous resin in 60% ethanol.
The above phenolic fraction (61.0 g) was chromatographed on a silica gel (200–300 mesh) column (8*150 cm), with CH2Cl2-MeOH (10:1, 5:1, 3:1, 2:1, 1:1, 0:1) as the eluent to produce 10 fractions (Fr.1–Fr.10) followed by TLC analysis. Fr.1 was then subjected to a reversed-phase ODS column, eluted with a mixture of MeOH (20–60%). After repeated elution of MeOH (30%, 38%, 40%) in semi-preparative HPLC chromatography, compounds 4 (9.15 mg), 7 (9.61 mg), 12 (8.32 mg), 13 (27.8 mg), and 21 (5.5 mg) were obtained. Compounds 1 (15.84 mg), 2 (80.64 mg), and 3 (33.6 mg) were obtained from Fr.2 by repeated chromatography on Diamonsil® C18 (5 μm, 10*250 mm) column using methanol (30%, 35%) as the eluent. After repeated elution with MeOH (40%), compounds 5 (8.19 mg), 6 (76.92 mg), 8 (11.01 mg), 11 (12.63 mg), and 14 (9.7 mg) obtained from Fr.4. Fr.5, Fr.7, and Fr.8 were purified and recrystallized with MeOH (36%, 40%) to obtain compounds 9 (7.11 mg), 10 (52.69 mg), 15 (23.8 mg), 16 (5.3 mg), and 17 (11.0 mg); compounds 18 (13.35 mg), 19 (10.1 mg), and 20 (7.49 mg); and compounds 22 (3.2 mg) and 23 (5.4 mg). In the same way as above, seven fractions Fr.11–Fr.17 were obtained from the saponin fraction (60.0 g) with TLC identified. The ODS column was applied to elute Fr.15, Fr.16, and Fr.17 with 20%–90% MeOH, further separated and purified by the C18 column, eluted with 70% and 80% MeOH solvent, followed by recrystallization to yield compounds 24 (6.61 mg), 25 (15.0 mg), 26 (11.4 mg), 27 (15.4 mg), 28 (16.7 mg), 29 (9.8 mg), and 30 (12.13 mg). The isolated compounds 1–30 were identified by a combination of 1D, 2D-NMR, MS data, and relevant literature.
ESL from 29 different places was pulverized into powder (40 mesh). The powder (1.0 g) was accurately weighed and suspended in 20 ml MeOH and ultrasonically extracted for 30 min (40 kHz, 500 W, two times). The combined filtrate was evaporated to dryness using a rotary evaporator at 40°C. The residue was dissolved in 5 ml of MeOH. The 10 quantitative reference compounds were dissolved in MeOH and stored at 4°C until analysis. A series of mixed solutions were obtained by diluting the original solutions of these 10 compounds with MeOH. The solutions were prior filtered through a 0.22 μm syringe filter and then quantitatively analyzed.
An ACQUITY UPLC (Waters, Milford, United States) system in tandem with a QTOF Synapt G2-SI mass spectrometer (Waters, Milford, United States) was acquired for qualitative analysis using an ACQUITY UPLC HSS T3 column (1.8 μm, 2.1*100 mm, Waters, Milford, United States). The chromatography separation was carried out at an ambient temperature of 35°C. The gradient of the eluent mobile phase included acetonitrile with 0.1% formic acid (A), and water with 0.1% formic acid (B): 0–1 min, 2% A; 1–3 min, 2%–10% A; 3–5 min, 10%–20% A; 5–9 min, 20%–55% A; 9–13 min, 55%–70% A; 13–19 min, 70%–80% A; 19–22 min, 80%–98% A; 22–22.5 min, 98%–2% A; 22.5–23 min, 2% A. The flow rate was set at 0.3 ml/min, with a 2 µL injection volume. The MS parameters were optimized as follows: scan type: positive and negative, acquire Mse over the range 100–1,300 Da; scan time: 0.25 s, collision energy: 20–35 V, cone voltage: 40 V.
The quantitation analysis was done via an ACQUITY UPLC (Waters Corp., Milford, MA, United States) system tandem 4000 QTRAP mass spectrometer (AB SCIEX, Framingham, United States) with the ACQUITY UPLC HSS T3 column (1.8 μm, 2.1*100 mm, Waters, Milford, United States).
The column temperature was 35°C. The mobile phase was the same as in the qualitative analysis. Isocratic elution was performed as follows: 0–0.5 min, 2%–30% A; 0.5–1 min, 30%–40% A; 1–1.5 min, 40%–55% A; 1.5–3.5 min, 55%–75% A; 3.5–4.5 min, 75%–98% A; 4.5–5.0 min, 98%–98% A. The flow rate was 0.4 ml/min, with 2 µL injection volume. Detection was performed in the negative electrospray ionization mode (ESI−) in the Multiple reaction monitoring (MRM). The MS parameters were optimized as follows: TEM: 550°C, curtain gas: 10 psi, IonSpray Voltage: −4500 V, and ion source gas 1 and 2: 55 psi.
The α-glucosidase inhibition activity of all extracts was determined as previously described with minor modifications (Zhang et al., 2017). The solutions of 20 μL different fractions and 60 μL phosphate buffer (67 mM, PH 6.8) containing 20 μL intestinal α-glucosidase solution were pre-incubated at 37°C for 5 min. Then, 8 μL PNPG (116 mM) was added to each well. The reaction mixture was incubated at 37°C for 30 min. The absorbance of the mixture was measured at 405 nm before and after incubation. Acarbose was used as the positive control. The inhibitory rate (IR) was calculated as follows:
In the qualitative and quantitative analysis of ESL, desirable chromatographic separation was yielded by optimizing the column types [Waters ACQUITY UPLC HSS T3 column (1.8 μm, 2.1*100 mm)], the gradient elution procedure, the flow rate (0.3 ml/min and 0.4 ml/min, respectively), and the temperature (35°C). The mobile phase consisting of A (0.1% formic acid aqueous solution) and B (0.1% formic acid acetonitrile solution) was employed to perform gradient elution. All MS spectrometry parameters were optimized to achieve high sensitivity of phenols and saponins. Under the optimized parameters and conditions, 58 compounds were quickly identified (Figure 2). Their characteristic cleavage fragments were shown in Table 1. The optimized parameters, including declustering potential (DP), collision energy (CE) and ion pairs (Figure 3) of the standard compounds in the quantitative analysis were listed in Table 2.
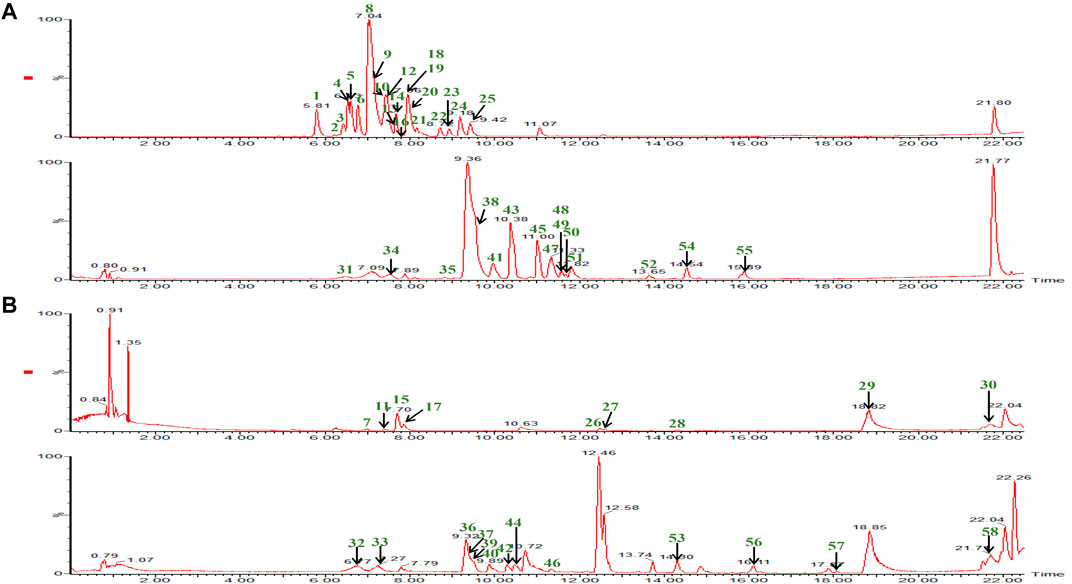
FIGURE 2. The BPI chromatograms of 58 compounds in phenolic and saponin fractions were detected at positive ion mode (B) and negative ion mode (A). The phenolic fraction consists of the upper part of the (A) and (B) diagram. The remaining part is the saponin fraction.

TABLE 1. Characterization of compounds in phenolic and saponin fractions by UPLC-MS/MS.
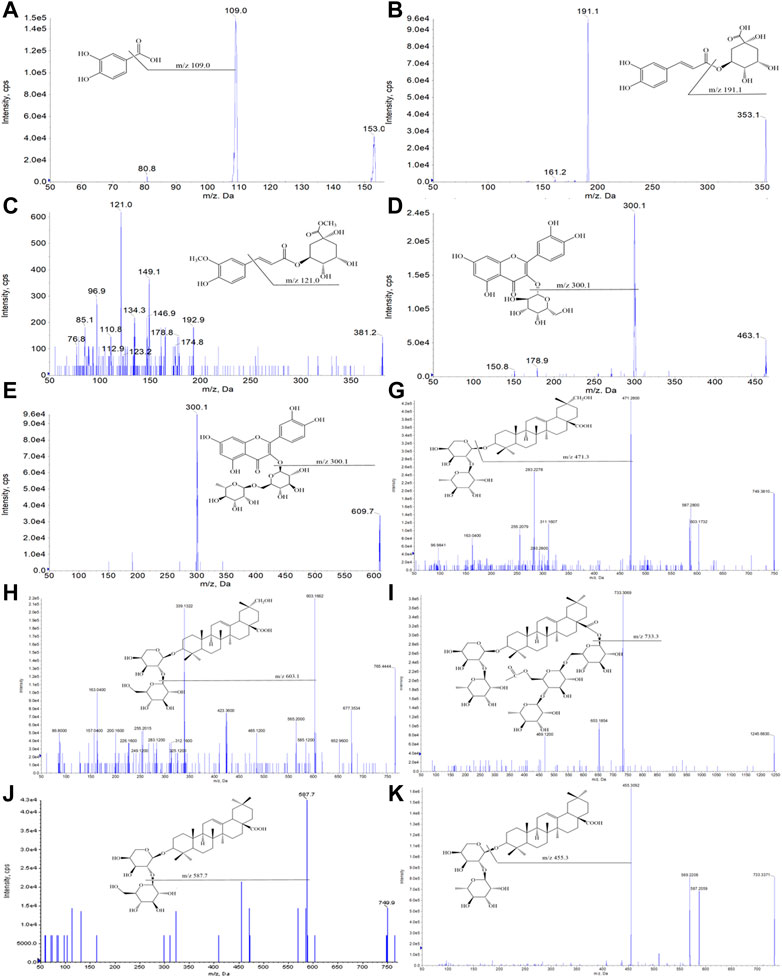
FIGURE 3. Optimized ion pair diagrams of 10 reference compounds by the 4000 QTRAP mass spectrometry: the process of selecting the best sub-ion (Q3) according to the parent ion (Q1) of the 10 compounds.
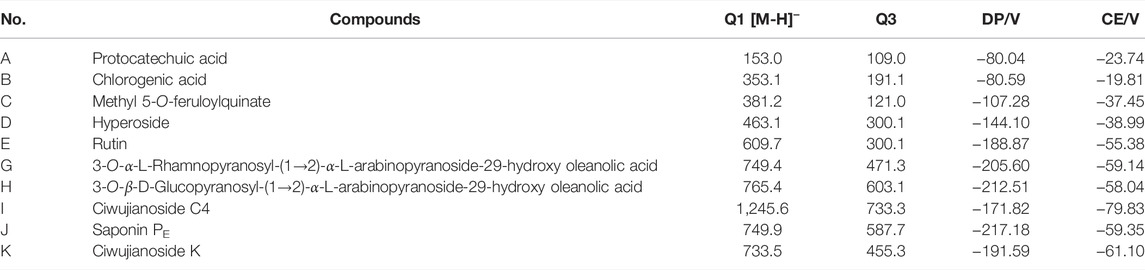
TABLE 2. The selective ion-pair, DP, and CE of 10 reference compounds.
Thirty compounds (chemical structures shown in Figure 4) include 20 phenols, 7 saponins, and 3 glycosides, of which 12 compounds (1–4, 9, 10, 12, 14, 19, 21–23) were isolated from Eleutherococcus Maxim. for the first time using a combination of chromatographic methods. The compounds were identified based on extensive NMR and MS data and comparison to published literature data when available.
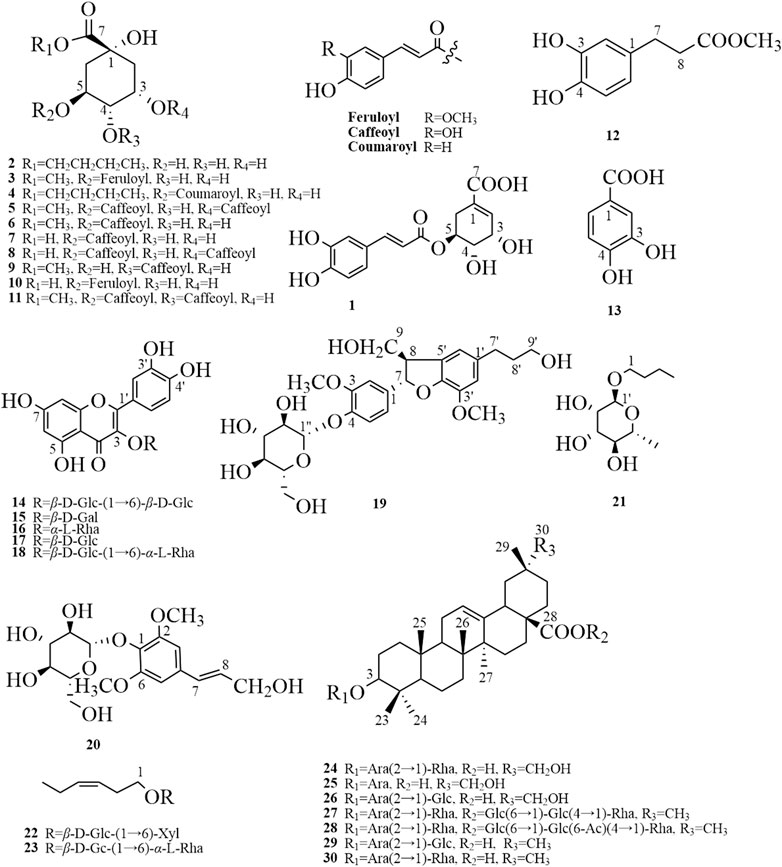
FIGURE 4. The chemical structures of 30 compounds were isolated and identified from phenolic and saponin fractions. 5-O-Caffeoylshikimic acid (1), quinic acid butyl ester (2), methyl 5-O-feruloylquinate (3), 5-O-p-coumaroylquinic acid butyl ester (4), methyl 3,5-di-O-caffeoyl quinate (5), methyl chlorogenate (6), chlorogenic acid (7), 3,5-di-O-caffeoylquinic acid (8), 4-O-caffeoylquinic acid methyl ester (9), 5-O-feruloylquinic acid (10), methyl 3,4-di-O-caffeoyl quinate (11), 3,4-dihydroxybenzenepropionic acid methyl ester (12), protocatechuic acid (13), quercetin 3-O-β-D-glucopyranosyl-(1→6)-β-D-glucopyranoside (14), hyperoside (15), quercitrin (16), quercetin 3-O-β-D-glucopyranoside (17), rutin (18), (7S, 8R)-urolignoside (19), syringin (20), n-butyl-1-O-α-L-rhamnopyranoside (21), (Z)-Hex-3-en-1-ol O-β-D-xylopyranosyl-(1″-6′)-β-D-glucopyranoside (22), hexenyl-rutinoside (23), 3-O-β-L-rhamnopyranosyl-(1→2)-α-L-arabinopyranoside-29-hydroxy oleanolic acid (24), 3-O-α-arabinopyranoside 29-hydroxy oleanolic acid (25), 3-O-α-D-glucopyranosyl-(1→2)-α-L-arabinopyranoside-29-hydroxy oleanolic acid (26), hederasaponin B (27), ciwujianoside C4 (28), saponin PE (29), and ciwujianoside K (30).
The isolated compounds 1–30 (chemical structures shown in Figure 4) were identified by a combination of 1D, 2D-NMR, and MS data. Compounds 1–4, 9, 10, 12, 14, 19, and 21–23 were obtained from Eleutherococcus Maxim. for the first time, and their NMR data were provided here.
Yellow amorphous powder: (−) HR-ESI-MS, m/z 335.0748 [M-H]−, calculated for molecular formula C16H16O8. 1H NMR (600 MHz, CD3OD): δ 7.56 (1H, d, J = 15.9 Hz,H-7′), 7.04 (1H, d, J = 2.1 Hz, H-2′), 6.95 (1H, dd, J = 8.2, 2.1 Hz, H-6′), 6.86 (1H, brs, H-2), 6.78 (1H, d, J = 8.2 Hz, H-5′), 6.28 (1H, d, J = 15.9 Hz, H-8′), 5.25 (1H m, H-5), 4.41(1H, brs, H-3), 2.86 (1H, dd, J = 18.4, 5.2 Hz, H-6α), 2.32 (1H, dd, J = 18.4, 5.5 Hz, H-6β). 13C-NMR (150 MHz, CD3OD): δ 130.3 (C-1), 139.0 (C-2), 67.3 (C-3), 70.0 (C-4), 71.4 (C-5), 29.2 (C-6), 169.7 (C-7), 127.7 (C-1′), 115.2 (C-2′), 146.8 (C-3′), 147.3 (C-4′), 116.5 (C-5′), 123.1 (C-6′), 149.7 (C-7′), 115.1 (C-8′), 168.7 (C-9′). The NMR data were consistent with the literature (Wan et al., 2012).
Yellowish amorphous powder: (+) HR-ESI-MS, m/z 248.9876 [M]+, calculated for molecular formula C11H20O6. 1H NMR (600 MHz, CD3OD): δ 2.08 (2H, m, H-2), 4.09 (1H, m, H-3), 3.40(1H, dd, J = 8.8, 3.2 Hz, H-4), 3.99 (1H, m, H-5), 1.85(2H, m, H-6), 4.15 (2H, m, H-8), 1.65(2H, m, H-9), 1.41(2H, m, H-10), 0.96 (3H, t, J = 7.4 Hz, H-11). 13C-NMR (150 MHz, CD3OD): δ 76.9 (C-1), 38.3 (C-2), 71.6 (C-3), 76.8 (C-4), 68.1 (C-5), 42.2 (C-6), 175.6 (C-7), 66.3 (C-8), 31.7 (C-9), 20.1 (C-10), 14.0 (C-11). The NMR data were consistent with the literature (Shi et al., 2014).
Yellow amorphous powder: (−) HR-ESI-MS, m/z 381.2299 [M-H]−, calculated for molecular formula C18H22O9. 1H NMR (600 MHz, CD3OD): δ 2.02,2.12 (each 1H, m, H-2α,β), 4.14(1H, m, H-3), 3.41(1H, dd, J = 8.6,3.2 Hz, H-4), 5.28(1H, m, H-5), 2.09,2.19(each 1H, m, H-6α, β), 4.03 (3H, s, 7-OCH3), 7.04(1H, d, J = 2.1 Hz, H-2′), 3.69(3H, s, 3′-OCH3), 6.78 (1H, d, J = 8.1 Hz, H-5′), 6.95 (1H, dd, J = 8.2, 2.1 Hz, H-6′), 6.22 (1H, d, J = 15.9 Hz, H-7′), 7.53(1H, d, J = 15.9 Hz, H-8′). 13C-NMR (150 MHz, CD3OD): δ 68.2 (C-1), 38.3 (C-2), 76.8 (C-3), 76.6 (C-4), 72.1 (C-5), 38.1 (C-6), 176.0 (C-7), 58.4 (7-OCH3), 123.0 (C-1′), 116.6 (C-2′), 147.2 (C-3′), 52.4 (3′-OCH3), 146.9 (C-4′), 115.1 (C-5′), 127.7 (C-6′), 149.7 (C-7′), 112.8 (C-8′), 168.3 (C-9′). The NMR data were consistent with the literature (Ida et al., 1993).
Light brown amorphous powder: (+) HR-ESI-MS, m/z 789.6702 [2M+H]+, calculated for molecular formula C20H26O8. 1H NMR (600 MHz, CD3OD): δ 2.20(2H, m, H-2α, β), 5.28(1H, m, H-3), 3.73(1H, dd, J = 7.5, 3.2 Hz, H-4),4.15(1H, m, H-5), 2.01 (1H, dd, J = 13.3, 6.5 Hz, H-6α), 2.20 (1H, dd, J = 13.7, 3.3 Hz, H-6β), 7.46(1H, d, J = 8.6 Hz, H-2′), 6.81(1H, d, J = 8.6 Hz, H-3′), 6.81 (1H, d, J = 8.6 Hz, H-5′), 7.46(1H, d, J = 8.6 Hz, H-6′), 7.60 (1H, d, J = 16.0 Hz, H-7′), 6.29(1H, d, J = 15.9 Hz, H-8′), 4.12(2H, m, H-1″), 1.64(2H, m, H-2″), 1.41(2H, m, H-3″), 0.95(3H,t,J = 7.4 Hz, H-4″). 13C-NMR (150 MHz, CD3OD): δ 75.9 (C-1), 35.8 (C-2), 72.2 (C-3), 72.7 (C-4), 70.4 (C-5), 38.1 (C-6), 175.5 (C-7), 127.1 (C-1′), 131.2 (C-2′), 115.9 (C-3′), 161.4 (C-4′), 115.9 (C-5′), 131.2 (C-6′), 145.8 (C-7′), 115.2 (C-8′), 168.3 (C-9′), 66.1 (C-1″), 31.7 (C-2″), 20.1 (C-3″), 14.0 (C-4″). The NMR data were consistent with the literature (Osawa et al., 2001).
White amorphous powder: (+) HR-ESI-MS, m/z 391.1035 [M+Na]+, calculated for molecular formula C17H20O9. 1H NMR (600 MHz, CD3OD): δ 2.07, 2.20 (each 1H, m, H-2α, β), 4.29 (1H, m, H-3), 4.82 (1H, m, H-4), 4.25 (1H, m, H-5), 2.03, 2.19 (each 1H, H-6α, β), 7.63 (1H,d, J = 15.9 Hz, H-7), 7.07 (1H, d, J = 2.1 Hz, H-2′), 6.78 (1H, d, J = 8.2 Hz, H-5′), 6.97 (1H, dd, J = 8.3, 2.1 Hz, H-6′), 7.63 (1H, d, J = 15.9 Hz, H-7′), 6.36 (1H, d, J = 15.9 Hz, H-8′), 3.75 (3H, s, 7-OCH3). 13C-NMR (150 MHz, CD3OD): δ 76.5 (C-1), 42.2 (C-2), 69.1 (C-3), 78.6 (C-4), 65.7 (C-5), 38.5 (C-6), 175.7 (C-7), 53.0 (7-OCH3), 127.9 (C-1′), 115.2 (C-2′), 146.9 (C-3′), 149.6 (C-4′), 116.5 (C-5′), 123.0 (C-6′), 147.2 (C-7′), 115.4 (C-8′), 169.0 (C-9′). The NMR data were consistent with the literature (Chen et al., 2016).
White amorphous powder: (+) HR-ESI-MS, m/z 391.1035 [M+Na]+, calculated for molecular formula C17H20O9. 1H NMR (600 MHz, CD3OD): δ 2.12 (4H, m, H-2, 6), 4.14 (1H, m, H-3), 3.73 (1H, dd, J = 7.5, 3.1 Hz, H-4), 5.28 (1H, m, H-5), 7.04 (1H, d, J = 2.1 Hz, H-2′), 6.78 (1H, d, J = 8.1 Hz, H-5′), 6.95 (1H, dd, J = 8.2, 2.1 Hz, H-6′), 7.53 (1H, d, J = 15.9 Hz, H-7′), 6.22 (1H, d, J = 15.9 Hz, H-8′), 3.69 (3H, s, 3′-OCH3). 13C-NMR (150 MHz, CD3OD): δ 75.8 (C-1), 38.0 (C-2), 72.1 (C-3), 70.3 (C-4), 72.6 (C-5), 37.8 (C-6), 175.5 (C-7), 53.0 (7-OCH3), 127.7 (C-1′), 115.2 (C-2′), 149.7 (C-3′), 146.9 (C-4′), 116.6 (C-5′), 123.0 (C-6′), 147.2 (C-7′), 115.1 (C-8′), 168.3 (C-9′). The NMR data were consistent with the literature (Menozzi-Smarrito et al., 2011).
Yellow oily matter: (−) HR-ESI-MS, m/z 195.0631 [M-H]−, calculated for molecular formula C10H12O4. 1H NMR (600 MHz, CD3OD): δ 6.62 (1H, d, J = 2.1 Hz, H-2), 6.66 (1H, d, J = 8.0 Hz, H-5), 6.50 (1H, dd, J = 8.0, 2.1 Hz, H-6), 2.55 (2H, t, J = 7.6 Hz, H-7), 2.76 (2H, t, J = 7.6 Hz, H-8), 3.63 (3H, s, 9-OCH3). 13C-NMR (150 MHz, CD3OD): δ 133.5 (C-1), 116.4 (C-2), 144.7 (C-3), 146.2 (C-4), 116.4 (C-5), 120.5 (C-6), 31.4 (C-7), 37.1 (C-8), 175.4 (C-9), 52.0 (9-OCH3). The NMR data were consistent with the literature (Meng et al., 2014).
White amorphous powder: (+) HR-ESI-MS, m/z 627.5396 [M+H]+, calculated for molecular formula C27H30O17.1H NMR (600 MHz, CD3OD): δ 6.21 (1H, d, J = 2.1 Hz, H-6), 6.40 (1H, d, J = 2.1 Hz, H-8), 7.84 (1H, d, J = 2.2 Hz, H-2′), 6.87 (1H, d, J = 8.5 Hz, H-5′), 7.59 (1H, dd, J = 8.5, 2.2 Hz, H-6′), 5.25 (1H, d, J = 7.7 Hz, H-1″), 5.17 (1H, d, J = 7.8 Hz, H-1‴). 13C-NMR (150 MHz, CD3OD): δ 158.5 (C-2), 135.8 (C-3), 179.6 (C-4), 163.1 (C-5), 99.9 (C-6), 166.1 (C-7), 94.7 (C-8), 158.8(C-9), 105.6 (C-10),123.0 (C-1′), 117.8 (C-2′), 145.8 (C-3′), 150.0 (C-4′), 116.1 (C-5′), 123.2 (C-6′), 105.4 (C-1″), 75.8 (C-2″), 78.4 (C-3″), 73.2 (C-4″), 77.2 (C-5″), 70.1 (C-6″), 104.3 (C-1‴), 75.1 (C-2‴), 77.2 (C-3‴), 71.3 (C-4‴), 78.2 (C-5‴), 62.0 (C-6‴). The NMR data were consistent with the literature (Zeng et al., 2020).
White amorphous powder: (+) HR-ESI-MS, m/z 545.1989 [M+Na]+, calculated for molecular formula C26H34O11. 1H NMR (600 MHz, CD3OD): δ 7.03 (1H, d, J = 1.4 Hz, H-2), 3.86 (3H, s, 3- OCH3), 7.14 (1H, d, J = 8.4 Hz, H-5), 6.93 (1H, dd, J = 8.4, 2.0 Hz, H-6), 5.56 (1H, d, J = 5.9 Hz, H-7), 3.45 (1H, m, H-8), 3.68, 3.76 (each 1H, H-9α, β), 6.72 (1H, brs, H-2′), 3.83 (3H, s, 3′-OCH3), 6.74 (1H, brs, H-6′), 2.63 (2H, t, J = 7.5 Hz, H-7′), 1.82 (2H, m, H-8′), 3.57 (2H, t, J = 6.5 Hz, H-9′), 4.89 (1H, d, J = 7.4 Hz, H-1″). 13C-NMR (150 MHz, CD3OD): δ 138.4(C-1), 111.2 (C-2), 151.0 (C-3), 56.8 (3-OCH3), 147.1 (C-4), 116.2 (C-5), 119.4 (C-6), 88.5 (C-7), 55.7 (C-8), 65.1 (C-9), 137.1 (C-1′), 114.2 (C-2′), 143.5 (C-3′), 56.7(3′-OCH3), 145.3 (C-4′), 129.6 (C-5′), 118.0 (C-6′), 32.9 (C-7′), 35.8 (C-8′), 62.3 (C-9′), 102.8 (C-1″), 74.9 (C-2″), 77.9 (C-3″), 71.4 (C-4″), 78.2 (C-5″), 62.5 (C-6″). The NMR data were consistent with the literature (Zhao et al., 2018).
Colorless oily matter: (−) HR-ESI-MS, m/z 255.8209[M+2H2O-H]−, calculated for molecular formula C10H20O5. 1H, m, NMR (600 MHz, CD3OD): δ 4.65 (1H, brs, H-1), 3.77 (1H, dd, J = 3.4 Hz, H-2), 3.63 (1H, dd, J = 1.7 Hz, H-3), 3.31 (H-4), 3.57 (1H, m, H-5), 1.26 (3H, d, J = 6.3 Hz, H-6) 3.39, 3.67 (each 1H, m, H-1′), 1.57 (2H, m, H-2′), 1.41 (2H, m, H-3′), 0.94 (3H, t, J = 7.4 Hz, H-4′). 13C-NMR (150 MHz, CD3OD): δ 101.7 (C-1), 72.5 (C-2), 74.0 (C-3), 72.4 (C-4), 69.8 (C-5), 18.0 (C-6), 68.3 (C-1′), 32.8 (C-2′), 20.5 (C-3′), 14.2 (C-4′). The NMR data were consistent with the literature (Mallavadhani and Narasimhan, 2009).
White amorphous powder; (+) HR-ESI-MS, m/z 417.1705 [M+Na]+, calculated for molecular formula C17H30O10.1H NMR (600 MHz, CD3OD): δ 3.55,3.83 (each 1H, m, H-1), 2.38 (2H, q, J = 7.2 Hz, H-2), 5.39 (1H, dtt, J = 10.8, 5.1, 1.4 Hz, H-3), 5.45 (1H, dtt, J = 12.1, 6.9, 1.4 Hz, H-4), 2.08 (2H, qd, J = 7.4, 1.4 Hz, H-5), 0.97 (3H, t, J = 7.6 Hz, H-6) 4.32 (1H, d, J = 7.5 Hz, H-1′), 4.08 (1H, dd, J = 11.5, 2.1 Hz, H-6′α), 3.74 (1H, dd, J = 11.5, 5.6 Hz, H-6′β), 4.27 (1H, d, J = 7.8 Hz, H-1″). 13C-NMR (150 MHz, CD3OD): δ 70.7 (C-1), 28.8 (C-2), 125.9 (C-3), 134.5 (C-4), 21.6 (C-5), 14.7 (C-6), 104.4 (C-1′), 74.9 (C-2′), 78.0 (C-3′), 71.2 (C-4′), 77.7 (C-5′), 69.8 (C-6′), 105.5 (C-1″), 75.1 (C-2″), 77.0 (C-3″), 71.5 (C-4″), 67.0 (C-5″). The NMR data were consistent with the literature (Iha et al., 2012).
White amorphous powder: (+) HR-ESI-MS, m/z 408.3348 [M]+, calculated for molecular formula C18H32O10. 1H NMR (600 MHz, CD3OD): δ 3.54,3.83 (each 1H, m, H-1), 2.39 (2H, m, H-2), 5.39 (1H, m, H-3), 5.46 (1H, m, H-4), 2.08 (2H, m, H-5), 0.97 (3H, t, J = 7.8 Hz, H-6) 4.25 (1H, d, J = 7.5 Hz, H-1′), 4.74 (1H, d, J = 1.7 Hz, H-1″), 1.26 (3H, d, J = 6.2 Hz, H-6″). 13C-NMR (150 MHz, CD3OD): δ 70.6 (C-1), 28.9 (C-2), 125.9 (C-3), 134.6 (C-4), 21.6 (C-5), 14.7 (C-6), 104.5 (C-1′), 75.1 (C-2′), 78.1 (C-3′), 71.7 (C-4′), 76.9 (C-5′), 68.1 (C-6′), 102.3 (C-1″), 72.6 (C-2″), 73.6 (C-3″), 74.1 (C-4″), 69.8 (C-5″), 18.1 (C-6″). The NMR data were consistent with the literature (Kil et al., 2019).
In the present study, the phenolic and saponin fractions of ESL extracted in Method 2.3 were used as the representative sample for qualitative analysis because of its most comprehensive phenolic and saponins profile. According to the accurate fragmentation law of fragment ions and the literature, 58 compounds (Figure 2; Table 1), including 30 phenols and 28 saponins, were identified. All compounds were divided into three categories: phenolic acids, flavonoids, and saponins.
To date, phenols in ESL have not been systematically characterized through UPLC-MS/MS. As shown in Table 1, 30 phenolic compounds were identified, mainly divided into phenolic acids and flavonoids based on their structural characteristics. Among them, most of these phenolic acids were composed of one or two caffeic acids and one quinic acid or their derivatives by dehydration condensation, such as compounds 1–8, 11, 17, 18, 22–26, and 28. Generally, due to the readily dissociated ester bond, these phenolic acids were inclined to lose quinic acid moieties (156 Da), caffeoyl (162 Da), feruloyl (176 Da), or coumaroyl moieties (146 Da) in the MS spectra as one characteristic of them. Moreover, the further CO2 (44 Da) and OCH3/CH3 (31/15 Da) loss were other characteristic fragmentation behavior of compounds 2–8, 11, 17, 22–26, and 28 because of the oxygen methyl or carboxyl group in their structures (Ren et al., 2020). For example, the 191 Da, 192 Da, 113 Da, 179 Da, 353 Da, and 367 Da fragment ions in compounds 1–5, 7, 8, 17, 18, 24, and 28 were caused by the loss of caffeoyl, feruloyl, coumaroyl, and/or quinic acid ion. Fragment 135 Da, 338 Da, 179 Da, 299 Da, 149 Da, 163 Da, and 103 Da in compounds 3–4, 8, 26, 23, and 7 were typically obtained by direct loss of CO2 or OCH3/CH3 fragment ions. Chlorogenic acid (1, Figure 5A) and 1,3-dicaffeoylquinic acid (4, Figure 5B) were used as representative phenolic acids to clarify the unique fragmentation pathway in this study.
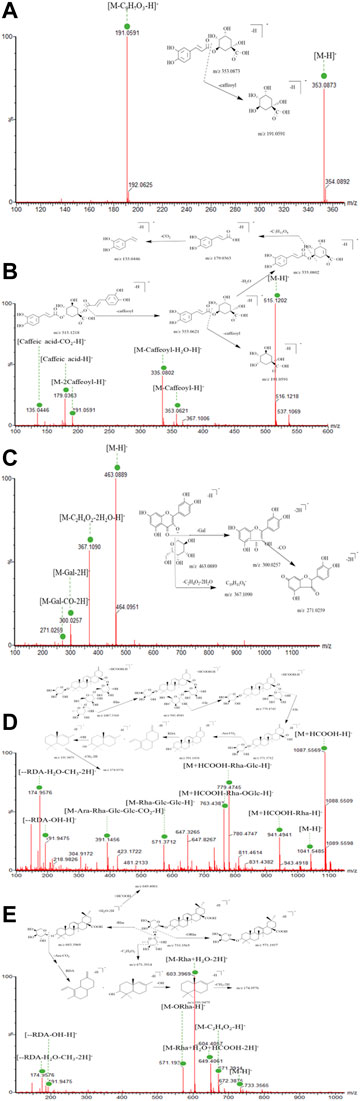
FIGURE 5. UPLC-QTOF-MS/MS spectra and the cleavage pathways of chlorogenic acid (A), 1,3-dicaffeoylquinic acid (B), hyperoside (C), ciwujianoside C1 (D), and eleutheroside K (E).
Among the 11 flavonoids rapidly identified (Table 1), all but two flavonoid aglycones belong to the O-glycosyl type. For flavonoid O-glycoside, the most typical fragmentation behavior was C-O bond cleavage, which frequently produced a glycosyl moiety (Huang et al., 2015). In addition, all flavonoids had the same mother nucleus, which was quercetin (302 Da), kaempferol (286 Da), and rhamnetin (316 Da), respectively. Accordingly, compounds 9, 10, 12, and 16 caused the parent nuclear fragment ion 301/300 Da [quercetin-H/2H]− due to the loss of rutinose (308 Da), galactose (162 Da), glucose (162 Da), and rhamnoside (146 Da). The representative fragments [M-H-146–162]− in compound 13 was [kaempferol-H]−, which were obtained by losing one robinobioside (308 Da) group. Similarly, compound 19 lost one galactose (162 Da) to produce fragmentation 315 Da [rhamnetin-H/M-H-162]−. Flavonoid O-glycosides, such as compounds 9, 10, and 12, often showed the loss of C2H4O2 (60 Da), attributed to the split through the sugar moiety. Moreover, the loss of partial division of sugar unit has also been found in some compounds (14, 16, 20) of this type, which might be a characteristic fragmentation behavior of these compounds with splitting through the glycosyl. Due to the reverse Diels–Alder reaction (RDA), flavonoids were trend to produce characteristic fragmentation (CO, 28 Da) behavior (Ren et al., 2020; L.; Xie et al., 2019). Hyperoside (10, Figure 5C) was used as the example of flavonoid O-glycosides and flavones, respectively, to illuminate their characteristic fragmentation pathway.
According to the fragmentation features and combined with literature verification (Li et al., 2010), 28 saponins were quickly identified, most of which belonged to the oleanolic acid type. In the positive and negative ion mode, the additive ions of saponins were mainly [M+Na]+, [M+H]+, [M-H]− and [M+HCOO]−. The mother nucleoside fragments were obtained by breaking or continuously breaking O-glycosyl or sugar groups, including glucose (162 Da), rhamnoside(146 Da), glucuronic acid (176 Da), galactose (162 Da), xylose (132 Da), and arabinose (132 Da) and so on. (Xia et al., 2019). In addition, the further characteristic fragment ions such as 191 Da and 174 Da were obtained by RDA rearrangement. For example, peak 43 showed a molecular formula of C52H82O21 (m/z 1087.5569 [M+HCOO]−. The fragment ion m/z 571.3712 [M-Rha-Glc-Glc-H]− indicated that its mother nucleus was 30-noroleanolic acid, when combined with the loss of one rhamnose fragment ion to obtain m/z 941.4941 [M-Rha+HCOO]− and one glucose fragment ion to get m/z 779.4745 [M-Rha-Glc+HCOO]−, which was preliminarily identified as ciwujianoside C1 (Figure 5D). Due to the existence of carboxyl structure, it was easy to lose fragment CO2 (44 Da) and gain m/z 391.1456 [M-Rha-Glc-Glc-Ara-CO2-H]−. A similar process also happened to ciwujianoside K (Figure 5E). Furthermore, the RDA rearrangement and partial loss of sugar phenomenon (Figures 5D,E) often occurred due to the presence of cycloolefin structure in the parent nucleus, which was a common and typical feature of saponins. The identification data of other compounds are shown in detail in Table 1.
In the process of quantitative analysis, the contents of phenols and saponins from 29 different places were evaluated by the content determination of 10 reference compounds, which were selected because of their properties, structure, and content. The linearity, quantitative limit (LOQ), detection limit (LOD), repeatability, precision, stability, and recovery of the UPLC-QTRAP-MS/MS quantitative analysis method were verified. The integral peak area (Y) and concentration (X) of 10 reference compounds in six different concentration standard solutions were analyzed by linear regression analysis. The regression equation, determination coefficient, and linear range of the reference compounds were listed in Table 3. The LOD and LOQ under the present chromatographic conditions were determined at a signal-to-noise ratio (S/N) of about 3 and 10, respectively.
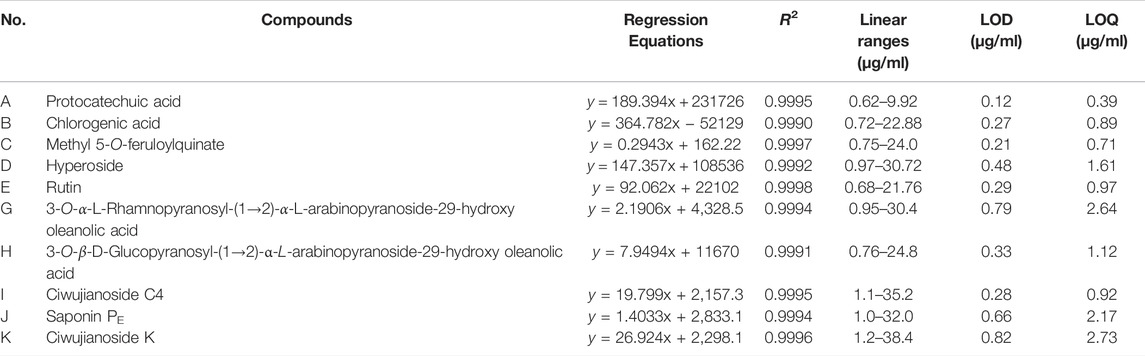
TABLE 3. The regression equation, linear range, limits of detection, and limits of quantification of 10 reference compounds.
Intra-day and inter-day changes were selected to evaluate the precision of the test. For the intra-day difference test, the mixed standard solution was analyzed within 1 day, while for the inter-day difference test, the solution was detected repeatedly in a continuous 3-day cycle. Variations were expressed by the relative standard deviation (RSD). Verification studies showed that the overall intra-day and inter-day variations (RSD) were less than 2.27% and 2.73%, respectively. In the stability test, the contents of 10 components in the sample solution were determined at 0, 2, 4, 8, 12, 24, and 48 h, respectively, and the RSD values were all less than 3.75%. In the repetitive test, the same samples were extracted six times and analyzed as mentioned above. The RSD values of 10 compounds were all less than 2.85%. The accuracy of the method was evaluated by recovery rate. A known amount of reference compounds was added to a certain amount of sample. The mixed solution of the standard was extracted and analyzed by the above-mentioned method. The experiment was repeated three times, and the accuracy of the method was good. The total recovery rate was 95.92%–101.04%, and the RSD was 1.64%–3.72% (Table 4). The results indicated that the determination of phenols and saponins by UPLC-QTRAP-MS/MS had high precision, accuracy, and sensitivity.
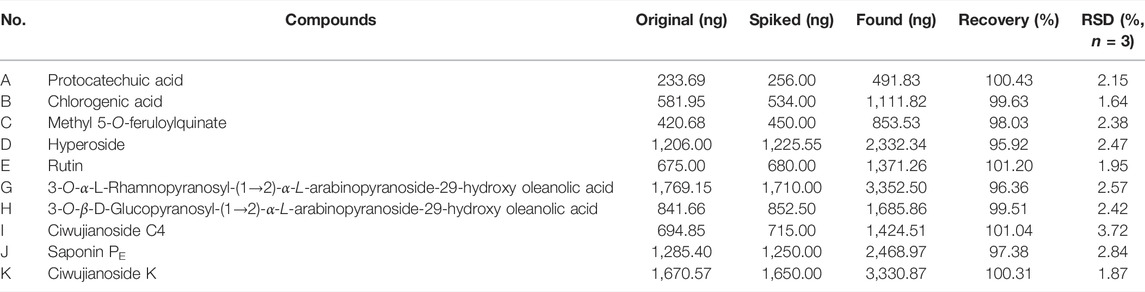
TABLE 4. The recovery of the 10 reference compounds.
Ten standard compounds in ESL samples from 29 locations were quantitatively determined by UPLC-QTRAP-MS/MS to comprehensively evaluate the contents of phenols and saponins. Each sample was analyzed three times to determine the mean contents (Table 5). The results showed that the contents of these compounds varied greatly among the samples collected from different habitats. The contents of protocatechuic acid (A, 8.41 ± 0.062 mg/g) and chlorogenic acid (B, 19.33 ± 0.392 mg/g) were the highest in S23 and S12, respectively, and methyl 5-O-feruloylquinate (C, 15.41 ± 0.173 mg/g), 3-O-α-L-rhamnopyranosyl-(1→2)-α-L-arabinopyranoside-29-hydroxy oleanolic acid (G, 16.20 ± 0.131 mg/g), 3-O-β-D-glucopyranosyl-(1→2)-α-L-arabinopyranoside-29-hydroxy oleanolic acid (H, 11.86 ± 0.324 mg/g), saponin PE (J, 14.71 ± 0.094 mg/g), and ciwujianoside K (K, 30.60 ± 0.147 mg/g) were the highest in S1. The content of ciwujianoside C4 (I, 36.73 ± 0.582 mg/g) in S2, hyperoside (D, 36.56 ± 0.467 mg/g) and rutin (E, 11.11 ± 0.214 mg/g) in S19 was highest, respectively. Comprehensive analysis showed that the content of phenols in S19 was up to 69.89 ± 1.098 mg/g; the highest content of saponins in S1 was 74.28 ± 0.703 mg/g. This indicated that S19 and S1 will be better choices when these ingredients are required for further research. Cluster analysis (Figure 6) divided 29 locations into five categories. S2, S4, S20, S22, and S28 were the same categories. S1 and S23; S3, S6, S7, S8, S10, S14, S15, and S27; S5, S9, S16, S17, S25, and S29 were one category, respectively, and the rest were one category. These results suggested that different areas have different contents of phenols and saponins.
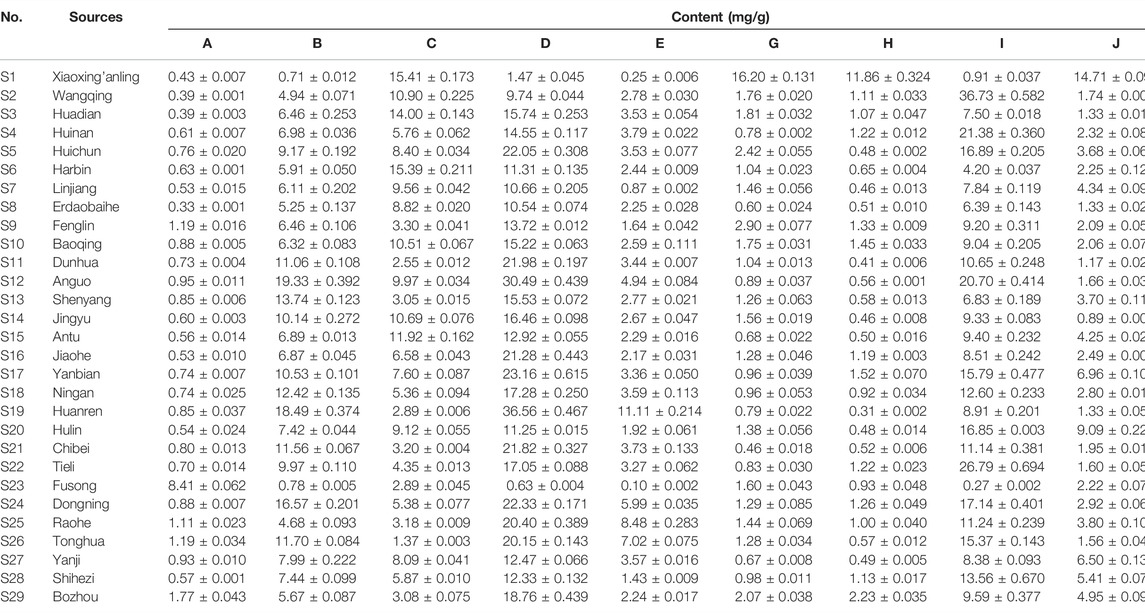
TABLE 5. The amounts of 10 reference compounds in ESL from different sources.
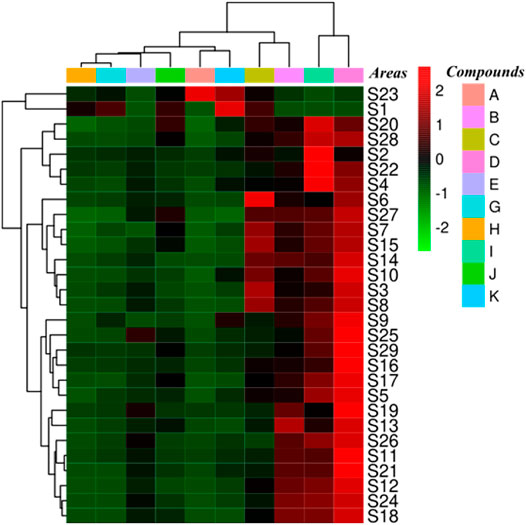
FIGURE 6. Cluster analysis of ESL from 29 different areas based on the content differences of 10 reference compounds.
α-Glucosidase inhibition assay was used to evaluate the hypoglycemic property of the extracted parts of ESL, respectively. As shown in Table 6, all extracts showed effective hypoglycemic activity. The results indicated that the hypoglycemic activity of different extracts was different. Among them, phenolic fraction had the best hypoglycemic activity (471.4 ± 17.7 μg/ml), followed by n-butanol (1004.3 ± 30.8 μg/ml), saponins (1094.0 ± 28.4 μg/ml), and alcohol extract (1386.4 ± 44.5 μg/ml). These results might be correlated with phenols content, suggesting that ESL could be a new plant source of natural hypoglycemic.
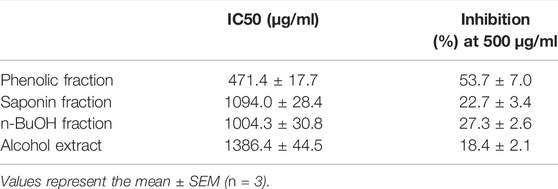
TABLE 6. Results of α-glucosidase inhibition assay.
This study established a new rapid and sensitive UPLC-QTOF-MS/MS method to identify phenols and saponins in ESL. Under the optimized conditions, 30 phenols and 28 saponins were detected and identified within 23.0 min via comparing the characteristic fragments of mass spectrometry with the information of the published literature (Figure 2; Table 1). Most phenolic acids were formed by dehydration condensation of one or two caffeic acids and one quinic acid or their derivatives. Due to the dissociation of oxygen methyl, carboxyl, and ester bond in their structures, losing OCH3/CH3 (31/15 Da), CO2 (44 Da), quinic acid (156 Da), caffeoyl (162 Da), caffeoyl (176 Da), or coumaroyl (146 Da) was their main cleavage characteristics. Flavonoids and saponins tended to be O-glycosides, and the most typical fragmentation behavior was the cleavage of the C-O bond. Their mother nucleus was obtained by destroying or continuously destroying O-glycosyl or sugar groups. The glycosyl of flavonoids mainly included rutinose (308 Da), galactose (162 Da), glucose (162 Da), and rhamnoside (146 Da), and saponins mainly lost glucose, rhamnoside, glucuronic acid (176 Da), galactose, xylose (132 Da), arabinose (132 Da), and so on. Because of the reverse Diels–Alder reaction (RDA), flavonoids were apt to produce characteristic fragments (CO, 28 Da), and saponins obtained characteristic ions such as 191 Da and 174 Da. Moreover, partial sugar loss was also a typical common feature of flavonoids and saponins. The exact or complete chemical structures of 30 compounds from the phenolic and saponin fractions of ESL were further clarified by nuclear magnetic resonance spectroscopy, of which 12 (including eight phenols) were isolated from this genus for the first time (Figure 4). To quantitatively determine 10 components in ESL from 29 different areas to evaluate the contents of phenols and saponins, a UPLC-QTRAP-MS/MS method was established. The results showed that the highest contents of phenols and saponins in S19 and S1 were 69.89 ± 1.098 and 74.28 ± 0.733 mg/g, respectively (Table 5). Cluster analysis (Figure 6) divided 29 locations into five categories, suggesting that different areas have different contents of phenols and saponins. The methodological investigation suggested that the established qualitative and quantitative methods could be used to evaluate the quality of ESL. In addition, the α-glucosidase inhibitory activity of phenolic fraction was the highest in vitro (Table 6), indicating that the phenolic content may be related to the hypoglycemic activity. It was suggested that ESL could be developed as a natural potential effective drug or functional food. However, its pharmacological effects in vivo and related mechanisms need to be further studied.
The original contributions presented in the study are included in the article/Supplementary Material. Further inquiries can be directed to the corresponding author.
JH: conceived the experiment, drafted the manuscript. DW: critical evaluation of the manuscript, literature review. YS, HZ, YW, WZ, FS, and BY: experimental studies, data collection, and manuscript preparation. QW and HK: approved the final manuscript.
The authors declare that the research was conducted in the absence of any commercial or financial relationships that could be construed as a potential conflict of interest.
All claims expressed in this article are solely those of the authors and do not necessarily represent those of their affiliated organizations or those of the publisher, the editors, and the reviewers. Any product that may be evaluated in this article, or claim that may be made by its manufacturer, is not guaranteed or endorsed by the publisher.
Chief Scientist of Qi-Huang Project of National Traditional Chinese Medicine Inheritance and Innovation “One Hundred Million” Talent Project (2021), Qi-Huang Scholar of National Traditional Chinese Medicine Leading Talents Support Program (2018), Heilongjiang Touyan Innovation Team Program (2019).
Chen, B., Cai, W., Liu, F., and Liu, Z. B. (2016). Chemical Constituents in Mailuoning Injection(Ⅰ). Central South Pharmacy.
Committee, N. P. (2020). Pharmacopoeia of the People’s Republic of China. Beijing: China Medical And Technology Press, 310–313.
Costa, C., Tsatsakis, A., Mamoulakis, C., Teodoro, M., Briguglio, G., Caruso, E., et al. (2017). Current Evidence on the Effect of Dietary Polyphenols Intake on Chronic Diseases. Food Chem. Toxicol. 110, 286–299. doi:10.1016/j.fct.2017.10.023
Dong, J., Liang, W., Wang, T., Sui, J., Wang, J., Deng, Z., et al. (2019). Saponins Regulate Intestinal Inflammation in colon Cancer and IBD. Pharmacol. Res. 144, 66–72. doi:10.1016/j.phrs.2019.04.010
Gerontakos, S., Taylor, A., Avdeeva, A. Y., Shikova, V. A., Pozharitskaya, O. N., Casteleijn, D., et al. (2021). Findings of Russian Literature on the Clinical Application of Eleutherococcus Senticosus (Rupr. & Maxim.): A Narrative Review. J. Ethnopharmacol 278, 114274. doi:10.1016/j.jep.2021.114274
Han, J., Liu, L., Yu, N., Chen, J., Liu, B., Yang, D., et al. (2016). Polysaccharides from Acanthopanax Senticosus Enhances Intestinal Integrity through Inhibiting TLR4/NF-Κb Signaling Pathways in Lipopolysaccharide-Challenged Mice. Anim. Sci. J. 87 (8), 1011–1018. doi:10.1111/asj.12528
Hayakawa, S., Ohishi, T., Miyoshi, N., Oishi, Y., Nakamura, Y., and Isemura, M. (2020). Anti-Cancer Effects of Green Tea Epigallocatchin-3-Gallate and Coffee Chlorogenic Acid. Molecules 25 (19). doi:10.3390/molecules25194553
Huang, M., Zhang, Y., Xu, S., Xu, W., Chu, K., Xu, W., et al. (2015). Identification and quantification of phenolic compounds in Vitex negundo L. var. cannabifolia (Siebold et Zucc.) Hand.-Mazz. using liquid chromatography combined with quadrupole time-of-flight and triple quadrupole mass spectrometers. J. Pharm. Biomed. Anal. 108, 11–20. doi:10.1016/j.jpba.2015.01.049
Ida, Y., Satoh, Y., Ohtsuka, M., Nagasao, M., and Shoji, J. (1993). Phenolic Constituents of Phellodendron Amurense Bark. Phytochemistry 35 (1), 209–215. doi:10.1016/s0031-9422(00)90536-3
Iha, A., Matsunami, K., Otsuka, H., Kawahata, M., Yamaguchi, K., and Takeda, Y. (2012). Three new aliphatic glycosides from the leaves of Antidesma japonicum Sieb. et Zucc. J. Nat. Med. 66 (4), 664–670. doi:10.1007/s11418-012-0635-1
Jia, A., Zhang, Y., Gao, H., Zhang, Z., Zhang, Y., Wang, Z., et al. (2021). A Review of Acanthopanax Senticosus (Rupr and Maxim.) Harms: From Ethnopharmacological Use to Modern Application. J. Ethnopharmacol 268, 113586. doi:10.1016/j.jep.2020.113586
Kil, H. W., Rho, T., and Yoon, K. D. (2019). Phytochemical Study of Aerial Parts of Leea Asiatica. Molecules 24 (9). doi:10.3390/molecules24091733
Kim, K. J., Hong, H. D., Lee, O. H., and Lee, B. Y. (2010). The Effects of Acanthopanax Senticosus on Global Hepatic Gene Expression in Rats Subjected to Heat Environmental Stress. Toxicology 278 (2), 217–223. doi:10.1016/j.tox.2010.04.010
Lau, K. M., Yue, G. G., Chan, Y. Y., Kwok, H. F., Gao, S., Wong, C. W., et al. (2019). A Review on the Immunomodulatory Activity of Acanthopanax Senticosus and its Active Components. Chin. Med. 14, 25. doi:10.1186/s13020-019-0250-0
Lee, S., Park, H. S., Notsu, Y., Ban, H. S., Kim, Y. P., Ishihara, K., et al. (2008). Effects of Hyperin, Isoquercitrin and Quercetin on Lipopolysaccharide-Induced Nitrite Production in Rat Peritoneal Macrophages. Phytother Res. 22 (11), 1552–1556. doi:10.1002/ptr.2529
Lee, S., Shin, D. S., Oh, K. B., and Shin, K. H. (2003). Antibacterial Compounds from the Leaves of Acanthopanax Senticosus. Arch. Pharm. Res. 26 (1), 40–42. doi:10.1007/BF03179929
Li, S. L., Lai, S. F., Song, J. Z., Qiao, C. F., Liu, X., Zhou, Y., et al. (2010). Decocting-induced Chemical Transformations and Global Quality of Du-Shen-Tang, the Decoction of Ginseng Evaluated by UPLC-Q-TOF-MS/MS Based Chemical Profiling Approach. J. Pharm. Biomed. Anal. 53 (4), 946–957. doi:10.1016/j.jpba.2010.07.001
Liang, Q., Yu, X., Qu, S., Xu, H., and Sui, D. (2010). Acanthopanax Senticosides B Ameliorates Oxidative Damage Induced by Hydrogen Peroxide in Cultured Neonatal Rat Cardiomyocytes. Eur. J. Pharmacol. 627 (1-3), 209–215. doi:10.1016/j.ejphar.2009.10.055
Mallavadhani, U. V., and Narasimhan, K. (2009). Two Novel Butanol Rhamnosides from an Indian Traditional Herb, Euphorbia Hirta. Nat. Prod. Res. 23 (7), 644–651. doi:10.1080/14786410802214009
Meng, L. J., Liu, B. L., Zhang, Y., and Zhou, G. X. (2014). Chemical Constituents in Root Barks of Lycium Chinense. Chin. Traditional Herbal Drugs 45 (15), 2139–2142.
Meng, Q., Pan, J., Liu, Y., Chen, L., and Ren, Y. (2018). Anti-tumour Effects of Polysaccharide Extracted from Acanthopanax Senticosus and Cell-Mediated Immunity. Exp. Ther. Med. 15 (2), 1694–1701. doi:10.3892/etm.2017.5568
Menozzi-Smarrito, C., Wong, C. C., Meinl, W., Glatt, H., Fumeaux, R., Munari, C., et al. (2011). First Chemical Synthesis and In Vitro Characterization of the Potential Human Metabolites 5-O-Feruloylquinic Acid 4'-sulfate and 4'-O-Glucuronide. J. Agric. Food Chem. 59 (10), 5671–5676. doi:10.1021/jf200272m
Osawa, K., Arakawa, T., Shimura, S., and Takeya, K. (2001). New Quinic Acid Derivatives from the Fruits of Chaenomeles Sinensis (Chinese Quince). Tokyo: Natural Medicines.
Panossian, A. G., Efferth, T., Shikov, A. N., Pozharitskaya, O. N., Kuchta, K., Mukherjee, P. K., et al. (2021). Evolution of the Adaptogenic Concept from Traditional Use to Medical Systems: Pharmacology of Stress- and Aging-Related Diseases. Med. Res. Rev. 41 (1), 630–703. doi:10.1002/med.21743
Ren, M., Xu, W., Zhang, Y., Ni, L., Lin, Y., Zhang, X., et al. (2020). Qualitative and Quantitative Analysis of Phenolic Compounds by UPLC-MS/MS and Biological Activities of Pholidota Chinensis Lindl. J. Pharm. Biomed. Anal. 187, 113350. doi:10.1016/j.jpba.2020.113350
Shi, L. I., Liu, D. Y., Shi, X. F., and Lei, Y. P. (2014). Chemical Constituents in N-Butanol Extract from pine needles of Cedrus Deodara. Chin. Traditional Herbal Drugs 45 (18), 2602–2606.
Shikov, A. N., Narkevich, I. A., Flisyuk, E. V., Luzhanin, V. G., and Pozharitskaya, O. N. (2021). Medicinal Plants from the 14th Edition of the Russian Pharmacopoeia, Recent Updates. J. Ethnopharmacol 268, 113685. doi:10.1016/j.jep.2020.113685
Singh, B., Singh, J. P., Kaur, A., and Singh, N. (2020). Phenolic Composition, Antioxidant Potential and Health Benefits of Citrus Peel. Food Res. Int. 132, 109114. doi:10.1016/j.foodres.2020.109114
Tošović, J., Marković, S., Dimitrić Marković, J. M., Mojović, M., and Milenković, D. (2017). Antioxidative Mechanisms in Chlorogenic Acid. Food Chem. 237, 390–398. doi:10.1016/j.foodchem.2017.05.080
Wan, C., Yuan, T., Cirello, A. L., and Seeram, N. P. (2012). Antioxidant and α-glucosidase Inhibitory Phenolics Isolated from Highbush Blueberry Flowers. Food Chem. 135 (3), 1929–1937. doi:10.1016/j.foodchem.2012.06.056
Wang, H. P., Zhang, Y. B., Yang, X. W., Zhao, D. Q., and Wang, Y. P. (2016). Rapid Characterization of Ginsenosides in the Roots and Rhizomes of Panax Ginseng by UPLC-DAD-QTOF-MS/MS and Simultaneous Determination of 19 Ginsenosides by HPLC-ESI-MS. J. Ginseng Res. 40 (4), 382–394. doi:10.1016/j.jgr.2015.12.001
Xia, Y. G., Gong, F. Q., Guo, X. D., Song, Y., Li, C. X., Liang, J., et al. (2019). Rapid Screening and Characterization of Triterpene Saponins in Acanthopanax Senticosus Leaves via Untargeted MSAll and SWATH Techniques on a Quadrupole Time of Flight Mass Spectrometry. J. Pharm. Biomed. Anal. 170, 68–82. doi:10.1016/j.jpba.2019.02.032
Xie, L., Lin, Q., Guo, K., Tong, C., Shi, S., and Shi, F. (2019). HPLC‒DAD‒QTOF-MS/MS Based Comprehensive Metabolomic Profiling of Phenolic Compounds in Kalimeris Indica Anti-inflammatory Fractions. Ind. Crops Prod. 140, 111636. doi:10.1016/j.indcrop.2019.111636
Xie, Y., Zhang, B., and Zhang, Y. (2015). Protective Effects of Acanthopanax Polysaccharides on Cerebral Ischemia-Reperfusion Injury and its Mechanisms. Int. J. Biol. Macromol 72, 946–950. doi:10.1016/j.ijbiomac.2014.09.055
Yan, W., Zheng, C., He, J., Zhang, W., Huang, X. A., Li, X., et al. (2018). Eleutheroside B1 Mediates its Anti-influenza Activity through POLR2A and N-Glycosylation. Int. J. Mol. Med. 42 (5), 2776–2792. doi:10.3892/ijmm.2018.3863
Yang, F., Yang, L., Wang, W., Liu, Y., Zhao, C., and Zu, Y. (2012). Enrichment and Purification of Syringin, Eleutheroside E and Isofraxidin from Acanthopanax Senticosus by Macroporous Resin. Int. J. Mol. Sci. 13 (7), 8970–8986. doi:10.3390/ijms13078970
Zeng, J., Zhang, S. N., Song, H. Z., Ma, R. J., and Tan, Q. G. (2020). Flavonoid and Lignan Glycosides from the Leaves of Melia Azedarach. Chem. Nat. Comp. 56 (2). doi:10.1007/s10600-020-03019-w
Zhang, H., Su, Y., Wang, X., Mi, J., Huo, Y., Wang, Z., et al. (2017). Antidiabetic Activity and Chemical Constituents of the Aerial Parts of Heracleum Dissectum Ledeb. Food Chem. 214, 572–579. doi:10.1016/j.foodchem.2016.07.065
Zhao, X.-C., Du, J.-L., Xie, Y.-G., Zhang, Y., and Jin, H.-Z. (2018). Chemical Constituents of the Flowers of Hemerocallis Minor. Chem. Nat. Compd. 54 (3), 556–558. doi:10.1007/s10600-018-2405-0
Zhou, T., Li, Z., Kang, O. H., Mun, S. H., Seo, Y. S., Kong, R., et al. (2017). Antimicrobial Activity and Synergism of Ursolic Acid 3-O-α-L-Arabinopyranoside with Oxacillin against Methicillin-Resistant Staphylococcus aureus. Int. J. Mol. Med. 40 (4), 1285–1293. doi:10.3892/ijmm.2017.3099
Keywords: Eleutherococcus senticosus (Rupr. & Maxim.) Maxim. leaves, phenols, saponins, UPLC-MS/MS, α-glucosidase inhibitory
Citation: Hu J, Wu D, Sun Y, Zhao H, Wang Y, Zhang W, Su F, Yang B, Wang Q and Kuang H (2022) Comprehensive Analysis of Eleutherococcus senticosus (Rupr. & Maxim.) Maxim. Leaves Based on UPLC-MS/MS: Separation and Rapid Qualitative and Quantitative Analysis. Front. Pharmacol. 13:865586. doi: 10.3389/fphar.2022.865586
Received: 30 January 2022; Accepted: 15 March 2022;
Published: 17 May 2022.
Edited by:
Abdul Rohman, Gadjah Mada University, IndonesiaReviewed by:
Alexander N. Shikov, Saint-Petersburg State Chemical Pharmaceutical Academy, RussiaCopyright © 2022 Hu, Wu, Sun, Zhao, Wang, Zhang, Su, Yang, Wang and Kuang. This is an open-access article distributed under the terms of the Creative Commons Attribution License (CC BY). The use, distribution or reproduction in other forums is permitted, provided the original author(s) and the copyright owner(s) are credited and that the original publication in this journal is cited, in accordance with accepted academic practice. No use, distribution or reproduction is permitted which does not comply with these terms.
*Correspondence: Qiuhong Wang, cWh3YW5nNjY4QHNpbmEuY29t; Haixue Kuang, aHhrdWFuZ0BobGp1Y20ubmV0
Disclaimer: All claims expressed in this article are solely those of the authors and do not necessarily represent those of their affiliated organizations, or those of the publisher, the editors and the reviewers. Any product that may be evaluated in this article or claim that may be made by its manufacturer is not guaranteed or endorsed by the publisher.
Research integrity at Frontiers
Learn more about the work of our research integrity team to safeguard the quality of each article we publish.