Dapagliflozin Mediates Plin5/PPARα Signaling Axis to Attenuate Cardiac Hypertrophy
A Commentary on
Dapagliflozin Mediates Plin5/PPARα Signaling Axis to Attenuate Cardiac Hypertrophy
by Yu, J., Zhao, H., Qi, X., Wei, L., Li, Z., Li, C., Zhang, X. and Wu, H. (2021). Front. Pharmacol. 12:730623. doi: 10.3389/fphar.2021.730623
Recently, we read the article published in frontiers in Pharmacology on 23 September 2021 written by Yu et al. (2021) with great interest: “Dapagliflozin Mediates Plin5/PPARα Signaling Axis to Attenuate Cardiac Hypertrophy.” In this article, the authors explored the molecular mechanism of dapagliflozin (DAPA) to relieve cardiac hypertrophy by conducting gene microarray analysis to identify differentially expressed genes (DEGs) and subsequently performing signaling pathway enrichment analysis. The study is of vital significance. However, we believe bioinformatics analysis has some weak points in the original article.
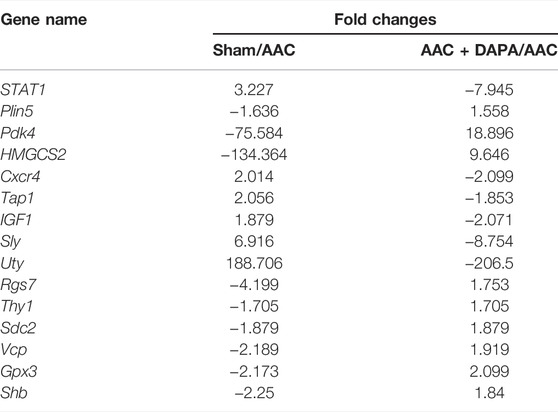
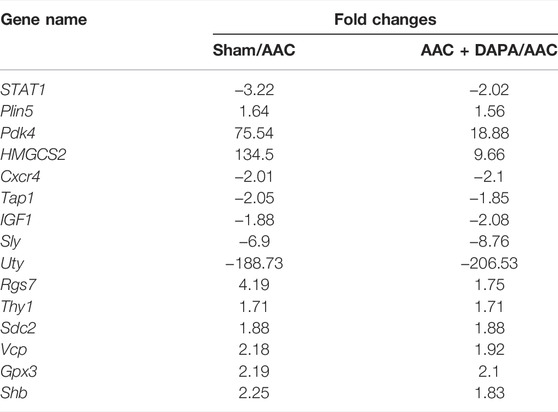
In the original article, microarray analysis was used to detect differentially expressed genes (DEGs) among the abdominal aortic constriction (AAC) group, AAC + DAPA group, and the sham group. The authors applied “fold change >1.5 or fold change <−1.5” as the threshold for significant differential expression. In the “Data Availability Statement” section of the original article, we noticed that the microarray GSE183120 that the authors analyzed was publicly available at the GEO database (https://www.ncbi.nlm.nih.gov/geo/query/acc.cgi?acc=GSE183120). On the GEO website, we could see only one sample in each of the groups depicted as sham, AAC, and AAC + DAPA, which means the p-value could not be generated with only one sample per group. Thus, the identification of DEGs may not be statistically significant. What is more, it is noteworthy that the platform shown in the GEO database of GSE183120 is “GPL23038 [Clariom_S_Mouse] Affymetrix Clariom S Assay, Mouse (Includes Pico Assay)” rather than what the authors mentioned in the section of “Microarray Profiling,” “Affymetrix GeneChip Primeview™.” Herein, we re-analyzed the microarray GSE183120 using “Transcriptome Analysis Console” (TAC software, version 4.0, Thermo Fisher Scientific) and produced different results. TAC4.0 is a software developed for researchers with no or little experience in bioinformatics, and it is suitable for Affymetrix microarray transcriptome analysis. Consistent with the original article, we also applied “fold change >1.5 or fold change <−1.5” as the threshold for significant differential expression, and other settings were default. We found that 2021 genes changed significantly, with 945 genes upregulated and 1,076 genes downregulated in the AAC + DAPA group compared with the AAC group, which was similar to the results of the original article. On the contrary, we were failed to reproduce fold change values of more than half of the representative genes, as shown in Table 1. In the results of our analysis (Table 2), representative genes showed the opposite direction in sham/AAC (sham vs. AAC comparison). For example, STAT1 was upregulated in the AAC group compared with the sham group in our analysis but downregulated in the original article. Furthermore, a totally different fold change value of STAT1 in AAC + DAPA/AAC (AAC + DAPA vs. AAC comparison) was obtained through our analysis. However, it experienced the same change direction as the original article.
All in all, it seems that the authors failed to conduct a hypothesis test and correction for DEGs. What is more, the screening process of DEGs needs thousands of hypothesis tests, resulting in an accumulation of false positives. Thus, the amplified false positives from such multiple hypothesis tests need to be corrected. Hence, it is essential to calculate the adjusted p-value in differential expressed genes analysis to control FDR using more suitable statistical methods such as Benjamini–Hochberg or some other algorithms.
Specialized high-level microarray analysis methods such as Limma (Linear Models for Microarray Analysis) (Ritchie et al., 2015; Law et al., 2016) for statistical analysis of DEGs is what we would like to recommend; setting the cutoff of absolute log2 FC > 1.5 and FDR < 0.05 (Zhang et al., 2019) is a more reliable approach to identify DEGs and enriched pathway appropriately.
In conclusion, it is the basis for further analysis, such as signaling pathway enrichment, to use optimal statistical approaches (Chrominski and Tkacz, 2015) and obtain accurate and convincing results of DEGs. We are looking forward to receiving further explanations about the data analysis from the authors and believe these considerations and innovations in data analytical and statistical approaches would benefit the data-intensive transcriptomics research (Liu et al., 2021).
Author Contributions
ZL: writing, conceptualization. NZ: statistical analysis. BZ: supervision, methodology. YX: reviewing and editing.
Funding
This work was supported by grants from the National Natural Science Foundation of China (81770679 and 81970582), the National Natural Science Foundation of Shandong Province (ZR2020QH060), Special Project of Benefiting People with Science and Technology of Qingdao (20-3-4-36-nsh) and Qingdao Key Health Discipline Development Fund. No funding bodies had any role in the study design, data collection and analysis, decision to publish, or preparation of the manuscript.
Conflict of Interest
The authors declare that the research was conducted in the absence of any commercial or financial relationships that could be construed as a potential conflict of interest.
Publisher’s Note
All claims expressed in this article are solely those of the authors and do not necessarily represent those of their affiliated organizations, or those of the publisher, the editors and the reviewers. Any product that may be evaluated in this article, or claim that may be made by its manufacturer, is not guaranteed or endorsed by the publisher.
References
Chrominski, K., and Tkacz, M. (2015). Comparison of High-Level Microarray Analysis Methods in the Context of Result Consistency. PloS one 10 (6), e0128845. doi:10.1371/journal.pone.0128845
Law, C. W., Alhamdoosh, M., Su, S., Dong, X., Tian, L., Smyth, G. K., et al. (2016). RNA-seq Analysis Is Easy as 1-2-3 with Limma, Glimma and edgeR. F1000Res 5, 1408. doi:10.12688/f1000research.9005.3
Liu, Z., Yang, C., Guan, C., Xu, L., and Xu, Y. (2021). Comment on "Microarray Analysis of Gene Expression Differences in Microglia after Exposure to Graphene Quantum Dots". Sci. Total Environ. 773, 146354. doi:10.1016/j.scitotenv.2021.146354
Ritchie, M. E., Phipson, B., Wu, D., Hu, Y., Law, C. W., Shi, W., et al. (2015). Limma powers Differential Expression Analyses for RNA-Sequencing and Microarray Studies. Nucleic Acids Res. 43 (7), e47. doi:10.1093/nar/gkv007
Yu, J., Zhao, H., Qi, X., Wei, L., Li, Z., Li, C., et al. (2021). Dapagliflozin Mediates Plin5/PPARα Signaling Axis to Attenuate Cardiac Hypertrophy. Front. Pharmacol. 12, 730623. doi:10.3389/fphar.2021.730623
Keywords: microarray, bioinformatics analysis, differentially expressed genes, fold change, false discovery rate
Citation: Liu Z, Zhang N, Zhou B and Xu Y (2022) Commentary: Dapagliflozin Mediates Plin5/PPARα Signaling Axis to Attenuate Cardiac Hypertrophy. Front. Pharmacol. 13:854593. doi: 10.3389/fphar.2022.854593
Received: 07 February 2022; Accepted: 21 March 2022;
Published: 25 April 2022.
Edited by:
Ebru Arioglu Inan, Ankara University, TurkeyReviewed by:
Kerem Mert Şenses, Bülent Ecevit University, TurkeyOnur Emre Onat, Acıbadem University, Turkey
Copyright © 2022 Liu, Zhang, Zhou and Xu. This is an open-access article distributed under the terms of the Creative Commons Attribution License (CC BY). The use, distribution or reproduction in other forums is permitted, provided the original author(s) and the copyright owner(s) are credited and that the original publication in this journal is cited, in accordance with accepted academic practice. No use, distribution or reproduction is permitted which does not comply with these terms.
*Correspondence: Yan Xu, eHV5YW5xeWZ5QDEyNi5jb20=
 Zengying Liu
 Ningxin Zhang
 Bin Zhou
 Yan Xu
