
94% of researchers rate our articles as excellent or good
Learn more about the work of our research integrity team to safeguard the quality of each article we publish.
Find out more
ORIGINAL RESEARCH article
Front. Pharmacol., 06 June 2022
Sec. Pharmacology of Anti-Cancer Drugs
Volume 13 - 2022 | https://doi.org/10.3389/fphar.2022.749472
This article is part of the Research TopicHarnessing Chemotherapy Resistance and development of Novel Therapeutic strategies for Acute Leukemia with KMT2A (MLL)-gene rearrangementsView all 6 articles
 Bruno A. Lopes1†
 Caroline Pires Poubel1,2†
 Cristiane Esteves Teixeira2†
 Aurélie Caye-Eude3,4
 Hélène Cavé3,4
 Claus Meyer5
 Rolf Marschalek5
 Mariana Boroni2
 Mariana Emerenciano1*
The KMT2A (MLL) gene rearrangements (KMT2A-r) are associated with a diverse spectrum of acute leukemias. Although most KMT2A-r are restricted to nine partner genes, we have recently revealed that KMT2A-USP2 fusions are often missed during FISH screening of these genetic alterations. Therefore, complementary methods are important for appropriate detection of any KMT2A-r. Here we use a machine learning model to unravel the most appropriate markers for prediction of KMT2A-r in various types of acute leukemia. A Random Forest and LightGBM classifier was trained to predict KMT2A-r in patients with acute leukemia. Our results revealed a set of 20 genes capable of accurately estimating KMT2A-r. The SKIDA1 (AUC: 0.839; CI: 0.799–0.879) and LAMP5 (AUC: 0.746; CI: 0.685–0.806) overexpression were the better markers associated with KMT2A-r compared to CSPG4 (also named NG2; AUC: 0.722; CI: 0.659–0.784), regardless of the type of acute leukemia. Of importance, high expression levels of LAMP5 estimated the occurrence of all KMT2A-USP2 fusions. Also, we performed drug sensitivity analysis using IC50 data from 345 drugs available in the GDSC database to identify which ones could be used to treat KMT2A-r leukemia. We observed that KMT2A-r cell lines were more sensitive to 5-Fluorouracil (5FU), Gemcitabine (both antimetabolite chemotherapy drugs), WHI-P97 (JAK-3 inhibitor), Foretinib (MET/VEGFR inhibitor), SNX-2112 (Hsp90 inhibitor), AZD6482 (PI3Kβ inhibitor), KU-60019 (ATM kinase inhibitor), and Pevonedistat (NEDD8-activating enzyme (NAE) inhibitor). Moreover, IC50 data from analyses of ex-vivo drug sensitivity to small-molecule inhibitors reveals that Foretinib is a promising drug option for AML patients carrying FLT3 activating mutations. Thus, we provide novel and accurate options for the diagnostic screening and therapy of KMT2A-r leukemia, regardless of leukemia subtype.
Chromosomal rearrangements involving the KMT2A (MLL) gene are recurrently associated with the disease phenotype of acute leukemia. Considering the high number of genes involved in KMT2A fusions (Meyer et al., 2018), the identification of KMT2A rearrangements (KMT2A-r) is routinely based on screening methods to guide the detection of this alteration regardless of the partner gene. Such methods include immunophenotyping using an antibody for detection of chondroitin sulfate proteoglycan 4 (CSPG4, also known as neuron-glial antigen 2, NG2) (Behm et al., 1996; Smith et al., 1996) or split-signal fluorescence in situ hybridization (FISH). Subsequently, the identification of the most frequent KMT2A fusion transcripts is generally performed by reverse transcription polymerase chain reaction (RT-PCR) (Burmeister et al., 2015), and long-distance inverse polymerase chain reaction (LDI-PCR) (Meyer et al., 2018). Recent studies have also demonstrated the application of next-generation sequencing (NGS) technologies for the detection of KMT2A-r, which also facilitates the identification of numerous genomic alterations for risk classification of acute leukemia (Shiba et al., 2019; Brown et al., 2020). However, the cost of NGS is still very high for most laboratories worldwide, and low-expression of KMT2A fusion transcripts provide limitations for precise detection of these alterations using RNA sequencing (RNA-Seq) in all KMT2A-r cases (Brown et al., 2020).
Recently, we have demonstrated that FISH fails to detect KMT2A-USP2 fusions in most patients, leading to an underestimation of its frequency in acute leukemia (Meyer et al., 2019). Because this gene fusion derives from a short inversion within 11q23, 5′ and 3′ KMT2A probe signals usually do not split away from each other, mimicking a wild-type (normal) FISH pattern. The alteration is only observed whilst the inversion is accompanied by a 3′ KMT2A deletion. The challenge to accurately identify KMT2A-r is not restricted to FISH methodology. Several studies reveal a varying prevalence of false-negative results associated with NG2 detection by flow cytometry in patients with acute leukemia (Emerenciano et al., 2011; Menendez and Bueno, 2011). Therefore, a screening method that reduces the chances of false-negative results is still relevant in the context of KMT2A-r diagnosis.
In addition, the standard treatment offered for patients with KMT2A-r acute leukemia, which typically involves an intensive chemotherapy as induction, followed by additional consolidation therapy, has not yet significantly improved outcomes despite many years of various international efforts. Therefore, the urgent need for novel therapeutic strategies is unquestionable. Indeed, many studies are currently addressing new therapeutic options. MEK inhibitors have been pointed out as potential options for KMT2A-r patients carrying RAS mutations (Mansur et al., 2017; Kerstjens et al., 2018). The development of therapeutic strategies to specifically inhibit the recurrent fusion proteins may also be an opportunity, as previously reviewed (Steinhilber and Marschalek, 2018). Other promising options are based on the use of epigenetic drugs, such as demethylating agents and histone deacetylase inhibitors (Wong and So, 2020). Additionally, immunotherapy and the inhibition of PARP (Fritz et al., 2021) have shown potential to enhance the efficacy of other therapies and to ultimately overcome KMT2A-r acute leukemia. While the research timeline is running during the clinical testing of the aforementioned therapies, drug repurposing could meet the current need in a faster way (Tsakaneli and Williams, 2021).
In parallel, bioinformatics has been a branch of science which uses different methods and techniques like molecular biology, computer science, statistics, and artificial intelligence to design algorithms for solving biological problems. For instance, artificial intelligence encompasses a set of methodological approaches (e.g., machine learning) and has already been applied to understand cancer progression and to develop predictive models of diagnosis, prognosis and response to treatment in renal carcinoma and ovarian cancer (Jagga and Gupta, 2014; Xu et al., 2016). In this approach, the system can learn from varied data, predict and make decisions through classification and regression algorithms. The information used by the prediction model, whether molecular or genetic data, can be extracted, thus allowing the identification of new genes as possible important biomarkers for patient stratification and, consequently, for inferring better therapeutic strategies. Thus, machine learning approaches hold promise for a more robust and accurate characterization of hematologic malignancies (Eckardt et al., 2020). Furthermore, implementing machine learning methods will help clinicians analyze and interpret data, and increase objectivity, assisting clinical decision-making (Walter et al., 2021). Therefore, both the search for a therapeutic strategy and the search for a diagnostic biomarker can benefit from the availability of bioinformatics tools and machine learning approaches. Here, we evaluate the transcriptome of acute leukemia cases to point out therapeutic options, and to unravel appropriate markers for diagnostic routine prediction of KMT2A-r by integrating machine learning and bioinformatics approaches.
The acute leukemia patients included in this study were selected based on known KMT2A status (KMT2A-r or KMT2A wild-type/KMT2A-WT) and available gene expression data from six different datasets (Supplementary Table S1). The Therapeutically Applicable Research to Generate Effective Treatments (TARGET) dataset (https://portal.gdc.cancer.gov/projects; dbGAP accession number phs000218) is composed of four different cohorts with pediatric patients diagnosed with 1) B-cell precursor acute lymphoblastic leukemia (B-ALL), 2) T-cell ALL (T-ALL), 3) acute myeloid leukemia (AML), and 4) acute leukemia of ambiguous lineage (ALAL). The diagnosis of KMT2A-r in TARGET dataset was obtained from the respective clinical data available in the TARGET Data Matrix (https://ocg.cancer.gov/programs/target/data-matrix; see the Common Data Element (CDE) files for more details). This identification was based on karyotype and FISH results for the B-ALL samples, FISH with confirmation by RNA-Seq (Liu et al., 2017) for the T-ALL cohort, RNA-Seq, Whole Genome Sequencing (WGS) and/or karyotype for the AML patients, and karyotype for the ALAL cohort. The Beat AML programme consists of a large dataset of AML pediatric and adult patients (data viewer: http://www.vizome.org/aml/). As previously described, the diagnosis of KMT2A-r in this cohort was obtained by conventional karyotype and RNA-Seq. All clinical data are found in the Supplementary Material of the original paper (Tyner et al., 2018).
The data from The European Genome-phenome Archive (EGA - https://ega-archive.org) study EGAS00001004212 (here called ALL-Ekert dataset) are from pediatric patients diagnosed with B-ALL and T-ALL. For this cohort, the KMT2A status was retrieved from the original study, which used conventional karyotype/FISH and RNA-Seq techniques (Brown et al., 2020). We also included data from adult patients diagnosed with AML deposited in the EGA database under the study accession number EGAS00001003096 (here called AML-Griffioen dataset). The identification of KMT2A-r was obtained by RNA-Seq analysis and validated by RT-PCR. The results were also previously published in the original paper (Arindrarto et al., 2021).
Another dataset evaluated in this work was composed of pediatric and adult AML samples from The Cancer Genome Atlas (TCGA) database (http://cancergenome.nih.gov/). To identify the patients with KMT2A-r, we used annotation of the structural variant from the “Acute Myeloid Leukemia” study in cBioPortal database (https://www.cbioportal.org/), which was based on RNA-Seq analysis (Gao et al., 2018). The last cohort included B-ALL, T-ALL and ALAL samples from a dataset of pediatric patients submitted to mRNA sequencing as part of the diagnostic workup at the Robert Debré hospital (Assistance Publique des Hôpitaux de Paris, AP-HP) in France (here called French dataset). The KMT2A status classification was based on both conventional cytogenetics and RNA-seq data.
All gene expression data were obtained from paired-end RNA-Seq methodology (Supplementary Table S1). For TARGET cohorts, we downloaded data corresponding to read counts (not normalized), when available, and FPKM (Fragments Per Kilobase Million) values of each gene annotated in the human reference genome GRCh37/hg19 (Ensembl release 59, Refseq and UCSC knownGene) from open-access files of these patients. The description of RNA-Seq data processing is available at the TARGET project portal (https://ocg.cancer.gov/programs/target/target-methods). In the case of ALAL samples, we used the read counts to calculate FPKM values using the Bioconductor R package “edgeR” version 3.30.3 (Robinson et al., 2010; McCarthy et al., 2012). For the Beat AML dataset, we downloaded gene expression log2 normalized FPKM values for each sample from the Supplementary Table S8 in the original paper (Tyner et al., 2018). We converted the log2 FPKM values to normal FPKM values by raising 2 to the power of the logarithmic values so that they would be correctly used in further analysis. Gene assignments were also based on the human reference genome GRCh37 (Ensembl release 75). For more details on processing steps, please see the methods section in the reference (Tyner et al., 2018). The gene expression data of the TCGA dataset were downloaded using the Bioconductor R package “TCGAbiolinks” version 2.16.4 (Colaprico et al., 2016). Through the GDCquery function, we used the following parameters to obtain the FPKM values of data aligned to the human reference genome GRCh38 (UCSC knownGene) (Gao et al., 2019): project = “TCGA-LAML,” data.category = “Transcriptome Profiling,” data.type = “Gene expression Quantification,” workflow.type = “HTSeq - FPKM,” legacy = False.
The fastq files from ALL-Ekert and AML-Griffioen datasets were downloaded via the EGA download client, pyEGA3 (https://github.com/EGA-archive/ega-download-client), after gaining access permission to EGA studies EGAS00001004212 and EGAS00001003096, respectively. The reads were trimmed using the software Trimmomatic version 0.39 (Bolger et al., 2014) and then were mapped to the human reference genome GRCh37 (Ensembl release 82) using STAR algorithm version 2.6.0c (Dobin et al., 2013). The RSEM software package version 1.3.0 (Li and Dewey, 2011) was used to estimate read counts and FPKM values of each gene annotated.
The sequencing and gene expression data generation of all samples included in the French dataset were performed by IntegraGen. Libraries were prepared with the NEBNextUltra II Directional RNA Library Prep Kit for Illumina protocol, according to supplier recommendations, and sequencing was carried out on Illumina NovaSeq (paired-end 100 bp reads). The STAR alignment algorithm (Dobin et al., 2013) was used to obtain the number of reads associated to each gene in the human reference genome GRCh37 by the Gencode release 31 annotation (restricted to protein-coding genes, antisense and long intervening noncoding RNAs). Raw counts for each sample were imported into R statistical software. Extracted count matrix was normalized for library size and coding length of genes to compute FPKM expression levels.
We also included RNA-seq data from human acute leukemia cell lines for validation analysis. The gene expression data, cell lines annotations and KMT2A fusion information were retrieved from the Cancer Cell Line Encyclopedia (CCLE) database (https://sites.broadinstitute.org/ccle/) at the Dependency Map (DepMap) portal (https://depmap.org/portal/download/; CCLE 2019 release). RNA-seq profiling was performed as previously described (Ghandi et al., 2019), and reads were aligned to the GRCh37 human genome reference. The gene expression was quantified in the TPM (Transcripts Per Million) unit.
The workflow used in this step is described in Supplementary Figure S1. For the identification of predictive markers of KMT2A-r using machine learning approaches, we obtained a unique gene expression data with the FPKM normalized values of 14,287 genes. Ensembl IDs were converted to gene IDs using the Bioconductor R package “biomaRt” version 2.44.4 (Durinck et al., 2005; Durinck et al., 2009), and duplicate genes were removed. We also added a batch effect correction step in order to remove the variability from the different datasets using the removeBatchEffect function of the Bioconductor R package “limma” version 3.44.3 (Ritchie et al., 2015). Then, the continuous variables were standardized using z-score. Variables with a correlation greater than 0.90 or low variance (zero or near zero) were excluded. Then, a wrapper feature selection step was performed to reduce the dimensionality of this dataset using BorutaPy version 0.3 (Kursa and Rudnicki, 2010). The acute leukemia subtype and age group information—pediatric (<22 years-old), younger adults (≥22 years-old and <60 years-old), and older adults (≥60 years-old)—were also evaluated for the construction of the model. Variables with more than two categories were represented by a set of dummy variables, with one variable for each category. The Random Forest and LightGBM models were trained with 70% of the data (training set), and tested in the remaining 30% (testing set). The 30-folds cross validation was used to adjust hyperparameters with the GridSearchCV function. Due to class imbalance, we resampled our training dataset using the SMOTEENN method, which is an interesting technique that combines both undersampling [using Edited Nearest Neighbor (ENN)] and oversampling (SMOTE).
Afterwards, accuracy, sensitivity, specificity, positive predictive value (PPV) and negative predictive value (NPV) were analyzed to assess the performance of our model. The combination of these parameters with the value of the area under the receiver operating characteristic (ROC) curve (AUC) was used to select the best model. Besides that, we calculated the Shapley values of each feature according to the predictive model to understand their respective contributions using SHAP (SHapley Additive exPlanations) version 0.36.0 (Lundberg et al., 2017). All previous analyzes were performed using the Python programming language with the scikit-learn library (Pedregosa et al., 2011). Heatmaps were constructed with the CRAN R package “pheatmap” version 1.0.12 (Kolde, 2019) using log2 (FPKM + 1) values, z-scaled across samples. Genes (rows) were clustered using Pearson correlation, and samples (columns) were clustered using Euclidean distance. This step was performed in the R statistical environment version 4.0.5.
The gene list obtained from machine learning step was evaluated for known functional processes by the Kyoto Encyclopedia of Genes and Genomes (KEGG) database using the over-representation analysis (ORA) methodology in the WEB-based GEne SeT AnaLysis Toolkit (Liao et al., 2019). We used genome protein-coding as a reference Set. p values were controlled for false discovery rate (FDR) using the Benjamini–Hochberg method, and we considered FDR ≤ 0.05 as significant results.
The half-maximal inhibitory concentration (IC50) z-score values of the drugs with data available in the Genomics of Drug Sensitivity in Cancer (GDSC) repository (Yang et al., 2013) were downloaded for acute leukemia cell lines from GDSC1 dataset (https://www.cancerrxgene.org/downloads/bulk_download). We also downloaded IC50 values of some small-molecule inhibitors from the Supplementary Table S8 of Beat AML dataset (Tyner et al., 2018). The data were obtained from ex vivo functional drug screening analyses using freshly isolated mononuclear cells from AML samples.
To search for drug-gene interactions, for which KMT2A-r cell lines demonstrated sensitivity was used as an input in the web resource Drug-Gene Interaction database (DGIdb; https://www.dgidb.org/search_interactions) (Freshour et al., 2021). The results generated by this tool were downloaded as a tab-separated values (TSV) file.
The ROC curves and AUC values were generated by the CRAN R package “pROC” version 1.17.0.1 (Robin et al., 2011). Association analyses were represented by box plots using the CRAN R package “ggplot2” version 3.3.3 (Wickham, 2016). Expression and IC50 data were compared between two or more groups with the unpaired two-samples Wilcoxon test and the Kruskal-Wallis test, respectively. p-values < 0.05 were considered statistically significant. All analyses presented in this study, with exception of the machine learning step, were performed in the R statistical environment version 4.0.5.
A total of 1,659 acute leukemia samples were evaluated in this study, consisting of 899 AML, 415 B-ALL, 273 T-ALL and 72 ALAL from six different datasets. These samples were mostly obtained at the time of diagnosis (90.3%) and refer to pediatric patients (61.4%) (Table 1). The frequency of cytogenetic/molecular alterations in each acute leukemia subtype is shown in Supplementary Figure S2. We included 121 KMT2A-r cases (7.3%) and classified the other molecular subgroups as KMT2A-WT (n = 1,538; 92.7%). As expected, KMT2A-r were more frequently in the pediatric age group, and less frequently in the older adults, when compared to KMT2A-WT (76.0% vs. 60.3%, and 5.0% vs. 20.4%, respectively; p = 0.0001).
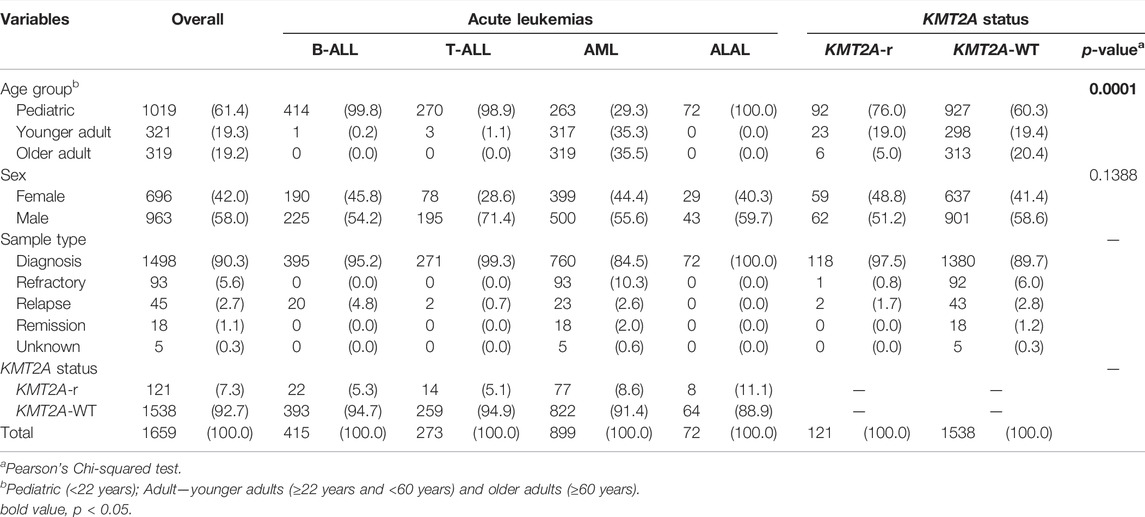
TABLE 1. Cohort characterization.
For the algorithm development, we selected the data from four of the six datasets: TARGET, Beat AML, ALL-Ekert, and AML-Griffioen. We used gene expression data of 14,287 genes from 1,332 acute leukemia samples, including 100 KMT2A-r and 1,232 KMT2A-WT cases. First, we performed a feature selection analysis to reduce the dimensionality of the dataset. As a result, 247 genes were selected due to their potential to predict KMT2A-r (Supplementary File S1), such as CSPG4, MLLT10, MEIS1 and several genes of HOX family (HOXA3, HOXA4, HOXA5, HOXA6, HOXA7, HOXA9 and HOXA10). Among them, 176 genes had increased expression in KMT2A-r acute leukemias (Supplementary Figure S3A). The enrichment analysis revealed a significant association of 13 genes (ETV1, FCGR1A, HOXA10 HOXA9, MEF2C, MEIS1, PBX3, PROM1, RUNX2, SMAD1, SPINT1, SUPT3H and ZEB1) with the “Transcriptional misregulation in cancer” pathway (FDR < 0.001; Supplementary Figure S3B). It is noteworthy that, based on KEGG Gene Set (hsa05202), HOXA9, HOXA10 and MEIS1 have association with differentiation resistance in KMT2A-MLLT1 (or MLL-ENL) T-ALL, while this same biological process has the involvement of PBX3, RUNX2, SMAD1, MEF2C, HOXA9 and HOXA10 in KMT2A-AFF1 (or MLL-AF4) B-ALL. The SUPT3H gene is a chromatin regulator and PROM1 is a signaling mediator, both are also associated with KMT2A-AFF1 (or MLL-AF4) in B-ALL.
With a final dataset composed by 247 genes and 1,332 samples, we randomly split our cohort into 70% training (932 samples, 79 KMT2A-r and 853 KMT2A-WT) and 30% testing (400 samples, 21 KMT2A-r and 379 KMT2A-WT) data subsets (Supplementary Tables S2, S3). First, we used the Random Forest and LightGBM algorithms to build a better model based on the 247 selected features and some well-known features associated with KMT2A-r, such as age group and acute leukemia subtypes. After the KMT2A-r prediction in the testing dataset, we compared the performance measures of each model. In general, we had similar performances between the different models (Supplementary Table S4a). However, we chose the model built with the LightGBM algorithm and 247 genes without clinical variables due to the best combination of AUC, accuracy, sensitivity and specificity (0.988, 0.973, 0.905, 0.976, respectively). In other words, given the testing dataset, our model was able to predict 19 of 21 KMT2A-r patients and 370 of 379 KMT2A-WT patients (Figure 1A). In order to reduce the gene set list, we selected the top 20 genes with the greatest contributions to the prediction of KMT2A-r in the LightGBM algorithm model, as indicated by the Shapley values (Figure 1B). Most genes are upregulated in KMT2A-r patients in comparison to KMT2A-WT patients (Supplementary Figure S3C). In contrast, CPA6, NEDD4, ZNF254 and MYO5C had reduced expression in KMT2A-r cases. We also validated the expression of these genes in human acute leukemia cell lines with and without KMT2A-r. Our results showed the same expression profile observed in acute leukemia patients, given the clusterization of KMT2A-r cell lines (exception of RS4; 11 B-ALL cell line) (Supplementary Figure S4). Together, these data suggest that our model selected a set of genes highly correlated with KMT2A-r.
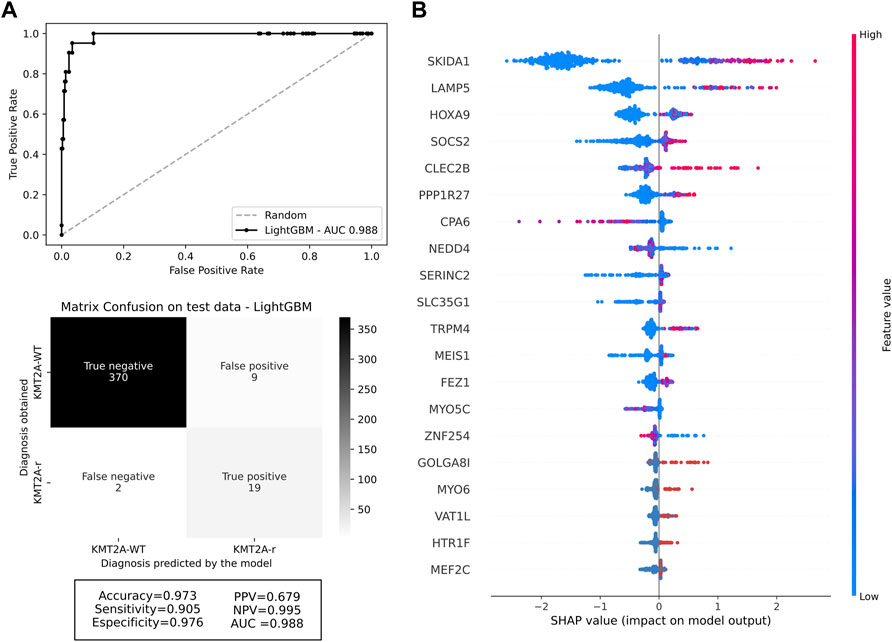
FIGURE 1. Machine learning performance. (A) ROC curve of the selected machine learning model with 247 genes, and the confusion matrix with performance measures of testing data. The darker the quadrant color, the greater the number of patients. Respective performance measures are below the matrix. (B) Feature contributions according to the shapley values. On the x-axis, positive and negative values are correlated with prediction of KMT2A-r and KMT2A-WT, respectively. Each dot represents one patient, colored according to the feature value (red fading to blue means high to low values).
With training and testing data subsets now composed of 20 genes, we used LightGBM algorithms again to build four additional different models also based on selected features and clinical variables associated with KMT2A-r. The performance measures of these models can be accessed in Supplementary Table S4b. We chose the model trained and tested with the 20 genes and acute leukemia subtype variables as our final prediction model for KMT2A-r, with AUC of 0.984, accuracy of 0.970, sensitivity of 0.905, and specificity of 0.974 (Figure 2A). It is noteworthy that, even with a significant reduction of features, our final model was able to predict the KMT2A-r cases with a good performance (19 of 21 KMT2A-r and 369 of 379 KMT2A-WT cases). We observed some feature modifications in Shapley values (Figure 2B), however, the two most relevant genes to the model (SKIDA1 and LAMP5) did not change.
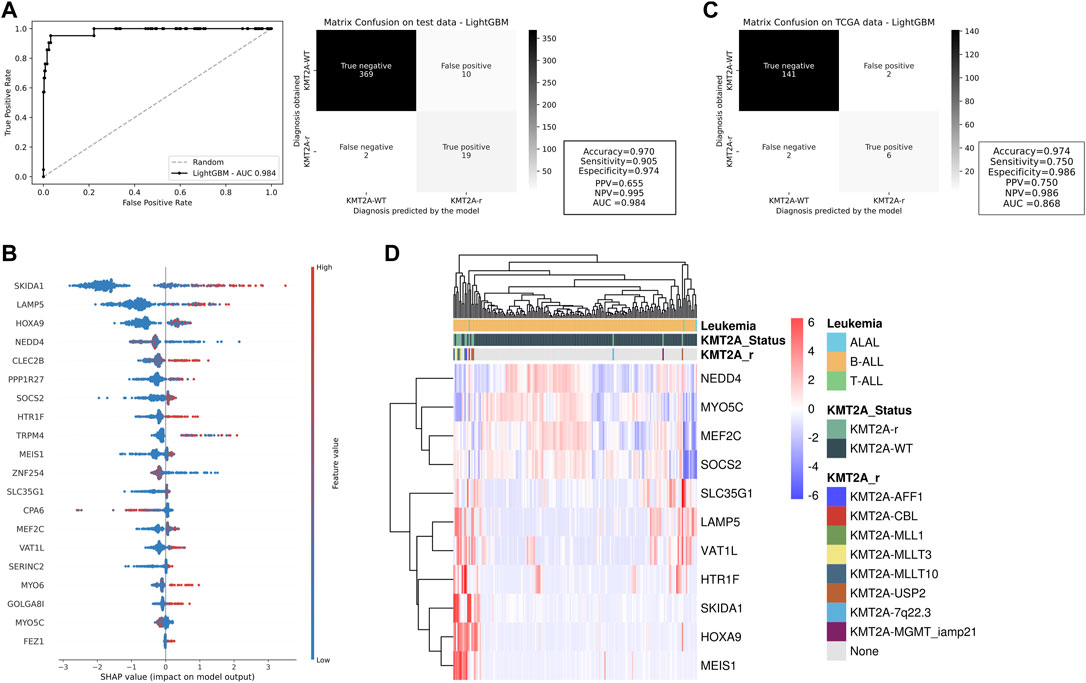
FIGURE 2. Testing and validation of potential KMT2A-r predictors. (A) ROC curve and confusion matrix of the test cohort for the machine learning model with top 20 genes. The darker the quadrant color, the greater the number of patients. The machine learning performance measures are beside the matrix. (B) Feature contributions of each gene included in this model according to the shapley values. On the x-axis, positive and negative values are correlated with prediction of KMT2A-r and KMT2A-WT, respectively. Each dot represents one patient, colored according to the feature value (red fading to blue means high to low values). (C) The performance measures of our model in an independent cohort (TCGA dataset including AML patients), represented by the confusion matrix, and a (D) heatmap illustrating the expression of 11 KMT2A-r predictor genes as indicated by the machine learning analysis. The clusterization was performed in the French dataset with ALL patients.
To validate our KMT2A-r prediction model, we evaluated its performance in an independent subset. The TCGA cohort included 151 AML patients classified according to KMT2A status: KMT2A-WT (n = 143) and KMT2A-r (n = 8). The KMT2A partner genes in these patients were: MLLT10 (n = 1), ELL (n = 3), MLLT3/AF9 (n = 2), and MLLT4 (n = 2). With a whole new set of data, our model was able to correctly predict six of eight KMT2A-r samples and 141 of 143 KMT2A-WT cases. Therefore, we created a good predictor for KMT2A-r samples (AUC = 0.868), with higher accuracy, sensitivity, and specificity (0.974, 0.750, and 0.986, respectively; Figure 2C).
We also analyzed one French dataset, which included 176 pediatric patients with acute leukemia (173 B-ALL, 2 T-ALL, and 1 ALAL), consisting of 163 KMT2A-WT and 13 KMT2A-r. Of notice, KMT2A in-frame fusions were associated with USP2 (n = 3), MLLT10 (n = 3), MLLT3/AF9 (n = 3), AFF1/AF4 (n = 1), and CBL (n = 1). Two patients had out-of-frame fusions with MGMT (n = 1) or within the 7q22.3 region (n = 1). Therefore, we evaluated whether the other genes (11 of 20 genes) would still be able to cluster KMT2A-r patients. As expected, the two samples with out-of-frame did not present a similar expression profile of the other KMT2A fusions, as well as one sample with KMT2A-USP2, which had higher expression of NEDD4 and lower expression of SKIDA1, HOXA9 and MEIS1 (Figure 2D). On the other hand, we demonstrated that our panel of genes is highly associated with the KMT2A-r phenotype. The information regarding false negative and false positive groups were also described (Supplementary Table S5). We observed that KMT2A-r cases wrongly predicted by our model consist of rare fusions, which were under or not represented in the training dataset.
In order to find an optimal biomarker for KMT2A-r identification, we next evaluated the two most important genes ranked by the selected machine learning model (SKIDA1 and LAMP5; Figures 1B, 2B) in comparison with the CSPG4 gene, which encodes NG2. We evaluated their expression by cytogenetic/molecular subgroups of AML, B-ALL, T-ALL, and ALAL (Supplementary Figure S5). Although all genes presented variable expression in individual subgroups of acute leukemia, SKIDA1 had pronounced expression in KMT2A-r compared to the remaining subgroups in all acute leukemia subtypes. SKIDA1 was significantly overexpressed in all molecular subgroups, except for only two subgroups of AML (DEK-NUP214, and other alterations). LAMP5 expression was also not different in DEK-NUP214 and complex karyotype samples when compared to KMT2A-r in AML, as well as hypodiploid cases in B-ALL. Besides that, LAMP5 does not appear to be a good biomarker for KMT2A-r in T-ALL. Similarly, CSPG4 expression was comparable between KMT2A-r and all other subgroups of T-ALL. On the other hand, SKIDA1 had the highest expression in KMT2A-r as compared to all remaining subgroups of T-ALL (p < 0.01).
To evaluate the performance of these genes on KMT2A-r classification, we plotted ROC curves and calculated their respective AUC values among acute leukemia subtypes (Figure 3A). In general, SKIDA1 (AUC: 0.839; CI: 0.799–0.879) and LAMP5 (AUC: 0.746; CI: 0.685–0.806) performed better than CSPG4 (AUC: 0.722; CI: 0.659–0.784). Considering each subtype of leukemia, the most divergent performance was observed in T-ALL, in which SKIDA1 had the best estimates (AUC: 0.991; CI: 0.981–1.000), followed by LAMP5 (AUC: 0.716; CI: 0.570–0.861), and CSPG4 (AUC: 0.558; CI: 0.418–0.698). The most similar results were associated with ALAL, in which those three genes provided optimal estimates of KMT2A-r. Next, we obtained the best thresholds indicated by ROC curves for SKIDA1, LAMP5 and CSPG4 in acute leukemia (1.928, 2.874, and 0.401, respectively), AML (2.303, 6.002, and 1.371, respectively), and B-ALL (0.227, 5.846, and 0.305, respectively) to validate the predictive power of these genes as biomarkers in the TCGA (151 AML patients) and the French (173 B-ALL patients) cohorts. These results were demonstrated through confusion matrices (Supplementary Figure S6) and performance metrics (Supplementary Table S6). Overall, the expression of either SKIDA1 or LAMP5 was more accurate for estimating KMT2A-r as compared with CSPG4 expression. In our validation analyses, SKIDA1 was associated with a higher sensitivity (0.875 vs. CSPG4 = 0.625) and specificity (0.734 vs. CSPG4 = 0.573) in AML, while LAMP5 had greater performance in B-ALL (sensitivity = 0.833 vs. CSPG4 = 0.417; specificity = 0.820 vs. CSPG4 = 0.870) if the overall acute leukemia threshold was used. Similar results were also demonstrated when thresholds for the respective acute leukemia subtype (AML or B-ALL) were used. It is important to highlight that the validation cohort contains three B-ALL patients with KMT2A-USP2. Of note, LAMP5 was extremely overexpressed in these patients (the median FPKM was 122.13, 0.15, 33.25, for KMT2A-USP2, KMT2A-WT, and other molecular subgroups, respectively), thus allowing the prediction of this gene fusion in all cases. On the other hand, CSPG4 failed to predict it in one of these cases, and SKIDA1 was not able to predict this rearrangement in all cases either.
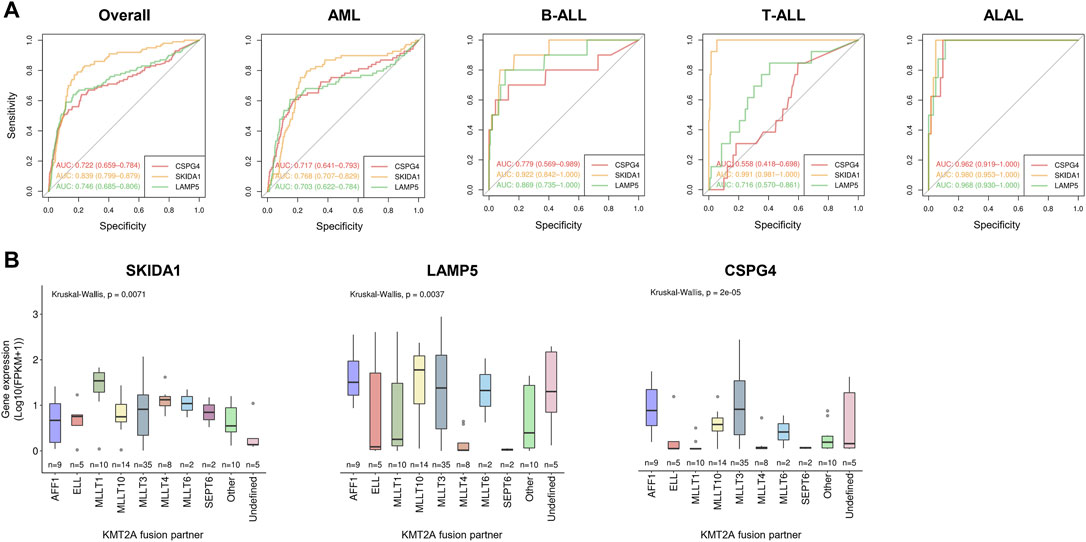
FIGURE 3. Relationship between SKIDA1, LAMP5, and CSPG4 expression and KMT2A-r in acute leukemia. (A) ROC curves and AUC values of each gene transcript according to acute leukemia subtypes. (B) Transcript expression among varied KMT2A fusions.
Because KMT2A is a promiscuous gene and the distribution of fusion partners varies according to leukemia subtypes, we hypothesized that SKIDA1 and LAMP5 expression could be associated with specific gene rearrangements (Supplementary Table S7). The expression of SKIDA1, LAMP5, and CSPG4 varied according to each KMT2A-r, but the latter had the most remarkable variation levels (p = 0.00002). Notably, CSPG4 expression was lower in KMT2A fusions with ELL, MLLT1, MLLT4, and SEPT6. Conversely, SKIDA1 had the lowest expression variation across KMT2A fusions (Figure 3B).
Since KMT2A-r are often associated with chemo-refractory acute leukemia, several studies aimed to search for new possibilities of either new targets or drugs for the treatment of this leukemia subtype. Here, we evaluated drug screening for 33 acute leukemia cell lines (20 AML and 13 ALL) using the IC50s of 345 drugs available in the GDSC database (Supplementary Table S8). After comparing KMT2A-r (n = 6) with KMT2A-WT (n = 27), we observed that KMT2A-r cell lines were more sensitive to 5-Fluorouracil (5FU) and Gemcitabine (both antimetabolite chemotherapy drugs; p = 0.01 and p = 0.04, respectively), WHI-P97 (JAK-3 inhibitor; p = 0.03), Foretinib (MET/VEGFR inhibitor; p = 0.01), SNX-2112 (Hsp90 inhibitor; p = 0.02), AZD6482 (PI3Kβ inhibitor; p = 0.04), KU-60019 (ATM kinase inhibitor; p = 0.04), and Pevonedistat (NEDD8-activating enzyme (NAE) inhibitor; p = 0.03). On the other hand, KMT2A-r cell lines were more resistant to the γ-Secretase inhibitor, Avagacestat (p = 0.005) (Figure 4A). Due to availability of data from analyses of ex-vivo drug sensitivity to a variety of some small-molecule inhibitors, including Foretinib (Tyner et al., 2018), we also evaluated the IC50 values for this drug in AML samples of the Beat AML cohort (nine of 13 KMT2A-r and 247 of 390 KMT2A-WT). We did not observe significant differences between KMT2A-r and other molecular subgroups (Figure 4B). Interestingly, Foretinib is an ATP-competitive inhibitor of tyrosine kinases, and both acute leukemia cell lines with the lowest IC50 values to this drug carried FLT3 activating mutations (MONO-MAC-6, p.V592A; MOLM-13, ITD). When we evaluated the IC50 values in the Beat AML data, we observed that samples with FLT3 activating mutations were significantly more sensitive compared with FLT3-WT samples (Figure 4C).
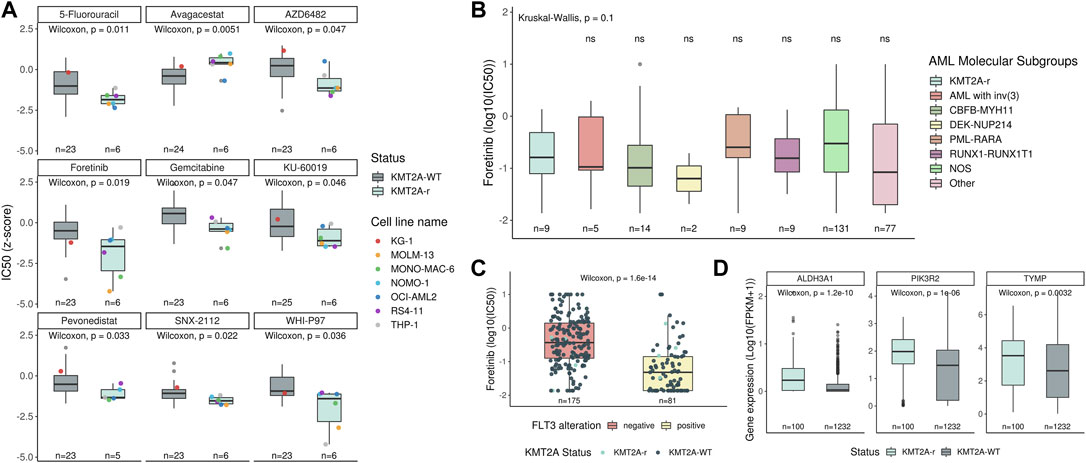
FIGURE 4. Identification of therapeutic drugs for KMT2A-r leukemia. (A) Comparison of the IC50 data, available in the GDSC database, to several drugs between KMT2A-WT and KMT2A-r leukemia cell lines. The KG-1 (red point) is a human AML cell line, with a variant, KG-1a, known to be resistant to chemotherapy. Comparison of the sensitivity to foretinib between (B) AML molecular subgroups and KMT2A-r, as well as (C) FLT3 wild-type (red boxplot) and FLT3 mutated (yellow boxplot). (D) Transcript expression compared between KMT2A-WT and KMT2A-r in acute leukemia samples included in this study.
In order to identify other potential drug-gene interactions, we uploaded a list with these eight drugs, whose KMT2A-r cell lines demonstrated sensitivity, in the DGIdb database. As result, 127 potential targets were found for three drugs (Fluorouracil, Foretinib, Pevonedistat) (Supplementary Table S9). Next, we evaluated if these targets were upregulated in KMT2A-r acute leukemia samples. We found ALDH3A1, PIK3R2, and TYMP expression levels increased in KMT2A-r samples when compared with KMT2A-WT (Figure 4D).
The identification of KMT2A-r at the molecular level is challenging, considering the high number of gene fusions attributed to this group of alterations (Meyer et al., 2018; Meyer et al., 2019). Back in 1996, Bernstein’s group produced a monoclonal antibody (named 7.1) that recognises the CSPG4/NG2, which is a chondroitin sulfate proteoglycan molecule (Smith et al., 1996). The CSPG4 antigen expression was associated with AML-M5 and 11q23 rearrangements, where KMT2A is located. Immunophenotyping of leukemia cells using the 7.1 antibody provided the possibility to estimate the occurrence of KMT2A-r. Further studies have confirmed the association between CSPG4 expression and KMT2A-r in acute leukemia (Wuchter et al., 2000; Schwartz et al., 2003). However, controversies were raised regarding the accuracy of prediction among different centers, age groups, and leukemia subtypes (Emerenciano et al., 2011; Menendez and Bueno, 2011). Here, we have performed machine-learning analyses to provide novel accurate markers for prediction of KMT2A-r in several types of acute leukemia, including AML, B-ALL, T-ALL, and ALAL.
Despite the variable frequency of KMT2A-r between each group of acute leukemia, the high number of gene fusions and dismal outcome of these patients instigated us to develop novel tools for the diagnosis of this disease (Winters and Bernt, 2017; Meyer et al., 2018). The unique gene expression profile observed in KMT2A-r points out one way for discriminating this genetic subtype from other alterations in ALL and AML (Armstrong et al., 2002). Thus, although CSPG4 expression has been widely used for the prediction of KMT2A-r so far, machine learning analyses using transcriptomic data currently allow us to agnostically identify novel markers associated with most acute leukemia cases with KMT2A-r. To our knowledge, this is the first study to investigate the application of machine learning for the prediction of KMT2A-r in acute leukemia. To construct our predictive algorithm, we used RNA-seq data as input, a single approach that can identify many alterations (e.g., fusion transcripts) and provide gene expression profiles. Although it is important to implement this technology for additional clinical benefits (Brown et al., 2020), it is still not used in clinical diagnostics for acute leukemia in many countries, and more accessible methods should be provided to benefit every patient with acute leukemia.
Here, we revealed 20 gene transcripts that, in combination, were able to predict KMT2A-r in acute leukemia. The two most important genes were SKIDA1 and LAMP5. The SKIDA1 gene (also named DLN1/C10orf140) is located at 10p12.31, in very close proximity to MLLT10 (downstream) and ∼340 kb upstream NEBL. Both genes have already been found as partners of KMT2A fusions (Emerenciano et al., 2013; Meyer et al., 2018). Considering that previous studies have reported an increased expression of genes in the vicinity of MLLT10 associated with KMT2A-MLLT10, but not other fusion partners in T-ALL (Dik et al., 2005; Kang et al., 2018), we also analyzed its expression among each KMT2A fusion included in this study. However, we observed that SKIDA1 overexpression was not restricted to KMT2A-MLLT10 positive patients. Because most of our patients were diagnosed with AML (13 out of 14 cases), we speculate that 10p12.2 rearrangements may disturb the expression of other genes within this region or this association could be restricted to T-ALL. Additionally, a recent murine study revealed that Skida1 might cooperate to sustain hematopoietic stem cells and hematopoietic committed progenitor cells presenting KMT2A fusion (Mendoza-Castrejon et al., 2021). The LAMP5 gene is a member of the lysosomal associated membrane protein family, and it is located at the cytogenetic band 20p12.2. LAMP5 is a direct target of the KMT2A fusion protein, which might activate it transcriptionally (Gracia-Maldonado et al., 2021). As a consequence, several studies identified LAMP5 overexpression in KMT2A-r leukemia (Ross et al., 2004; Valk et al., 2004; Zangrando et al., 2009; Stam et al., 2010; Wang et al., 2019). While SKIDA1 protein localizes within the nucleus and cytosol, LAMP5 is associated with endosomes, lysosomes, and the plasma membrane.
The SKIDA1 was the best predictor of KMT2A-r across all subtypes of acute leukemia, especially in B-ALL and T-ALL. Although extensive efforts have been made to evaluate the value of CSPG4 for the prediction of KMT2A-r, most studies were restricted to B-ALL and AML. Moreover, the sensitivity and specificity associated with CSPG4 expression in KMT2A-r acute leukemias is controversial, and many patients harboring KMT2A-r lack its expression (Menendez and Bueno, 2011). Additionally, previous studies have shown that CSPG4 expression is correlated with the degree of maturation arrest in AML (Mauvieux et al., 1999), and higher among patients with AML-M5 (Petrovici et al., 2010). In this context, CSPG4 expression evidences KMT2A-r in the monoblastic population of AML, but fails to indicate this alteration especially for AML-M1 and -M2 (Mauvieux et al., 1999). As discussed, the leukemia phenotype may play a role in dictating CSPG4 expression, and the vast number of fusion transcripts associated with KMT2A-r could impact its expression levels. While SKIDA1 was broadly overexpressed regardless of KMT2A fusion, high levels of CSPG4 were quite restricted to KMT2A-AFF1, KMT2A-MLLT10, KMT2A-MLLT3, and KMT2A-MLLT6. Although Wuchter and collaborators have found no clear correlation between CSPG4 levels by immunophenotyping and KMT2A partners (Wuchter et al., 2000), diverse studies indicate its use in specific types of KMT2A fusions. For instance, the 7.1 antibody distinguished patients with t(4;11) or t(11;19) in childhood ALL (Behm et al., 1996), and another study revealed a lack of expression among t(10;11) and t(11;17) in AML (Hilden et al., 1997). Despite discordances regarding the relationship between CSPG4 expression and KMT2A fusions, differences in 7.1 reactivity in KMT2A-r ALL and AML supports the importance of the identification of alternative markers for prediction of KMT2A-r. We highlight that SKIDA1 is one of the promising markers, which has consistent overexpression among several types of acute leukemia, and no evidence of biased expression toward one KMT2A fusion partner.
Screening methods for the identification of KMT2A-r are expected to be sensitive to detect all or most cases with this genetic alteration. This fact is even more important for rare KMT2A fusions, which are generally not evaluated at routine diagnostics by RT-PCR. Although FISH is one appropriate approach for detecting KMT2A-r in this population, recently we have demonstrated that several patients with KMT2A fusions within its minor breakpoint cluster region appear to be normal at FISH inspection using break apart probes (Meyer et al., 2019). For instance, KMT2A-USP2 fusions are derived from an inversion within 11q23, and FISH is able to indicate KMT2A-r only for those cases accompanied by 3′KMT2A deletion. In this work, we observed that CSPG4 expression was unable to predict all KMT2A-USP2 fusions in B-ALL. Conversely, LAMP5 expression was capable of estimating all of these fusions. Considering the accuracy of those markers for estimating common and rare KMT2A-r within our cohorts, we consider SKIDA1 and LAMP5 expression good predictors of KMT2A-r. SKIDA1 expression may predict those rearrangements in most subtypes of acute leukemia, while LAMP5 presents good performance to point out KMT2A-r in B-ALL and ALAL, including the KMT2A-USP2 fusion. A recent study showed specific expression of LAMP5 on the cell surface of several KMT2A-r cell lines using flow cytometry, and demonstrated that its inhibition reduced cell viability (Gracia-Maldonado et al., 2021). Thus, LAMP5 may serve as both a marker and treatment target in KMT2A-r leukemia.
Over the last decades, a great effort has also been made by the scientific community in the identification of novel effective therapeutic approaches for KMT2A-r acute leukemias due to its association with poor response to standard chemotherapy. With this in mind, we combined IC50 data from several acute leukemia cell lines, drug-gene interaction information, besides transcriptomic analysis to search for new possibilities of targets for the treatment of KMT2A-r leukemia. Our results pointed, at first, to the foretinib (GSK1363089) as a new potential therapeutic agent for this leukemia subtype. Foretinib is an oral multikinase inhibitor targeting MET, RON, AXL, VEGFR, c-KIT, FLT3, and PDGFR signaling pathways. Based on that, we verified that patient’s cells harboring FLT3 mutations, a frequent secondary event in KMT2A-r leukemia, showed higher sensitivity to Foretinib, suggesting that this drug might turn into a therapeutic option for these subgroups. Foretinib has already been used in several cancer treatment trials, including Hepatocellular Carcinoma (NCT00920192), Breast Cancer (NCT01147484, NCT01138384), Non-Small-Cell Lung Cancer (NCT02034097, NCT01068587), Solid Tumours (NCT00742131, NCT00742261, NCT00743067), Head and Neck (NCT00725764), Papillary Renal Cell Carcinoma (NCT00726323), and Gastric Carcinoma (NCT00725712). In leukemia, this drug induces mitotic catastrophe in chronic myelogenous leukemia (CML) cells via JNK-dependent inhibition of Plk1 expression and triggers apoptosis by a caspase 2-mediated mechanism (Dufies et al., 2011). In addition, Schneider and collaborators observed that RAS-mutant KMT2A-r ALL cells treated with DNA methyltransferase inhibitor decitabine in combination with the MEK inhibitor pimasertib strongly decreased cell viability compared to either drug alone. Besides, the combination of foretinib and decitabine also decreased cell viability and indicated moderate synergy in cell lines (Schneider et al., 2020). Although foretinib was not evaluated, Kampen and collaborators had already shown that together both MEK and VEGFR-2 inhibition can induce cell death in a subset of KMT2A-r AML primary samples (Kampen et al., 2014). We also demonstrated that KMT2A-r acute leukemia patients overexpress three genes (ALDH3A1, PIK3R2, and TYMP) with interaction annotation to 5-Fluorouracil. The upregulation of thymidine phosphorylase (TYMP) is commonly associated with 5-fluorouracil resistance (Watson et al., 2010; Peri et al., 2021). However, the TPI, a TYMP inhibitor approved by the US FDA, was associated with a better overall survival of refractory colorectal cancer patients (Mayer et al., 2015). It is important to highlight that ALDH3A1 was also listed among the 247 genes selected for the machine learning model and has already been shown that its selective inhibition by other compounds could increase chemosensitivity in highly ALDH3A1-expressing tumors (Parajuli et al., 2014; Okazaki et al., 2018). PIK3R2 is responsible for coding the subunit beta regulatory component of PI3K and could also be a potential target for the AZD6482 drug, a PI3Kβ inhibitor (Xu et al., 2019; Yang et al., 2019).
In this study, we observed that our algorithm delivered highly accurate predictions for KMT2A-r acute leukemias. Therefore, we were able to point out biomarkers (e.g., SKIDA1 and LAMP5) to predict KMT2A-r regardless of acute leukemia subtypes. Further studies are needed in order to validate these markers and to translate their application into the routine diagnostics of acute leukemia, such as comparing its predictive value compared to CSPG4/NG2 by immunophenotyping. As a highlight, LAMP5 expression was able to predict even the rare gene fusion KMT2A-USP2, which is often missed by routine methods, and that gene product also appears to be a potential treatment target in KMT2A-r leukemia. At last, our analysis suggested Foretinib as one therapeutic option for patients with KMT2A-r, especially those with AML and carrying FLT3 activating mutations. Further clinical studies should now explore the application of this drug for the treatment of KMT2A-r acute leukemia.
Publicly available datasets were analyzed in this study. This data can be found here: https://github.com/bioinformatics-inca/KMT2Ar-prediction (codes for machine learning analysis); https://portal.gdc.cancer.gov/projects (TARGET and TCGA datasets: accession TARGET-AML, TARGET-ALL-P2, TARGET-ALL-P3, and TCGA-LAML).
BL and CP designed the study, prepared data, performed data analyses and wrote the manuscript. CT performed machine learning analyses and contributed to manuscript writing. ACE and HC provided the RNA-seq data of ALL patients for external validation. CM and RM contributed to the external validation step. MB supervised all data analyses and provided important insights to this work. ME designed the study, supervised all data analyses and wrote the manuscript. All authors critically reviewed and approved the final version of the manuscript.
BL, CP, and CT were supported by the Brazilian Ministry of Health. BL received a return fellowship from the Alexander von Humboldt Foundation. ME is supported by Brazilian National Counsel of Technological and Scientific Development-CNPq (PQ-311220/2020-7) and Fundação Carlos Chagas Filho de Amparo à Pesquisa do Estado do Rio de Janeiro-FAPERJ (E_26/203.214/2017; E-26-010.101072-2018; and E-26/010.002187//2019) research grants.
The authors declare that the research was conducted in the absence of any commercial or financial relationships that could be construed as a potential conflict of interest.
The handling Editor declared a past co-authorship/collaboration with one of the authors HC.
All claims expressed in this article are solely those of the authors and do not necessarily represent those of their affiliated organizations, or those of the publisher, the editors and the reviewers. Any product that may be evaluated in this article, or claim that may be made by its manufacturer, is not guaranteed or endorsed by the publisher.
The results published here are in part based upon data generated by the Therapeutically Applicable Research to Generate Effective Treatments (TARGET; https://ocg.cancer.gov/programs/target) initiative, and by the TCGA Research Network (https://www.cancer.gov/tcga). The authors would like to thank Paul Ekert (ALL-Ekert) and Marieke Griffioen (AML-Griffioen) for accepting our request for access to their respective data. The authors would also like to thank the Bioinformatics Core Facility (INCA-RJ) for their support.
The Supplementary Material for this article can be found online at: https://www.frontiersin.org/articles/10.3389/fphar.2022.749472/full#supplementary-material
Arindrarto, W., Borràs, D. M., de Groen, R. A. L., van den Berg, R. R., Locher, I. J., van Diessen, S. A. M. E., et al. (2021). Comprehensive Diagnostics of Acute Myeloid Leukemia by Whole Transcriptome RNA Sequencing. Leukemia 35 (1), 47–61. doi:10.1038/s41375-020-0762-8
Armstrong, S. A., Staunton, J. E., Silverman, L. B., Pieters, R., den Boer, M. L., Minden, M. D., et al. (2002). MLL Translocations Specify a Distinct Gene Expression Profile that Distinguishes a Unique Leukemia. Nat. Genet. 30 (1), 41–47. doi:10.1038/ng765
Behm, F. G., Smith, F. O., Raimondi, S. C., Pui, C. H., and Bernstein, I. D. (1996). Human Homologue of the Rat Chondroitin Sulfate Proteoglycan, NG2, Detected by Monoclonal Antibody 7.1, Identifies Childhood Acute Lymphoblastic Leukemias with T(4;11)(q21;q23) or T(11;19)(q23;p13) and MLL Gene Rearrangements. Blood 87 (3), 1134–1139. doi:10.1182/blood.v87.3.1134.bloodjournal8731134
Bolger, A. M., Lohse, M., and Usadel, B. (2014). Trimmomatic: a Flexible Trimmer for Illumina Sequence Data. Bioinformatics 30 (15), 2114–2120. doi:10.1093/bioinformatics/btu170
Brown, L. M., Lonsdale, A., Zhu, A., Davidson, N. M., Schmidt, B., Hawkins, A., et al. (2020). The Application of RNA Sequencing for the Diagnosis and Genomic Classification of Pediatric Acute Lymphoblastic Leukemia. Blood Adv. 4 (5), 930–942. doi:10.1182/bloodadvances.2019001008
Burmeister, T., Meyer, C., Gröger, D., Hofmann, J., and Marschalek, R. (2015). Evidence-based RT-PCR Methods for the Detection of the 8 Most Common MLL Aberrations in Acute Leukemias. Leuk. Res. 39 (2), 242–247. doi:10.1016/j.leukres.2014.11.017
Colaprico, A., Silva, T. C., Olsen, C., Garofano, L., Cava, C., Garolini, D., et al. (2016). TCGAbiolinks: an R/Bioconductor Package for Integrative Analysis of TCGA Data. Nucleic Acids Res. 44 (8), e71. doi:10.1093/nar/gkv1507
Dik, W. A., Brahim, W., Braun, C., Asnafi, V., Dastugue, N., Bernard, O. A., et al. (2005). CALM-AF10+ T-ALL Expression Profiles Are Characterized by Overexpression of HOXA and BMI1 Oncogenes. Leukemia 19 (11), 1948–1957. doi:10.1038/sj.leu.2403891
Dobin, A., Davis, C. A., Schlesinger, F., Drenkow, J., Zaleski, C., Jha, S., et al. (2013). STAR: Ultrafast Universal RNA-Seq Aligner. Bioinformatics 29 (1), 15–21. doi:10.1093/bioinformatics/bts635
Dufies, M., Jacquel, A., Robert, G., Cluzeau, T., Puissant, A., Fenouille, N., et al. (2011). Mechanism of Action of the Multikinase Inhibitor Foretinib. Cell Cycle 10 (23), 4138–4148. doi:10.4161/cc.10.23.18323
Durinck, S., Moreau, Y., Kasprzyk, A., Davis, S., De Moor, B., Brazma, A., et al. (2005). BioMart and Bioconductor: a Powerful Link between Biological Databases and Microarray Data Analysis. Bioinformatics 21 (16), 3439–3440. doi:10.1093/bioinformatics/bti525
Durinck, S., Spellman, P. T., Birney, E., and Huber, W. (2009). Mapping Identifiers for the Integration of Genomic Datasets with the R/Bioconductor Package biomaRt. Nat. Protoc. 4 (8), 1184–1191. doi:10.1038/nprot.2009.97
Eckardt, J-N., Bornhäuser, M., Wendt, K., and Middeke, J. M. (2020). Application of Machine Learning in the Management of Acute Myeloid Leukemia: Current Practice and Future Prospects. Blood Adv. 4 (23), 6077–6085. doi:10.1182/bloodadvances.2020002997
Emerenciano, M., Renaud, G., Sant’Ana, M., Barbieri, C., Passetti, F., Pombo-de-Oliveira, M. S., et al. (2011). Challenges in the Use of NG2 Antigen as a Marker to Predict MLL Rearrangements in Multi-Center Studies. Leuk. Res. 35 (8), 1001–1007. doi:10.1016/j.leukres.2011.03.006
Emerenciano, M., Kowarz, E., Karl, K., de Almeida Lopes, B., Scholz, B., Bracharz, S., et al. (2013). Functional Analysis of the Two Reciprocal Fusion Genes MLL-NEBL and NEBL-MLL Reveal Their Oncogenic Potential. Cancer Lett. 332 (1), 30–34. doi:10.1016/j.canlet.2012.12.023
Freshour, S. L., Kiwala, S., Cotto, K. C., Coffman, A. C., McMichael, J. F., Song, J. J., et al. (2021). Integration of the Drug-Gene Interaction Database (DGIdb 4.0) with Open Crowdsource Efforts. Nucleic Acids Res. 49 (D1), D1144–D1151. doi:10.1093/nar/gkaa1084
Fritz, C., Portwood, S. M., Przespolewski, A., and Wang, E. S. (2021). PARP Goes the Weasel! Emerging Role of PARP Inhibitors in Acute Leukemias. Blood Rev. 45, 100696. doi:10.1016/j.blre.2020.100696
Gao, Q., Liang, W-W., Foltz, S. M., Mutharasu, G., Jayasinghe, R. G., Cao, S., et al. (2018). Driver Fusions and Their Implications in the Development and Treatment of Human Cancers. Cell Rep. 23 (1), 227–238.e3. doi:10.1016/j.celrep.2018.03.050
Gao, G. F., Parker, J. S., Reynolds, S. M., Silva, T. C., Wang, L-B., Zhou, W., et al. (2019). Before and after: Comparison of Legacy and Harmonized TCGA Genomic Data Commons’ Data. Cell Syst. 9 (1), 24–34.e10. doi:10.1016/j.cels.2019.06.006
Ghandi, M., Huang, F. W., Jané-Valbuena, J., Kryukov, G. V., Lo, C. C., McDonald, E. R., et al. (2019). Next-generation Characterization of the Cancer Cell Line Encyclopedia. Nature 569 (7757), 503–508. doi:10.1038/s41586-019-1186-3
Gracia-Maldonado, G., Clark, J., Burwinkel, M., Greenslade, B., Wunderlich, M., Salomonis, N., et al. (2021). LAMP-5 Is an Essential Inflammatory-Signaling Regulator and Novel Immunotherapy Target for Mixed Lineage Leukemia-Rearranged Acute Leukemia. Haematologica 107 (4), 803–815. doi:10.3324/haematol.2020.257451
Hilden, J. M., Smith, F. O., Frestedt, J. L., McGlennen, R., Howells, W. B., Sorensen, P. H., et al. (1997). MLL Gene Rearrangement, Cytogenetic 11q23 Abnormalities, and Expression of the NG2 Molecule in Infant Acute Myeloid Leukemia. Blood 89 (10), 3801–3805. doi:10.1182/blood.v89.10.3801.3801_3801_3805
Jagga, Z., and Gupta, D. (2014). Classification Models for Clear Cell Renal Carcinoma Stage Progression, Based on Tumor RNAseq Expression Trained Supervised Machine Learning algorithmsProceedings of the Great Lakes Bioinformatics Confer. BMC Proc. 8S2 (Suppl. 6). doi:10.1186/1753-6561-8-S6-S2
Kampen, K. R., Ter Elst, A., Mahmud, H., Scherpen, F. J. G., Diks, S. H., Peppelenbosch, M. P., et al. (2014). Insights in Dynamic Kinome Reprogramming as a Consequence of MEK Inhibition in MLL-Rearranged AML. Leukemia 28 (3), 589–599. doi:10.1038/leu.2013.342
Kang, H., Sharma, N. D., Nickl, C. K., Devidas, M., Loh, M. L., Hunger, S. P., et al. (2018). Dysregulated Transcriptional Networks in KMT2A- and MLLT10-Rearranged T-ALL. Biomark. Res. 6, 27. doi:10.1186/s40364-018-0141-z
Kerstjens, M., Pinhancos, S. S., Castro, P. G., Schneider, P., Wander, P., Pieters, R., et al. (2018). Trametinib Inhibits RAS-Mutant MLL-Rearranged Acute Lymphoblastic Leukemia at Specific Niche Sites and Reduces ERK Phosphorylation In Vivo. Haematologica 103 (4), e147–50. doi:10.3324/haematol.2017.174060
Kolde, R. (2019). Pheatmap: Pretty Heatmaps. [Internet]. Available from: https://CRAN.R-project.org/package=pheatmap (cited Jun 30, 2021)
Kursa, M. B., and Rudnicki, W. R. (2010). Feature Selection with the Boruta Package. J. Stat. Softw. 36 (11), 1–13. doi:10.18637/jss.v036.i11
Li, B., and Dewey, C. N. (2011). RSEM: Accurate Transcript Quantification from RNA-Seq Data with or without a Reference Genome. BMC Bioinforma. 12, 323. doi:10.1186/1471-2105-12-323
Liao, Y., Wang, J., Jaehnig, E. J., Shi, Z., and Zhang, B. (2019). WebGestalt 2019: Gene Set Analysis Toolkit with Revamped UIs and APIs. Nucleic Acids Res. 47 (W1), W199–W205. doi:10.1093/nar/gkz401
Liu, Y., Easton, J., Shao, Y., Maciaszek, J., Wang, Z., Wilkinson, M. R., et al. (2017). The Genomic Landscape of Pediatric and Young Adult T-Lineage Acute Lymphoblastic Leukemia. Nat. Genet. 49 (8), 1211–1218. doi:10.1038/ng.3909
Lundberg, S. M., and Lee, S-I. (2017). in Advances in Neural Information Processing Systems 30 [Internet]. Editors I. Guyon, U. V. Luxburg, S. Bengio, H. Wallach, R. Fergus, S. Vishwanathanet al. (Curran Associates, Inc.). Available from: http://papers.nips.cc/paper/7062-a-unified-approach-to-interpreting-model-predictions.pdf (cited Apr 12, 2022).
Mansur, M. B., Ford, A. M., and Emerenciano, M. (2017). The Role of RAS Mutations in MLL-Rearranged Leukaemia: A Path to Intervention? Biochim. Biophys. Acta Rev. Cancer 1868 (2), 521–526. doi:10.1016/j.bbcan.2017.10.005
Mauvieux, L., Delabesse, E., Bourquelot, P., Radford-Weiss, I., Bennaceur, A., Flandrin, G., et al. (1999). NG2 Expression in MLL Rearranged Acute Myeloid Leukaemia Is Restricted to Monoblastic Cases. Br. J. Haematol. 107 (3), 674–676. doi:10.1046/j.1365-2141.1999.01730.x
Mayer, R. J., Van Cutsem, E., Falcone, A., Yoshino, T., Garcia-Carbonero, R., Mizunuma, N., et al. (2015). Randomized Trial of TAS-102 for Refractory Metastatic Colorectal Cancer. N. Engl. J. Med. 372 (20), 1909–1919. doi:10.1056/NEJMoa1414325
McCarthy, D. J., Chen, Y., and Smyth, G. K. (2012). Differential Expression Analysis of Multifactor RNA-Seq Experiments with Respect to Biological Variation. Nucleic Acids Res. 40 (10), 4288–4297. doi:10.1093/nar/gks042
Mendoza-Castrejon, J., Casey, E. B., Patel, R. M., and Magee, J. A. (2021). SKIDA1 Sustains MLL-ENL-Expressing Hematopoietic Stem and Progenitor Cells. Blood 138 (Suppl. 1), 3294. doi:10.1182/blood-2021-148604
Menendez, P., and Bueno, C. (2011). Expression of NG2 Antigen in MLL-Rearranged Acute Leukemias: How Complex Does it Get? Leuk. Res. 35 (8), 989–990. doi:10.1016/j.leukres.2011.03.015
Meyer, C., Burmeister, T., Gröger, D., Tsaur, G., Fechina, L., Renneville, A., et al. (2018). The MLL Recombinome of Acute Leukemias in 2017. Leukemia 32 (2), 273–284. doi:10.1038/leu.2017.213
Meyer, C., Lopes, B. A., Caye-Eude, A., Cavé, H., Arfeuille, C., Cuccuini, W., et al. (2019). Human MLL/KMT2A Gene Exhibits a Second Breakpoint Cluster Region for Recurrent MLL-USP2 Fusions. Leukemia 33 (9), 2306–2340. doi:10.1038/s41375-019-0451-7
Okazaki, S., Shintani, S., Hirata, Y., Suina, K., Semba, T., Yamasaki, J., et al. (2018). Synthetic Lethality of the ALDH3A1 Inhibitor Dyclonine and xCT Inhibitors in Glutathione Deficiency-Resistant Cancer Cells. Oncotarget 9 (73), 33832–33843. doi:10.18632/oncotarget.26112
Parajuli, B., Fishel, M. L., and Hurley, T. D. (2014). Selective ALDH3A1 Inhibition by Benzimidazole Analogues Increase Mafosfamide Sensitivity in Cancer Cells. J. Med. Chem. 57 (2), 449–461. doi:10.1021/jm401508p
Pedregosa, F., Varoquaux, G., Gramfort, A., Michel, V., Thirion, B., Grisel, O., et al. (2011). Scikit-Learn: Machine Learning in Python [Internet]. Available from: https://jmlr.csail.mit.edu/papers/v12/pedregosa11a.html (cited Jul 1, 2021).
Peri, S., Biagioni, A., Versienti, G., Andreucci, E., Staderini, F., Barbato, G., et al. (2021). Enhanced Vasculogenic Capacity Induced by 5-Fluorouracil Chemoresistance in a Gastric Cancer Cell Line. Int. J. Mol. Sci. 22 (14), 7698. doi:10.3390/ijms22147698
Petrovici, K., Graf, M., Hecht, K., Reif, S., Pfister, K., and Schmetzer, H. (2010). Use of NG2 (7.1) in AML as a Tumor Marker and its Association with a Poor Prognosis. Cancer Genomics Proteomics 7 (4), 173–180.
Ritchie, M. E., Phipson, B., Wu, D., Hu, Y., Law, C. W., Shi, W., et al. (2015). Limma Powers Differential Expression Analyses for RNA-Sequencing and Microarray Studies. Nucleic Acids Res. 43 (7), e47. doi:10.1093/nar/gkv007
Robin, X., Turck, N., Hainard, A., Tiberti, N., Lisacek, F., Sanchez, J-C., et al. (2011). pROC: an Open-Source Package for R and S+ to Analyze and Compare ROC Curves. BMC Bioinforma. 12, 77. doi:10.1186/1471-2105-12-77
Robinson, M. D., McCarthy, D. J., and Smyth, G. K. (2010). edgeR: a Bioconductor Package for Differential Expression Analysis of Digital Gene Expression Data. Bioinformatics 26 (1), 139–140. doi:10.1093/bioinformatics/btp616
Ross, M. E., Mahfouz, R., Onciu, M., Liu, H-C., Zhou, X., Song, G., et al. (2004). Gene Expression Profiling of Pediatric Acute Myelogenous Leukemia. Blood 104 (12), 3679–3687. doi:10.1182/blood-2004-03-1154
Schneider, P., Castro, P. G., Pinhanços, S. M., Kerstjens, M., Roon, E. H., Essing, A. H. W., et al. (2020). Decitabine Mildly Attenuates MLL ‐rearranged Acute Lymphoblastic Leukemia In Vivo, and Represents a Poor Chemo‐sensitizer. eJHaem 1 (2), 527–536. doi:10.1002/jha2.81
Schwartz, S., Rieder, H., Schläger, B., Burmeister, T., Fischer, L., and Thiel, E. (2003). Expression of the Human Homologue of Rat NG2 in Adult Acute Lymphoblastic Leukemia: Close Association with MLL Rearrangement and a CD10(-)/CD24(-)/CD65s(+)/CD15(+) B-Cell Phenotype. Leukemia 17 (8), 1589–1595. doi:10.1038/sj.leu.2402989
Shiba, N., Yoshida, K., Hara, Y., Yamato, G., Shiraishi, Y., Matsuo, H., et al. (2019). Transcriptome Analysis Offers a Comprehensive Illustration of the Genetic Background of Pediatric Acute Myeloid Leukemia. Blood Adv. 3 (20), 3157–3169. doi:10.1182/bloodadvances.2019000404
Smith, F. O., Rauch, C., Williams, D. E., March, C. J., Arthur, D., Hilden, J., et al. (1996). The Human Homologue of Rat NG2, a Chondroitin Sulfate Proteoglycan, Is Not Expressed on the Cell Surface of Normal Hematopoietic Cells but Is Expressed by Acute Myeloid Leukemia Blasts from Poor-Prognosis Patients with Abnormalities of Chromosome Band 11q23. Blood 87 (3), 1123–1133. doi:10.1182/blood.v87.3.1123.bloodjournal8731123
Stam, R. W., Schneider, P., Hagelstein, J. A. P., van der Linden, M. H., Stumpel, D. J. P. M., de Menezes, R. X., et al. (2010). Gene Expression Profiling-Based Dissection of MLL Translocated and MLL Germline Acute Lymphoblastic Leukemia in Infants. Blood 115 (14), 2835–2844. doi:10.1182/blood-2009-07-233049
Steinhilber, D., and Marschalek, R. (2018). How to Effectively Treat Acute Leukemia Patients Bearing MLL-Rearrangements. Biochem. Pharmacol. 147, 183–190. doi:10.1016/j.bcp.2017.09.007
Tsakaneli, A., and Williams, O. (2021). Drug Repurposing for Targeting Acute Leukemia with KMT2A (MLL)-Gene Rearrangements. Front. Pharmacol. 12, 741413. doi:10.3389/fphar.2021.741413
Tyner, J. W., Tognon, C. E., Bottomly, D., Wilmot, B., Kurtz, S. E., Savage, S. L., et al. (2018). Functional Genomic Landscape of Acute Myeloid Leukaemia. Nature 562 (7728), 526–531. doi:10.1038/s41586-018-0623-z
Valk, P. J. M., Verhaak, R. G. W., Beijen, M. A., Erpelinck, C. A. J., Barjesteh van Waalwijk van Doorn-Khosrovani, S., Boer, J. M., et al. (2004). Prognostically Useful Gene-Expression Profiles in Acute Myeloid Leukemia. N. Engl. J. Med. 350 (16), 1617–1628. doi:10.1056/NEJMoa040465
Walter, W., Haferlach, C., Nadarajah, N., Schmidts, I., Kühn, C., Kern, W., et al. (2021). How Artificial Intelligence Might Disrupt Diagnostics in Hematology in the Near Future. Oncogene 40 (25), 4271–4280. doi:10.1038/s41388-021-01861-y
Wang, W-T., Han, C., Sun, Y-M., Chen, Z-H., Fang, K., Huang, W., et al. (2019). Activation of the Lysosome-Associated Membrane Protein LAMP5 by DOT1L Serves as a Bodyguard for MLL Fusion Oncoproteins to Evade Degradation in Leukemia. Clin. Cancer Res. 25 (9), 2795–2808. doi:10.1158/1078-0432.CCR-18-1474
Watson, R. G., Muhale, F., Thorne, L. B., Yu, J., O’Neil, B. H., Hoskins, J. M., et al. (2010). Amplification of Thymidylate Synthetase in Metastatic Colorectal Cancer Patients Pretreated with 5-Fluorouracil-Based Chemotherapy. Eur. J. Cancer 46 (18), 3358–3364. doi:10.1016/j.ejca.2010.07.011
Wickham, H. (2016). ggplot2: Elegant Graphics for Data Analysis (Use R). 2nd ed. New York, NY: Springer.
Winters, A. C., and Bernt, K. M. (2017). MLL-rearranged Leukemias-An Update on Science and Clinical Approaches. Front. Pediatr. 5, 4. doi:10.3389/fped.2017.00004
Wong, N-H. M., and So, C. W. E. (2020). Novel Therapeutic Strategies for MLL-Rearranged Leukemias. Biochim. Biophys. Acta Gene Regul. Mech. 1863 (9), 194584. doi:10.1016/j.bbagrm.2020.194584
Wuchter, C., Harbott, J., Schoch, C., Schnittger, S., Borkhardt, A., Karawajew, L., et al. (2000). Detection of Acute Leukemia Cells with Mixed Lineage Leukemia (MLL) Gene Rearrangements by Flow Cytometry Using Monoclonal Antibody 7.1. Leukemia 14 (7), 1232–1238. doi:10.1038/sj.leu.2401840
Xu, Z., Zhou, Y., Cao, Y., Dinh, T. L. A., Wan, J., and Zhao, M. (2016). Identification of Candidate Biomarkers and Analysis of Prognostic Values in Ovarian Cancer by Integrated Bioinformatics Analysis. Med. Oncol. 33 (11), 130. doi:10.1007/s12032-016-0840-y
Xu, P-F., Yang, J-A., Liu, J-H., Yang, X., Liao, J-M., Yuan, F-E., et al. (2019). PI3Kβ Inhibitor AZD6482 Exerts Antiproliferative Activity and Induces Apoptosis in Human Glioblastoma Cells. Oncol. Rep. 41 (1), 125–132. doi:10.3892/or.2018.6845
Yang, W., Soares, J., Greninger, P., Edelman, E. J., Lightfoot, H., Forbes, S., et al. (2013). Genomics of Drug Sensitivity in Cancer (GDSC): a Resource for Therapeutic Biomarker Discovery in Cancer Cells. Nucleic Acids Res. 41 (Database issue), D955–D961. doi:10.1093/nar/gks1111
Yang, J., Nie, J., Ma, X., Wei, Y., Peng, Y., and Wei, X. (2019). Targeting PI3K in Cancer: Mechanisms and Advances in Clinical Trials. Mol. Cancer 18 (1), 26. doi:10.1186/s12943-019-0954-x
Keywords: KMT2A, MLL, acute leukemia, biomarker, machine learning, therapy
Citation: Lopes BA, Poubel CP, Teixeira CE, Caye-Eude A, Cavé H, Meyer C, Marschalek R, Boroni M and Emerenciano M (2022) Novel Diagnostic and Therapeutic Options for KMT2A-Rearranged Acute Leukemias. Front. Pharmacol. 13:749472. doi: 10.3389/fphar.2022.749472
Received: 29 July 2021; Accepted: 04 May 2022;
Published: 06 June 2022.
Edited by:
Stefania Bortoluzzi, University of Padua, ItalyReviewed by:
Luca Agnelli, National Cancer Institute Foundation (IRCCS), ItalyCopyright © 2022 Lopes, Poubel, Teixeira, Caye-Eude, Cavé, Meyer, Marschalek, Boroni and Emerenciano. This is an open-access article distributed under the terms of the Creative Commons Attribution License (CC BY). The use, distribution or reproduction in other forums is permitted, provided the original author(s) and the copyright owner(s) are credited and that the original publication in this journal is cited, in accordance with accepted academic practice. No use, distribution or reproduction is permitted which does not comply with these terms.
*Correspondence: Mariana Emerenciano, bWVtZXJlbmNpYW5vQGluY2EuZ292LmJy
†These authors share first authorship
Disclaimer: All claims expressed in this article are solely those of the authors and do not necessarily represent those of their affiliated organizations, or those of the publisher, the editors and the reviewers. Any product that may be evaluated in this article or claim that may be made by its manufacturer is not guaranteed or endorsed by the publisher.
Research integrity at Frontiers
Learn more about the work of our research integrity team to safeguard the quality of each article we publish.