 Wenzhao Zhong1†
 Jun Lu
 Dan Shao
 Ging Chan
 Meiwan Chen
95% of researchers rate our articles as excellent or good
Learn more about the work of our research integrity team to safeguard the quality of each article we publish.
Find out more
ORIGINAL RESEARCH article
Front. Pharmacol. , 10 November 2022
Sec. Experimental Pharmacology and Drug Discovery
Volume 13 - 2022 | https://doi.org/10.3389/fphar.2022.1044083
This article is part of the Research Topic The Strategy of Enhancing Efficiency and Reducing the Toxicity of Monomeric Ingredients in Traditional Medicine View all 3 articles
Chemodynamic therapy (CDT) eradicates tumors by intratumoral catalytic chemical reaction and subsequently disrupts redox homeostasis, which shows tumor specific reactive oxygen species (ROS)-mediated therapy. However, insufficient ROS generation and high levels of glutathione (GSH) in cancer cells have limited the therapeutic efficacy of CDT. Herein, we constructed a multifunctional oxidative stress nanoamplifier with ROS amplification and GSH exhaustion for enhanced CDT. Such a sandwich-like nanoamplifier comprised layer-by-layer artesunate (AS) and calcium carbonate coatings on the surface of manganese dioxide (MnO2) nanoparticles. The nanoamplifier was disassembled under an acidic environment once accumulated into tumor sites, and subsequently released AS to replenish the intratumoral peroxide pool for ROS amplification. Besides being an AS carrier, MnO2 exhausted GSH to yield Mn2+ ions that catalyzed the overexpression of H2O2 in the tumor, further intensifying the oxidative stress and facilitating cancer cell death. Taken together, our findings not only provide a paradigm for fabricating intratumoral catalytic nanomaterials, but also present a new ROS enhancement strategy to improve anti-tumor efficacy. Our multifunctional oxidative stress nanoamplifier might broaden the future of CDT.
Dynamic therapy, a clinically promising treatment modality that utilizes in situ generation of reactive oxygen species (ROS) to eradicate malignant cancer, has attracted significant attention for its advantages in overcoming multidrug resistant (MDR) cancer (Wang S. et al., 2021). Chemodynamic therapy (CDT) catalyzes intratumoral overexpressed hydrogen peroxide (H2O2) to generate highly cytotoxic hydroxyl radical (·OH), which circumvents the major limitations of hypoxia and light penetration in clinically approved dynamic therapy including photodynamic and sonodynamic therapy (Tang et al., 2019; Zhou et al., 2021). Although intracellular H2O2 levels in tumor tissues are higher than normal cells, the endogenous concentration of the peroxide pool is still insufficient for satisfactory chemodynamic efficacy (Zhou et al., 2021). Moreover, overexpressed glutathione (GSH) is the major ROS scavenger in tumor, which plays an important role in protecting cells from various injuries, and increases resistance to chemotherapy, radiotherapy and dynamic therapy (Shao et al., 2020; Chen et al., 2022). Conceivably, GSH is another challenging obstacle for effective CDT in cancer cells, which leads to insufficient radical generation for tumor oxidative damage (Chen et al., 2020; Wang et al., 2020; Shi et al., 2021). Thus, it is imperative but challenging to develop novel Fenton-like mediated ROS nanoamplifiers for GSH exhaustion and peroxide replenishment to enhance the efficacy of CDT.
Manganese dioxide (MnO2) can consume intratumoral protons to release Fenton-like Mn2+ ions (Wang et al., 2022). In addition, MnO2 can directly undergo a redox reaction with GSH to yield glutathione disulfide (GSSG) and Mn2+ ions, which enhances CDT by simultaneously generating ·OH and disrupting the cellular antioxidant defense system (Lin L.-S. et al., 2018). It is worth noting that the bicarbonate (HCO3−) is indispensable for Mn2+-mediated Fenton-like reaction (Li et al., 2016). Fortunately, HCO3− is one of the important physiological buffers and can be continuously generated via carbonic anhydrase IX (CA IX) for Mn2+-mediated Fenton-like reaction to intensify the intratumoral oxidative stress (Stadtman et al., 1990; Yim et al., 1990; Lin L. S. et al., 2018). However, the therapeutic efficacy of Mn2+-mediated CDT is also compromised by insufficient H2O2 (∼100 μM) in tumor microenvironment (Fu et al., 2021; Liu B. et al., 2022). Therefore, it is imperative to develop a peroxide replenishment approach to increase the concentration of intratumoral peroxide species, which overcomes the endogenous H2O2 insufficiency and achieves satisfactory Mn2+-mediated CDT efficacy.
In this regard, there are two main strategies to replenish intratumoral peroxide species including amplification of H2O2 production and delivery of other peroxide compounds. Some of the natural endoperoxide compounds such as artesunate (AS) can serve as exogenous peroxide species for replenishing the shortage of intracellular peroxide pools and boosting the Mn2+-mediated CDT (Lin et al., 2020; Wang D. et al., 2021; Jin et al., 2021). Therefore, delivery of AS demonstrates the prominent advantages in overcoming insufficient H2O2 for effective CDT. However, administered AS inevitably undergoes rapid decomposition before accumulation in tumor to initiate Fenton-type reactions, resulting in low availability of exogenous peroxide replenishment for ROS production. A nanocarrier with tumor microenvironment-responsive property is thus necessary for controllable release of AS. Recently, calcium carbonate (CaCO3) nanomaterials have been utilized as surface coating materials to protect the inner core from leakage or degradation, and to endow controllable degradation with pH-responsive properties for precise cancer therapy (Wan et al., 2019; Chang et al., 2020). The CaCO3 layers will first degrade into HCO3− and Ca2+ ions in acidic tumor microenvironment. The release of Ca2+ ions is accumulated within cancer cells, resulting in Ca2+ ions overload due to the disturbance of intracellular Ca2+ ions homeostasis, which may aggravate the intratumoral oxidative stress (Bagur and Hajnóczky, 2017). Besides, the release of HCO3− facilitates the Mn2+-mediated Fenton reaction for enhanced CDT. Collectively, the rational integration of AS, CaCO3 and MnO2 will not only improve the bioavailability and stability of AS, but also amplify the intratumoral oxidative stress through peroxide species replenishment and HCO3− ion-assisted CDT based on Mn2+-mediated Fenton-like reaction.
Herein, we designed a facile strategy to fabricate a tumor microenvironment-activatable oxidative stress nanoamplifier for enhanced CDT through ROS amplification and GSH exhaustion. The nanoamplifier exhibited a sandwich structure, and the middle layer of CaCO3 was coated on the surface of MnO2 (MnO2@CaCO3@AS) to avoid the contact with AS, preventing from premature decomposition of AS. In the design, CaCO3 also provides anchor points for AS self-assembly on its surface through the coordination interaction between Ca2+ and carboxyl group of AS, achieving high drug loading. The nanoamplifiers were disassembled under mild acidic environment, resulting in the release of AS for peroxide species replenishment. Meanwhile, the exposure of MnO2 further consumed GSH to yield Mn2+ ions for ROS generation through in situ catalyzation of overexpressed H2O2 and the delivered AS. The PEGylated liposome was coated on the surface of nanoamplifier (MnO2@CaCO3@AS@PEG, denoted as MCAP) to improve colloidal stability, which facilitated the cellular uptake. Taken together, the MCAP nanoamplifier was designed to amplify intracellular ROS levels and consume GSH, collectively disrupting the intratumoral redox balance to achieve efficient tumor eradication. Our multifunctional oxidative stress nanoamplifiers might provide a facile but intriguing strategy to enhance CDT through peroxide species replenishment, ROS amplification and GSH exhaustion.
Anhydrous calcium chloride (CaCl2), poly(allylamine hydrochloride) (PAH, MW∼15,000), poly(acrylic acid) (PAA, MW∼2000), 3,3′,5,5′-tetramethylbenzidine (TMB), methylene blue (MB), amiloride hydrochloride and rhodamine 123 (Rhd 123) were purchased from Macklin Biochemical Co., Ltd (Shanghai, China). Artesunate (AS), glutathione (GSH), sodium bicarbonate (NaHCO3), 1-ethyl-3-(3-dimethylaminopropyl)carbodiimide (EDC), cholesterol, chlorpromazine hydrochloride, 5,5′-dithio-bis-(2-nitrobenzoic acid) (DTNB), genistein, colchicine and DMSO were obtained from Aladdin (Shanghai, China). Ammonium bicarbonate (NH4HCO3) and 3-[4,5-dimethylthiazol-2-yl]-2,5 diphenyl tetrazolium bromide (MTT) were purchased from Sigma-Aldrich (Saint Louis, United States). 1,2-dioleoyl-sn-glycero-3-phosphate (sodium salt) (DOPA) was purchased from Avanti (Alabama, United States). 1,2-dihexadecanoly-sn-glycero-3-phosphocholine (DPPC) was purchased from Xi’an ruixi Biological Technology Co., Ltd (Xi’ an, China). N-(Carbonyl-methoxypolyethylene glycol 2000)-1,2-distearoyl-sn-glyverol-3-phosphoethanolamine sodium salt (DSPE-mPEG2k) was purchased from AVT (Shanghai, China). mPEG2k-NH2 was purchased from ShangHai ToYangBio Tech.Inc. (Shanghai, China). Sodium hydroxide (NaOH) and hydrogen peroxide (H2O2) were purchased from Xilong Scientific Co., Ltd (Shantou, China). Anhydrous manganese (II) chloride (MnCl2) was obtained from Energy Chemical (Shanghai, China). 1,1′-Dioctadecyl-3,3,3′,3′-tetramethylindotricarbocyanine iodide (DiR) was obtained from AAT Bioquest (California, United States). Anhydrous ethanol was obtained from Sinopharm Chemical Reagent., Ltd (Beijing, China). Chloroform was obtained from DAMAO CHEMICAL REAGENT FACTORY (Tianjin, China). Fluo-4 AM, DCFH-DA, Hoechst 33,342 and crystal violet were obtained from Beyotime Biotechnology (Shanghai, China). BODIPY™ 493/503 and ThiolTracker™ Violet were obtained from Thermofisher (Massachusetts, United States). Ultrapure water was obtained from Milli-Q systems (Merck Millipore, United States).
4 mg of potassium permanganate and 8 mg of PAH were both dissolved in 40 ml of ultrapure water and the mixture was stirred for 10 min. Next, the mixed solution was transferred into Ultra-15 Centrifugal Filter Units (MWCO: 100 kDa) under 4000 rpm for 10 min to purify MnO2 nanoparticles. The purification process was repeated with ultrapure water for three times. After that, MnO2 nanoparticles were obtained by centrifugation at 12500 rpm for 5 min to remove any large particles. For PEGylation, MnO2 aqueous solution (10 mg) was mixed with PAA aqueous solution (10 mg) with magnetic stirring at room temperature for 4 h. Next, the above solution was transferred into Ultra-15 Centrifugal Filter Units (MWCO: 100 kDa) under 4000 rpm for 5 min to remove unbound PAA. After ultra-centrifugation, the solution was reacted with mPEG-NH2 (50 mg) and EDC (15 mg) under magnetic stirring at room temperature overnight, followed by the ultra-centrifugation to obtain the MnO2@PEG nanoparticles.
MnO2@CaCO3 nanoparticles were synthesized by gas diffusion method. Briefly, 250 μl of MnO2 aqueous solution was added into 100 ml of anhydrous ethanol containing 40 mg of CaCl2 under sonication in a glass beaker. The glass beaker was put into a sealed chamber containing 3 g of NH4HCO3. After maintaining the whole system at 40°C for 10 h, MnO2@CaCO3 nanoparticles were obtained by centrifugation at 10,000 rpm for 15 min and re-dispersed in ethanol for further drug loading and modification.
2.5 ml of MnO2@CaCO3 solutions (4 mg/ml) was added with 0.5 ml of AS ethanol solution (10 mg/ml) under magnetic stirring at room temperature for 2 h. The MnO2@CaCO3@AS nanoparticles were obtained by centrifugation at 10,000 rpm for 15 min and re-dispersed in ethanol. For the surface modification, the MnO2@CaCO3@AS nanoparticles then were mixed with 1 ml of DOPA chloroform solution (2 mg/ml) under sonication for 20 min. After centrifugation to remove excess DOPA, the precipitation was re-suspended with 2 ml of chloroform, following by the addition of 1 ml of DPPC chloroform solution (4 mg/ml), 1 ml of cholesterol chloroform solution (2 mg/ml) and 1 ml of DSPE-PEG2k chloroform solution (8 mg/ml). The mixture was stirred overnight at room temperature. Finally, the MnO2@CaCO3@AS@PEG nanoparticles were collected by evaporation and re-dispersion in ultrapure water for further use.
Nanoparticles without PEGylation (MnO2@CaCO3@AS) or with PEGylation (MnO2@CaCO3@AS@PEG) were dispersed into ultrapure water, PBS and RPMI-1640 containing 10% FBS, respectively. The particle size of nanoparticles at each time point was monitored by Nano ZS90 Malvern Zetasizer (Malvern, England).
The quantification of AS was detected by UV-vis-NIR spectrometer (PerkinElmer, United States). Briefly, nanoparticles were dispersed in 2% NaOH solution containing 50% ethanol and incubated for 30 min at 60°C to allow AS being completely converted into UV-absorbing compounds. After cooling down to room temperature and centrifugation to remove any large particles, the supernatant was used to measure the loading content of AS by recording the absorbance at 290 nm. The DLC% and EE% of AS in nanoparticles were calculated as followed:
pH-responsive and GSH-responsive release profile of nanoparticles: To measure the tumor microenvironment-triggered release of manganese ions and AS from nanoparticles, MnO2@CaCO3@AS@PEG was placed into a dialysis bag (MWCO: 3500) and immersed with 10 ml buffer solution at pH 7.4 (10 mM) and pH 5.6 (10 mM) with or without GSH (10 mM) for different times. At designated time points, 1 ml of solution was collected to determine the release profile and then 1 ml of fresh buffer solution was added. The concentration of manganese ions was determined by inductively coupled plasma mass spectrometry (Thermo Fisher, United States), and the concentration of AS was measured by UV-vis-spectrometry.
MB (10 μg/ml), H2O2 (1 mM), Mn2+ (0.5 mM) and HCO3− (6.25, 12.5, 25, 50, or 100 mM) were incubated in 1 ml of aqueous solutions at room temperature for 30 min. The generation of ROS was monitored by the decreasing absorbance at 660 nm.
MB (10 μg/ml), H2O2 (1 mM), MnO2 (0.5 mM equivalent to Mn2+) and GSH (0.1, 0.5, 1, 5 and 10 mM) were incubated in 1 ml of aqueous solutions at room temperature for 30 min. The generation of ROS was monitored by the decreasing absorbance at 660 nm.
GSH (0.5 mM) and MnO2 (0.1, 0.2, 0.4, 0.6, 0.8, and 1.0 mM) were incubated in 990 μL aqueous solution at room temperature for 10 min. Next. 10 μL of DTNB solutions (10 mM, pH 8.3) was added into the above solutions. After incubation at room temperature for 10 min, the depletion of GSH was monitored by the decreasing absorbance at 412 nm.
TMB (1 mg/ml), AS (10 mM) and Mn2+ (2.5, 5, 10, 20, 40 and 60 mM) were incubated in 1 ml DMSO-H2O solutions (v/v, 4/6) at room temperature for 30 min. The generation of ROS was monitored by the increasing absorbance at 660 nm.
Murine CT26 colon cancer cells obtained from American Type Culture Collection (ATCC) were cultured with Roswell Park Memorial Institute (RPMI) 1640 medium containing 10% fetal bovine serum and 1% penicillin/streptomycin in standard condition (37°C, 5% CO2).
CT26 cells pre-seeded in 24-well cell culture plates (5 x 10⁴ cells per well) were incubated with DiR-labeled MnO2@CaCO3@AS@PEG nanoparticles for different times (0, 1, 2, and 4 h). After removal of cell culture medium containing nanoparticles, cells were rinsed by PBS and stained with Hoechst 33342 at 37°C for 10 min. Next, cells were washed with PBS and observed by DMi8 fluorescence microscope (Leica, Germany). For quantification analysis, cells were collected and then analyzed with a flow cytometer (Beckman Coulter, America) to monitor the fluorescence signal. To investigate the mechanism of cellular internalization, CT26 cells were pre-treated with chlorpromazine hydrochloride (20 μM), genistein (200 μM), amiloride hydrochloride (100 μM) and colchicine (10 μM) or pre-incubated at 4°C for 1 h, following by the incubation with DiR-labeled MnO2@CaCO3@AS@PEG nanoparticles for another 2 h. After being stained with Hoechst 33342, cells were observed by fluorescence microscope for visualization and were analyzed by flow cytometry for quantification.
CT26 cells pre-seeded in 96-well cell culture plates (1 x 10⁴ cells per well) were treated with AS or nanoparticles for 24 h. After removal of the supernatant, cells were added with MTT and incubated at 37°C for 4 h. Next, the MTT solution was removed and 100 μl of DMSO was added into each well of cell culture plate. The cell viability was then measured with microplate reader (Molecular Devices, Canada) by detecting the absorbance at 490 nm.
CT26 cells pre-seeded in 24-well culture plate (5 x 10⁴ cells per well) were treated with AS, MnO2@CaCO3@PEG and MnO2@CaCO3@AS@PEG for 24 h. The concentration of AS, Mn2+ and Ca2+ were 0.2 mM, 0.2 mM and 1.0 mM, respectively, in the corresponding group. Next, the live/dead staining assay of treated cells was analyzed by Calcein/PI Cell Viability/Cytotoxicity Assay Kit (Beyotime, China).
CT26 cells pre-seeded in 6-well culture plate (500 cells per well) was treated with AS, MnO2@CaCO3@PEG and MnO2@CaCO3@AS@PEG for 24 h. The concentration of AS, Mn2+ and Ca2+ were 0.1 mM, 0.1 mM and 0.5 mM, respectively, in the corresponding group. Next, the cells were cultured in fresh medium for 10 days. Finally, CT26 cells were fixed with 4% paraformaldehyde at room temperature for 15 min and subsequently were stained with crystal violet for 15 min.
CT26 cells pre-seeded in 24-well culture plate (5 x 10⁴ cells per well) were treated with AS, MnO2@CaCO3@PEG and MnO2@CaCO3@AS@PEG for 24 h. The concentration of AS, Mn2+ and Ca2+ were 0.1 mM, 0.1 mM and 0.5 mM, respectively, in the corresponding group. Next, the cell cycle assay of treated cells was analyzed by Cell Cycle and Apoptosis Analysis Kit (Beyotime, China).
CT26 cells pre-seeded in 24-well culture plate (5 x 10⁴ cells per well) were treated with AS, MnO2@CaCO3@PEG and MnO2@CaCO3@AS@PEG for 12 h. The concentration of AS, Mn2+ and Ca2+ were 0.2, 0.2, and 1.0 mM, respectively, in the corresponding group. After removal of the supernatant, cells were stained with intracellular calcium ion indicators Fluo-4 AM and Hoechst 33,342 for 20 min. Next, cells were observed by fluorescence microscope for visualization and were analyzed by flow cytometry for quantification.
CT26 cells pre-seeded in 24-well culture plate (5 x 10⁴ cells per well) were treated with AS, MnO2@CaCO3@PEG and MnO2@CaCO3@AS@PEG for 24 h. The concentration of AS, Mn2+ and Ca2+ were 0.2, 0.2, and 1.0 mM, respectively, in the corresponding group. After removal of the supernatant, cells were stained with Rhd 123 and Hoechst 33342 for 20 min. Next, cells were observed by fluorescence microscope for visualization.
CT26 cells pre-seeded in 24-well culture plate (5 x 10⁴ cells per well) were treated with AS, MnO2@CaCO3@PEG and MnO2@CaCO3@AS@PEG for 12 h. The concentration of AS, Mn2+ and Ca2+ were 0.2, 0.2, and 1.0 mM, respectively, in the corresponding group. After removal of the supernatant, cells were stained with ThiolTracker™ Violet for 20 min, following by the observation with fluorescence microscope and quantification with flow cytometry.
CT26 cells pre-seeded in 24-well culture plate (5 x 10⁴ cells per well) were treated with AS, MnO2@CaCO3@PEG and MnO2@CaCO3@AS@PEG for 24 h. The concentration of AS, Mn2+ and Ca2+ were 0.2, 0.2, and 1.0 mM, respectively, in the corresponding group. Next, cells were stained with DCFH-DA and Hoechst 33342 for 20 min, following by the observation with fluorescence microscope and quantification with flow cytometry.
CT26 cells pre-seeded in 24-well culture plate (5 x 10⁴ cells per well) were treated with AS, MnO2@CaCO3@PEG and MnO2@CaCO3@AS@PEG for 24 h. The concentration of AS, Mn2+ and Ca2+ were 0.2, 0.2, and 1.0 mM, respectively, in the corresponding group. Next, cells were stained with BODIPY™ 493/503 and Hoechst 33342 for 20 min, following by the observation with fluorescence microscope and quantification with flow cytometry.
All data were presented as mean ± SD without specifying. The significant difference was determined by the student’s t-test using GraphPad Prism 7. p-value less than 0.05 (denoted as *), 0.01 (denoted as **) and 0.001 (denoted as ***) was considered statistical significance.
We firstly evaluated ROS generation ability of manganese-based materials with different concentrations of HCO3−. Methylene blue (MB) was used as an indicator of ·OH to reflect the efficiency of Mn2+-mediated Fenton-like reaction. As shown in Figure 1A, no obvious decrease in the MB absorbance and color fading was observed when MB was mixed with Mn2+ ions and H2O2 solution, indicating that Mn2+ ion-mediated Fenton-like reaction yielded insufficient ROS in the absence of HCO3−. When the concentration of HCO3− gradually increased, an obvious decrease in MB absorbance at 660 nm was monitored by UV-Vis-NIR spectrum and the blue color of MB gradually faded, implying that HCO3− was indispensable in Mn2+-mediated ROS generation. Also, the degradation level of MB was correlated with the concentration of Mn2+ ions (Supplementary Figure S1A) and the reaction time (Supplementary Figure S1B). Collectively, these studies revealed that Mn2+-driven Fenton-like reaction can effectively produce ·OH in physiological environment. Furthermore, the ·OH-induced MB degradation was greatly inhibited in the presence of GSH as shown in Supplementary Figure S2, revealing that GSH as an intracellular antioxidant significantly scavenged ROS and impeded the therapeutic effect of CDT. Thus, a manganese-based materials with the ability of GSH depletion was highly desired to achieve efficient CDT.
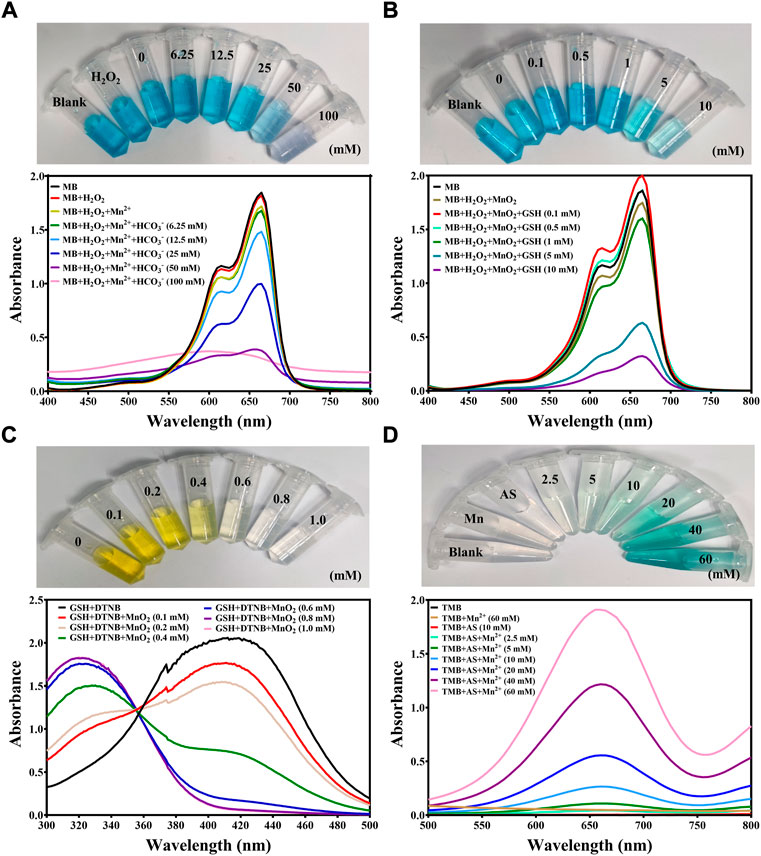
FIGURE 1. Investigation of ROS generation from manganese-based materials. (A) UV-Vis-NIR spectrum of MB (10 μg/ml) before and after being incubated in H2O2 (1 mM), Mn2+ (0.5 mM) and HCO3− (6.25, 12.5, 25, 50 or 100 mM) at room temperature for 30 min. The inserted photo represented the color change of MB before and after being incubated in different solutions at room temperature for 30 min (B) UV-Vis-NIR spectrum of MB (10 μg/ml) before and after being incubated in H2O2 (1 mM), MnO2 (0.5 mM equivalent to Mn2+) and GSH (0.1, 0.5, 1, 5, and 10 mM) at room temperature for 30 min. The inserted photo represented the color change of MB before and after being incubated in different solutions at room temperature for 30 min (C) UV-Vis-NIR spectrum exhibiting the GSH depletion of solutions when incubated with GSH (0.5 mM), DTNB (0.1 mM) and MnO2 (0.1, 0.2, 0.4, 0.6, 0.8 and 1.0 mM) at room temperature. The inserted photo represented the color change of GSH depletion process. (D) UV-Vis-NIR spectrum of TMB (1 mg/ml) before and after being incubated with AS (10 mM) and Mn2+ (2.5, 5, 10, 20, 40, and 60 mM) at room temperature for 30 min. The inserted photo represented the color change of TMB before and after being incubated in different solutions at room temperature for 30 min.
It has been reported that MnO2 could consume GSH to enhance various dynamic therapy (Liu Q. et al., 2022; Guan et al., 2022; Sun et al., 2022). Therefore, we examined the possibility of using MnO2 nanoparticles to generate toxic ·OH as well as exhaust intracellular GSH. It was found that MnO2 nanoparticles obviously degraded MB in the presence of GSH (Figure 1B, Supplementary Figures S2, S3), which was attributed to the GSH-responsive Mn2+ release from MnO2 to initiate the ROS generation. In the meanwhile, the MnO2 was on-demanded degradation in response to GSH in a concentration-dependent manner (Supplementary Figure S4). Next, the GSH depletion ability of MnO2 nanoparticles was determined. As shown in Figure 1C, DTNB was used to detect the residual concentration of GSH to yield a yellow color product with strong absorbance at 412 nm. When MnO2 nanoparticles were added, GSH was rapidly oxidized into GSSG, indicating the ability of MnO2 to exhaust GSH (Figure 1C).
Delivering exogenous peroxide compounds that generate ROS with the assistance of transition metal ions would avoid the restriction of insufficient endogenous peroxide compounds and boost the ROS generation. AS, a natural product with an endoperoxide bridge, is found to produce ROS in the presence of manganese ions (Wang D. et al., 2021). Hence, we further examined the ROS generation ability of AS in the presence of manganese-based materials. It was discovered that TMB was oxidized into blue-color compound ox-TMB and stronger absorbance at 660 nm was recorded when the concentration of Mn2+ ions increased, implying that AS served as a fuel to aggravate the intracellular ROS level with the assistance of manganese-based materials (Figure 1D and Supplementary Figure S5). Collectively, we hypothesized that MnO2 nanoparticles could serve ideal igniters to explode the endogenous peroxide pool and artesunate could serve as fuel to replenish the peroxide pools. Therefore, synchronous delivery of MnO2 nanoparticles and AS would be a promising strategy to intensify the intracellular oxidative stress for efficient tumor eradication.
The preparation procedure of MnO2@CaCO3@AS@PEG nanoparticles (denoted as MCAP NPs) was illustrated in Figure 2A to achieve co-delivery of MnO2 and AS. Briefly, MnO2 nanoparticles were firstly prepared through permanganates reduction method (Supplementary Figure S6). The transmission electron microscopy (TEM) images showed that the obtained MnO2 was a spherical structure with the average size of about 10 nm (Figure 2E). To encapsulate AS, MnO2 nanoparticles were subsequently coated with CaCO3 via a one-pot gas diffusion method. The core-shell structure of MnO2@CaCO3 revealed that MnO2 was successful coated by a layer of CaCO3 (Figure 2E). The as-prepared MnO2@CaCO3 nanoparticle showed dark yellow color and its hydrodynamic size was increased to about 100 nm (Figure 2B). Due to the coordination interaction between Ca2+ ion and carboxyl group of AS, the CaCO3 shell coated on MnO2 nanoparticles served as anchor points for AS loading. As displayed in Supplementary Figure S7B, the peak at 730 cm−1 and 825 cm−1 were observed in MnO2@CaCO3@AS nanoparticles, which was assigned to the endoperoxide bridge (O-O) of AS (Vacque et al., 1997; Wan et al., 2019; Chen et al., 2021). Besides, the C=O stretching vibrations of AS showed a characteristic peak at 1758 cm−1 in Supplementary Figure S7C. When AS was loaded on the CaCO3-based nanoparticles, the peak was observed to shift about 10 cm−1 to 1748 cm−1, implying that calcium ions coordinated with the carboxyl group of AS (Byler and Farrell, 1989). By simply mixing AS and MnO2@CaCO3 nanoparticles in ethanol at a mass feeding ratio of 0.5:1 at room temperature for 2 h, AS was self-assembly on the surface of MnO2@CaCO3 and the drug-loading nanoparticles (MnO2@CaCO3@AS) with relative high AS encapsulation efficiency (∼45.2%) and high AS loading capacity (∼15.1%) were obtained. (Supplementary Figure S8 and Figure 2C).
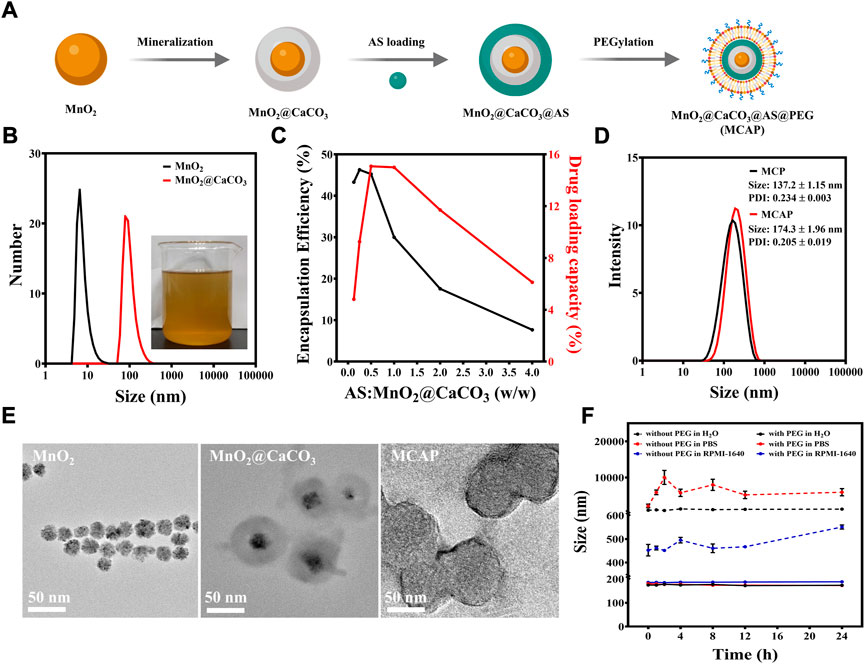
FIGURE 2. Preparation and characterization of MCAP NPs. (A) The preparation procedure of MCAP NPs. (B) DLS measurements of MnO2 and MnO2@CaCO3 nanoparticles in ethanol. The inserted photo represents the MnO2@CaCO3 nanoparticles in ethanol synthesized through the gas-diffusion method. (C) Quantification of AS loading capacity of MnO2@CaCO3 nanoparticles at different AS:MnO2@CaCO3 feeding ratios. (D) DLS measurement of MnO2@CaCO3@PEG (MCP) nanoparticles and MnO2@CaCO3@AS@PEG (MCAP) nanoparticles in aqueous solutions. (E) Respective TEM images of MnO2 nanoparticles, MnO2@CaCO3 nanoparticles and MCAP NPs. (F) Time-dependent DLS variations of MnO2@CaCO3@AS nanoparticles with or without PEGylation incubated in different solutions for 24 h.
Then, MnO2@CaCO3@AS nanoparticles were modified with a lipid bilayer through previous methods to confer better physiological stability for tumor-specific ROS amplification (Zhong et al., 2022). The dynamic light scattering (DLS) measurement exhibited that the hydrodynamic size of MnO2@CaCO3@AS@PEG nanoparticles (MCAP NPs) was ∼174 nm. In contrast, the hydrodynamic size of MnO2@CaCO3@PEG nanoparticles was ∼137 nm, which was slightly smaller than that of their corresponding AS-loaded counterparts (Figure 2D). To investigate whether modification of nanoparticles with lipid bilayer could improve their physiological stability, MnO2@CaCO3@AS nanoparticles with or without PEGylation were incubated with different solutions including ultrapure water, PBS and cell culture medium for 24 h. It was found that MnO2@CaCO3@AS nanoparticles with PEGylation exhibited negligible fluctuation in all testing conditions during the incubation time. Additionally, the hydrodynamic size and polydispersity index of MnO2@CaCO3@AS nanoparticles with PEGylation were less than 200 nm (Figure 2F) and 0.3 (Supplementary Figure S9), respectively. However, the hydrodynamic size of MnO2@CaCO3@AS nanoparticles without PEGylation showed huge variation in testing conditions and large aggregates were observed in PBS solutions (Figure 2F), implying that surface modification with lipid bilayers indeed endow the nanoparticles with excellent stability in a physiological environment.
Given that the concentration of intracellular GSH within cancer cells is higher than that in normal cells and the endo-/lysosomal lumen maintains low pH, MCAP NPs were then incubated in normal physiological environment (pH 7.4) as well as cancer intracellular condition (pH 5.6 + GSH) to evaluate the drug release profile. It was found that less Mn2+ and AS were released from MCAP NPs in a normal physiological environment, which was ascribed to the inert property of CaCO3 and MnO2 in a neutral solution. However, more than 80% of Mn2+ and AS were released from MCAP NPs in mimic intracellular conditions (Supplementary Figure S10). This could be ascribed to the pH-responsive degradation of CaCO3 and MnO2 as well as GSH-sensitive disassembly of MnO2, together accelerating the decomposition of MCAP NPs and the release of therapeutic cargoes for tumor-specific ROS amplification therapy.
Efficient cellular uptake of nanoparticles is essential for cancer cell eradication. Therefore, it is necessary to investigate the endocytosis pathways of MCAP NPs firstly. MCAP NPs were labeled with red fluorescent probes DiR to visualize the cellular internalization process. As shown in Supplementary Figures S11A,B and Figure 3B, CT26 cells incubated with DiR-labelled MCAP NPs exhibited a time-dependent internalization profile. A strong fluorescence signal was observed when CT26 cells were incubated with nanoparticles for 4 h, demonstrating the efficient internalization of MCAP NPs by CT26 cells. It is the prerequisite to achieving efficient tumor eradication by aggravating the intracellular oxidative stress using ROS nanoamplifiers MCAP NPs.
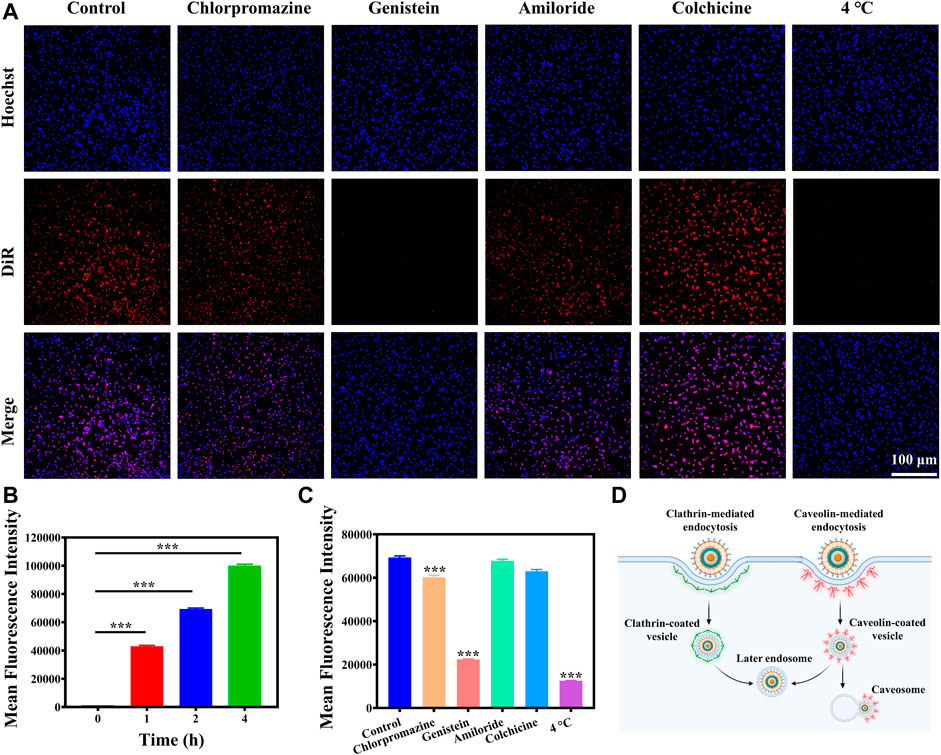
FIGURE 3. Cellular uptake and mechanism. (A) Fluorescence images of CT26 cells pre-treated with inhibitors and then incubated with DiR-labelled MCAP NPs for 2 h. (B) Flow cytometry analysis of CT26 cells incubated with DiR-labelled MCAP NPs for different times. (C) Flow cytometry analysis of CT26 cells pre-treated with inhibitors and then incubated with DiR-labelled MCAP NPs for 2 h (D) A scheme illustrated the possible cellular uptake mechanism and intracellular trafficking of MCAP NPs in CT26 cells (***p < 0.001, **p < 0.01, *p < 0.05).
Next, we further investigated the internalization mechanism of nanoparticles by pre-treating cells with inhibitors or in 4°C environment. Almost no red fluorescence signal was detected when CT26 cells were pre-incubated in 4°C condition, manifesting that CT26 cells internalized MCAP NPs in an energy-dependent mechanism (Figures 3A,C and Supplementary Figure S11C). Then, CT26 cells were pre-treated with different uptake inhibitors for 1 h including chlorpromazine (clathrin-mediated endocytosis inhibitor), genistein (caveolae-mediated endocytosis inhibitors), amiloride (micropinocytosis inhibitors) and colchicine (microtubules associated transport inhibitors). Fluorescence imaging and flow cytometry analysis revealed that CT26 cells pretreated with chlorpromazine and genistein exhibited lower intracellular uptake of MCAP NPs as compared to control groups and other inhibitors pre-treatment groups (Figures 3A,C and Supplementary Figure S11C), displaying that MCAP NPs entered CT26 cells via clathrin-/caveolae-mediated endocytosis. Collectively, we proposed the possible cellular uptake mechanism and intracellular trafficking of MCAP NPs based on the experiment results and related literature. As illustrated in Figure 3D, the ROS nanoamplifiers MCAP NPs were internalized by CT26 colon cancer cells through clathrin-/caveolin-mediated endocytosis and this endocytosis process relied on an energy-dependent mechanism. On one hand, MCAP NPs entrapped in the clathrin-coated vesicle would fuse with early endosomes to form late endosomes, which eventually fused with lysosomes (Kaksonen and Roux, 2018). The lower pH environment of lysosomes as well as the higher GSH content within cancer cells would trigger the burst release of Mn2+ ions and AS (Supplementary Figure S10) to intensify the intracellular ROS level. On the other hand, MCAP NPs entrapped in caveolin-coated vesicles would partially fuse with endosomes or form caveosomes to deliver cargo to the Golgi apparatus and endoplasmic reticulum (Donahue et al., 2019).
After careful investigation of cellular uptake profile of CT26 cells on MCAP NPs, we then evaluated the cytotoxic effect of nanoparticles on cellular level. As illustrated in Figure 4A, AS exhibited moderate inhibition effect on CT26 cells. Additionally, MCP NPs that were composed of MnO2 and CaCO3 also displayed moderate cytotoxicity on CT26 cells. Among various treatment approaches, MCAP NPs that synchronously delivered MnO2, AS and CaCO3 showed the highest cytotoxic effect on CT26 cancer cells, which was consistent with the results of live-dead staining (Figure 4B). Afterward, we analyzed how the compositions of MCAP NPs demonstrated the synergistic anticancer effect on CT26 cells. As shown in Supplementary Figure S12, physically mixing AS and MnO2 exhibited a stronger inhibition effect than AS or MnO2 along, which indicated that AS and MnO2 might enhance the anticancer efficiency of each other in a synergistic mechanism. Similarly, physically combining AS and CaCO3 also showed an enhanced cytotoxic effect on CT26 cells as compared to single treatment at low concentrations. Taken together, the highest cytotoxic effect of MCAP NPs among various treatment approaches might be related to the synergistic effect among AS, MnO2 and CaCO3.
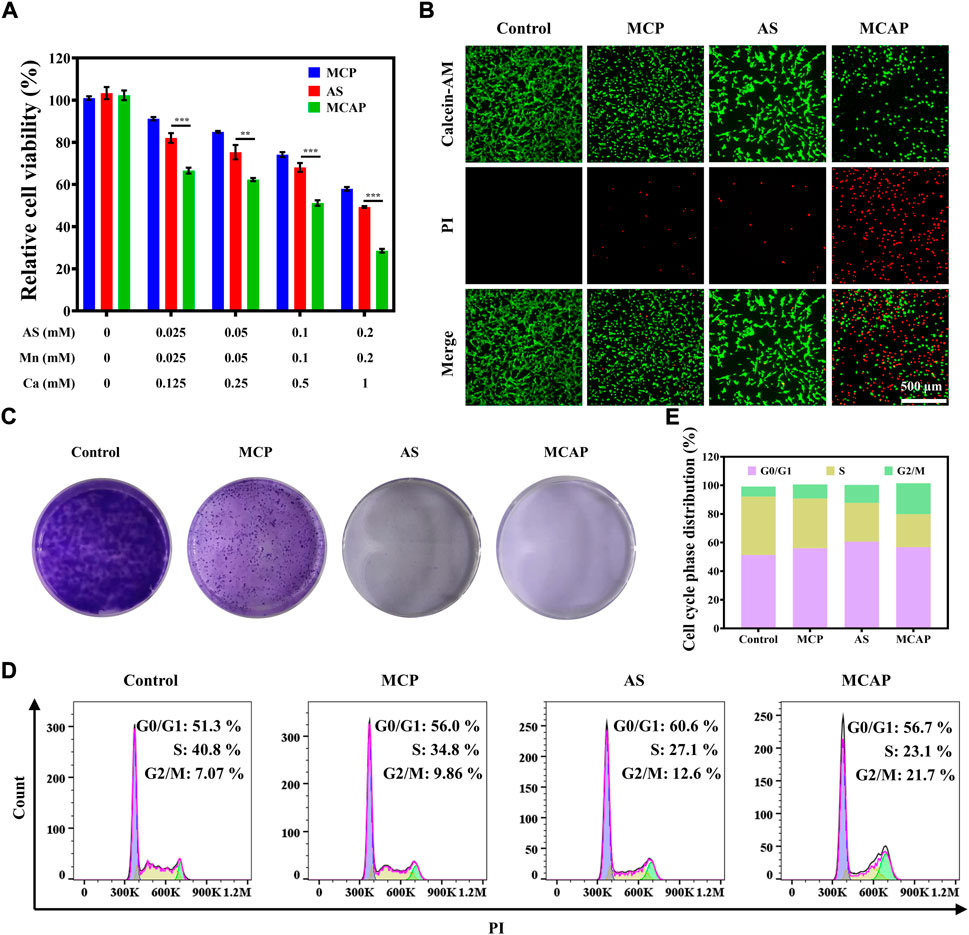
FIGURE 4. In vitro anticancer effect of MCAP NPs on CT26 cells. (A) Relative cell viability of CT26 cells after being treated with AS, MCP NPs and MCAP NPs for 24 h. (B) Fluorescence images of CT26 cells treated with various formulations and stained with Calcein-AM (live cells: green color) and PI (dead cells: red color). (C) The colony formation of CT26 cells after various treatments. (D). (E) Flow cytometry analysis of cell cycle phase distribution of CT26 cells after various treatments (***p < 0.001, **p < 0.01, *p < 0.05).
The colony formation assay is a widely accepted method to assess the reproductive viability of cancer cells after being exposed to various treatment strategies. As shown in Figure 4C, CT26 cells treated with various agents exhibited impaired ability to form colonies compared with control group. Most importantly, cells being exposed to AS and MCAP NPs displayed the least capacity in colony formation, which may provide hints for the potential application of ROS nanoamplifiers MCAP NPs in in vivo anticancer evaluation. Finally, we estimated the cell cycle phase distribution of CT26 cells after treatments. As compared to the control group, treatments with MCP NPs, AS and MCAP NPs induced different levels of G2/M phase arrest in CT26 cells. Among all, CT26 cells treated with MCAP NPs exhibited the longest extension at the G2/M phase, indicating that intracellular DNA in this treatment group might suffer from severe damage (Figures 4D,E) (Wang et al., 2016). This observation was consistent with other ROS-mediated anticancer therapies as accumulated ROS within cancer cells were reported to induce G2/M phase arrest (Gong et al., 2020; Kong et al., 2020; Tan et al., 2020). Overall, CT26 cells treated with ROS nanoamplifiers MCAP NPs displayed the highest cytotoxicity and increased arrest at G2/M phase, contributing to the superior suppression of colony formation.
Inspired by the efficient cancer eradication effect of MCAP NPs on CT26 cells, the intracellular oxidative stress caused by ROS nanoamplifiers MCAP NPs were further evaluated. Considering that CaCO3 was one of the components in the nanoparticles, and calcium-based nanomaterials have been utilized to amplify tumor oxidative stress through Ca2+-overloading-mediated mitochondrial dysfunction, we firstly determined the intracellular Ca2+ ion level as well as mitochondrial membrane potential. As illustrated in Supplementary Figure S13, CT26 cells treated with AS, MCP NPs and MCAP NPs all displayed different levels of elevated intracellular Ca2+ ion content. Interestingly, AS was found to upregulate the intracellular concentration of Ca2+ ions, which might be related to the inhibition of sarcoplasmic/endoplasmic reticulum Ca2+-ATPase (Fernández-Martínez et al., 2013; Wan et al., 2019). This finding was consistent with previous studies (Nagamune et al., 2007; Zhou et al., 2013; Wang et al., 2019), revealing the potential of AS in combination with calcium-based nanomaterials for Ca2+-overload cancer therapy as well as providing the preliminary explanation for the synergistic anticancer effect of AS and CaCO3 (Supplementary Figure S12). CT26 cells treated with MCAP NPs exhibited the highest intracellular Ca2+ ion content among various treatment groups, which was ascribed to the introduction of exogenous Ca2+ ion by CaCO3 and upregulation of intracellular Ca2+ ion by AS. It is reported that Ca2+-overload would be contributed to cancer cell death through mitochondrial dysfunction (Kerkhofs et al., 2018) and oxidative stress (Peng and Jou, 2010). Therefore, we evaluated the mitochondrial membrane potential of CT26 cells after being treated with various formulations by using commercial Rhd 123 dye as indicators. As shown in Supplementary Figure S14, CT26 cells without any treatment exhibited the strongest fluorescence signal, indicating the normal mitochondrial membrane potential. However, cells treated with AS, MCP NPs and MCAP NPs displayed different levels of impaired membrane potential, as indicated by the decreased fluorescence signal. Importantly, almost no green fluorescence signal was detected in cells treated with ROS nanoamplifiers MCAP NPs. Collectively, ROS nanoamplifiers MCAP NPs could effectively induce Ca2+ ion overloading and cause severe depolarized membrane potential.
Eventually, we investigated the intracellular oxidative stress amplification of CT26 cells treated with AS and nanoparticles. It has been reported that MnO2 possessed the ability to exhaust intracellular GSH (Lin L.-S. et al., 2018; Liu Q. et al., 2022). Therefore, we studied the effect of various MnO2-based nanomaterials on GSH depletion using a commercial intracellular GSH probe ThiolTracker™ Violet dye. As observed under the fluorescence microscope, the CT26 colon cancer cells generated the strongest green fluorescence signal (Figure 5A), which may be attributed to the high concentration of intracellular GSH. In contrast, cells treated with AS displayed reduced green fluorescence signal, indicating that AS could partially consume intracellular GSH. Besides, cells treated with MCP NPs showed lower green fluorescence signal (Figure 5B) due to the catalytic reduction from Mn4+ ions to Mn2+ ions accompanied by GSH exhaustion. Obviously, cells internalized with MCAP NPs that simultaneously delivered MnO2 and AS demonstrated the lowest green fluorescence signal, revealing that the intracellular GSH was rapidly exhausted. The robust depletion of GSH thus resulted in the disturbance of cellular antioxidant defense system, creating a beneficial environment for oxidative stress damage by nanoamplifiers. Subsequently, we analyzed the intracellular ROS levels of CT26 cells treated with various agents. Fluorescence imaging and flow cytometry revealed that cells treated with AS showed mild ROS generation, which was attributed to the catalytic cleavage of endoperoxide bridge of AS by free ferric ions within cancer cells (Figures 5A,C and Supplementary Figure S15). Additionally, MCP NPs treatment induced moderate ROS generation on CT26 cells. Moreover, cells receiving MCAP NPs treatment exhibited the highest intracellular ROS level, which was resulted from the multiple amplification of tumor oxidative stress including Mn2+-mediated Fenton reaction (Figures 1A,B), GSH depletion (Figures 1C, 5A), AS-boosted CDT (Figure 1D) and Ca2+-overloading-mediated mitochondrial dysregulation (Supplementary Figure S14). The generated ROS then attacked intracellular macromolecules, such as polyunsaturated fatty acids of plasma membrane, to induce cancer cell death. As shown in Figures 5A,D and Supplementary Figure S16, both AS and MCP NPs treatment induced moderate lipid peroxidation levels within CT26 cells, as indicated by the green fluorescence signal from BODIPY probe. However, cells treated with MCAP NPs displayed the highest level of lipid peroxidation, majorly attributing to the highest ROS production and most efficiently GSH exhaustion from the nanoamplifiers MCAP NPs. Taken together, ROS nanoamplifiers MCAP NPs could significantly aggravate intracellular oxidative stress to achieve efficient tumor eradication.
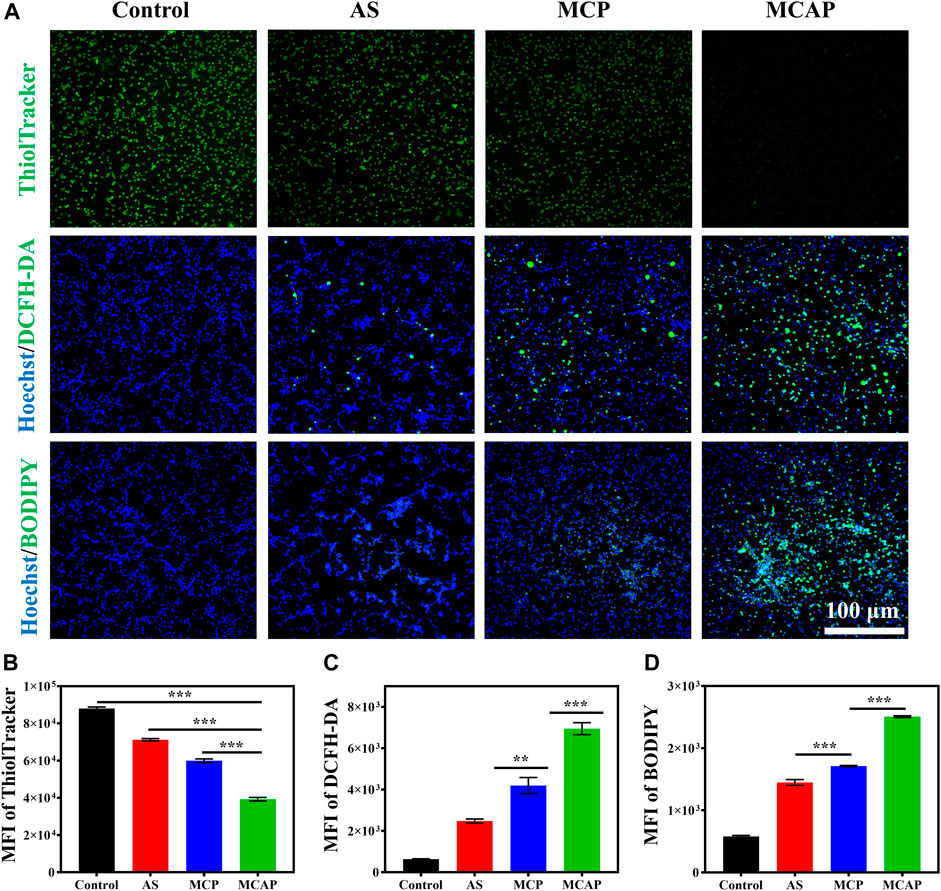
FIGURE 5. Intracellular oxidative stress amplification of MCAP NPs. (A) Fluorescence images of CT26 cells treated with various agents and then stained with ThiolTracker™ Violet (GSH: green color), Hoechst 33342 (nuclei: blue color), DCFH-DA (ROS: green color) and BODIPY (lipid peroxidation: green color). Flow cytometry analysis of CT26 cells treated with various agents then stained with (B) ThiolTracker™, (C) DCFH-DA and (D) BODIPY (***p < 0.001, **p < 0.01, *p < 0.05).
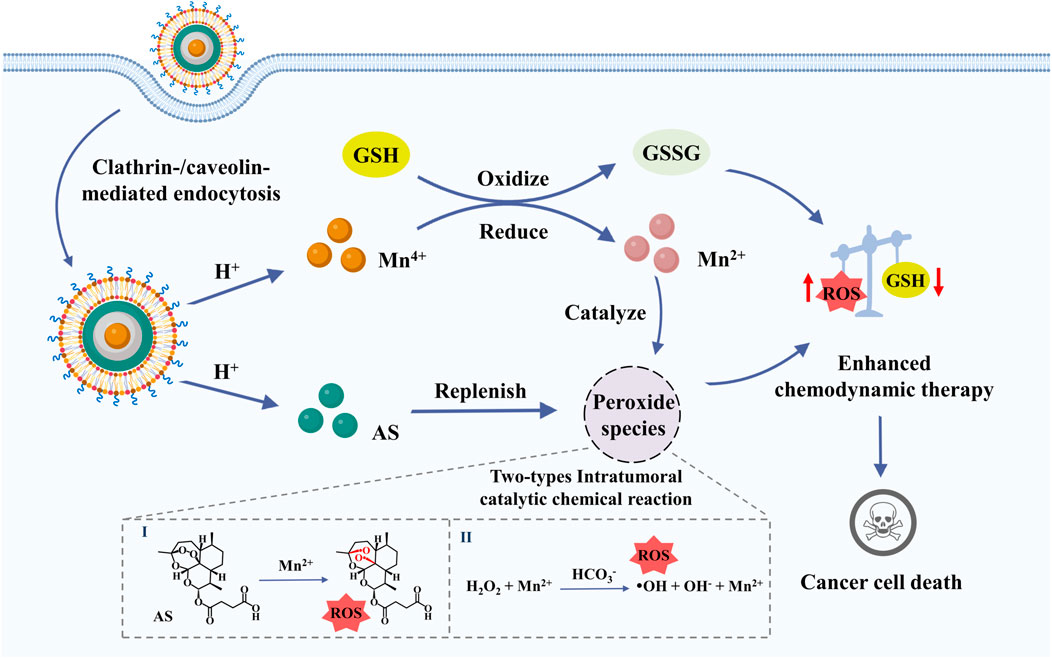
SCHEME 1. Efficient tumor eradication was achieved via multiple amplification of intratumoral oxidative stress through GSH exhaustion and Mn2+-mediated intratumoral catalytic reaction of H2O2 and AS.
In this study, we have prepared an oxidative stress nanoamplifier with ROS amplification and GSH exhaustion (MCAP NPs) via layer-by-layer assembly of AS and CaCO3 coating on the surface of MnO2. In tumor acidic and reduced microenvironment, the nanoamplifier was disassembled to release AS and Mn2+ to achieve amplification of intratumoral oxidative stress via multiple pathways. Concretely, the released AS served as exogenous peroxide compounds to replenish intratumoral peroxide species, facilitating the Mn2+-catalyzed ROS production. Furthermore, MnO2 consumed GSH to yield Mn2+ for ROS generation through intratumoral catalyzation of H2O2 and AS, jointly disturbing redox balance and eventually enhancing the CDT efficacy. In conclusion, this work presents a facile and promising oxidative stress nanoparticle with ROS amplification and GSH exhaustion to enhance CDT efficacy in cancer treatment.
The raw data supporting the conclusion of this article will be made available by the authors, without undue reservation.
Conceptualization: WZ and MC. Methodology, visualization and investigation: WZ, FC, and FG. Supervision and validation: JL, DS, GC, and MC. Writing-original draft preparation: WZ. Writing-review and editing: HY, M-KL and MC.
This study was supported by the National Natural Science Foundation of China (51922111), the Science and Technology Development Fund, Macau SAR (File No. 0124/2019/A and File No. 0058/2020/AGJ), and the University of Macau Research Committee (File no. MYRG 2022-00203-ICMS).
We gratefully acknowledge the support from lab technicians and administrators in Institute of Chinese Medical Sciences, University of Macau. We also thank the websites Biorender.com for assistant in creating the illustrated figures.
The authors declare that the research was conducted in the absence of any commercial or financial relationships that could be construed as a potential conflict of interest.
All claims expressed in this article are solely those of the authors and do not necessarily represent those of their affiliated organizations, or those of the publisher, the editors and the reviewers. Any product that may be evaluated in this article, or claim that may be made by its manufacturer, is not guaranteed or endorsed by the publisher.
The Supplementary Material for this article can be found online at: https://www.frontiersin.org/articles/10.3389/fphar.2022.1044083/full#supplementary-material
Bagur, R., and Hajnóczky, G. (2017). Intracellular Ca2+ sensing: Its role in calcium homeostasis and signaling. Mol. Cell 66 (6), 780–788. doi:10.1016/j.molcel.2017.05.028
Byler, D. M., and Farrell, H. M. (1989). Infrared spectroscopic evidence for calcium ion interaction with carboxylate groups of casein. J. Dairy Sci. 72 (7), 1719–1723. doi:10.3168/jds.S0022-0302(89)79287-0
Chang, M., Hou, Z., Jin, D., Zhou, J., Wang, M., Wang, M., et al. (2020). Colorectal tumor microenvironment‐activated bio‐decomposable and metabolizable Cu2O@ CaCO3 nanocomposites for synergistic oncotherapy. Adv. Mat. 32 (43), 2004647. doi:10.1002/adma.202004647
Chen, J., Wang, X., Zhang, Y., Zhang, S., Liu, H., Zhang, J., et al. (2021). A redox-triggered C-centered free radicals nanogenerator for self-enhanced magnetic resonance imaging and chemodynamic therapy. Biomaterials 266, 120457. doi:10.1016/j.biomaterials.2020.120457
Chen, X., Yang, H., Song, X., Liang, H., Wei, Y., Lu, J., et al. (2022). Integrated and dual-responsive lipopeptide nanovector with parallel effect to tumor and micro-environment regulation by efficient gene and drug co-delivery. Chin. Chem. Lett., 107753. doi:10.1016/j.cclet.2022.107753
Chen, X., Zhang, H., Zhang, M., Zhao, P., Song, R., Gong, T., et al. (2020). Amorphous Fe-based nanoagents for self-enhanced chemodynamic therapy by Re-establishing tumor acidosis. Adv. Funct. Mat. 30 (6), 1908365. doi:10.1002/adfm.201908365
Donahue, N. D., Acar, H., and Wilhelm, S. (2019). Concepts of nanoparticle cellular uptake, intracellular trafficking, and kinetics in nanomedicine. Adv. Drug Deliv. Rev. 143, 68–96. doi:10.1016/j.addr.2019.04.008
Fernández-Martínez, A., Mula, P., Cravo, P., Charle, P., Amor, A., Ncogo, P., et al. (2013). Characterization of the Plasmodium falciparum sarcoplasmic/endoplasmic reticulum Ca2+-ATPase gene in samples from Equatorial Guinea before implementation of artemisinin-based combination therapy. Am. J. Trop. Med. Hyg. 88 (1), 43–47. doi:10.4269/ajtmh.2012.12-0364
Fu, L.-H., Wan, Y., Qi, C., He, J., Li, C., Yang, C., et al. (2021). Nanocatalytic theranostics with glutathione depletion and enhanced reactive oxygen species generation for efficient cancer therapy. Adv. Mat. 33 (7), 2006892. doi:10.1002/adma.202006892
Gong, T., Li, Y., Lv, B., Wang, H., Liu, Y., Yang, W., et al. (2020). Full-process radiosensitization based on nanoscale metal–organic frameworks. ACS Nano 14 (3), 3032–3040. doi:10.1021/acsnano.9b07898
Guan, S., Liu, X., Li, C., Wang, X., Cao, D., Wang, J., et al. (2022). Intracellular mutual amplification of oxidative stress and inhibition multidrug resistance for enhanced sonodynamic/chemodynamic/chemo therapy. Small 18 (13), 2107160. doi:10.1002/smll.202107160
Jin, Q., Yan, S., Hu, H., Jin, L., Pan, Y., Zhang, J., et al. (2021). Enhanced chemodynamic therapy and chemotherapy via delivery of a dual threat ArtePt and iodo-click reaction mediated glutathione consumption. Small Methods 5 (12), e2101047. doi:10.1002/smtd.202101047
Kaksonen, M., and Roux, A. (2018). Mechanisms of clathrin-mediated endocytosis. Nat. Rev. Mol. Cell Biol. 19 (5), 313–326. doi:10.1038/nrm.2017.132
Kerkhofs, M., Bittremieux, M., Morciano, G., Giorgi, C., Pinton, P., Parys, J. B., et al. (2018). Emerging molecular mechanisms in chemotherapy: Ca 2+ signaling at the mitochondria-associated endoplasmic reticulum membranes. Cell Death Dis. 9 (3), 1–15. doi:10.1038/s41419-017-0179-0
Kong, N., Ji, X., Wang, J., Sun, X., Chen, G., Fan, T., et al. (2020). ROS-Mediated selective killing effect of black phosphorus: Mechanistic understanding and its guidance for safe biomedical applications. Nano Lett. 20 (5), 3943–3955. doi:10.1021/acs.nanolett.0c01098
Li, Y., Sun, J., and Sun, S.-P. (2016). Mn2+-mediated homogeneous Fenton-like reaction of Fe(III)-NTA complex for efficient degradation of organic contaminants under neutral conditions. J. Hazard. Mat. 313, 193–200. doi:10.1016/j.jhazmat.2016.04.003
Lin, L.-S., Song, J., Song, L., Ke, K., Liu, Y., Zhou, Z., et al. (2018a). Simultaneous fenton-like ion delivery and glutathione depletion by MnO2-based nanoagent to enhance chemodynamic therapy. Angew. Chem. Int. Ed. Engl. 57 (18), 4902–4906. doi:10.1002/anie.201712027
Lin, L. S., Song, J., Song, L., Ke, K., Liu, Y., Zhou, Z., et al. (2018b). Simultaneous Fenton‐like ion delivery and glutathione depletion by MnO2‐based nanoagent to enhance chemodynamic therapy. Angew. Chem. Int. Ed. Engl. 130 (18), 4902–4906. doi:10.1002/anie.201712027
Lin, L., Wang, S., Deng, H., Yang, W., Rao, L., Tian, R., et al. (2020). Endogenous labile iron pool-mediated free radical generation for cancer chemodynamic therapy. J. Am. Chem. Soc. 142 (36), 15320–15330. doi:10.1021/jacs.0c05604
Liu, B., Bian, Y., Liang, S., Yuan, M., Dong, S., He, F., et al. (2022a). One-step integration of tumor microenvironment-responsive calcium and copper peroxides nanocomposite for enhanced chemodynamic/ion-interference therapy. ACS Nano 16 (1), 617–630. doi:10.1021/acsnano.1c07893
Liu, Q., Shi, L., Liao, Y., Cao, X., Liu, X., Yu, Y., et al. (2022b). Ultrathin-FeOOH-coated MnO2 sonosensitizers with boosted reactive oxygen species yield and remodeled tumor microenvironment for efficient cancer therapy. Adv. Sci. 9 (17), 2200005. doi:10.1002/advs.202200005
Nagamune, K., Beatty, W. L., and Sibley, L. D. (2007). Artemisinin induces calcium-dependent protein secretion in the protozoan parasite Toxoplasma gondii. Eukaryot. Cell 6 (11), 2147–2156. doi:10.1128/EC.00262-07
Peng, T. I., and Jou, M. J. (2010). Oxidative stress caused by mitochondrial calcium overload. Ann. N. Y. Acad. Sci. 1201 (1), 183–188. doi:10.1111/j.1749-6632.2010.05634.x
Shao, D., Zhang, F., Chen, F., Zheng, X., Hu, H., Yang, C., et al. (2020). Biomimetic diselenide-bridged mesoporous organosilica nanoparticles as an X-ray-responsive biodegradable carrier for chemo-immunotherapy. Adv. Mat. 32 (50), 2004385. doi:10.1002/adma.202004385
Shi, L., Wang, Y., Zhang, C., Zhao, Y., Lu, C., Yin, B., et al. (2021). An acidity-unlocked magnetic nanoplatform enables self-boosting ROS generation through upregulation of lactate for imaging-guided highly specific chemodynamic therapy. Angew. Chem. Int. Ed. Engl. 60 (17), 9562–9572. doi:10.1002/anie.202014415
Stadtman, E., Berlett, B., and Chock, P. (1990). Manganese-dependent disproportionation of hydrogen peroxide in bicarbonate buffer. Proc. Natl. Acad. Sci. U. S. A. 87 (1), 384–388. doi:10.1073/pnas.87.1.384
Sun, Q., Yang, J., Shen, W., Lu, H., Hou, X., Liu, Y., et al. (2022). Engineering mitochondrial uncoupler synergistic photodynamic nanoplatform to harness immunostimulatory pro-death autophagy/mitophagy. Biomaterials 289, 121796. doi:10.1016/j.biomaterials.2022.121796
Tan, J., Duan, X., Zhang, F., Ban, X., Mao, J., Cao, M., et al. (2020). Theranostic nanomedicine for synergistic chemodynamic therapy and chemotherapy of orthotopic glioma. Adv. Sci. 7 (24), 2003036. doi:10.1002/advs.202003036
Tang, Z., Liu, Y., He, M., and Bu, W. (2019). Chemodynamic therapy: Tumour microenvironment‐mediated Fenton and fenton‐like reactions. Angew. Chem. Int. Ed. Engl. 58 (4), 946–956. doi:10.1002/anie.201805664
Vacque, V., Sombret, B., Huvenne, J. P., Legrand, P., and Suc, S. (1997). Characterisation of the OõO peroxide bond by vibrational spectroscopy. Spectrochimica Acta Part A Mol. Biomol. Spectrosc. 53 (1), 55–66. doi:10.1016/S1386-1425(97)83009-0
Wan, X., Zhong, H., Pan, W., Li, Y., Chen, Y., Li, N., et al. (2019). Programmed release of dihydroartemisinin for synergistic cancer therapy using a CaCO3 mineralized metal–organic framework. Angew. Chem. Int. Ed. Engl. 58 (40), 14134–14139. doi:10.1002/anie.201907388
Wang, D., He, I. W., Liu, J., Jana, D., Wu, Y., Zhang, X., et al. (2021a). Missing-linker-assisted artesunate delivery by metal-organic frameworks for synergistic cancer treatment. Angew. Chem. Int. Ed. Engl. 60 (50), 26254–26259. doi:10.1002/anie.202112128
Wang, H., Zhang, T., Sun, W., Wang, Z., Zuo, D., Zhou, Z., et al. (2016). Erianin induces G2/M-phase arrest, apoptosis, and autophagy via the ROS/JNK signaling pathway in human osteosarcoma cells in vitro and in vivo. Cell Death Dis. 7 (6), e2247. doi:10.1038/cddis.2016.138
Wang, S., Tian, R., Zhang, X., Cheng, G., Yu, P., Chang, J., et al. (2021b). Beyond photo: Xdynamic therapies in fighting cancer. Adv. Mat. 33 (25), 2007488. doi:10.1002/adma.202007488
Wang, S., Zhang, X., Chen, G., Liu, B., Li, H., Hu, J., et al. (2022). Hydroxyl radical induced from hydrogen peroxide by cobalt manganese oxides for ciprofloxacin degradation. Chin. Chem. Lett. 33 (12), 5208–5212. doi:10.1016/j.cclet.2022.01.055
Wang, X., Zhong, X., Liu, Z., and Cheng, L. (2020). Recent progress of chemodynamic therapy-induced combination cancer therapy. Nano Today 35, 100946. doi:10.1016/j.nantod.2020.100946
Wang, Y., He, S., Liu, Y., Hooper, R., Yu, H., Tian, Y., et al. (2019). Artesunate inhibits graft-versus-host disease in mice via a mechanism of inducing mitochondrial calcium overloading in activated T cells. Washington, DC: American Society of Hematology.
Yim, M., Berlett, B., Chock, P., and Stadtman, E. (1990). Manganese (II)-bicarbonate-mediated catalytic activity for hydrogen peroxide dismutation and amino acid oxidation: Detection of free radical intermediates. Proc. Natl. Acad. Sci. U. S. A. 87 (1), 394–398. doi:10.1073/pnas.87.1.394
Zhong, W., Wong, K. H., Xu, F., Zhao, N., and Chen, M. (2022). NIR-responsive polydopamine-based calcium carbonate hybrid nanoparticles delivering artesunate for cancer chemo-photothermal therapy. Acta Biomater. 145, 135–145. doi:10.1016/j.actbio.2022.03.051
Zhou, X., Sun, W.-J., Wang, W.-M., Chen, K., Zheng, J.-H., Lu, M.-D., et al. (2013). Artesunate inhibits the growth of gastric cancer cells through the mechanism of promoting oncosis both in vitro and in vivo. Anticancer. Drugs 24 (9), 920–927. doi:10.1097/CAD.0b013e328364a109
Keywords: chemodynamic therapy, artesunate, ROS amplification, GSH exhaustion, intratumoral catalytic nanomaterials
Citation: Zhong W, Guo F, Chen F, Law M-K, Lu J, Shao D, Yu H, Chan G and Chen M (2022) A multifunctional oxidative stress nanoamplifier with ROS amplification and GSH exhaustion for enhanced chemodynamic therapy. Front. Pharmacol. 13:1044083. doi: 10.3389/fphar.2022.1044083
Received: 14 September 2022; Accepted: 26 October 2022;
Published: 10 November 2022.
Edited by:
Tong Zhang, Shanghai University of Traditional Chinese Medicine, ChinaCopyright © 2022 Zhong, Guo, Chen, Law, Lu, Shao, Yu, Chan and Chen. This is an open-access article distributed under the terms of the Creative Commons Attribution License (CC BY). The use, distribution or reproduction in other forums is permitted, provided the original author(s) and the copyright owner(s) are credited and that the original publication in this journal is cited, in accordance with accepted academic practice. No use, distribution or reproduction is permitted which does not comply with these terms.
*Correspondence: Meiwan Chen, bXdjaGVuQHVuLmVkdS5tbw==
†These authors have contributed equally to this work and share first authorship
Disclaimer: All claims expressed in this article are solely those of the authors and do not necessarily represent those of their affiliated organizations, or those of the publisher, the editors and the reviewers. Any product that may be evaluated in this article or claim that may be made by its manufacturer is not guaranteed or endorsed by the publisher.
Research integrity at Frontiers
Learn more about the work of our research integrity team to safeguard the quality of each article we publish.