 Bing Yang1
 Jingxin Mo
94% of researchers rate our articles as excellent or good
Learn more about the work of our research integrity team to safeguard the quality of each article we publish.
Find out more
ORIGINAL RESEARCH article
Front. Pharmacol., 07 November 2022
Sec. Pharmacology of Anti-Cancer Drugs
Volume 13 - 2022 | https://doi.org/10.3389/fphar.2022.1023719
This article is part of the Research TopicOvercoming drug resistance in cancer and serious pathogenic infections: Natural product-based bio-actives as new drug leadsView all 4 articles
Despite intensive research, ovarian cancer has the highest mortality rates among gynecological malignancies, partly because of its rapid acquisition of chemoresistance to platinum therapy. Hence, strategies are needed to effectively treat carboplatin-resistant ovarian cancer. In this study, we designed and prepared hyaluronic acid-decorated metal-organic frameworks for the targeted delivery of GSK-J1, a JMJD3 demethylase inhibitor (HA@MOF@GSK-J1) for the synergistic treatment of carboplatin-resistant ovarian cancer. HA@MOF@GSK-J1 showed outstanding effectiveness in the inhibition of ovarian cancer in vitro. Furthermore, HA@MOF@GSK-J1 demonstrated higher induction of apoptosis, reduced cell motility, and diminished cell spheroids by attenuating HER2 activity through the effectual activation of H3K27 methylation in its promoter area. Finally, our in vivo results confirmed that HA@MOF@GSK-J1 had better treatment efficacy for carboplatin-resistant ovarian tumor xenografts. Our results highlight the potential of HA@MOF@GSK-J1 as an effective strategy to improve the treatment of carboplatin-resistant ovarian cancer.
Despite intensive research, ovarian cancer remains the leading cause of gynecological malignancy-related deaths (Ruth et al., 2021). Although the development of platinum and taxane chemotherapy has saved the lives of many patients with ovarian cancer (Patch et al., 2015), the rapid acquisition of chemoresistance to platinum therapy has, thus far, broadly thwarted efforts to cure patients with ovarian cancer (Zeng et al., 2019). To tackle this problem, epigenetic therapies have recently attracted attention due to their usefulness in overcoming drug resistance (Natanzon et al., 2018).
Methylating histone involves the post-synthesis modification of selected lysines on histones H3, H4, and H27 (Liu et al., 2018). Histone methylation, together with other epigenetic regulations, is associated with drug resistance in various cancers, including ovarian cancer (Curry et al., 2018). Repressive modifications (particularly H3K27me3) are globally reduced across the ovarian cancer genome (Fardi et al., 2018; Shang et al., 2019; Singh et al., 2019). The JMJD3 demethylase inhibitor, GSK-J1, showed convincing potency in suppressing ovarian cancer by restoring H3K27 methylation at the HER2 oncogene promoter region and then suppressing its transcription (Zhang et al., 2020). However, GSK-J1 showed less efficacy in treating carboplatin-resistant ovarian cancer due to its unfavorable bioavailability and single molecular target (Duan et al., 2021). Therefore, rationally designed combinational approaches based on GSK-J1 may increase its treatment efficacy in carboplatin-resistant ovarian cancer.
Compared to traditional polymer nanoparticles, the use of inorganic nanoparticles as drug delivery vehicles has many advantages, including a large specific surface area, an easily modified surface, and facile preparation (Pugazhendhi et al., 2018). Recently, metal-organic frameworks (MOFs), a type of hybrid organic-inorganic supramolecule, have gained increasing attention as emerging nanoplatforms for biomedical applications, although at the expense of serious aggregation of nanoparticles and poor tumor targetability (Zhao et al., 2020; Tong et al., 2021).
Hyaluronic acid (HA) comprises alternating N-acetyl-D-glucosamine and glucuronic acid units (Huang and Huang, 2018a). HA containing anionic groups such as carboxylic acid and hydroxyl groups will readily bond with MOF, the surfaces of which contain abundant cationic metal ions (Li et al., 2022). Moreover, CD44, a HA receptor, is highly expressed on ovarian cancer cells, leading to CD44-mediated active targeting of tumors (Huang and Huang, 2018b). Thus, HA has gained attention in cancer-targeted drug delivery.
In this study, a GSK-J1 loaded, HA-coated MOF (HA@MOF@GSK-J1) was formulated before its physicochemical property and microstructure were evaluated. After determining the drug loading (DL) and entrapment efficiency (EE) of GSK-J1 by UV, its release profile was investigated. The cellular uptake, cytotoxicity, and possible synergism effects of the HA@MOF@GSK-J1 were explored. Then, the effects of the HA@MOF@GSK-J1 on tumor cell apoptosis, motility, and sphere formation were studied. Moreover, its epigenetic regulation on HER2 expression was studied. Finally, the in vivo anti-tumor effects and preliminary toxicity were examined after tail intravenous injection of HA@MOF@GSK-J1 in nude mice bearing ovarian xenografts (Scheme 1).
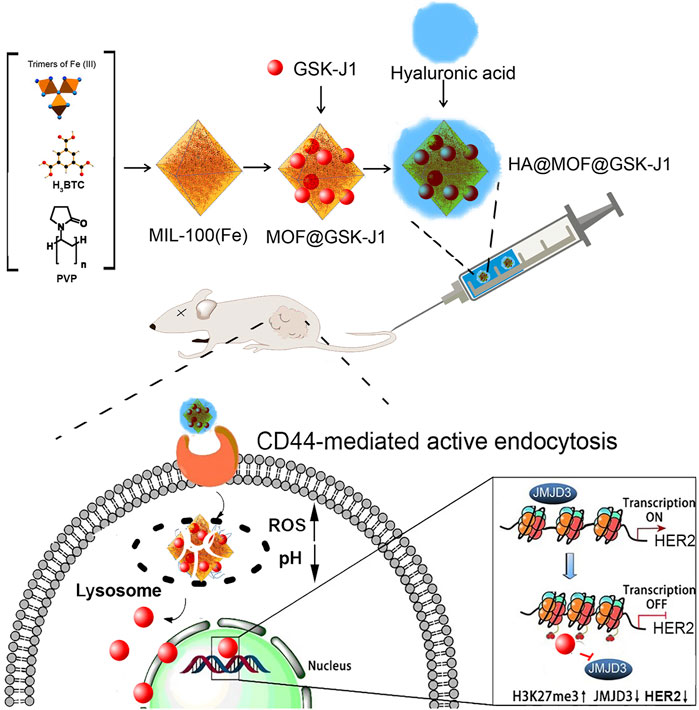
SCHEME 1. Illustration of the GSK-J1-loaded, hyaluronic acid-decorated metal-organic frameworks (HA@MOF@GSK-J1) for the targeted therapy of carboplatin-resistant ovarian tumors grafted from BALB/c nude mice via the epigenetic downregulation of HER2.
Benzene-1,3,5-tricarboxylic acid (H3BTC), 3-(4,5-dimethylthiazol-2-yl)-2,5-diphenyl tetrazolium bromide (MTT), and dimethyl sulfoxide (DMSO) were obtained from Aladdin Reagent Co., Ltd. (Shanghai, China). Polyvinyl pyrrolidone (PVP, MW ≈ 45–58 K) and hyaluronic acid (HA, 36 kDa), Fe(NO3)3·9H2O, GSK-J1, reduced glutathione (GSH) assay kit, and Cy 5.5 was purchased from Sigma-Aldrich (Shanghai, China).
The human ovarian cancer cell line SKOV-3 was provided by the CTCC of Science (Shanghai, China) and maintained in RPMI 1640 growth medium supplemented with 10% fetal bovine serum, penicillin (100 U/mL), and streptomycin (100 μg/ml) (Gibco).
Carboplatin-resistant SKOV-3 cells (CR SKOV-3) were obtained by continuous exposure to carboplatin (Sigma-Aldrich, Shanghai, China). Starting from 18.61 μg/ml of carboplatin, the surviving cells were allowed to grow as follows: if >70% of cells survived after 72-h incubation, the SKOV-3 cells were incubated with higher concentrations of carboplatin. If >70% of the cells perished, the same concentration of carboplatin was repeated for another 72 h. This experiment lasted for approximately 6 months until carboplatin concentration reached 37.22 μg/ml. Afterward, the IC50 of SKOV-3 cells was evaluated. This carboplatin-resistant SKOV-3 cell line (CR SKOV-3) was used in the subsequent experiments unless otherwise indicated.
A luciferase-transfected CR SKOV-3 cell line was created from CR SKOV-3 via transfection of plasmid (pLenti CMV-LUC-Puro) using FuGene HD Transfection Reagent (Promega Corporation, Madison, United States). After 48 h, the cells were incubated with puromycin (0.5 μg ml−1) to select for transfected cells and generate a stable cell line.
Female mice (5-week-old, BALB/c) were obtained from the Vital Laboratory Animal Center (Beijing, China). The animal experimental and housing protocol was approved by the Animal Ethics Committee of Guilin Medical University (ethics number: GLMC202003083).
MOF nanoparticles were prepared as described previously, with minor modifications (Yang et al., 2020a). First, 160 mg of Fe(NO3)3·9H2O and 5 mg PVP were mixed in 25 ml H2O and stirred for 1 hour. Then, 3 ml of 20 mg/ml H3BTC H2O solution was added to the above solution and incubated at 50°C for 1 h. The reaction solution was then centrifugated (15 min, 300 g) to collect the product and washed with ethanol three times to remove excess reactants and surfactants. The obtained MOF nanoparticles were then suspended in deionized water for further use.
GSK-J1 was loaded into the MOF by magnetic agitation of GSK-J1 in an ethanolic solution. For this, 200.0 mg of dried MOF powder was dispersed into 15 ml ethanolic solution containing 375.0 mg GSK-J1 and stirred at room temperature at 400 rpm overnight. The solution was then centrifuged (10 min, 8,000 g). The precipitate was collected and redispersed into 10 ml of distilled water before centrifugation. After two washes, the resultant product was freeze-dried to obtain the MOF@GSK-J1 nanoparticles. The above MOF@GSK-J1 nanoparticles were mixed with HA in deionized water and further sonicated for 30 min. Finally, the resulting HA@MOF@GSK-J1 NPs were rinsed three times in deionized water before being freeze-dried for further experiments.
The content of the encapsulated GSK-J1 was determined by an UV-vis spectrophotometer (Cary 50 Bio UV-Visible spectrophotometer, Varian, CA, United States) with an absorption wavelength at 278 nm in DMSO using a pre-established calibration curve (Supplementary Figure S1). The drug loading (DL) and entrapment efficiency (EE) of GSK-J1 were calculated using the following equations:
The polydispersity index (PDI) and zeta potential of MOF@GSK-J1 and HA@MOF@GSK-J1 NPs were determined using a Zetasizer Nano ZS90 instrument (Malvern Instruments, Malvern, United Kingdom) at 25°C. The morphologies of MOF@GSK-J1 and HA@MOF@GSK-J1 NPs were imaged via transmission electron microscopy (TEM, Talos F200C, FEI, United States) with an acceleration voltage of 200 kV. The phase and crystal structures of MOF and MOF@HA NPs without GSK-J1 were examined by X-ray diffraction (XRD) patterns using a Rigaku X-ray diffractometer with Cu-Kα radiation (Rigaku, Japan). The FTIR spectra were recorded by Fourier transform-infrared spectroscopy (Perkin Elmer, United States).
MOF@GSK-J1 and HA@MOF@GSK-J1 NPs (1 mg/ml) were maintained at 37°C with RPMI 1640 containing 10% FBS for 48 h. The polydispersity index and zeta potential values were recorded at 0, 2, 6, 12, 24, and 48 h to evaluate their stabilities.
To evaluate GSK-J1 release behavior from MOF@GSK-J1 and HA@MOF@GSK-J1 NPs, a centrifugal method was performed as follows: First, MOF@GSK-J1 and HA@MOF@GSK-J1 NPs (5 mg) were added to 20 ml PBS (pH 5.5 or pH 7.4) and incubated in a shaker at 37°C at 100 rpm. Then, at different time points, the solution was centrifuged at 5,000 rpm for 5 min and 5 ml of the supernatant was removed to determine the concentration of released GSK-J1 by UV/vis spectrophotometry (DS5, Edinburgh Instruments) at 278 nm. The released Fe ions were detected by atomic absorption spectroscopy (Phoenix-986 AA, United Kingdom) at 248.3 nm. Then, the precipitate was resuspended after 3 ml of PBS was replenished to keep the total volume of the release media unchanged.
MOF (2.73 μg/ml), GSK-J1 (0.39 μg/ml), MOF@GSK-J1 (3.12 μg/ml), or HA@MOF@GSK-J1 (3.78 μg/ml) was dispersed with pH 5.5 PBS with (mimicking low pH in lysosomes) and incubated with 10 μM GSH at 37°C, respectively. Twenty-four hours later, after centrifugation for 4 min at 3,000 rpm, the GSH concentration in the supernatant was determined by the reduced glutathione (GSH) assay kit at an absorbance at 450 nm according to the manufacturer instructions.
We used confocal laser scanning microscopy (LSM710, Carl Zeiss, Germany) to observe the intracellular distributions of nanoparticles. In brief, to form 3D cell spheres, 5,000 CR SKOV-3 cells were seeded in 96 well-plates (Ultra Low Attachment Microplate, Corning) for 5 days. The medium was replaced with 1 ml of free-serum medium for each well, followed by the addition of free Cy 5.5 and an equal amount of Cy 5.5-loaded MOF nanoparticles (1 mg/g) with/without an HA covering. After incubation for 1 more day, the cells were fixed using 4% (v/v) paraformaldehyde and imaged under confocal laser scanning microscopes. The fluorescence intensity of Cy 5.5 in the cells was analyzed by flow cytometry (BD Bioscience).
CR SKOV-3 cells were used for the cell imaging studies. The cells were seeded on 6-well plates and allowed to grow for 24 h. CR SKOV-3 cells were incubated with HA@MOF@Cy 5.5 for 6 h and then incubated with LysoTracker Blue before confocal imaging (LysoTracker Blue, Ex: 400 nm, Em: 460 nm; HA@MOF@Cy 5.5, Ex: 560 nm, Em: 650 nm).
DCFH-DA staining assays and the reduced glutathione assay kit were used to retrospectively detect intracellular ROS and GSH levels. The CR SKOV-3 cells were treated with MOF (13.63 μg/ml), or GSK-J1 (1.95 μg/ml), MOF@GSK-J1 (15.58 μg/ml) and HA@MOF@GSK-J1 (18.90 μg/ml) for 3 h. After that, the cells were washed with PBS and incubated with DCFH-DA solution or glutathione assay kit for 20 min. Afterward, the cells were observed by CLSM.
To evaluate the cytotoxicity of different treatments on CR SKOV-3 cells, after a 24 h growth in CR SKOV-3 cells, 100 μL of various concentrations of HA@MOF@GSK-J1 NPs, MOF@GSK-J1 NPs, free GSK-J1, or MOF were added. Control wells were added with 100 μL of PBS. After incubation for 48 h, 10 μL of MTT solution (5 mg/ml, Aladdin Reagent, Shanghai, China) was added to each well, the absorbance values of which were determined by using a microplate reader (Emax Precision, United States) at 570 nm. And IC50 was calculated using OriginPro 2019b (Originlab, Northampton, US). The combination index (CI) was calculated from the following formula and used to define synergism.
Apoptosis of CR SKOV-3 cells was evaluated using an Annexin V-FITC/PI Apoptosis Detection Kit according to the manufacturer’s protocol. Briefly, CR SKOV-3 cells were plated at a density of 5 × 10⁵ cells/well into 6-well plates and placed in a 37°C, 5% CO2 incubator overnight. Then, MOF (13.63 μg/ml), GSK-J1 (1.95 μg/ml), MOF@GSK-J1 (15.58 μg/ml), or HA@MOF@GSK-J1 (18.90 μg/ml) were applied to treat the cancer cells. After 1 day, the cells were stained with annexin-FITC/propidium iodide for 0.5 h in the dark and analyzed by flow cytometry.
After 24 h pre-incubation until ∼90% confluent monolayers had formed, the CR SKOV-3 cells were scratched with a 20 μL pipette tip and subsequently treated with MOF (2.73 μg/ml), GSK-J1 (0.39 μg/ml), MOF@GSK-J1 (3.12 μg/ml), or HA@MOF@GSK-J1 (3.78 μg/ml) for 48 h at 37°C. Images were taken at 0 and 48 h. Wound healing analysis was performed using Image J software (NIH, United States).
We assessed the ability of MOF (2.73 μg/ml), or GSK-J1 (0.39 μg/ml), MOF@GSK-J1 (3.12 μg/ml) or HA@MOF@GSK-J1 (3.78 μg/ml) against CR SKOV-3 cell invasion through transwell assays. Briefly, 20,000 cells were plated in Transwell chambers (Corning Costar, St. Louis, MO, United States) on top of the pre-coated inserts in 200 μL serum-free media. The reservoir well was filled with 10% FBS containing media with different formulations (700 μL). The plates were incubated in 5% CO2 at 37°C with the different treatments for 1 day. The remaining cells were then removed from the upper membrane. The number of cells on the lower membrane was counted and photographed using a microscope (5 microscopic fields/well).
To assess the anti-tumor spheroid ability for different formulations, CR SKOV-3 cells were seeded at a density of 3 × 10³ per well in an ultralow-attachment round-bottom 96-well plate (CAT#7007, Corning). Five days later, the cell spheroids were treated with MOF (2.73 μg/ml), GSK-J1 (0.39 μg/ml), MOF@GSK-J1 (3.12 μg/ml), or HA@MOF@GSK-J1 (3.78 μg/ml) for 3 days, respectively. The volumes of CR SKOV-3 tumor spheroids were evaluated before and after incubation. The major (dmax) and minor (dmin) diameters of each tumor spheroid were recorded, and the volumes (V) were calculated according to the equation:
RNA was extracted from cells using a Qiagen RNeasy Kit. cDNA was prepared using the iScript cDNA Synthesis Kit (Bio-Rad) according to the manufacturer’s instructions. Quantitative gene expression analysis was performed on an iCycler IQ (Bio-Rad, CA, United States) using SYBR Green Master Mix (Bio-Rad) with a primer for each of the transcripts. All reactions were duplicated. qPCR primers are listed in Supplementary Table S1.
The assay was performed using an EZ-Zyme Chromatin Prep Kit (Millipore), according to the manufacturer’s protocol. Anti-H3K27me3′ antibody (Cat# 9783, Cell Signal Technology) was used in the immunoprecipitation reaction with H3K27me3. The pulled DNA underwent purification and was analyzed by RT-qPCR with primers specific to the predicted binding sites on the promoter site. Immunoprecipitated DNA and whole-cell extracted DNA were also treated for reverse crosslinking using the Zymoclean PCR purification kit (Zymo). The ChIP-PCR primers are listed in Supplementary Table S1.
To assess the expression levels of HER2 protein, the CR SKOV-3 cells were administered different treatments and later lysed in a modified RIPA buffer (No. P0013B, Beyotime Biotechnology, China) and quantified by BCA protein assay. Briefly, the protein samples (30 μg per lane) were loaded onto a 10% gel for sodium dodecyl sulfate-polyacrylamide gel electrophoresis, before being transferred onto poly-vinylidene fluoride (PVDF) membranes. Next, the PVDF membranes were blocked in 5% non-fat milk for 1 h and incubated with primary antibodies diluted 1:10,000 rabbit anti-HER2 (ab214275, Abcam) and 1:5,000 rabbit anti-β-actin (ab8224, Abcam) at 4°C overnight and goat anti-rabbit IgG antibody for 1 h. Finally, the membranes were exposed to a chemiluminescence substrate (Thermo Scientific) and visualized on a ChemiDoc™ MP Imaging System (Bio-Rad).
To visualize the in vivo biodistributions, the MOF formulations were loaded on Cy5.5 as a fluorescent probe for evaluating their biodistributions. The CR SKOV-3 tumor-bearing mouse model was established by subcutaneously injecting cells (1 × 10⁶ cells/100 μL PBS/mouse) into the rear left thigh of the BALB/c mice. When the tumor volumes reached 100–300 cm3, 100 μL of Cy 5.5 solution or TU9GQEN5NS41 and SEFATU9GQEN5NS41 (Cy5.5, 2 mg/kg) were tail intravenously injected into tumor-bearing nude mice. At 1, 2, 4, 8, 12, 24, 48, 72, 96, and 120 h post-administration, the mice were observed on an IVIS Spectrum in vivo image system (Caliper Life sciences, MA, United States) after being anesthetized. To compare fluorescence intensity in different organs and tumors, the mice were euthanized at 24 h post-injection of different formulations. The vital organs including the heart, liver, spleen, lungs, kidneys, brain, and tumor tissue were observed on an IVIS Spectrum in vivo image system.
The studies on ovarian cancer xenograft inhibition involved the subcutaneous injection of luciferase-labeled luciferase-transfected CR CR SKOV-3 cells (1 × 10⁶ cells in 100 μL PBS) into the rear right thighs of the BALB/c nude mice. On the seventh day after tumor cell injection, the mice were allocated into five groups (n = 5). For these five treatment groups, the doses were equivalent to 10 mg drug/kg: (group 1) sham (0.9% saline injection solution); (group 2) MOF (10 mg/kg in 0.9% saline injection solution); (group 3) GSK-J1 (10 mg/kg dissolved in 0.9% saline injection solution); (group 4) MOF@GSK-J1 (equivalent to 10 mg/kg of GSK-J1 in 0.9% saline injection solution); (group 5) HA@MOF@GSK-J1 (equivalent to 10 mg/kg of GSK-J1 in 0.9% saline injection solution). Treatments were injected through the tail vein once a week for four consecutive weeks. 200 µL of 15 mg/ml firefly D-luciferin was injected intraperitoneally and mice were anesthetized by 3% isoflurane. Tumor growth was visualized with an IVIS Spectrum in vivo image system.
After 4 weeks, the nude mice were euthanized. Their vital organs and tumors were then removed and fixed in 4% paraformaldehyde. The vital organs (heart, liver, spleen, lungs, kidneys, and brain) were harvested for HE staining. TUNEL assays were performed simultaneously to assess tumor cell growth and apoptosis.
All quantitative data are expressed as means ± standard deviation (SD) unless otherwise noted. Statistical significance was tested using unpaired, two-tailed Student’s t-tests. *P < 0.05 was considered indicative of statistically significant differences.
Examination of the sizes, size distributions, and morphology of the different nanoparticles showed that covering MOFs with HA visibly affected the sizes (Figure 1A,B). The average particle size of the HA@MOF@GSK-J1 NPs was 197 ± 9 nm, increased from 143 ± 5 nm for MOF@GSK-J1 NPs without HA covering. As shown in the TEM images in Figures 1C,D, MOF@GSK-J1 was diamond-shaped, with narrow dispersion, while the HA@MOF@GSK-J1 NPs showed a translucent layer of HA.
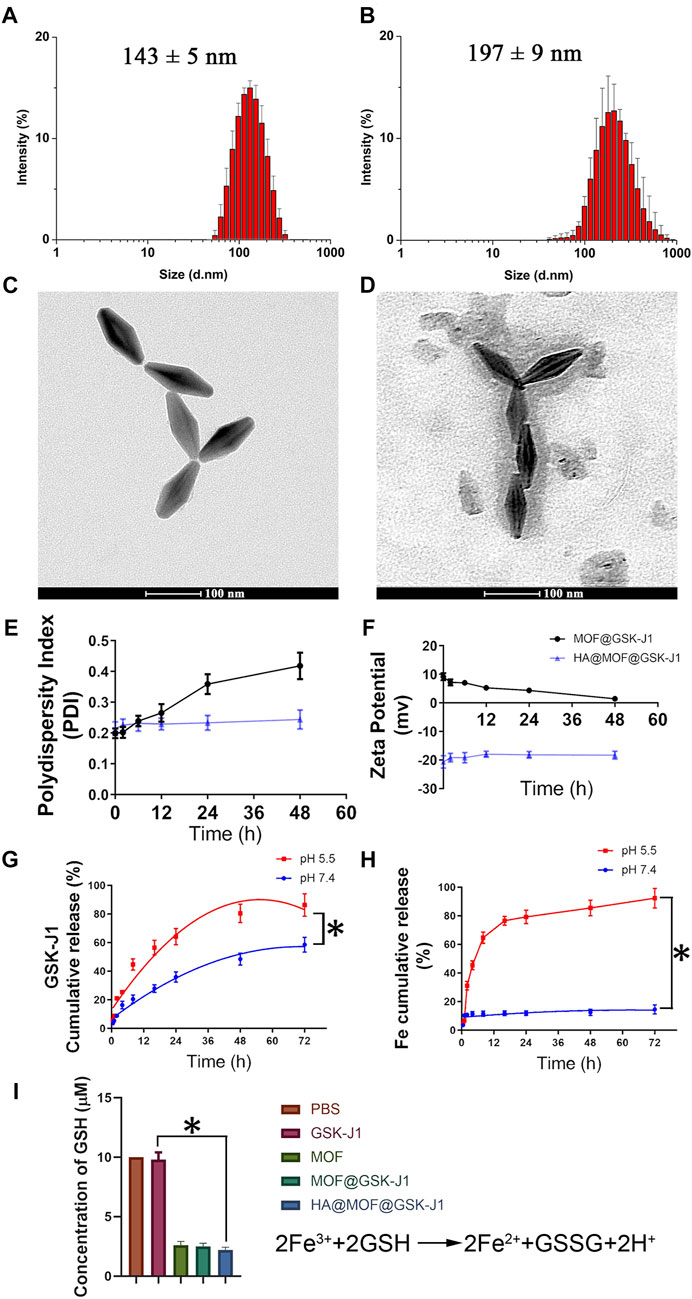
FIGURE 1. Size distributions of (A) MOF@GSK-J1 and (B) HA@MOF@GSK-J1 based on DLS. Transmission electron micrographs of (C) MOF@GSK-J1 NPs and (D) HA@MOF@GSK-J1 NPs. Scale bar: 100 nm. (E) Polydispersity index and (F) zeta potential of MOF@GSK-J1 and HA@MOF@GSK-J1 NPs after incubation in RPMI 1640 containing 10% FBS at 37°C for 48 h. (G) Accumulative release of MOF@GSK-J1 and HA@MOF@GSK-J1 NPs after incubation in pH 5.5 and pH 7.4 PBS at 37°C for 72 h. (H) Accumulative release of Fe3+ after incubation in pH 5.5 and pH 7.4 PBS at 37°C for 72 h (I) GSH concentrations after incubation in different formulations of pH 5.5 PBS at 37°C for 24 h. The results are expressed as mean ± SD, n = 3; *, p < 0.05.
We further studied the stability of MOF@GSK-J1 and the HA@MOF@GSK-J1 NPs in RPMI 1640 containing 10% FBS at room temperature by monitoring their zeta potential and PDI (Figures 1E,F). The zeta potential and PDI of HA@MOF@GSK-J1 NPs remained steady in RPMI 1640 containing 10% FBS at 37°C for at least 48 h. The PDI of MOF@GSK-J1 showed an upward trend, from 0.199 to 0.418, in the same conditions, which was related to the decreasing zeta potential from 9.13 mv to 1.42 mv after 48 h. The zeta potential showed a significant decrease for HA@MOF@GSK-J1 NPs (−20.84 ± 0.28 mV), suggesting that HA binds to the residue amino groups of MOFs with abundant -OH groups, leading to a charge-shielding effect.
Drug loading on MOF@GSK-J1 and HA@MOF@GSK-J1 NPs were 12.5 ± 3.1% and 10.3 ± 3.7%, respectively. The entrapment efficiencies (EE) of MOF@GSK-J1 and HA@MOF@GSK-J1 NPs were 89.5 ± 6.3% and 91.5 ± 7.94%, respectively. As shown in Figure 1G, the cumulative release of GSK-J1 from HA@MOF@GSK-J1 was 58.56% after incubation in pH 7.4 PBS for 72 h. However, the percentage of GSK-J1 released from the HA@MOF@GSK-J1 increased from 58.56% to 86.30% by lowering the pH from 7.4 to 5.5 after 72 h incubation. This acidic pH-responsive release behavior may be caused by the collapse of the MOF as a remarkable amount of Fe3+ dissociated from the MOFs at pH 5.5 (Figure 1H). As a critical intracellular antioxidant, GSH serves a protective role as an antioxidant defense. The dissociated Fe3+ could consume GSH and produce GSSH, thus resulting in a redox imbalance. As shown in Figure 1I, compared to the group treated with GSK-J1, the GSH concentration decreased significantly after treatment with HA@MOF@GSK-J1.
Compared to MOFs, the FT-IR spectra of HA@MOF showed bands at ∼1,598 cm−1 and ∼1,487 cm−1 peaks corresponding to the symmetrical and asymmetrical stretching peaks of νC = O. The bands at ∼1,023 cm−1, ∼1,082 cm−1, and ∼1,162 cm−1 correspond to typical the peaks of glycosyl in hyaluronic acid, signifying successful covering by hyaluronic acid (Supplementary Figure S2A). Supplementary Figure S2B shows the XRD patterns of the MIL-100(Fe) NPs before and after covering then with HA. All the diffraction peaks in the XRD patterns showed the same characteristic peaks as reported, indicating that the successful coating of HA did not alter the MOF crystallinity but slightly decreased the reflection intensity.
The cellular uptake of PBS, Cy 5.5, MOF@Cy 5.5 NPs, and HA@MOF@Cy 5.5 NPs were measured in CR SKOV-3 cell spheres. After 3 h of incubation, the cells were imaged by CLSM (Figures 2A,B) and further quantified by flow cytometry (Figures 2C,D). Compared to MOF@Cy 5.5 NPs, HA@MOF@Cy 5.5 showed an 8.99-fold higher uptake efficiency in CR SKOV-3 spheroids, demonstrating the higher uptake efficiency due to the stronger penetration ability of 3D cell spheroids, possibly facilitated by the HA coating. An additional advantage of HA coating is the selective targeting of cancer and controlled drug release by HAdase inside the cancer cells.
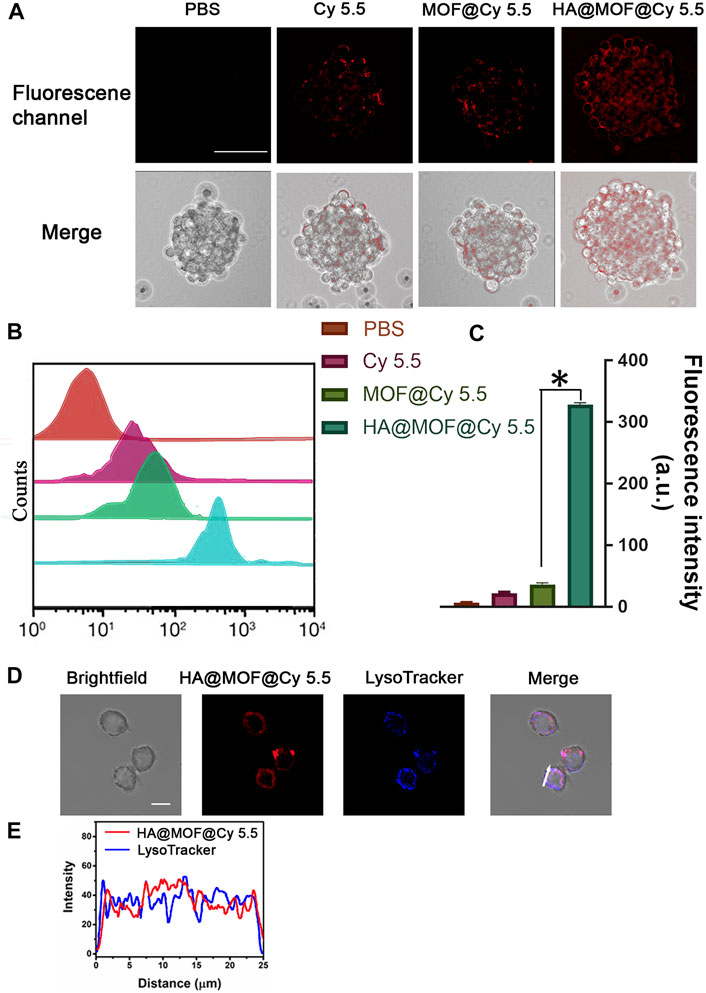
FIGURE 2. (A) In vitro cellular uptake of PBS, Cy 5.5, MOF@Cy 5.5 NPs, and HA@MOF@Cy 5.5 after incubation with CR SKOV-3 spheroids. Scale bar: 100 μm. (B) Fluorescence intensity in CR SKOV-3 spheroids analyzed by flow cytometer. (C) Histogram of Cy 5.5 fluorescence intensity in different treatment groups. Data are presented as means ± SD, n = 3, *, p < 0.05. (D) Co-localization of HA@MOF@Cy 5.5 with LysoTracker Blue in CR SKOV-3 cells. Scale bar: 20 μm. (E) Correlation plot of HA@MOF@Cy 5.5 with LysoTracker Blue in CR SKOV-3 cells (white arrow).
To evaluate the destiny of HA@MOF@Cy 5.5 after cell uptake, we performed co-localization tests in CR SKOV-3 cells with LysoTracker Blue dye. CR SKOV-3 cells were incubated with HA@MOF@Cy 5.5 and then incubated with LysoTracker Blue for confocal imaging. As shown in Figures 2D,E, after CR SKOV-3 cells were incubated with the HA@MOF@Cy 5.5 for 6 h, the coincidence degree of fluorescence signals for the red and blue channels was very good (the Pearson’s co-localization coefficient: 0.86), which suggested that HA@MOF@Cy 5.5 may experience the lysosome pathway after active endocytosis by CD44 receptors. The acidic lysosome microenvironment would then aid HA@MOF@Cy 5.5 decomposition and payload release into the cytoplasm.
Previous studies suggested that the anti-tumor mechanism of Fe3+-based MOFs includes the intracellular overproduction of ROS by converting H2O2 to •OH and GSH to GSSG (Li et al., 2021). To investigate ROS production of different formulations inside CR SKOV-3 cells, the production of intracellular ROS was observed after dying the cells with 2′,7′-dichlorofluorescein diacetate (DCFH-DA). Similar to the PBS group, very weak DCFH-DA fluorescence was visible inside CR SKOV-3 cells treated with GSK-J1. While a brilliant DCFH green fluorescence was observed after co-culture with MOF-based formulations like MOF, MOF@GSK-J1, and HA@MOF@GSK-J1 (Figure 3A). The capacity of HA@MOF@GSK-J1 to consume intracellular GSH was further analyzed in CR SKOV-3 cells. As shown in Figure 3B, much lower intracellular GSH levels were observed after treatment with MOF-based formulations such as MOF, MOF@GSK-J1, and HA@MOF@GSK-J1 than with PBS or GSK-J1. Effective GSH consumption together with the accumulation of intracellular ROS may provide tumor therapy by inflicting a cellular redox imbalance.
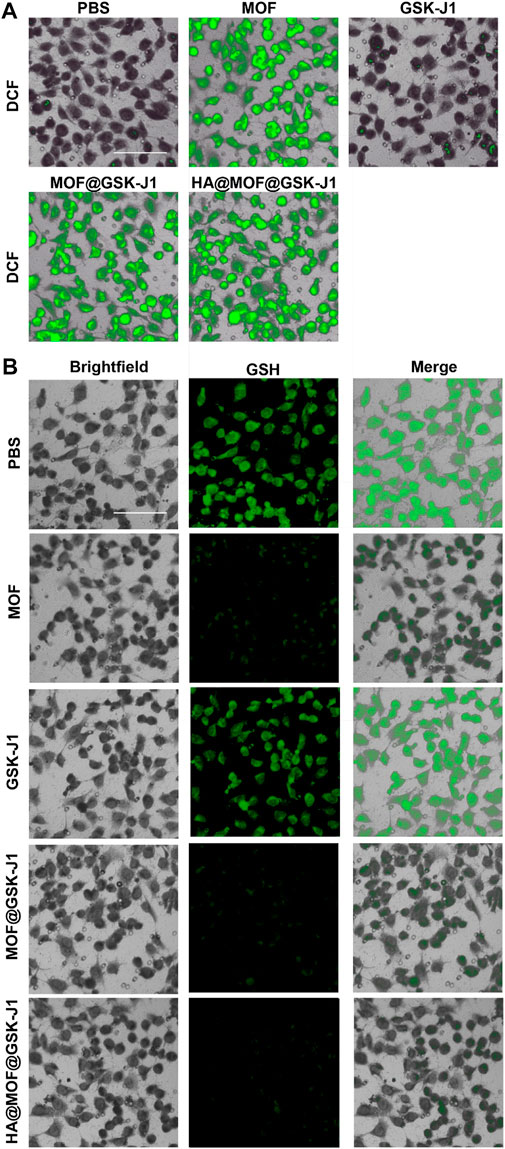
FIGURE 3. CLSM images of intracellular (A) ROS generation and (B) GSH consumption by PBS, MOF, GSK-J1, MOF@GSK-J1, and HA@MOF@GSK-J1. Scale bar: 100 μm.
The IC50 of carboplatin in CR SKOV-3 cells (4.70 ± 1.15 μg/ml) was much higher than that of primitive SKOV-3 cells (0.94 ± 0.12 μg/ml), indicating the successful establishment of the CR SKOV-3 cell line (Supplementary Figure S3). Figures 4A–E show that the IC50 of GSK-J1 was lower than that of the MOF. The IC50 values for the CR SKOV-3 cell line were 29.31 ± 5.83 μg/ml for the MOF and 1.56 ± 0.36 μg/ml for GSK-J1, respectively. Furthermore, MOF@GSK-J1 and HA@MOF@GSK-J1 NPs further significantly reduced cell viability. The IC50 values of the CR SKOV-3 cell line were 1.01 ± 0.07 μg/ml for MOF@GSK-J1 and 0.27 ± 0.03 μg/ml for HA@MOF@GSK-J1 NPs, respectively. The IC50 of HA@MOF@GSK-J1 NPs was significantly lower than those of the MOF@GSK-J1 and other treatment groups. Collectively, the HA@MOF@GSK-J1 (CI = 0.24) showed a great synergistic antitumor effect (Synergism if CI-value <0.8).
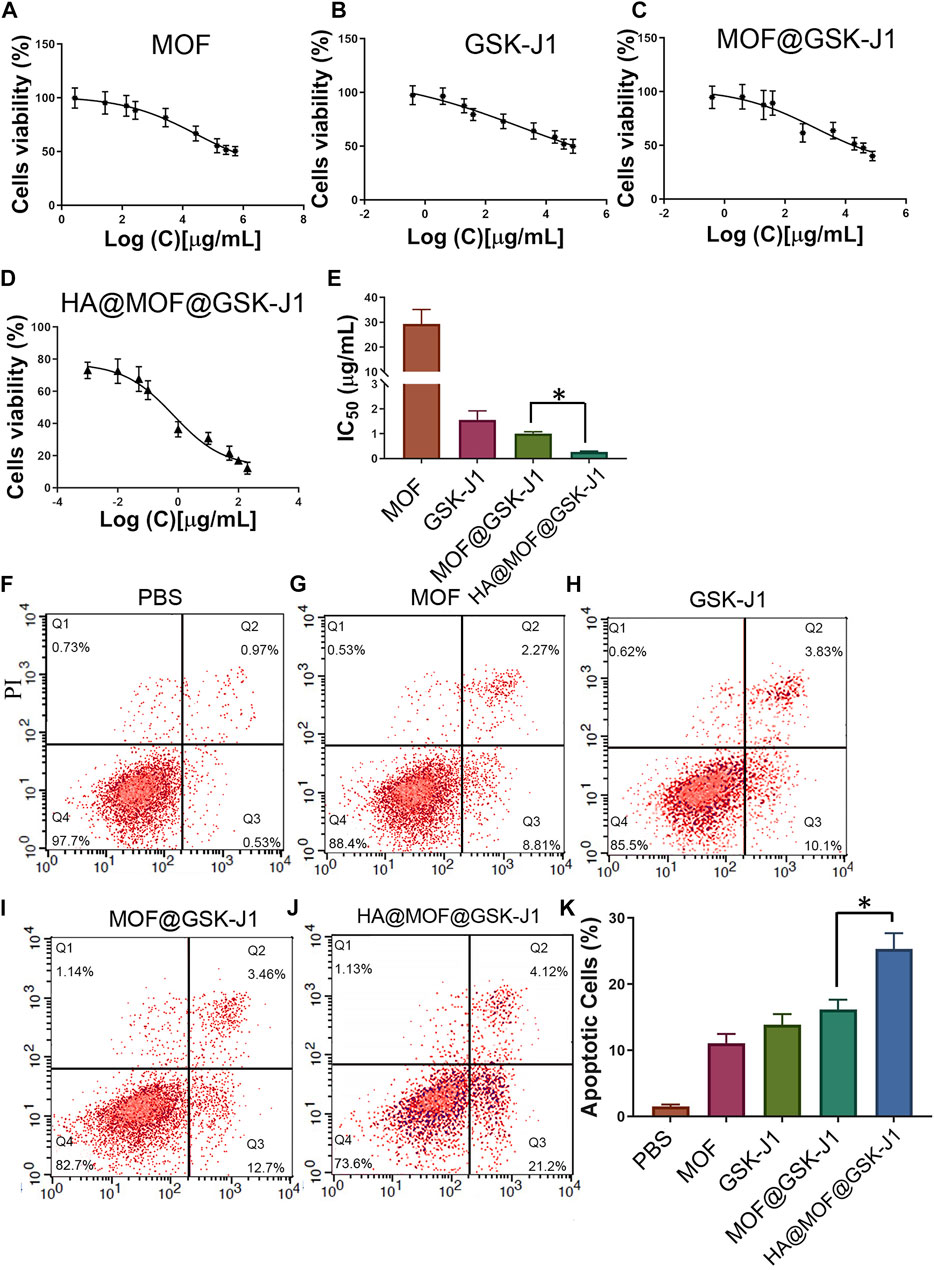
FIGURE 4. (A–D) Cytotoxicities of CR SKOV-3 cells treated with various concentrations of MOF, GSK-J1, MOF@GSK-J1, and HA@MOF@GSK-J1. (E) Histogram of cytotoxicity after different treatments. (F–J) CR SKOV-3 cell apoptosis determined by flow cytometry after incubation with PBS, MOF, GSK-J1, MOF@GSK-J1, and HA@MOF@GSK-J1, respectively. (K) Histogram of CR SKOV-3 cell apoptosis after different treatments. n = 3, *, p < 0.05.
To determine the role of different nanoparticles in CR SKOV-3 cell apoptosis, we used flow cytometry to detect apoptosis. The HA@MOF@GSK-J1 NPs showed the highest apoptosis rate (25.32 ± 2.40%), while the MOF@GSK-J1 NPs, MOF, GSK-J1, and negative control showed apoptosis rates in descending order (Figures 4F–J). Together, as shown in Figure 4K, the HA coating led to a much higher apoptosis rate than those caused by the MOF, GSK-J1, or MOF@GSK-J1, respectively.
The migration ability of tumor cells is a vital indicator of metastasis. Hence, we studied the inhibitory capabilities of MOF (2.73 μg/ml), GSK-J1 (0.39 μg/ml), MOF@GSK-J1 (3.12 μg/ml), and HA@MOF@GSK-J1 (3.78 μg/ml) on the horizontal and vertical migration of cancer cells. As shown in Figures 5A–D, the scratch areas remained nearly unchanged with the HA@MOF@GSK-J1 treatments. The number of migrated cells decreased significantly after HA@MOF@GSK-J1 treatment (Figure 5C). The migration inhibition rate decreased from 48.6 ± 3.9 to 26.8 ± 3.3% after incubation with HA@MOF@GSK-J1 compared to MOF@GSK-J1 (Figure 5D). These results suggested the potential antimetastatic effects of HA@MOF@GSK-J1.

FIGURE 5. Effects of HA@MOF@GSK-J1 on CR SKOV-3 cell migration, invasion, and self-renewal. (A) Confluent CR SKOV-3 cells were scratched and incubated with MOF, GSK-J1, MOF@GSK-J1, and HA@MOF@GSK-J1, respectively. The area covered by the migrating cells was imaged at 0 and 48 h. (B) Rates of wound closure in wound scratches receiving different treatments. (C) CR SKOV-3 cell invasion tested by Boyden chamber assays. Media containing 0.1% FBS (−) was used as the negative control. (D) Quantification of migrated CR SKOV-3 cells after incubation with MOF, GSK-J1, MOF@GSK-J1, and HA@MOF@GSK-J1, respectively. Tumor suppressor effects of GSK-J1 and HA@MOF@GSK-J1 NPs were observed when CR SKOV-3 cells were cultured as tumor spheroids in 3D assay platforms. (E) Representative images of tumor spheroids after incubation with MOF, GSK-J1, MOF@GSK-J1, and HA@MOF@GSK-J1, respectively, for 3 days. Scale bar: 100 μm. (F) Tumor spheroid volumes after treatment with MOF, GSK-J1, MOF@GSK-J1, and HA@MOF@GSK-J1. Data are presented as means ± SD of three independent experiments. *p < 0.05.
We performed sphere formation assays to assess the efficiency of anti-tumor spheroids of HA@MOF@GSK-J1 for 3 days. We observed the formation of smaller cell spheres following HA@MOF@GSK-J1 treatment. The average cell sphere volume among 10 cell spheres in the HA@MOF@GSK-J1 group was much less than those in the MOF@GSK-J1 (13 cell spheres) and other treatment groups (16 cell spheres). As shown in Figures 5E,F, the tumor spheroid volume in the control group was about 123.5 ± 19.7 × 105 μm3 on the 3rd day. The spheroid volume ratios to the control group treated with MOF, GSK-J1, MOF@GSK-J1, and HA@MOF@GSK-J1 were about 52.0%, 19.1%, 7.3%, and 3.6%, respectively. These results suggested that HA@MOF@GSK-J1 treatment enhanced anti-tumor spheroids in CR SKOV-3.
To study the genes involved in CR SKOV-3 cell chemoresistance to platinum therapy, we performed gene expression profiling by sequencing total RNA from the cells after different treatments (Figure 6A). We identified significantly differentially expressed genes that accumulated in critical aspects of cancer function after treatment with HA@MOF@GSK-J1 (Figure 6B). Next, we used qPCR to analyze the expression of selected genes from KEGG-GO analysis after different treatments. We confirmed that HA@MOF@GSK-J1 intensely decreased JMJD3, MYCN, and HER2 levels; these genes are involved in epigenetic regulation, metastasis, and ovarian cancer tumor stemness (Figure 6C). To determine if JMJD3, an H3K27me3-specific demethylase, directly affected the transcriptional regulation of MYCN and HER2 in CR SKOV-3 cells, we used ChIP assays to assess the H3K27me3 levels in the promoter regions of these genes. HA@MOF@GSK-J1 significantly increased the binding of H3K27me3 histone3 in the HER2 promoter region, indicating transcriptional repression. However, we did not detect changes in H3K27me3 levels at the MYCN promoter region (Figure 6D). We also demonstrated that HER2 protein levels were lowest after HA@MOF@GSK-J1 treatment among all treatment groups by western blotting (Figure 6E).
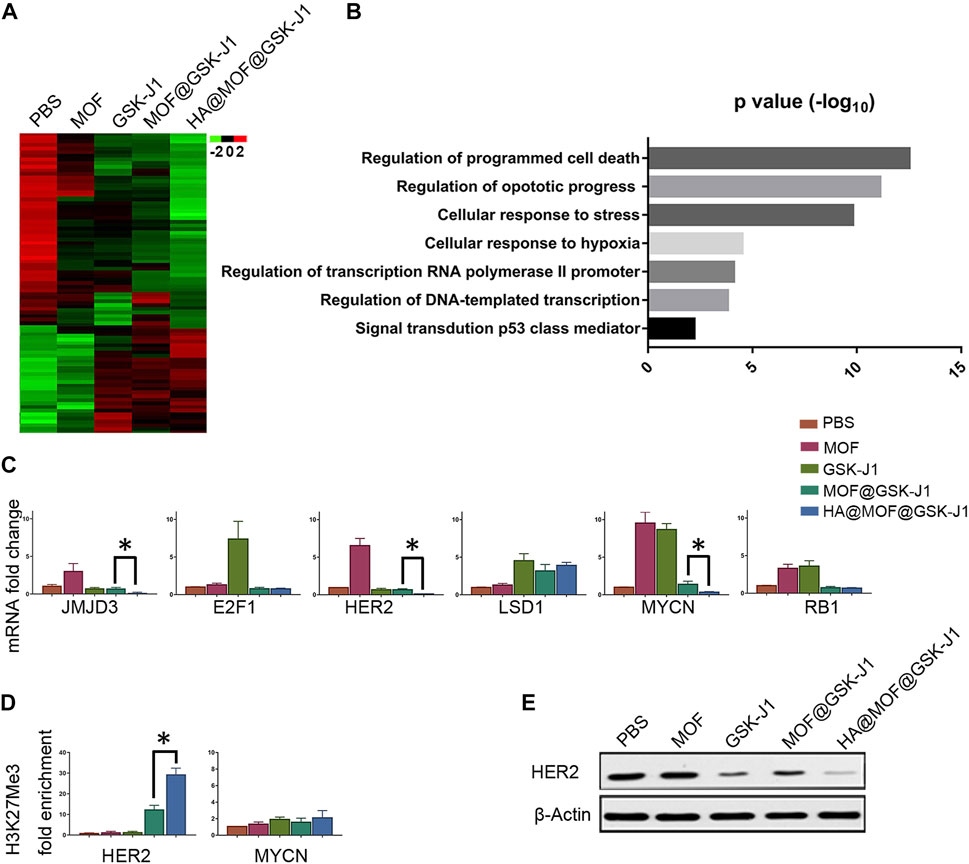
FIGURE 6. HA@MOF@GSK-J1 affects a JMJD3-mediated gene network. (A) Heat-map of gene expression in CR SKOV-3 cells after different treatments (B) KEGG analysis of the biological pathways of the genes in regulated CR SKOV-3 cells following treatment with HA@MOF@GSK-J1 compared to treatment with MOF@GSK-J1 treated. (C) Histograms showing the RNA fold-induction of different treatments. qPCR analysis of CR SKOV-3 cells was performed using the indicated primers after different treatments (Supplementary Table S1). Amplification of GAPDH transcripts was used to normalize the loading of each RNA sample. (D) ChIP-qPCR analysis of H3K27me3 mark of the HER2, and MYCN promoters in CR SKOV-3 cells treated with different formulations. (E) Western blot analysis of HER2 in CR SKOV-3 cells after different treatments. All results are expressed as fold-inductions (means) from three independent experiments. The bars indicate SD (*p < 0.05, Student’s t-tests).
To study the targeting capability of the vehicle, Cy 5.5, MOF@Cy 5.5, and HA@MOF@Cy 5.5 were intravenously injected into the tails of CR SKOV-3 tumor-bearing nude mice and observed on an in vivo image system.
As shown in Figure 7A, mice treated with SEFATU9GQEN5NS41 exhibited the strongest fluorescent signal at the tumor site compared to the other treatment groups for up to 120 h. The fluorescence intensity plateaued at 24 h after injection. We hypothesized that this result occurred largely due to the particular ligand of HA, which enhanced tumor targetability via CD44 receptor-mediated endocytosis, and the protective hydrophilic properties of HA, which increased the circulation time. As shown in Figure 7B, SEFATU9GQEN5NS41 displayed much higher accumulation in tumor tissue compared to that in the vital organs. However, no fluorescence was observed in the brain, suggesting its immunity to the central nervous system.
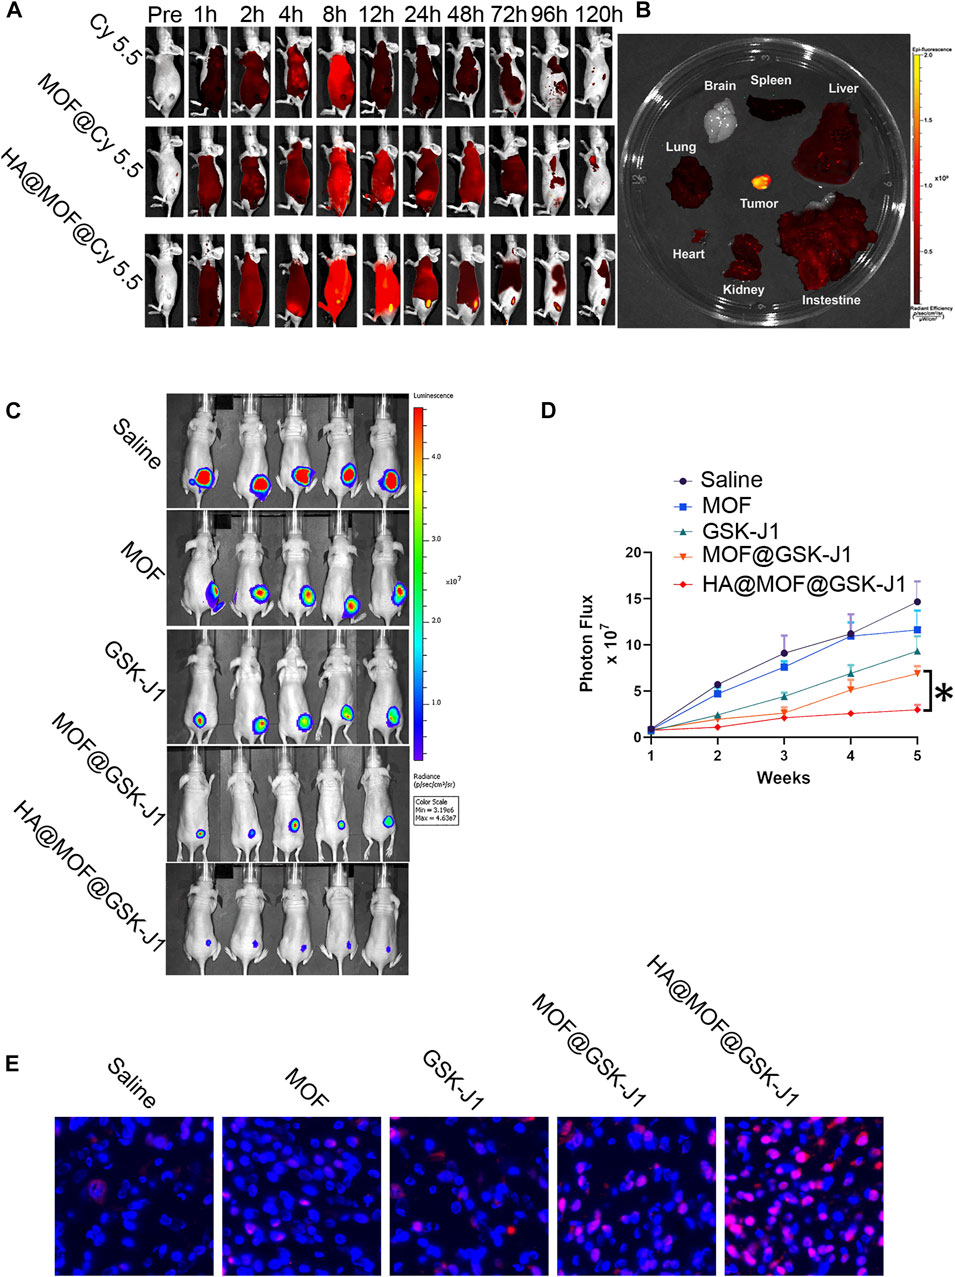
FIGURE 7. (A) Typical fluorescence images of CR SKOV-3 tumor-bearing mice for up to 120 h after tail intravenous injection of Cy 5.5-labeled formulations. (B) Typical fluorescence images of vital organs and tumor tissue dissected from CR SKOV-3 tumor-bearing mice at 24 h after tail intravenous injection of HA@MOF@Cy 5.5. (C) Therapeutic outcomes of mice with CR SKOV-3 xenografts. Bioluminescence imaging of mice after the indicated treatments of 10 mg/kg MOF, GSK-J1, MOF@GSK-J1, and HA@MOF@GSK-J1, respectively. (D) Tumor growth was monitored by bioluminescence using an in-vivo imaging system. Tumor size is expressed in radiance units (photons/s/cm2/sr). The results are presented as means ± SD, n = 5. *p < 0.05. (E) Typical TUNEL immunohistochemical staining images of the tumors following various treatments. Scale bar: 20 μm.
We assessed the in vivo efficacy of MOF, GSK-J1, MOF@GSK-J1, and HA@MOF@GSK-J1 against ovarian cancer based on the measurement of luciferase expression in in vivo bioluminescence imaging. The bioluminescence intensities of the tumors were monitored 4 weeks after treatment. As shown in Figures 7C,D, bioluminescence imaging revealed different therapeutic effects. Rapid tumor growth in the saline-treated control group was observed, while the tumor growth in the MOF and GSK-J1-treated groups was slightly less. In contrast to the MOF and GSK-J1-treated groups, the tumor growth in the MOF@GSK-J1-treated group was the slowest, with the lowest tumor bioluminescence values among all treatment groups.
To further investigate the anticancer mechanism of HA@MOF@GSK-J1 at the molecular level, TUNEL assays were performed to detect apoptosis. The fluorescent images demonstrated the highest apoptotic cell ratio in the HA@MOF@GSK-J1 group (Figure 7E). In contrast, the MOF and GSK-J1 groups showed the lowest ratios among the treatment groups (Figure 7E). These results indicated the potent anticancer efficacy of HA@MOF@GSK-J1.
Histological examinations of the major organs including the heart, liver, spleen, kidneys, lungs, and brain of the experimental animals were evaluated by hematoxylin-eosin (H&E) staining (Figure 8A). No abnormal cellular structures or systemic toxicity were observed in normal mice (without tumor xenograft) treated with MOF, GSK-J1, MOF@GSK-J1, and HA@MOF@GSK-J1. The lack of significant weight loss during treatment also confirmed the safety of these treatments (Figure 8B).
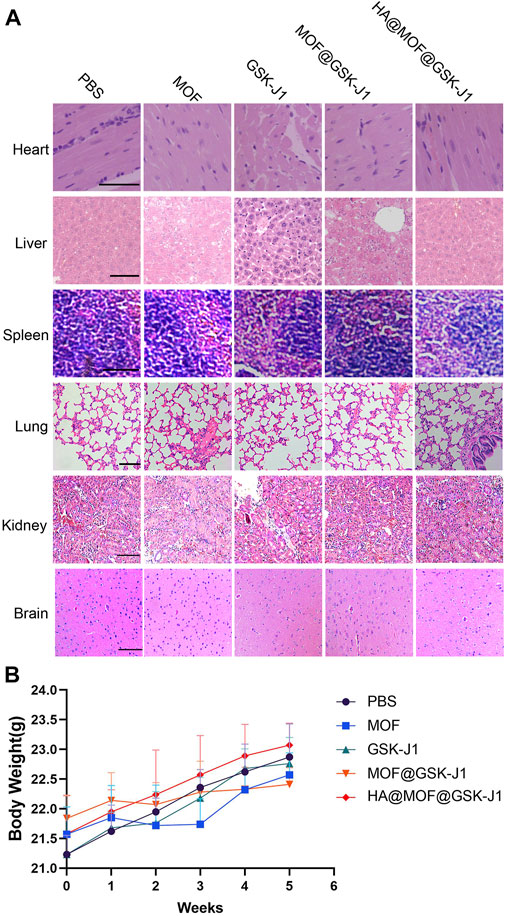
FIGURE 8. (A) Hematoxylin and eosin (HE) staining of the vital organs of healthy mice treated with MOF, GSK-J1, MOF@GSK-J1, and HA@MOF@GSK-J1. Scale bar: 100 μm. (B) Body weight changes of nude mice bearing CR SKOV-3 tumors after the intravenous injection of different formulations. n = 5.
To explore the potential clinical utility of GSK-J1 in carboplatin-resistant ovarian cancer, we evaluated the antitumor effect of GSK-J1-loaded HA-covered MOF, in which the combination of HA@MOF@GSK-J1 was the most effective against carboplatin-resistant cells and in the ovarian animal model.
Reactive oxygen species (ROS) are highly reactive molecules derived from oxygen and produced in cells by oxidases (Wang et al., 2019). Besides free-radical and non-free radical oxygen-containing molecules, ROS can be generated from reactive nitrogen and transition metals such as iron (Fe), copper (Cu), and sulfur species (Bicalho et al., 2021). Furthermore, metal-based nanoparticles such as MOFs can also produce ROS (Xie et al., 2021).
In our study, we synthesized nanoscale MIL-100(Fe) via a hydrothermal route with Fe (III) salt and H3BTC. The metal-organic framework-Fe3+ (MOF) had dominant characteristics including high surface area and porosity, wide flexibility, and shape tunability (Xie et al., 2021). Evidence suggests that Fe3+-containing MOFs could only degrade and release ferrous iron ions in low-pH environments (pH 2.0–5.0) (Chen et al., 2022), which could be generated by the following reaction:
Furthermore, the ferrous iron released from MOFs may react with H2O2 to become ferric ions and release •OH radicals to damage cancer cells according to the following chemical reaction.
Hence, as shown in Figure 3, formulations containing MOF can generate intensive ROS after uptake by CR SKOV-3 cells.
Although MOFs are considered excellent carriers for GSK-J1; however, among the challenges facing the use of MOF-based nanocarriers, their colloidal stability and the premature release of drug cargo are the most concerning (Xu et al., 2022). In MOF-based nanocarriers, premature release can occur due to the nature of the interaction between the drug and the MOF (Liu et al., 2021) Therefore, MOFs may serve as promising carriers for anti-cancer treatment only after proper evaluation.
HA comprises alternating D-glucuronic acid and N-acetylglucosamine units (Cadete and Alonso, 2016). HA, which has a high affinity for CD44 receptors, has also been used as a targeting moiety (Yang et al., 2020b). HA has excellent biocompatibility, biodegradation, and specific targeting for CD44 (Song et al., 2022). HA, with a negative charge, has good interface affinity with MOFs, whose surface charge is positive, to form a stable nanoscale shell. Moreover, HA-based surface modification may give Bio-MOF targeted anti-cancer characteristics including the promotion of aggregation on tumor sites and increased MOF uptake by CD44-positive cancer cells (Pieterse et al., 2019). Therefore, higher anticancer treatment efficacy may be achieved by using tumor-targeting ligand HA to encapsulate and stabilize MOFs.
In the present study, the protective coating of HA resulted in a more stable GSK-J1-loaded MOF with a sustainable release when tested in cell culture media (Figure 2). In vitro assessment of cellular uptake in CR SKOV-3 cells revealed a preferential uptake of HA@MOF@Cy 5.5 into CR SKOV-3 ovarian cancer cells overexpressing CD44 (a cell surface glycoprotein). One possible reason for this differential uptake is that the HA coating of MOFs may specifically conjugate with the CD44 on the surface of CR SKOV-3 ovarian cancer cells (Shariati et al., 2020). The in vivo results also confirmed that HA coating leads to the preferential accumulation of MOFs and their payloads in CR SKOV-3 ovarian cancer sites after tail vein injection of HA@MOF@Cy 5.5 (Figure 7).
Ovarian cancer is the deadliest gynecological cancer (Shahin et al., 2018). Increasing evidence suggests that acquired resistance originates from abnormal epigenetic changes to tumor suppressor genes (Oing et al., 2019) To identify possible signal molecule involved in the anti-ovarian cancer effect of HA@MOF@GSK-J1, we performed DNA microarray gene expression analysis in CR SKOV-3 cells (Figure 6A). HA@MOF@GSK-J1 treatment markedly decreased HER2 expression and affected the expression of many genes associated with cancer proliferation (Figure 6B). These findings suggest that HA@MOF@GSK-J1 may have multiple targets for its anti-ovarian cancer effects.
More specifically, the mechanism involves HA@MOF@GSK-J1-induced suppression of HER2 expression and protein levels (Figure 6C,E). Many studies have confirmed the effects of HER2 overexpression on cancer progression and poor prognosis in ovarian cancer (Satpathy et al., 2019; Cho et al., 2020; Dhritlahre and Saneja, 2021). Therefore, we analyzed epigenetic alterations in the HER2 promoter region. HA@MOF@GSK-J1 induced increased H3K27me3 (Figure 6D). Therefore, HA@MOF@GSK-J1 showed promising epigenetic suppressing effects to effectively treat ovarian cancer. These effects suggest that HA@MOF@GSK-J1 may decrease HER2 expression by increasing H3K27 methylation.
The results of this study demonstrated that the combination of GSK-J1 and MOF may have synergistic effects in the treatment of carboplatin-resistant ovarian cancer because MOF increased the levels of reactive oxygen species while GSK-J1 reduced HER2 levels in cancer cells. We also found that covering MOF@GSK-J1 with hyaluronic acid improved the targeted release of GSK-J1 within ovarian tumors. Furthermore, HER2 activity may be reduced by HA@MOF@GSK-J1 through the activation of H3K27 methylation in its promoter area. Therefore, the high sensitivity of carboplatin-resistant cells to HA@MOF@GSK-J1 could be exploited to develop novel combined adjuvant therapies for this rapidly progressing and invariably lethal cancer.
The original contributions presented in the study are included in the article/Supplementary Material. Further inquiries can be directed to the corresponding author.
The animal study was reviewed and approved by the Animal Ethics Committee of Guilin Medical University.
JM led the research. BY designed the experimental strategy and analyzed the data. WL and ML carried out the experimental studies. BY and JM wrote the manuscript. All authors have read and approved the submitted manuscript.
This work was supported by the Natural Science Foundation of Guangxi Province (2018JJA140084, 2018GXNSFAA281170, 2019JJA140599, and 2019GXNSFAA245095).
The authors declare that the research was conducted in the absence of any commercial or financial relationships that could be construed as a potential conflict of interest.
All claims expressed in this article are solely those of the authors and do not necessarily represent those of their affiliated organizations, or those of the publisher, the editors, and the reviewers. Any product that may be evaluated in this article, or claim that may be made by its manufacturer, is not guaranteed or endorsed by the publisher.
The Supplementary Material for this article can be found online at: https://www.frontiersin.org/articles/10.3389/fphar.2022.1023719/full#supplementary-material
Bicalho, H. A., Quezada-Novoa, V., and Howarth, A. J. (2021). Metal–organic frameworks for the generation of reactive oxygen species. Chem. Phys. Rev. 2 (4), 041301. doi:10.1063/5.0060141
Cadete, A., and Alonso, M. J. (2016). Targeting cancer with hyaluronic acid-based nanocarriers: recent advances and translational perspectives. Nanomedicine 11 (17), 2341–2357. doi:10.2217/nnm-2016-0117
Chen, M.-L., Lu, T.-H., Long, L.-L., Xu, Z., Ding, L., and Cheng, Y.-H. (2022). NH2-Fe-MILs for effective adsorption and Fenton-like degradation of imidacloprid: Removal performance and mechanism investigation. Environ. Eng. Res. 27 (2), 200702. doi:10.4491/eer.2020.702
Cho, H., Al-saden, N., Lam, H., Möbus, J., Reilly, R. M., and Winnik, M. A. (2020). A comparison of DFO and DFO* conjugated to trastuzumab-DM1 for complexing 89Zr – in vitro stability and in vivo microPET/CT imaging studies in NOD/SCID mice with HER2-positive SK-OV-3 human ovarian cancer xenografts. Nucl. Med. Biol. 84-85, 11–19. doi:10.1016/j.nucmedbio.2019.12.009
Curry, E., Zeller, C., Masrour, N., Patten, D. K., Gallon, J., Wilhelm-Benartzi, C. S., et al. (2018). Genes predisposed to DNA hypermethylation during acquired resistance to chemotherapy are identified in ovarian tumors by bivalent Chromatin domains at initial diagnosis. Cancer Res. 78 (6), 1383–1391. doi:10.1158/0008-5472.CAN-17-1650
Dhritlahre, R. K., and Saneja, A. (2021). Recent advances in HER2-targeted delivery for cancer therapy. Drug Discov. Today 26 (5), 1319–1329. doi:10.1016/j.drudis.2020.12.014
Duan, Y.-C., Zhang, S.-J., Shi, X.-J., Jin, L.-F., Yu, T., Song, Y., et al. (2021). Research progress of dual inhibitors targeting crosstalk between histone epigenetic modulators for cancer therapy. Eur. J. Med. Chem. 222, 113588. doi:10.1016/j.ejmech.2021.113588
Fardi, M., Solali, S., and Farshdousti Hagh, M. (2018). Epigenetic mechanisms as a new approach in cancer treatment: An updated review. Genes Dis. 5 (4), 304–311. doi:10.1016/j.gendis.2018.06.003
Huang, G., and Huang, H. (2018). Hyaluronic acid-based biopharmaceutical delivery and tumor-targeted drug delivery system. J. Control. Release 278, 122–126. doi:10.1016/j.jconrel.2018.04.015
Huang, G., and Huang, H. (2018). Application of hyaluronic acid as carriers in drug delivery. Drug Deliv. 25 (1), 766–772. doi:10.1080/10717544.2018.1450910
Li, K., Xu, K., He, Y., Lu, L., Mao, Y., Gao, P., et al. (2021). Functionalized tumor‐targeting nanosheets exhibiting Fe(II) overloading and GSH consumption for ferroptosis activation in liver tumor. Small 17 (40), 2102046. doi:10.1002/smll.202102046
Li, J., Zeng, L., Wang, Z., Chen, H., Fang, S., Wang, J., et al. (2022). Cycloruthenated self-assembly with metabolic inhibition to efficiently overcome multidrug resistance in cancers. Adv. Mat. 34 (1), 2100245. doi:10.1002/adma.202100245
Liu, D., Zhang, X.-X., Li, M.-C., Cao, C.-H., Wan, D.-Y., Xi, B.-X., et al. (2018). C/EBPβ enhances platinum resistance of ovarian cancer cells by reprogramming H3K79 methylation. Nat. Commun. 9 (1), 1739. doi:10.1038/s41467-018-03590-5
Liu, X., Liang, T., Zhang, R., Ding, Q., Wu, S., Li, C., et al. (2021). Iron-based metal–organic frameworks in drug delivery and biomedicine. ACS Appl. Mat. Interfaces 13 (8), 9643–9655. doi:10.1021/acsami.0c21486
Natanzon, Y., Goode, E. L., and Cunningham, J. M. (2018). Epigenetics in ovarian cancer. Semin. Cancer Biol. 51, 160–169. doi:10.1016/j.semcancer.2017.08.003
Oing, C., Skowron, M. A., Bokemeyer, C., and Nettersheim, D. (2019). Epigenetic treatment combinations to effectively target cisplatin-resistant germ cell tumors: Past, present and future considerations. Andrology 7 (4), 487–497. doi:10.1111/andr.12611
Patch, A.-M., Christie, E. L., Etemadmoghadam, D., Garsed, D. W., George, J., Fereday, S., et al. (2015). Whole-genome characterization of chemoresistant ovarian cancer. Nature 521 (7553), 489–494. doi:10.1038/nature14410
Pieterse, Z., Amaya-Padilla, M. A., Singomat, T., Binju, M., Madjid, B. D., Yu, Y., et al. (2019). Ovarian cancer stem cells and their role in drug resistance. Int. J. Biochem. Cell Biol. 106, 117–126. doi:10.1016/j.biocel.2018.11.012
Pugazhendhi, A., Edison, T. N. J. I., Karuppusamy, I., and Kathirvel, B. (2018). Inorganic nanoparticles: A potential cancer therapy for human welfare. Int. J. Pharm. 539 (1), 104–111. doi:10.1016/j.ijpharm.2018.01.034
Ruth, K. S., Day, F. R., Hussain, J., Martínez-Marchal, A., Aiken, C. E., Azad, A., et al. (2021). Genetic insights into biological mechanisms governing human ovarian ageing. Nature 596 (7872), 393–397. doi:10.1038/s41586-021-03779-7
Satpathy, M., Wang, L., Zielinski, R. J., Qian, W., Wang, Y. A., Mohs, A. M., et al. (2019). Targeted drug delivery and image-guided therapy of heterogeneous ovarian cancer using HER2-targeted theranostic nanoparticles. Theranostics 9 (3), 778–795. doi:10.7150/thno.29964
Shahin, S. A., Wang, R., Simargi, S. I., Contreras, A., Parra Echavarria, L., Qu, L., et al. (2018). Hyaluronic acid conjugated nanoparticle delivery of siRNA against TWIST reduces tumor burden and enhances sensitivity to cisplatin in ovarian cancer. Nanomedicine 14 (4), 1381–1394. doi:10.1016/j.nano.2018.04.008
Shang, S., Yang, J., Jazaeri, A. A., Duval, A. J., Tufan, T., Lopes Fischer, N., et al. (2019). Chemotherapy-induced distal enhancers drive transcriptional programs to maintain the chemoresistant state in ovarian cancer. Cancer Res. 79 (18), 4599–4611. doi:10.1158/0008-5472.CAN-19-0215
Shariati, M., Lollo, G., Matha, K., Descamps, B., Vanhove, C., Van de Sande, L., et al. (2020). Synergy between intraperitoneal aerosolization (PIPAC) and cancer nanomedicine: Cisplatin-loaded polyarginine-hyaluronic acid nanocarriers efficiently eradicate peritoneal metastasis of advanced human ovarian cancer. ACS Appl. Mat. Interfaces 12 (26), 29024–29036. doi:10.1021/acsami.0c05554
Singh, A., Gupta, S., and Sachan, M. (2019). Epigenetic biomarkers in the management of ovarian cancer: Current prospectives. Front. Cell Dev. Biol. 7, 182. doi:10.3389/fcell.2019.00182
Song, M., Cui, M., and Liu, K. (2022). Therapeutic strategies to overcome cisplatin resistance in ovarian cancer. Eur. J. Med. Chem. 232, 114205. doi:10.1016/j.ejmech.2022.114205
Tong, P.-H., Zhu, L., Zang, Y., Li, J., He, X.-P., and James, T. D. (2021). Metal–organic frameworks (MOFs) as host materials for the enhanced delivery of biomacromolecular therapeutics. Chem. Commun. 57 (91), 12098–12110. doi:10.1039/d1cc05157a
Wang, S., Yu, G., Wang, Z., Jacobson, O., Lin, L. S., Yang, W., et al. (2019). Enhanced antitumor efficacy by a cascade of reactive oxygen species generation and drug release. Angew. Chem. Int. Ed. Engl. 131 (41), 14900–14905. doi:10.1002/ange.201908997
Xie, A., Li, H., Hao, Y., and Zhang, Y. (2021). Tuning the toxicity of reactive oxygen species into advanced tumor therapy. Nanoscale Res. Lett. 16 (1), 142. doi:10.1186/s11671-021-03599-8
Xu, Y., Liu, S.-Y., Zeng, L., Ma, H., Zhang, Y., Yang, H., et al. (2022). An enzyme-engineered nonporous copper(I) coordination polymer nanoplatform for cuproptosis-based synergistic cancer therapy. Adv. Mater, e2204733. doi:10.1002/adma.202204733
Yang, B., Ding, L., Yao, H., Chen, Y., and Shi, J. (2020). A metal-organic framework (MOF) fenton nanoagent-enabled nanocatalytic cancer therapy in synergy with autophagy inhibition. Adv. Mat. 32 (12), 1907152. doi:10.1002/adma.201907152
Yang, Z., Xu, H., and Zhao, X. (2020). Designer self-assembling peptide hydrogels to engineer 3D cell microenvironments for cell constructs formation and precise oncology remodeling in ovarian cancer. Adv. Sci. 7 (9), 1903718. doi:10.1002/advs.201903718
Zeng, L., Li, J., Zhang, C., Zhang, Y. K., Zhang, W., Huang, J., et al. (2019). An organoruthenium complex overcomes ABCG2-mediated multidrug resistance via multiple mechanisms. Chem. Commun. 55 (26), 3833–3836. doi:10.1039/c9cc00882a
Zhang, W., Cheng, J., Diao, P., Wang, D., Zhang, W., Jiang, H., et al. (2020). Therapeutically targeting head and neck squamous cell carcinoma through synergistic inhibition of LSD1 and JMJD3 by TCP and GSK-J1. Br. J. Cancer 122 (4), 528–538. doi:10.1038/s41416-019-0680-6
Keywords: ovarian cancer, hyaluronic acid, MOF, HER2, epigenetic modification
Citation: Yang B, Liu W, Li M and Mo J (2022) GSK-J1-loaded, hyaluronic acid-decorated metal-organic frameworks for the treatment of ovarian cancer. Front. Pharmacol. 13:1023719. doi: 10.3389/fphar.2022.1023719
Received: 20 August 2022; Accepted: 19 October 2022;
Published: 07 November 2022.
Edited by:
Hesham M. Korashy, Qatar University, QatarReviewed by:
Rong Xu, Huazhong University of Science and Technology, ChinaCopyright © 2022 Yang, Liu, Li and Mo. This is an open-access article distributed under the terms of the Creative Commons Attribution License (CC BY). The use, distribution or reproduction in other forums is permitted, provided the original author(s) and the copyright owner(s) are credited and that the original publication in this journal is cited, in accordance with accepted academic practice. No use, distribution or reproduction is permitted which does not comply with these terms.
*Correspondence: Jingxin Mo, SmluZ3hpbi5tb0Bob3RtYWlsLmNvbQ==
Disclaimer: All claims expressed in this article are solely those of the authors and do not necessarily represent those of their affiliated organizations, or those of the publisher, the editors and the reviewers. Any product that may be evaluated in this article or claim that may be made by its manufacturer is not guaranteed or endorsed by the publisher.
Research integrity at Frontiers
Learn more about the work of our research integrity team to safeguard the quality of each article we publish.