 Yixiao Zhai
 Jingyu Zhang2†
 Tianjiao Zhang
 Yue Gong
 Yuming Zhao
95% of researchers rate our articles as excellent or good
Learn more about the work of our research integrity team to safeguard the quality of each article we publish.
Find out more
METHODS article
Front. Pharmacol. , 18 January 2022
Sec. Experimental Pharmacology and Drug Discovery
Volume 12 - 2021 | https://doi.org/10.3389/fphar.2021.818115
This article is part of the Research Topic Artificial Intelligence for Drug Design, Development and Therapy View all 20 articles
Antioxidant proteins can not only balance the oxidative stress in the body, but are also an important component of antioxidant drugs. Accurate identification of antioxidant proteins is essential to help humans fight diseases and develop new drugs. In this paper, we developed a friendly method AOPM to identify antioxidant proteins. 188D and the Composition of k-spaced Amino Acid Pairs were adopted as the feature extraction method. In addition, the Max-Relevance-Max-Distance algorithm (MRMD) and random forest were the feature selection and classifier, respectively. We used 5-folds cross-validation and independent test dataset to evaluate our model. On the test dataset, AOPM presented a higher performance compared with the state-of-the-art methods. The sensitivity, specificity, accuracy, Matthew’s Correlation Coefficient and an Area Under the Curve reached 87.3, 94.2, 92.0%, 0.815 and 0.972, respectively. In addition, AOPM still has excellent performance in predicting the catalytic enzymes of antioxidant drugs. This work proved the feasibility of virtual drug screening based on sequence information and provided new ideas and solutions for drug development.
In the process of biological metabolism, reactive oxygen species (ROS) are produced. The antioxidant system in the organism can eliminate ROS, but there is a limit. Too high concentrations of ROS are not eliminated in time and will cause oxidative stress (OS) (Birben et al., 2012; Yang et al., 2020; Zhao S et al., 2021). According to research, OS response plays an important role in the pathogenesis of many diseases. Long-term response to OS will destroy the structure of macromolecules and even affect the senescence and death of cells. Research by Azhwar Raghunath’s team (Raghunath et al., 2018) has shown that the protective effect against oxidative stress is a cis-acting element of antioxidant proteins in the regulation of Nrf2 target genes, which plays a key role in redox homeostasis. Therefore, antioxidant proteins have been used in the development and screening of antioxidant drugs, which can treat cancer, neurodegenerative diseases, cardiovascular, metabolic and other diseases with oxidative stress (Liguori et al., 2018; Eleutherio et al., 2021; Zia et al., 2021).
Traditional antioxidant drug screening and discovery are carried out through biochemical experiments, which not only has a long time period and high cost, but also has the risk of failure in experiments (Lv et al., 2020a; Cheng et al., 2020; Cheng Y et al., 2021; Lv Z et al., 2021; Dong et al., 2021; Goto et al., 2021; Zeng et al., 2022). With the continuous improvement of computer technology and genome databases, methods such as data mining and machine learning are more and more widely used in biological information, drug screening and other fields (Cheng et al., 2018; Wang et al., 2018; Ding et al., 2019; Wang et al., 2019; Zeng et al., 2020a; Zhang CH et al., 2020; Zhang J et al., 2020; Lyu et al., 2020; Zhao X et al., 2021; Niu et al., 2021). In recent years, many researchers have been exploring machine learning models suitable for identifying antioxidant proteins. The Feng team adopted the Naive Bayesian method and the AodPred model to identify antioxidant proteins, which proposed in 2013 (Feng et al., 2013) and 2016 (Feng et al., 2016) respectively. AodPred is based on a vector machine model with 3 spaced residual pairs, which is significantly better than Naive Bayes but its ability to identify antioxidant proteins is still limited. In 2016, the integration method used by Zhang showed that the secondary structure of proteins helps distinguish antioxidant proteins from non-antioxidant proteins, but the method of feature extraction for this model is complicated and time-consuming. Subsequently, both Xu et al. (2018), Meng et al. (2019) adopted the support vector machine model to identify the target protein. In 2020 (Zhai et al., 2020), our team explored the random forest combined with SMOTE to identify antioxidant proteins. The ability to identify antioxidant proteins has improved a lot compared to the original Feng. However, when dividing the training set and the data set for the three of them, there are ambiguities and the test set does not reflect the original data distribution. In addition, these researchers did not consider whether the model can be applied to the screening of antioxidant drugs and other practical problems when they created the model for identifying antioxidant proteins (Wang et al., 2020; Chen et al., 2021). In fact, this is a very good idea, but no one has done so yet.
In response to these problems, we exploited a method, AOPM, which is a pipeline for identifying antioxidant protein sequence data. This model can also be used in the application of virtual antioxidant drug screening. To facilitate understanding, Figure 1 shows the flow chart of AOPM. The feature extraction part adopted amino acid composition and physical and chemical properties to extract 188-dimensional features (Liu T et al., 2020) from protein sequences, which was same with Xu. The Composition of k-spaced Amino Acid Pairs (CKSAAP) (Usman and Lee, 2019) was also adopted as the feature extraction methods. In addition, we preferred a very mature feature selection method, the Max-Relevance-Max-Distance algorithm (MRMD) (Zou et al., 2016; Lv et al., 2020b), which was based on the Pearson correlation coefficient and could be exploited to single out the best feature subset for reducing the computational complexity and noise. On the contrary, we chose a 5-fold cross-validation as the model selection method and random forest (Liaw and Wiener, 2002; Lv et al., 2019) as the classifier, which has the characteristics of a fast running speed and less overfitting, rather than the very popular support vector machine.

FIGURE 1. The function structure of AOPM.
Finally, on the antioxidant protein test dataset, after AOPM processing. The sensitivity (SN), specificity (SP), accuracy (ACC), Matthew’s Correlation Coefficient (MCC) and an Area Under the Curve (AUC) reached 87.3, 94.2, 92.0%, 0.815 and 0.972, respectively, which were significantly better than the results with the AodPred and Zhai. In addition, AOPM still has excellent performance in identifying the proteins that make up antioxidant drugs, providing new ideas for exploring the research of drug components. In addition, when using AOPM to predict the 36 protein sequences located in the DrugBank (Wishart et al., 2018) data set, 11 of them were judged to have the function of antioxidants. Among them, Superoxide dismutase [Cu-Zn] is indeed a protein with antioxidant capacity (Dzięgielewska-Gęsiak et al., 2014; Tiwari et al., 2019; Ściskalska et al., 2020). This work proved the feasibility of virtual drug screening based on sequence information and provided new ideas and solutions for drug development (Liu J et al., 2020; Jakhar et al., 2020; Shaker et al., 2021; Yan et al., 2021; Zhu et al., 2021).
We first collected proteins with antioxidant activities from the antioxidant protein database (AOD) (Feng et al., 2017). AOD (Antioxidant Protein Database) is a manually planned and experimentally verified antioxidant protein database. The data and information are extracted from UniProtKB/Swiss-Prot (release 2016_11) according to the following steps: 1) only proteins with experimentally proven antioxidant activities were selected; and 2) ambiguous proteins were excluded, such as those containing nonstandard letters like “B,” “X,” and “Z”. After this rigorous screening, we obtained 710 protein sequences as the original positive samples for the experiment. The negative samples were 1552 PDB proteins with identical values <20%, which were picked by PISCES-culled.
Then we divided the original data set into training set and test set according to the ratio of 4:1. The training set contains 568 antioxidant proteins and 1242 non-antioxidant proteins. The rest of the data are the test set, including 142 antioxidant proteins and 310 non-antioxidant proteins. The detailed data set information is shown in Table 1.

TABLE 1. Antioxidant protein datasets information.
In addition, in the DrugBank database, 19 drugs were found to have antioxidant properties. On this basis, we screened out 36 protein sequences of enzymes that play a catalytic role in antioxidant drugs. This data set was used to test the prediction performance of AOPM in the real data set. The UniProt IDs of 36 protein sequences were shown in Table 2. In addition, a protein can act as a catalytic enzyme in different antioxidants, as shown in Figure 2.
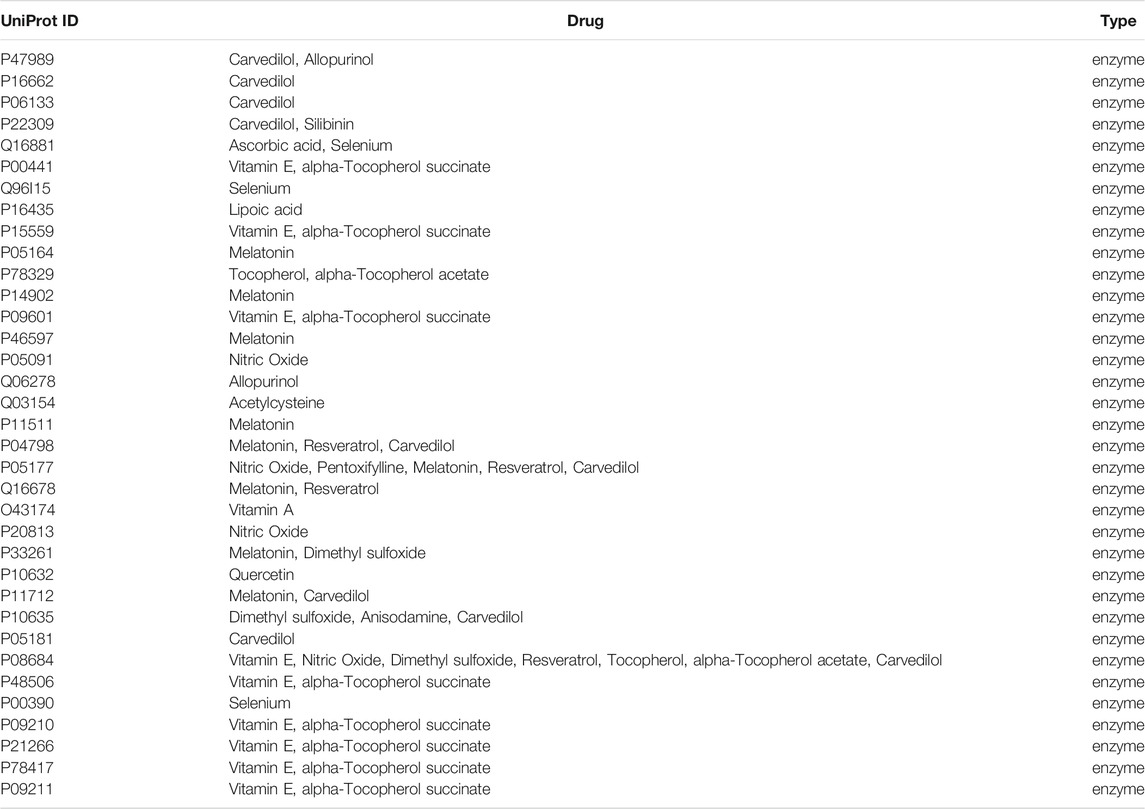
TABLE 2. The UniProt ID of 36 protein sequences.
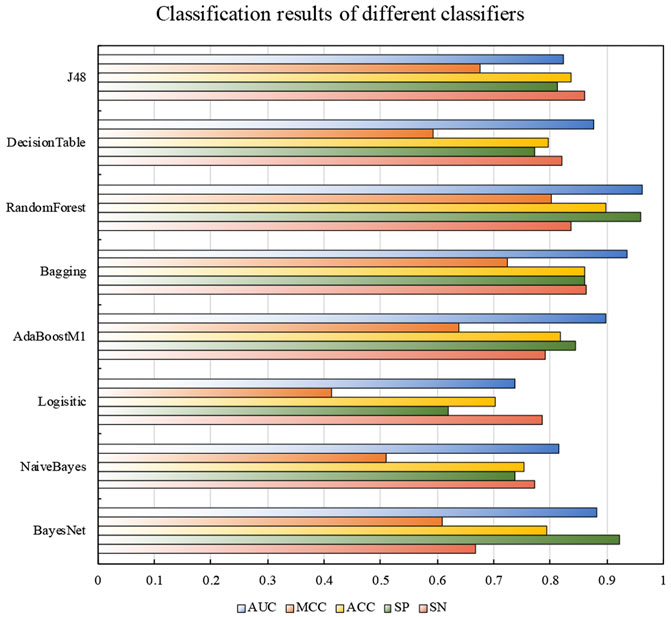
FIGURE 2. The number of catalytic enzymes contained in different antioxidants. The catalytic enzymes of antioxidant drugs are diverse. For example, for antioxidant drugs such as Vitamin E and Carvedilol, the number of enzymes that can catalyze is as high as 9 types. Of course, some antioxidant drugs can only be catalyzed by a specific enzyme, Such as Anisodamine, Silibinin, and Lipoic acid.
The number of antioxidant proteins is relatively small. Although the ratio of the number of antioxidant proteins to the number of non-antioxidant proteins in the training set is 1:2, in order to find the characteristics of more clearly distinguishing antioxidant proteins, we performed the training dataset under sampling process. In this study, we selected five different under sampling methods in KEEL (Triguero et al., 2017) to resemble the sample. These five methods included CNN_TomekLinks, CPM, NCL, OSS, and RandomUnderSample.
In the processed data set, the number of antioxidant proteins and non-antioxidant proteins are not exactly the same. The operation of this step is to highlight the characteristics that are beneficial to distinguish antioxidant proteins as much as possible.
In order to obtain sequence information more comprehensive, we adopted feature extraction methods from two perspectives, including sequence composition and the physical and chesmical properties of amino acids (Zulfiqar et al., 2021a; Cheng L et al., 2021; Zhang et al., 2021). Among them, we used the 188D method to extract the characteristic information about the physical and chemical properties of the sequence, and select the Composition of k-spaced Amino Acid Pairs (CKSAAP) (Chen et al., 2007) method to obtain the characteristic information about the sequence composition (Naseer et al., 2020; Long et al., 2020).
The expression form of the amino acid sequence is a string sequence or a discrete multidimensional vector. The multidimensional vector representation method lacks the content of amino acid position information and arrangement sequence; therefore, the research value is small. The descriptive form of the string sequence is that each of the 20 amino acids is represented by a letter, and the letter sequence is used to represent a protein sequence. Since the classifier cannot recognize the string, the feature extraction function of this project uses the 188D feature extraction method to extract useful numerical information from the amino acid sequence as the input of the model.
The 188D feature extraction method is based on 188 features extracted based on protein sequence information and physical and chemical properties. In 2003, the researchers proposed this feature extraction method, which combines the physical and chemical properties of proteins. The 188-dimensional features can be divided into two categories: one is composed of 20 amino acids, and the other is physical and chemical properties, including hydrophobicity, polarity, normalized van der Waals volume, surface tension, charge, polarizability, solvent accessibility, and secondary structure. The dimensions of the different characteristics are shown in Table 3.
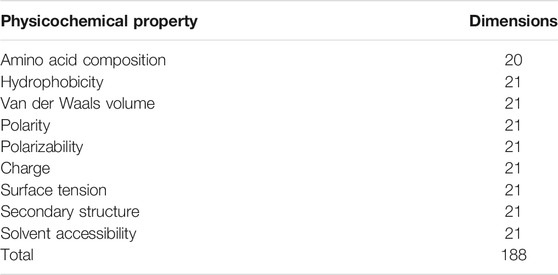
TABLE 3. Ingredients contained in the 188-dimensional feature of a protein.
First, we calculated the corresponding frequencies of the 20 amino acids, which can be expressed as
The 20 amino acids are divided into three types according to their physical and chemical properties. These three categories include content (C), distribution (D) and bivalent frequency (B), which are adopted to describe the physical and chemical properties of proteins. Table 4 shows the amino acid grouping table of the 8 physicochemical properties.
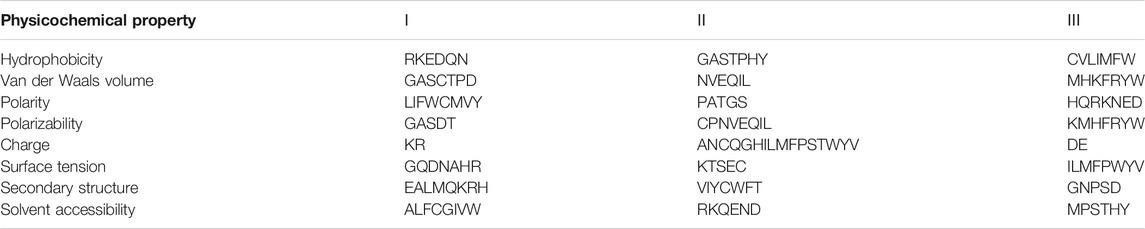
TABLE 4. List of the 3 categories divided according to the physical and chemical properties of proteins.
First, we calculated the frequency characteristics of the three categories, which are represented as
For each group, the first and 25, 50, 75 and 100% dipeptide chain positions are represented by
In addition, we also calculated the number of dipeptides from different groups and obtained the parameters
In the above formula,
The Composition of k-spaced Amino Acid Pairs (CKSAAP) feature delegates the component of amino acids. It represents the frequency calculation of two amino acids separated by
Feature selection obtains the most effective feature subset for classification and recognition of the many features (Wang et al., 2010; Mo et al., 2020; Sheng et al., 2021; Wu et al., 2021). That is, it captures a set of “small but precise” classification features with a small probability of error. While reducing the dimensionality of the feature space in this way, it also speeds up the construction of the classifier model (Yu XP et al., 2021; Long et al., 2021; Yang et al., 2021). In AOPM, the Max-Relevance-Max-Distance algorithm (MRMD) was used for feature selection, which was proposed by Zou.
The MRMD score of each feature consists of two parts: the correlation and distance value between the feature and other features. The Pearson correlation coefficient was used to calculate the correlation between features. It represents the degree of linear correlation between features. The larger the absolute value is, the stronger the degree of linear correlation. The value of
where
According to
All features are arranged in descending order according to the MRMD score. One feature with the highest MRMD score is sequentially added to the feature subset. Then, the feature subset is input into the selected classifier for classification, and the classification accuracies of different feature subsets are recorded. In the end, the feature subset with the highest accuracy and the least number of features is the result of feature selection.
Random forest is an ensemble algorithm that integrates multiple trees through the idea of ensemble learning. It has been widely used in bioinformatics (Jin et al., 2019; Manavalan et al., 2019a; Manavalan et al., 2019b; Riaz and Li, 2019; Su et al., 2019; Ściskalska et al., 2020; Zeng et al., 2020b; Ao et al., 2021; Zulfiqar et al., 2021b). It consists of N decision trees. After the sample is input into the random forest, each decision tree will get a classification result, and then N trees will get N classification results. Count the voting results of all classification results, and the category with the most votes is the final output.
In our research, we use the random forest as the classifier because it has several advantages that suit our data. The dimensionality of the extracted feature set is high, even after dimensionality reduction, it still belongs to high-dimensional data. Random forest is less affected by parameters, and when processing high-dimensional data, the accuracy is not affected. In addition, using random forest processing, the running speed is fast, there is no need to debug many parameters like SVM, and the time cost is low.
At present, AOPM can only deal with two classification problems. There are three commonly used evaluation methods, including the independent data set sampling test, the k-fold cross validation and the jack-knife test (Wang et al., 2008; Wei et al., 2014; Wei et al., 2017; Basith et al., 2018; Wei et al., 2018; Lv H et al., 2021; Yu L et al., 2021; Wu and Yu, 2021). To simplify the calculation, we adopted 5-fold cross-validation to compare the classifiers. And test the robustness of the model on the test dataset.
In addition to the commonly used evaluation indicators sensitivity (SN), specificity (SP) and accuracy (ACC), AOPM also provided a Matthew’s Correlation Coefficient (MCC) and an Area Under the Curve (AUC) to evaluate the performance of the ensemble classifier, and the formulas were defined as follows (Liang et al., 2019; Lv et al., 2020c):
where
According to existing research, a series of feature extraction methods have been proved to be effective for the classification of antioxidant proteins, such as g-gap dipeptide feature, CTD, 188D, etc. However, the existing methods all use a certain method alone, and do not use them in combination. Therefore, in the planning stage of the experiment, we chose CKSAAP and 188D to find the most suitable combination of features for the target protein. Among them, CKSAAP is divided into pairs containing g-spacer residues (g = 0, 1, 2, 3, 4, 5). The experimental results of the random forest classifier and 5-fold cross-validation on the training set were shown in Table 5.
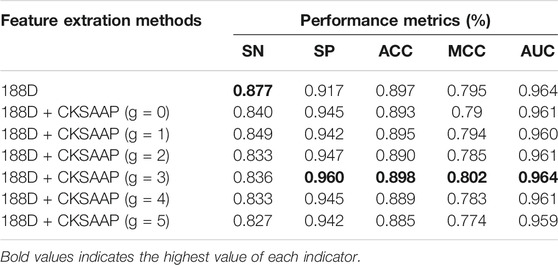
TABLE 5. Classification results of different under-sampling methods on the train dataset.
Only 188D is selected as the feature extraction method, and the SN value reaches 0.877, which was the highest value of all the combination methods, but other indicators are not ideal. When g = 3 for CKSAAP and 188D, all the values except SN are excellent. The SP, ACC, MCC, and AUC were 0.960, 0.898, 0.802, and 0.964, respectively.
In order to compare the most suitable under-sampling methods for the antioxidant protein data set, we chose four under-sampling methods, including CNN_TomekLinks, CPM, OSS, and RandomUnderSample, to process the training data separately. At the same time, we followed the single-variable principle. All the parameters in the feature extraction and feature selection of the five sets of data were exactly the same. Finally, 5-fold cross-validation was adopted to obtain the classification effect of the model in the random forest classifier. The classification effect of 5 sets of data is shown in Table 6.
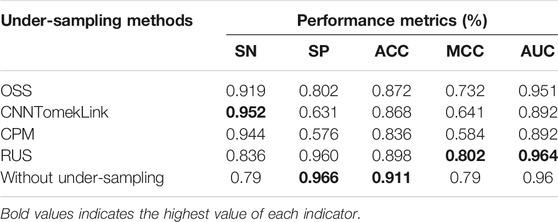
TABLE 6. Classification results of different under-sampling methods on the train dataset.
After the random under-sampling method was used, the MCC and AUC of the model reach 0.802 and 0.964, which were higher than those obtained by other under-sampling methods and direct classification. In addition, SP and ACC have the highest value among all under sampling methods.
In order to find the most suitable classifier, we selected 8 traditional machine learning classifiers for comparison: BayesNet, naive Bayes, logistic function, AdaBoostM1, bagging, random forest, decision table, and J48. In addition, the results obtained after random under sampling and MRMD processing of the training data set was measured by 5-fold cross-validation in different classifiers. Figure 3 shows the classification results of the training dataset on different classifiers.
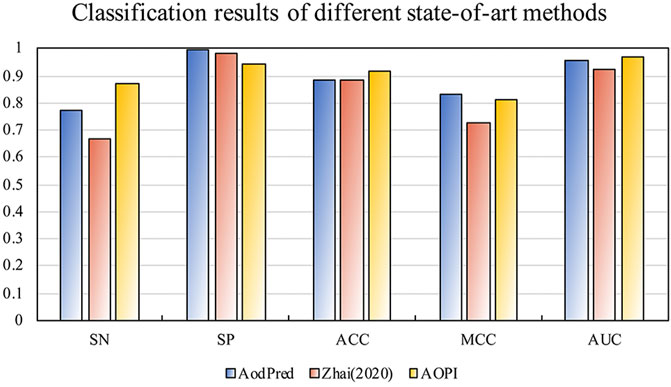
FIGURE 3. The classification results of different classifiers on the train dataset. The SP, ACC, MCC, and AUC of random forest were much higher than other traditional classifiers, which were 0.960, 0.898, 0.802, and 0.964, respectively. Compared with the Bagging classifier with the highest SN value, the SN value reaches 0.836, which was nearly lower than the highest value of 0.027.
Compared with most basic classifiers, random forest showed an exciting classification effect, all indicators were very competitive in all classifiers. It was obviously that the SP, ACC, MCC, and AUC of random forest were much higher than other traditional classifiers, which were 0.960, 0.898, 0.802, and 0.964, respectively. Compared with the Bagging classifier with the highest SN value, the SN value reaches 0.836, which was nearly lower than the highest value of 0.027.
In order to verify the robustness of AOPM, we chose to compare with two existing methods. They are the AodPred developed by the Feng team and the random forest model developed by ourselves in 2020. Because our data set is different from the existing method, we retrained the model according to the corresponding method and applied it on the same test dataset to get the following results. Figure 4 shows the classification results of the test dataset on the state-of-the-art methods.
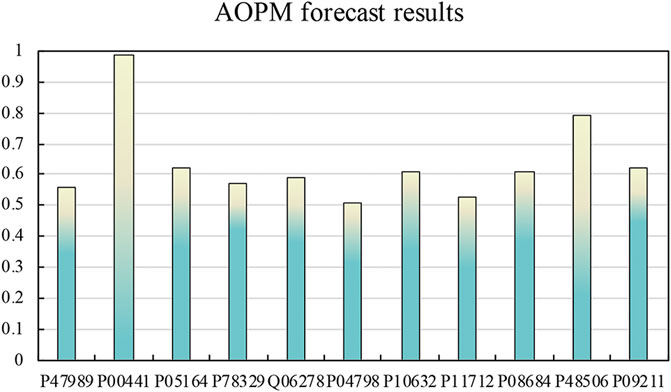
FIGURE 4. The classification results of the state-of-art methods on the test dataset. The SN, ACC, and AUC of AOPM were 0.873, 0.920, and 0.972, respectively. That was much higher than that of AodPred and Zhai, whose SN was higher than 0.99 and 0.204, respectively.
It was obviously that the SN, ACC, and AUC of AOPM were much higher than that of AodPred and Zhai, whose SN was higher than 0.99 and 0.204, respectively, indicating that AOPM was more sensitive to the classification of target proteins, which was also consistent with our goal. Although the SP value was slightly lower than the two first, MCC value was higher than Zhai and tinier lower than AodPred, this did not prevent AOPM from being a model with excellent classification effects.
In DrugBank, the 36 protein sequences we screened were subjected to the same feature extraction and screening operations, and then they were input into AOPM to get their prediction results. Among them, 11 proteins were predicted to be antioxidant proteins, and the predicted value of protein P00441 reached 0.99, and the predicted value of protein P48506 reached 0.79. The predicted results are shown in Figure 5.
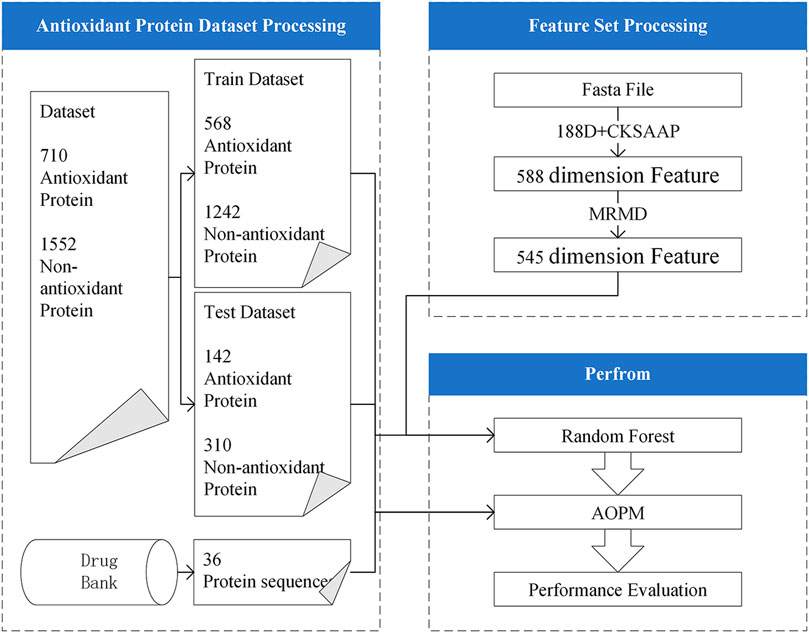
FIGURE 5. The predicted result of the enzyme of antioxidant drugs. The predicted value of protein P00441 reached 0.99, and the predicted value of protein P48506 reached 0.79. According to related literature, protein P00441 and protein P48506 are the catalytic subunits of superoxide dismutase [Cu-Zn] and glutamate-cysteine ligase, respectively. The prediction results of the remaining proteins are also around 0.6.
After consulting related literature, protein P00441 and protein P48506 were Superoxide dismutase [Cu-Zn] and Glutamate--cysteine ligase catalytic subunit, respectively. Although they play a catalytic role in antioxidants, they are also a strong antioxidant protein in themselves. We have consulted many literatures about Superoxide dismutase [Cu-Zn]. Superoxide dismutase [Cu-Zn] is the catalytic enzyme of many antioxidant drugs, and it has antioxidant properties. Although the current research does not clearly show that the remaining proteins can play an anti-oxidant effect, the sequence analysis can guide scientists to try their biological and chemical experiments.
In this paper, we proposed a tool named AOPM to identify antioxidant proteins. 188D and the Composition of k-spaced Amino Acid Pairs were adopted to extract the feature set, and we selected the optional feature set with MRMD. Using the 5-fold cross-validation and random forest on the test dataset, we obtained an average accuracy of 0.920. The sensitivity, specificity, the Matthew’s Correlation Coefficient and an Area Under the Curve were 0.873, 0.942, 0.815, and 0.972, respectively. Compared with previous methods, we re-collect the antioxidant protein data. After such processing, while the proportion of positive and negative examples of the data set is reduced, the characteristics of antioxidant proteins are also strengthened, and the robustness of the trained model were greatly improved compared with existing methods. In addition, AOPM also made predictions on the real data set of DrugBank, and indeed found proteins with antioxidant properties. This work proved the feasibility of virtual drug screening based on sequence information and provided new ideas and solutions for drug development.
The original contributions presented in the study are included in the article/Supplementary Material, further inquiries can be directed to the corresponding authors.
YuZ conceived and designed the project. YiZ, YG, and ZZ conducted experiments and analyzed the data. YiZ and JZ wrote the paper. TZ, DZ, and YuZ revised the manuscript. All authors read and approved the final manuscript.
This work was supported by the National Natural Science Foundation of China (61971119, 62102121) and the Heilongjiang Postdoctoral Fund (LBH-Q20138).
The authors declare that the research was conducted in the absence of any commercial or financial relationships that could be construed as a potential conflict of interest.
All claims expressed in this article are solely those of the authors and do not necessarily represent those of their affiliated organizations, or those of the publisher, the editors and the reviewers. Any product that may be evaluated in this article, or claim that may be made by its manufacturer, is not guaranteed or endorsed by the publisher.
Ao, C., Zou, Q., and Yu, L. (2021). RFhy-m2G: Identification of RNA N2-Methylguanosine Modification Sites Based on Random forest and Hybrid Features. Methods 21, 1046–2023. doi:10.1016/j.ymeth.2021.05.016
Basith, S., Manavalan, B., Shin, T. H., and Lee, G. (2018). iGHBP: Computational Identification of Growth Hormone Binding Proteins from Sequences Using Extremely Randomised Tree. Comput. Struct. Biotechnol. J. 16, 412–420. doi:10.1016/j.csbj.2018.10.007
Birben, E., Sahiner, U. M., Sackesen, C., Erzurum, S., and Kalayci, O. (2012). Oxidative Stress and Antioxidant Defense. World Allergy Organ. J. 5 (1), 9–19. doi:10.1097/WOX.0b013e3182439613
Chen, K., Kurgan, L., and Rahbari, M. (2007). Prediction of Protein Crystallization Using Collocation of Amino Acid Pairs. Biochem. Biophys. Res. Commun. 355 (3), 764–769. doi:10.1016/j.bbrc.2007.02.040
Chen, Y., Ma, T., Yang, X., Wang, J., Song, B., Zeng, Y., et al. (2021). MUFFIN: Multi-Scale Feature Fusion for Drug–Drug Interaction Prediction. Bioinformatics 37, btab169. doi:10.1093/bioinformatics/btab169
Cheng, L., Hu, Y., Sun, J., Zhou, M., and Jiang, Q. (2018). DincRNA: a Comprehensive Web-Based Bioinformatics Toolkit for Exploring Disease Associations and ncRNA Function. Bioinformatics 34 (11), 1953–1956. doi:10.1093/bioinformatics/bty002
Cheng, L., Qi, C., Zhuang, H., Fu, T., and Zhang, X. (2020). gutMDisorder: a Comprehensive Database for Dysbiosis of the Gut Microbiota in Disorders and Interventions. Nucleic Acids Res. 48 (D1), D554–D560. doi:10.1093/nar/gkz843
Cheng L, L., Qi, C., Yang, H., Lu, M., Cai, Y., Fu, T., et al. (2021). gutMGene: a Comprehensive Database for Target Genes of Gut Microbes and Microbial Metabolites. Nucleic Acids Res., gkab786. doi:10.1093/nar/gkab786
Cheng Y, Y., Gong, Y., Liu, Y., Song, B., and Zou, Q. (2021). Molecular Design in Drug Discovery: a Comprehensive Review of Deep Generative Models. Brief. Bioinform. 22, bbab344. doi:10.1093/bib/bbab344
Ding, Y., Tang, J., and Guo, F. (2019). Protein Crystallization Identification via Fuzzy Model on Linear Neighborhood Representation. IEEE/ACM Trans. Comput. Biol. Bioinformatics. 18 (5):1986–1995. doi:10.1109/TCBB.2019.2954826
Dong, J., Zhao, M., Liu, Y., Su, Y., and Zeng, X. (2021). Deep Learning in Retrosynthesis Planning: Datasets, Models and Tools. Brief. Bioinform., bbab391. doi:10.1093/bib/bbab391
Dzięgielewska-Gęsiak, S., Wysocka, E., Michalak, S., Nowakowska-Zajdel, E., Kokot, T., Muc-Wierzgoń, M., et al. (2014). Role of Lipid Peroxidation Products, Plasma Total Antioxidant Status, and Cu-, Zn-Superoxide Dismutase Activity as Biomarkers of Oxidative Stress in Elderly Prediabetics. Oxid. Med. Cell Longev. 2014, 987303. doi:10.1155/2014/987303
Eleutherio, E. C. A., Silva Magalhães, R. S., de Araújo Brasil, A., Monteiro Neto, J. R., and de Holanda Paranhos, L. (2021). SOD1, More Than Just an Antioxidant. Arch. Biochem. Biophys. 697, 108701. doi:10.1016/j.abb.2020.108701
Feng, P.-M., Lin, H., and Chen, W. (2013). Identification of Antioxidants from Sequence Information Using Naive Bayes. Comput. Math. Methods Med. 2013, 567529. doi:10.1155/2013/567529
Feng, P., Chen, W., and Lin, H. (2016). Identifying Antioxidant Proteins by Using Optimal Dipeptide Compositions. Interdiscip. Sci. Comput. Life Sci. 8 (2), 186–191. doi:10.1007/s12539-015-0124-9
Feng, P., Ding, H., Lin, H., and Chen, W. (2017). AOD: the Antioxidant Protein Database. Sci. Rep. 7 (1), 7449–7454. doi:10.1038/s41598-017-08115-6
Goto, Y., Wysocka, E., Michalak, S., Nowakowska-Zajdel, E., Kokot, T., Muc-Wierzgoń, M., et al. (2021). Tropomyosin-related Kinase B (TrkB) Full-Length Isoform Is Related to Advanced-Stage clear Cell Ovarian Cancer (CCOC). Eur. J. Gynaecol. Oncol. 42 (5), 899–908. doi:10.5582/bst.8.93
Jakhar, R., Dangi, M., Khichi, A., and Chhillar, A. K. (2020). Relevance of Molecular Docking Studies in Drug Designing. Curr. Bioinform. 15 (4), 270–278. doi:10.2174/1574893615666191219094216
Jin, Q., Meng, Z., Pham, T. D., Chen, Q., Wei, L., and Su, R. (2019). DUNet: A Deformable Network for Retinal Vessel Segmentation. Knowledge-Based Syst. 178, 149–162. doi:10.1016/j.knosys.2019.04.025
Liang, X., Rodríguez-Patón, A., and Zou, Q. (2019). Molecular Computing and Bioinformatics. Molecules 24 (13), 2358. doi:10.3390/molecules24132358
Liaw, A., and Wiener, M. (2002). Classification and Regression by randomForest. R. News 2 (3), 18–22. doi:10.1021/ci034160g
Liguori, I., Russo, G., Curcio, F., Bulli, G., Aran, L., Della-Morte, D., et al. (2018). Oxidative Stress, Aging, and Diseases. Clin. Interv. Aging 13, 757–772. doi:10.2147/CIA.S158513
Liu J, J., Lian, X., Liu, F., Yan, X., Cheng, C., Cheng, L., et al. (2020). Identification of Novel Key Targets and Candidate Drugs in Oral Squamous Cell Carcinoma. Curr. Bioinform. 15 (4), 328–337. doi:10.2174/1574893614666191127101836
Liu T, T., Chen, J. M., Zhang, D., Zhang, Q., Peng, B., Xu, L., et al. (2020). ApoPred: Identification of Apolipoproteins and Their Subfamilies with Multifarious Features. Front. Cel Dev. Biol. 8, 621144. doi:10.3389/fcell.2020.00234
Long, H., Sun, Z., Li, M., Fu, H. Y., and Lin, M. C. (2020). Predicting Protein Phosphorylation Sites Based on Deep Learning. Curr. Bioinform. 15 (4), 300–308. doi:10.2174/1574893614666190902154332
Long, J., Yang, H., Yang, Z., Jia, Q., Liu, L., Kong, L., et al. (2021). Integrated Biomarker Profiling of the Metabolome Associated with Impaired Fasting Glucose and Type 2 Diabetes Mellitus in Large-Scale Chinese Patients. Clin. Transl. Med. 11 (6), e432. doi:10.1002/ctm2.432
Lv, Z., Jin, S., Ding, H., and Zou, Q. (2019). A Random Forest Sub-golgi Protein Classifier Optimized via Dipeptide and Amino Acid Composition Features. Front. Bioeng. Biotechnol. 7, 215. doi:10.3389/fbioe.2019.00215
Lv, Z., Wang, P., Zou, Q., and Jiang, Q. (2020). Identification of Sub-golgi Protein Localization by Use of Deep Representation Learning Features. Bioinformatics 36 (24), 5600–5609. doi:10.1093/bioinformatics/btaa1074
Lv, Z., Zhang, J., Ding, H., and Zou, Q. (2020). RF-PseU: A Random Forest Predictor for RNA Pseudouridine Sites. Front. Bioeng. Biotechnol. 8, 134. doi:10.3389/fbioe.2020.00134
Lv, Z., Wang, D., Ding, H., Zhong, B., and Xu, L. (2020). Escherichia Coli DNA N-4-Methycytosine Site Prediction Accuracy Improved by Light Gradient Boosting Machine Feature Selection Technology. IEEE Access 8, 14851–14859. doi:10.1109/access.2020.2966576
Lv Z, Z., Cui, F., Zou, Q., Zhang, L., and Xu, L. (2021). Anticancer Peptides Prediction with Deep Representation Learning Features. Brief. Bioinform. 22, bbab008. doi:10.1093/bib/bbab008
Lv H, H., Dao, F. Y., Zulfiqar, H., and Lin, H. (2021). DeepIPs: Comprehensive Assessment and Computational Identification of Phosphorylation Sites of SARS-CoV-2 Infection Using a Deep Learning-Based Approach. Brief. Bioinform. 22 (6), 244. doi:10.1093/bib/bbab244
Lyu, Y., He, W., Li, S., Zou, Q., and Guo, F. (2020). iPro2L-PSTKNC: a Two-Layer Predictor for Discovering Various Types of Promoters by Position Specific of Nucleotide Composition. IEEE J. Biomed. Health Inform. 25 (6), 2329–2337. doi:10.1109/JBHI.2020.3026735
Manavalan, B., Basith, S., Shin, T. H., Wei, L., and Lee, G. (2019a). Meta-4mCpred: A Sequence-Based Meta-Predictor for Accurate DNA 4mC Site Prediction Using Effective Feature Representation. Mol. Ther. Nucleic Acids 16, 733–744. doi:10.1016/j.omtn.2019.04.019
Manavalan, B., Basith, S., Shin, T. H., Wei, T., and Lee, G. (2019b). mAHTPred: a Sequence-Based Meta-Predictor for Improving the Prediction of Anti-hypertensive Peptides Using Effective Feature Representation. Bioinformatics 35 (16), 2757–2765. doi:10.1093/bioinformatics/bty1047
Meng, C., Jin, S., Wang, L., Guo, F., and Zou, Q. (2019). AOPs-SVM: a Sequence-Based Classifier of Antioxidant Proteins Using a Support Vector Machine. Front. Bioeng. Biotechnol. 7, 224. doi:10.3389/fbioe.2019.00224
Mo, F., Luo, Y., Fan, D., Zeng, H., Zhao, Y., Luo, M., et al. (2020). Integrated Analysis of mRNA-Seq and miRNA-Seq to Identify C-MYC, YAP1 and miR-3960 as Major Players in the Anticancer Effects of Caffeic Acid Phenethyl Ester in Human Small Cell Lung Cancer Cell Line. Curr. Gene Ther. 20 (1), 15–24. doi:10.2174/1566523220666200523165159
Naseer, S., Hussain, W., Khan, Y. D., and Rasool, N. (2020). Sequence-based Identification of Arginine Amidation Sites in Proteins Using Deep Representations of Proteins and PseAAC. Curr. Bioinformatics 15 (8), 937–948. 10.2174/1574893615666200129110450.
Niu, K., Luo, X., Zhang, S., Teng, Z., Zhang, T., Zhao, Y., et al. (2021). iEnhancer-EBLSTM: Identifying Enhancers and Strengths by Ensembles of Bidirectional Long Short-Term Memory. Front. Genet. 12, 385. doi:10.3389/fgene.2021.665498
Raghunath, A., Sundarraj, K., Nagarajan, R., Arfuso, F., Bian, J., Kumar, A. P., et al. (2018). Antioxidant Response Elements: Discovery, Classes, Regulation and Potential Applications. Redox Biol. 17, 297–314. doi:10.1016/j.redox.2018.05.002
Riaz, F., and Li, D. (2019). Non-coding RNA Associated Competitive Endogenous RNA Regulatory Network: Novel Therapeutic Approach in Liver Fibrosis. Curr. Gene Ther. 19 (5), 305–317. doi:10.2174/1566523219666191107113046
Ściskalska, M., Ołdakowska, M., Marek, G., and Milnerowicz, H. (2020). Changes in the Activity and Concentration of Superoxide Dismutase Isoenzymes (Cu/Zn SOD, MnSOD) in the Blood of Healthy Subjects and Patients with Acute Pancreatitis. Antioxidants 9 (10), 948. doi:10.3390/antiox9100948
Shaker, B., Tran, K. M., Jung, C., and Na, D. (2021). Introduction of Advanced Methods for Structure-Based Drug Discovery. Curr. Bioinform. 16 (3), 351–363. doi:10.2174/1574893615999200703113200
Sheng, Y., Jiang, Y., Yang, Y., Li, X., Qiu, J., Wu, J., et al. (2021). CNA2Subpathway: Identification of Dysregulated Subpathway Driven by Copy Number Alterations in Cancer. Brief. Bioinform. 22 (5), bbaa413. doi:10.1093/bib/bbaa413
Su, R., Liu, X., Wei, L., and Zou, Q. (2019). Deep-Resp-Forest: A Deep forest Model to Predict Anti-cancer Drug Response. Methods 166, 91–102. doi:10.1016/j.ymeth.2019.02.009
Tiwari, M. K., Hägglund, P. M., Møller, I. M., Davies, M. J., and Bjerrum, M. J. (2019). Copper Ion / H2O2 Oxidation of Cu/Zn-Superoxide Dismutase: Implications for Enzymatic Activity and Antioxidant Action. Redox Biol. 26, 101262. doi:10.1016/j.redox.2019.101262
Triguero, I., González, S., Moyano, J. M., García, S., Alcalá-Fdez, J., Luengo, J., et al. (2017). KEEL 3.0: an Open Source Software for Multi-Stage Analysis in Data Mining. Int. J. Comput. Int. Sys. 10 (1), 1238–1249. doi:10.2991/ijcis.10.1.82
Usman, M., and Lee, J. A. (2019). “Afp-cksaap: Prediction of Antifreeze Proteins Using Composition of K-Spaced Amino Acid Pairs with Deep Neural Network,” in IEEE 19th International Conference on Bioinformatics and Bioengineering (BIBE), Athens, Greece, 26 December, 2019 (Athens, Greece: IEEE). doi:10.1109/bibe.2019.00016
Wang, G., Wang, Y., Feng, W., Wang, X., Yang, J. Y., Zhao, Y., et al. (2008). Transcription Factor and microRNA Regulation in Androgen-dependent and -independent Prostate Cancer Cells. BMC Genomics 9 (2), S22–S12. doi:10.1186/1471-2164-9-S2-S22
Wang, G., Wang, Y., Teng, M., Zhang, D., Li, L., and Liu, Y. (2010). Signal Transducers and Activators of Transcription-1 (STAT1) Regulates microRNA Transcription in Interferon Gamma-Stimulated HeLa Cells. PLoS One 5 (7), e11794. doi:10.1371/journal.pone.0011794
Wang, G., Luo, X., Wang, J., Wan, J., Xia, S., Zhu, H., et al. (2018). MeDReaders: a Database for Transcription Factors that Bind to Methylated DNA. Nucleic Acids Res. 46 (D1), D146–D151. doi:10.1093/nar/gkx1096
Wang, Y., Ding, Y., Tang, Y., Dai, Y., and Guo, F. (2019). CrystalM: a Multi-View Fusion Approach for Protein Crystallization Prediction. IEEE/ACM Trans. Comput. Biol. Bioinformatics 18, 325. doi:10.1109/tcbb.2019.2912173
Wang, X.-F., Gao, P., Liu, Y.-F., Li, H.-F., and Lu, F. (2020). Predicting Thermophilic Proteins by Machine Learning. Curr. Bioinform. 15 (5), 493–502. doi:10.2174/1574893615666200207094357
Wei, L., Liao, M., Gao, Y., Ji, R., He, Z., and Zou, Q. (2014). Improved and Promising Identification of Human MicroRNAs by Incorporating a High-Quality Negative Set. IEEE/ACM Trans. Comput. Biol. Bioinform. 11 (1), 192–201. doi:10.1109/TCBB.2013.146
Wei, L., Xing, P., Zeng, J., Chen, J., Su, R., and Guo, F. (2017). Improved Prediction of Protein-Protein Interactions Using Novel Negative Samples, Features, and an Ensemble Classifier. Artif. Intell. Med. 83, 67–74. doi:10.1016/j.artmed.2017.03.001
Wei, L., Zhou, C., Chen, H., Song, J., and Su, R. (2018). ACPred-FL: a Sequence-Based Predictor Using Effective Feature Representation to Improve the Prediction of Anti-cancer Peptides. Bioinformatics 34 (23), 4007–4016. doi:10.1093/bioinformatics/bty451
Wishart, D. S., Feunang, Y. D., Guo, A. C., Lo, E. J., Marcu, A., Grant, J. R., et al. (2018). DrugBank 5.0: a Major Update to the DrugBank Database for 2018. Nucleic Acids Res. 46 (D1), D1074–D1082. doi:10.1093/nar/gkx1037
Wu, X., and Yu, L. (2021). EPSOL: Sequence-Based Protein Solubility Prediction Using Multidimensional Embedding. Bioinformatics 37, 4314. doi:10.1093/bioinformatics/btab463
Wu, D., Lv, Z., Xu, X., Yin, Z., and Lou, H. (2021). Clinicopathological Features and Prognostic Factors for Survival and Lymph Node Metastases in Stage IB Adenocarcinoma of the Cervix. Eur. J. Gynaecol. Oncol. 42 (3), 450–456. doi:10.31083/j.ejgo.2021.03.2300
Xu, L., Liang, G., Shi, S., and Liao, C. (2018). SeqSVM: a Sequence-Based Support Vector Machine Method for Identifying Antioxidant Proteins. Int. J. Mol. Sci. 19 (6), 1773. doi:10.3390/ijms19061773
Yan, N., Lv, Z., Hong, W., and Xu, X. (2021). Editorial: Feature Representation and Learning Methods with Applications in Protein Secondary Structure. Front. Bioeng. Biotechnol. 9 (822), 748722. doi:10.3389/fbioe.2021.748722
Yang, Y., Fan, C., and Zhao, Q. (2020). Recent Advances on the Machine Learning Methods in Identifying Phage Virion Proteins. Curr. Bioinform. 15 (7), 657–661. doi:10.2174/1574893614666191203155511
Yang, H., Luo, Y., Ren, X., Wu, M., He, X., Peng, B., et al. (2021). Risk Prediction of Diabetes: Big Data Mining with Fusion of Multifarious Physical Examination Indicators. Inf. Fusion 75, 140–149. doi:10.1016/j.inffus.2021.02.015
Yu XP, X.-P., Zhang, Z., Pu, L, Tang, T, and Guo, F., (2021). Breast Cancer Overall-Survival Can Be Predicted with a 19 lncRNA Tissue Signature. Eur. J. Gynaecol. Oncol. 42 (5), 838–843. doi:10.31083/j.ejgo4205128
Yu L, L., Xia, M., and An, Q. (2021). A Network Embedding Framework Based on Integrating Multiplex Network for Drug Combination Prediction. Brief. Bioinform., bbab364. doi:10.1093/bib/bbab364
Zeng, X., Song, X., Ma, T., Pan, X., Zhou, Y., Hou, Y., et al. (2020). Repurpose Open Data to Discover Therapeutics for COVID-19 Using Deep Learning. J. Proteome Res. 19 (11), 4624–4636. doi:10.1021/acs.jproteome.0c00316
Zeng, X., Zhu, S., Hou, Y., Zhang, P., Li, L., Li, J., et al. (2020). Network-based Prediction of Drug-Target Interactions Using an Arbitrary-Order Proximity Embedded Deep forest. Bioinformatics 36 (9), 2805–2812. doi:10.1093/bioinformatics/btaa010
Zeng, X., Tu, X., Liu, Y., Fu, X., and Su, Y. (2022). Toward Better Drug Discovery with Knowledge Graph. Curr. Opin. Struct. Biol. 72, 114–126. doi:10.1016/j.sbi.2021.09.003
Zhai, Y., Chen, Y., Teng, Z., and Zhao, Y. (2020). Identifying Antioxidant Proteins by Using Amino Acid Composition and Protein-Protein Interactions. Front Cel Dev. Biol. 8, 591487. doi:10.3389/fcell.2020.591487
Zhang CH, C. H., Li, M., Lin, Y. P., and Gao, Q. (2020). Systemic Therapy for Hepatocellular Carcinoma: Advances and Hopes. Curr. Gene Ther. 20 (2), 84–99. doi:10.2174/1566523220666200628014530
Zhang J, J., Zhang, Z., Pu, L., Tang, T., and Guo, F. (2020). AIEpred: an Ensemble Predictive Model of Classifier Chain to Identify Anti-inflammatory Peptides. IEEE/ACM Trans. Comput. Biol. Bioinformatics. 18 (5):1831–1840. doi:10.1109/TCBB.2020.2968419
Zhang, D., Chen, H. D., Zulfiqar, H., Yuan, S. S., Huang, Q. L., Zhang, Z. Y., et al. (2021). iBLP: An XGBoost-Based Predictor for Identifying Bioluminescent Proteins. Comput. Math. Methods Med. 2021, 6664362. doi:10.1155/2021/6664362
Zhao S, S., Ju, Y., Ye, X., Zhang, J., and Han, S. (2021). Bioluminescent Proteins Prediction with Voting Strategy. Curr. Bioinform. 16 (2), 240–251. doi:10.2174/1574893615999200601122328
Zhao X, X., Lv, Z., Xu, X., Yin, Z., and Lou, H., (2021). Identifying Plant Pentatricopeptide Repeat Proteins Using a Variable Selection Method. Front. Plant Sci. 12, 298. doi:10.3389/fpls.2021.506681
Zhu, L., Duan, G., Yan, C., and Wang, J. (2021). Prediction of Microbe-Drug Associations Based on Chemical Structures and the KATZ Measure. Curr. Bioinform. 16 (6), 807–819. doi:10.2174/1574893616666210204144721
Zia, A., Farkhondeh, T., Pourbagher-Shahri, A. M., and Samarghandian, S. (2021). The Role of Curcumin in Aging and Senescence: Molecular Mechanisms. Biomed. Pharmacother. 134, 111119. doi:10.1016/j.biopha.2020.111119
Zou, Q., Zeng, J., Cao, L., and Ji, R. (2016). A Novel Features Ranking Metric with Application to Scalable Visual and Bioinformatics Data Classification. Neurocomputing 173, 346–354. doi:10.1016/j.neucom.2014.12.123
Zulfiqar, H., Yuan, S.-S., Huang, Q.-L., Sun, Z.-J., Dao, F.-Y., Yu, X.-L., et al. (2021). Identification of Cyclin Protein Using Gradient Boost Decision Tree Algorithm. Comput. Struct. Biotechnol. J. 19, 4123–4131. doi:10.1016/j.csbj.2021.07.013
Keywords: antioxidant proteins, random forest, MRMD, antioxidant drugs, drug screening and discovery
Citation: Zhai Y, Zhang J, Zhang T, Gong Y, Zhang Z, Zhang D and Zhao Y (2022) AOPM: Application of Antioxidant Protein Classification Model in Predicting the Composition of Antioxidant Drugs. Front. Pharmacol. 12:818115. doi: 10.3389/fphar.2021.818115
Received: 19 November 2021; Accepted: 20 December 2021;
Published: 18 January 2022.
Edited by:
FangXiang Wu, University of Saskatchewan, CanadaReviewed by:
Jinyan Li, University of Technology Sydney, AustraliaCopyright © 2022 Zhai, Zhang, Zhang, Gong, Zhang, Zhang and Zhao. This is an open-access article distributed under the terms of the Creative Commons Attribution License (CC BY). The use, distribution or reproduction in other forums is permitted, provided the original author(s) and the copyright owner(s) are credited and that the original publication in this journal is cited, in accordance with accepted academic practice. No use, distribution or reproduction is permitted which does not comply with these terms.
*Correspondence: Dandan Zhang, MTU4NDYwMDI5ODBAMTYzLmNvbQ==; Yuming Zhao, enltQG5lZnUuZWR1LmNu
†These authors have contributed equally to this work
Disclaimer: All claims expressed in this article are solely those of the authors and do not necessarily represent those of their affiliated organizations, or those of the publisher, the editors and the reviewers. Any product that may be evaluated in this article or claim that may be made by its manufacturer is not guaranteed or endorsed by the publisher.
Research integrity at Frontiers
Learn more about the work of our research integrity team to safeguard the quality of each article we publish.