 Peter Natesan Pushparaj
 Angham Abdulrahman Abdulkareem1,3
 Muhammad Imran Naseer
95% of researchers rate our articles as excellent or good
Learn more about the work of our research integrity team to safeguard the quality of each article we publish.
Find out more
ORIGINAL RESEARCH article
Front. Pharmacol. , 31 August 2021
Sec. Neuropharmacology
Volume 12 - 2021 | https://doi.org/10.3389/fphar.2021.688227
This article is part of the Research Topic Current Trends in Medicinal Plant Research and Neurodegenerative Disorders View all 16 articles
SARS-CoV-2 is the causative agent for coronavirus disease-19 (COVID-19) and belongs to the family Coronaviridae that causes sickness varying from the common cold to more severe illnesses such as severe acute respiratory syndrome, sudden stroke, neurological complications (Neuro-COVID), multiple organ failure, and mortality in some patients. The gene expression profiles of COVID-19 infection models can be used to decipher potential therapeutics for COVID-19 and related pathologies, such as Neuro-COVID. Here, we used the raw RNA-seq reads (Single-End) in quadruplicates derived using Illumina Next Seq 500 from SARS-CoV-infected primary human bronchial epithelium (NHBE) and mock-treated NHBE cells obtained from the Gene Expression Omnibus (GEO) (GSE147507), and the quality control (QC) was evaluated using the CLC Genomics Workbench 20.0 (Qiagen, United States) before the RNA-seq analysis using BioJupies web tool and iPathwayGuide for gene ontologies (GO), pathways, upstream regulator genes, small molecules, and natural products. Additionally, single-cell transcriptomics data (GSE163005) of meta clusters of immune cells from the cerebrospinal fluid (CSF), such as T-cells/natural killer cells (NK) (TcMeta), dendritic cells (DCMeta), and monocytes/granulocyte (monoMeta) cell types for comparison, namely, Neuro-COVID versus idiopathic intracranial hypertension (IIH), were analyzed using iPathwayGuide. L1000 fireworks display (L1000FWD) and L1000 characteristic direction signature search engine (L1000 CDS2) web tools were used to uncover the small molecules that could potentially reverse the COVID-19 and Neuro-COVID-associated gene signatures. We uncovered small molecules such as camptothecin, importazole, and withaferin A, which can potentially reverse COVID-19 associated gene signatures. In addition, withaferin A, trichostatin A, narciclasine, camptothecin, and JQ1 have the potential to reverse Neuro-COVID gene signatures. Furthermore, the gene set enrichment analysis (GSEA) preranked method and Metascape web tool were used to decipher and annotate the gene signatures that were potentially reversed by these small molecules. In conclusion, our study unravels a rapid approach for applying next-generation knowledge discovery (NGKD) platforms to discover small molecules with therapeutic potential against COVID-19 and its related disease pathologies.
Coronaviruses (CoVs) belong to the order Nidovirales, family Coronaviridae, and subfamily Coronavirinae, which can further be divided into four genera: alpha, beta, gamma, and delta CoVs. SARS CoV2 is the causative agent of coronavirus disease-19 (COVID-19), belongs to the genus beta-CoV, and can cause sickness varying from the common cold to more severe illnesses such as severe acute respiratory syndrome, gastrointestinal complications, sudden stroke, multiple organ failure, and mortality in some cases (Cui et al., 2019). SARS-CoV-2 infected more than 186 million people, resulting in the death of about 4 million people globally (Johns Hopkins COVID-19 Data Center on 10th July 2021) (Dong et al., 2020). SARS-CoV-2 has a positive-sense RNA genome encapsulated by a nucleocapsid. SARS-CoV-2 infects host cells through surface receptors, angiotensin-converting enzyme 2 (hACE2), and transmembrane protease serine-type 2 (TMPRSS2) (Hoffmann et al., 2020). An increase in the expression of ACE2, a tissue-protective mediator during lung damage, was found to be associated with interferon signaling in airway epithelial cells, and SARS-CoV-2 could exploit interferon-mediated stimulation of ACE2 to augment infection (Ziegler et al., 2020). The differential expression of genes that are necessary for SARS-CoV-2 interaction and subsequent host response determine susceptibility to COVID-19, disease progression, and recovery (Kasela et al., 2021).
RNA sequencing is a recently developed NGS methodology for whole transcriptome or single-cell transcriptomic approaches (Liu and Di, 2020). Single-cell RNA sequencing of COVID-19 infected bronchial epithelial cells and bronchioalveolar immune cells revealed important cellular and molecular processes implicated in COVID-19 infection at the single-cell level and provided information about the mechanisms of disease severity (Liu T. et al., 2020; Liao et al., 2020; Zhou et al., 2020). Notably, IL-17-associated signaling was significantly increased but not Th2-related inflammation following COVID-19 infection (Kasela et al., 2021). A recent study showed that SARS-CoV-2 infection caused a twofold higher induction of interferon stimulation compared to SARS-CoV in Calu-3 human epithelial cells and subsequent induction of cytokines such as IL6 or IL-10 (Wyler et al., 2021). The interferon-induced genes IFIT2 and OAS2 were widely stimulated compared to interferon lambda (IFNL) and interferon-beta (IFNB). Besides, scRNA-seq data suggested that interferon regulatory factor (IRF) activity occurs before the induction of nuclear factor-κB (NF-κB) in SARS-CoV-2-infected cells (Wyler et al., 2021).
COVID-19 patients, especially those with greater disease severity, can develop neurological complications such as neuroinflammation, headache, and cerebrovascular disease called Neuro-COVID (Heming et al., 2021). Developing novel drug candidates and identifying suitable existing therapeutics for drug repurposing for COVID-19 and Neuro-COVID are critical for controlling this ongoing pandemic and reducing the enormous economic burden on health care systems and socioeconomic devastation of individuals, families, small to large businesses, and countries. Understanding COVID-19-associated gene signatures is essential for developing robust therapeutics for treating infected patients effectively and reducing infection rates and mortality. To address this important issue, the gene expression profiles of COVID-19 infection models can be used to identify potential therapeutic targets that could be targeted by known drugs. Here, we used RNA-seq datasets from the COVID-19 infection model of human bronchial epithelial cells (NHBE) and the scRNA-seq datasets of immune cells isolated from the cerebrospinal fluid (CSF) of Neuro-COVID patients, obtained from public repositories and analyzed using next-generation knowledge discovery (NGKD) platforms to understand disease-specific gene signatures and uncover drugs from synthetic and natural sources that can reverse these gene signatures for potential therapeutics.
This study was exempted from Institutional Review Board (IRB) approval since it did not involve any animal models or human subjects and was conducted using RNA-seq datasets retrieved from the Gene Expression Omnibus (GEO) (Barrett et al., 2013).
In the present study, the raw RNA-seq reads (Single-End) (FASTQ format) in quadruplicates derived using Illumina Next Seq 500 from SARS-CoV-infected and mock-treated NHBE cells were obtained from the GEO (Accession No: GSE147507) (Blanco-Melo, et al., 2020). Additionally, the single-cell transcriptomics data (Accession No: GSE163005) of immune cells isolated from the CSF of Neuro-COVID patients (Heming et al., 2021) were used for additional analysis using high-throughput knowledge discovery platforms. Heming et al. (2021) provided the entire dataset for the open-source interactive platform cerebroApp at http://covid.mheming.de/ (Hillje et al., 2020).
Raw RNA-seq reads (Single-End) (FASTQ format) in quadruplicates were evaluated for quality using the CLC Genomics Workbench 20.0 (Qiagen, United States) as described previously (Ewing and Green, 1998; Liu and Di, 2020).
BioJupies is a freely available web-based application (http://biojupies.cloud) that has 14 RNA-seq analysis library plug-ins and provides the user with the automatic generation, storage, and deployment of Jupyter Notebooks containing RNA-seq data analyses (Torre et al., 2018). In BioJupies, the RNA-seq datasets were user-submitted, compressed in an HDF5 data package, and uploaded to Google Cloud. Raw counts were normalized to log10-Counts per million (log CPM) and the differentially expressed genes (DEGs) were derived between the control group and the experimental group using the limma R package (Ritchie et al., 2015). The Jupyter Notebooks created for each RNA-seq raw data analysis were permanently available through a URL and stored in the cloud. The notebooks consist of executable code of the whole pipeline, description of the methods, enrichment analysis, interactive data visualizations, differential expression, and so on (Torre et al., 2018).
Principal component analysis (PCA) was performed using the PCA function from the sklearn Python module by transforming the log CPM using the Z-score method. An interactive heatmap was generated using a clustergram (Fernandez et al., 2017). In the volcano plots, the log2 fold changes of the DEGs are shown on the x-axis and p-values were corrected using the Benjamini-Hochberg method, transformed (–log10), and presented on the y-axis (Benjamini and Hochberg, 1995; Benjamini and Yekutieli, 2001). In contrast, for the MA plot, average gene expression is shown on the x-axis; p-values were corrected using the Benjamini-Hochberg method (Benjamini and Hochberg, 1995; Benjamini and Yekutieli, 2001), transformed (–log10), and presented on the y-axis.
The impact analysis method (IAM) (Draghici et al., 2007; Khatri et al., 2007; Tarca et al., 2009) was used to determine the significantly impacted gene signatures and pathways from the DEGs (log2FC cut-off 0.6, adjusted false discovery rate (FDR) p-value ≤ 0.05) obtained from the COVID-19 using BioJupies and the DEGs with log2FC (cut-off 0.3) and adjusted p-value ≤ 0.001 based on Bonferroni method in meta clusters of T-cells/natural killer cells (NK) (TcMeta), dendritic cells (DCMeta), and monocytes/granulocyte (monoMeta) cell types of the comparison, namely, Neuro-COVID versus idiopathic intracranial hypertension (IIH) for the Neuro-COVID infection models in the iPathwayGuide (Advaita Bioinformatics, United States). Here, the p-value calculated based on Fisher’s method was used to compute the pathway score method (Fisher, 1925). The p-value was further corrected based on multiple testing corrections for FDR and Bonferroni corrections (Bonferroni, 1935; Bonferroni, 1936). The gene interactions and pathways based on the DEGs were generated using the Kyoto Encyclopedia of Genes and Genomes (KEGG) database (Kanehisa and Goto, 2000; Kanehisa et al., 2002; Kanehisa et al., 2010; Kanehisa et al., 2012; Kanehisa et al., 2014). For each gene ontology (GO) term (Ashburner et al., 2000; Gene Ontology Consortium, 2001; Ashburner and Lewis, 2002; Gene Ontology Consortium, 2004), the number of DEGs annotated to the term was compared to that expected by chance. iPathwayGuide uses an overrepresentation approach to compute the statistical significance of observing at least a given number of DEGs (Draghici et al., 2003a; Draghici et al., 2003b; Draghici 2011). The hypergeometric distribution was used to compute the p-values in the iPathwayGuide analysis and corrected using FDR and Bonferroni for multiple comparisons (Draghici et al., 2003a; Draghici et al., 2003b; Draghici 2011). The prediction of upstream chemicals, drugs, and toxins (CDTs), either as present (or overly abundant) or absent (or insufficient), is based on two types of information: 1) the enrichment of DEGs from the experiment and 2) a network of interactions from the Advaita Knowledge Base (AKB v2012) (Draghici et al., 2003a; Draghici 2011). The analysis uses Fisher’s standard method to combine p-values into one test statistic (Fisher, 1925).
The L1000 characteristic direction signature search engine (L1000CDS2) analysis was performed by submitting the top 2000 DEGs to the L1000CDS2 signature search application programming interface (API) (Duan et al., 2016). Similarly, the L1000FWD analysis was performed by submitting the top 2000 DEGs to the L1000 Fire Works Display (L1000FWD) signature search API (Wang et al., 2018). Similarly, the DEGs obtained from TcMeta, DCMeta, and monoMeta cell types were compared; namely, Neuro-COVID versus IIH were subjected to both L1000CDS2 and L1000FWD analyses to identify drugs that reverse the gene signatures differentially regulated by COVID-19. An FDR (q-value) of 0.05 was considered statistically significant.
GSEA against a ranked list of genes was performed using the GSEA preranked method (Subramanian et al., 2005). The RNK-formatted files were created to the comparison of SARS-CoV-2-NHBE vs. Mock-NHBE, Neuro-COVID vs. IIH-TcMeta, Neuro-COVID vs. IIH-DCMeta, and Neuro-COVID vs. IIH-monoMeta, based on the ranking metric log2FC of the DEGs. Gene matrix files (GMTs) were created using the gene signatures (combined, up, and down) of withaferin A, importazole, camptothecin, trichostatin A, narciclasine, and JQ1 from the L1000FWD web tool (Wang et al., 2018). GSEA preranked was run by weighting each gene’s contribution to the enrichment score by the value of its ranking metric against GMT files using Java-based desktop application GSEA 4.1.0 (Broad Institute, United States) under default settings as described previously (Subramanian et al., 2005).
The Metascape web tool (http://metascape.org) offers an easy and effective way to explore and understand gene lists derived from experimental data. The gene signatures reversed by small molecules identified in our study in COVID-19 and Neuro-COVID models were first automatically converted into Human Entrez Gene ID in Metascape. Then, all statistically enriched terms, accumulative hypergeometric p-values, and enrichment factors were calculated and used for filtering to obtain enrichment ontology clusters based on GO/KEGG terms, canonical pathways, and hallmark gene sets (Zhou et al., 2019).
Raw RNA-seq reads (Single-End) (FASTQ format) derived using Illumina Next Seq 500 from SARS-CoV-infected NHBE and mock-treated NHBE cells were obtained from the GEO and the QC was evaluated using the CLC Genomics Workbench 20.0, before the RNA-seq analysis using BioJupies web tool. iPathwayGuide analysis was performed to decipher the disease-specific signatures, pathways, and small molecules, either synthetic or derived from natural sources, to reverse disease-specific gene signatures. In addition, single-cell transcriptomic data of immune cells isolated from the CSF of Neuro-COVID-19 patients were further analyzed using iPathwayGuide, L1000CDS2, and L1000FWD analyses.
Hierarchically clustered heatmaps were generated using the Clustergrammer web tool to visualize and analyze high-dimensional RNA-seq data of SARS-CoV-infected NHBE cells and mock-treated NHBE cells (Supplementary Figure S1A). PCA was used to uncover global patterns in RNA-seq datasets analyzed and helped to understand the difference between COVID-19-infected and mock-treated NHBE cells (Supplementary Figure S1B). The volcano plot was generated using transformed gene fold changes using log2 and is shown on the x-axis (Supplementary Figure S1C). The MA plot was based on the average gene expression, which was calculated using the mean of the normalized gene expression values and shown on the x-axis (Supplementary Figure S1D).
In this experiment, 1,072 DEGs were identified from a total of 10,663 DEGs obtained from BioJupies analysis of the RNA-seq reads of the SARS-CoV-infected NHBE cells and mock-treated NHBE cells based on a p-value cut-off of 0.05 and a log2 fold change cut-off of 0.6. In contrast, DEGs with a logFC cut-off of 0.3 and adjusted p-value based on the Bonferroni method from clusters in TcMeta, DCMeta, and monoMeta of the comparison, namely, Neuro-COVID versus IIH, were also subjected to iPathwayGuide analysis separately, followed by comparative analyses. Subsequently, the DEGs were analyzed in the context of pathways obtained from the KEGG database (Kanehisa and Goto, 2000; Kanehisa et al., 2002), GO from the Gene Ontology Consortium database, a network of regulatory relationships from BioGRID: Biological General Repository for Interaction Datasets v4.0.189 (Szklarczyk et al., 2017), chemicals/drugs/toxicants from the Comparative Toxicogenomics Database (Davis et al., 2021), and diseases from the KEGG database. In summary, 22 pathways were found to be significantly impacted in SARS-CoV-2-infected NHBE cells compared to mock-treated NHBE cells. In addition, 503 GO terms, 18 miRNAs, 190 gene upstream regulators, 213 chemical upstream regulators, and 14 diseases were found to be significantly enriched before correction for multiple comparisons.
COVID-19 infection of NHBE cells triggers key immune-related pathways, such as cytokine-cytokine receptor interactions and viral protein interactions with cytokine receptors (Table 1). The top five upstream regulators, IL-17, TNF-alpha, STAT2, IRF9, and TLR4, were predicted to be activated (Table 2). The top identified biological processes, molecular functions, and cellular components for each pruning type are provided in Tables 3–5.

TABLE 1. Top identified pathways and their associated p-values are given in the table.
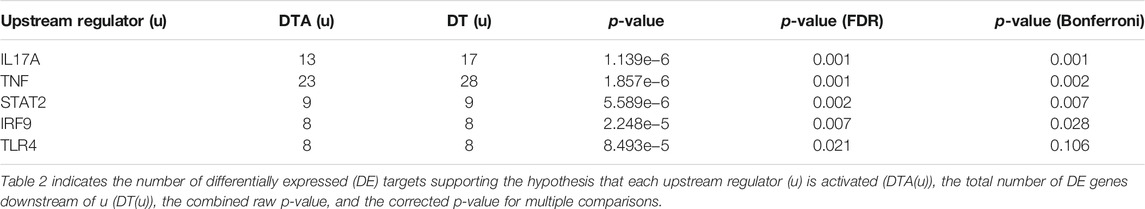
TABLE 2. Top identified upstream regulators activated based on Bonferroni correction were listed in the table.
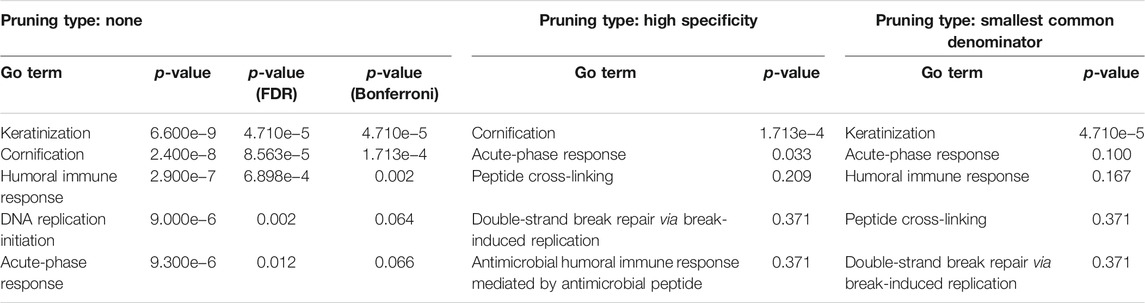
TABLE 3. Top identified biological processes for each pruning type.
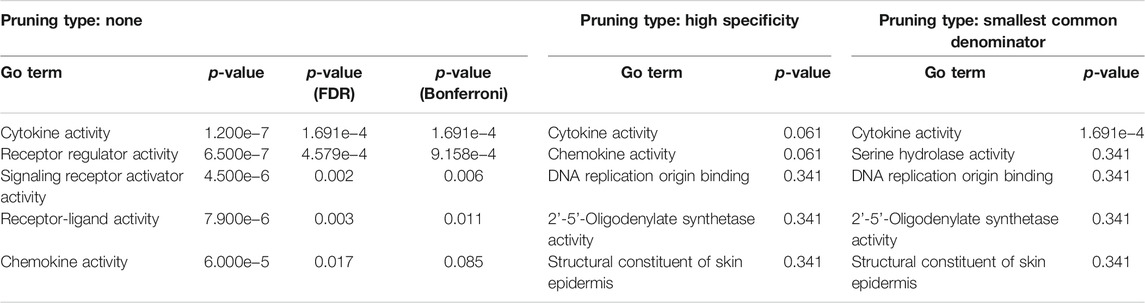
TABLE 4. Top identified molecular functions for each pruning type.
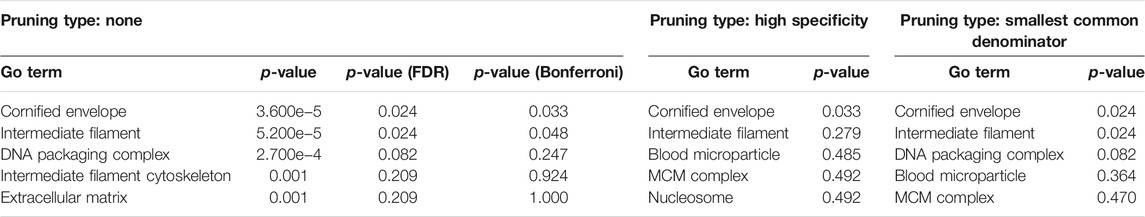
TABLE 5. Top identified cellular components for each pruning type.
The bar chart (Figure 1A) shows the top small molecules identified by the L1000CDS2 query using the DEGs identified from SARS-CoV-2-NHBE. The left panel shows small molecules such as geldanamycin, radicicol, AZD8330, trametinib, NVP-AYU922, GSK2126458, and JW-7-24-1, which mimic the observed gene expression signature; the right panel displays small molecules such as camptothecin (Figure 1B), importazole (Figure 1C), and withaferin A (Figure 1D). The upstream regulator drugs and natural products that reverse the molecular signatures based on iPathwayGuide analysis are shown as a dendrogram (Figure 1E). The top five upstream drugs, natural products, and chemicals predicted as absent (or insufficient) based on iPathwayGuide analysis were coumestrol, methylprednisolone, JinFuKang (JFK), selenium, and gold sodium thiomalate (Figure 1F). However, withaferin A was found to reverse the COVID-19-induced molecular signatures in both L1000CDS2 and L1000FWD analyses, along with other small-molecule drugs (Table 6) in the SARS-CoV-2-infected NHBE cells.
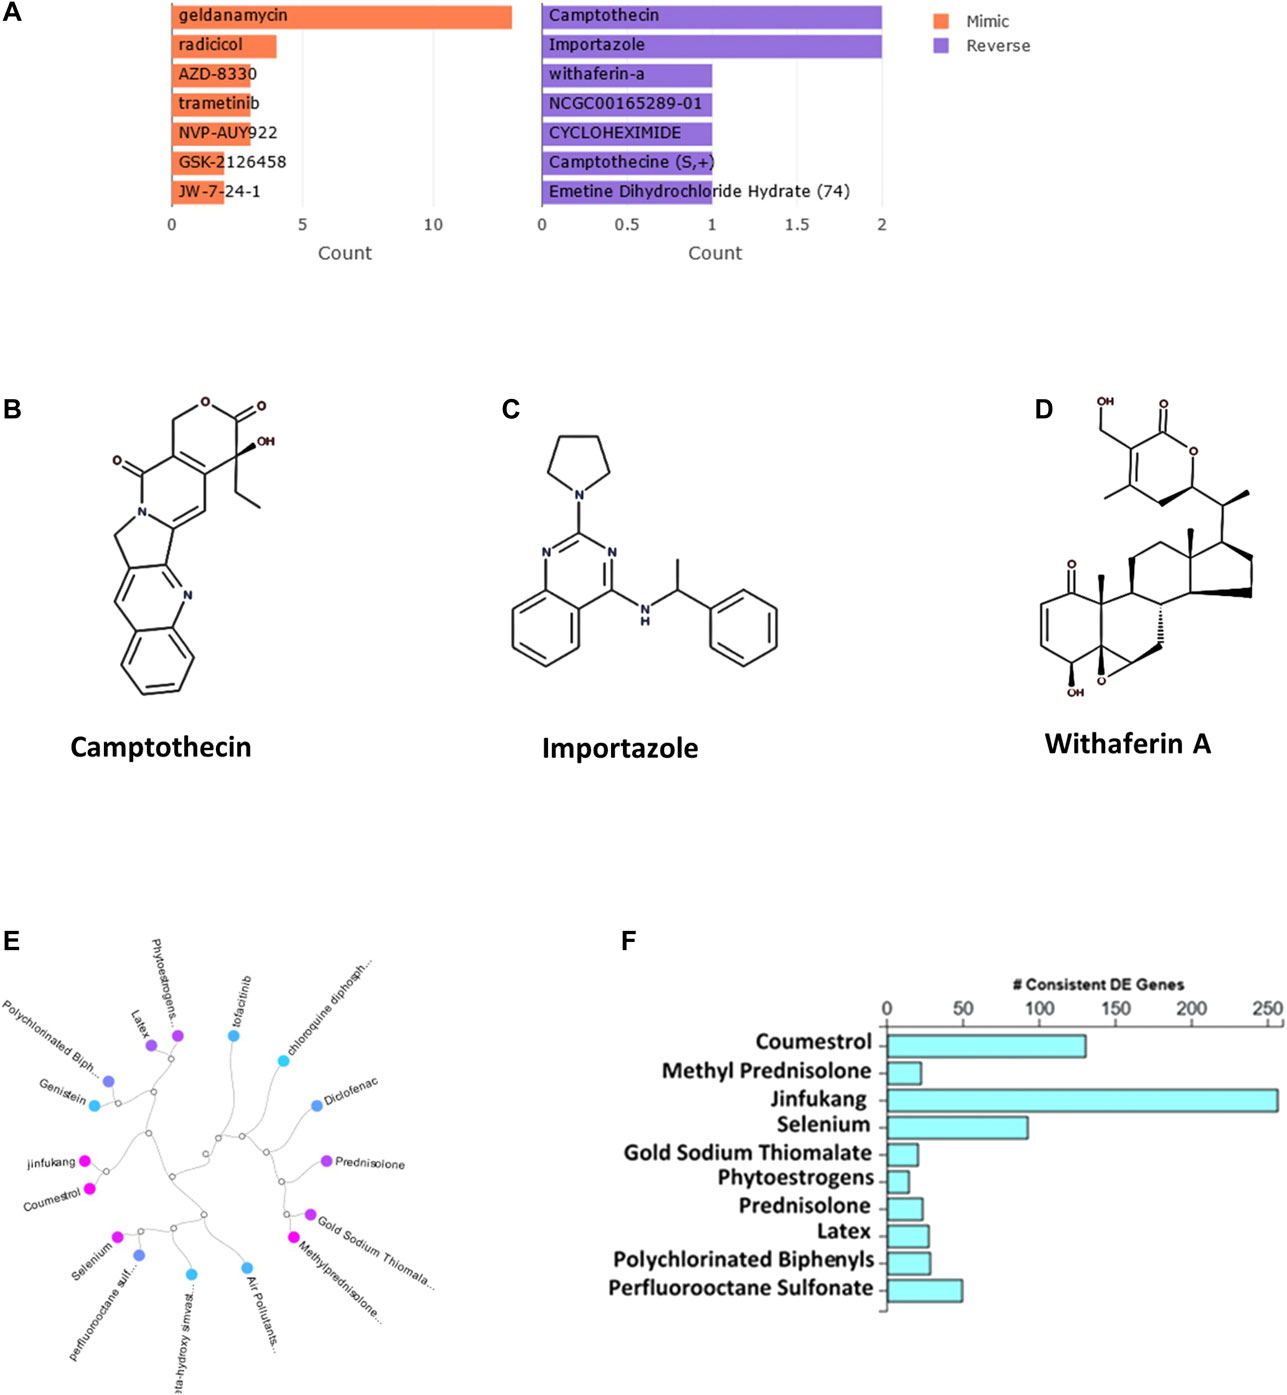
FIGURE 1. (A) The bar chart displaying the top five small molecules identified by the L1000CDS2 query. The left panel displays the small molecules which mimic the observed gene expression signature, while the right panel displays the small molecules which reverse it. (B–D) The two-dimensional structures of camptothecin, importazole, and withaferin A. (E) Dendrogram show the drugs and natural products that reverse the COVID-19 associated molecular signatures and (F) bar graph shows the drugs and natural products that potentially reverse COVID-19 associated molecular signatures based on iPathwayGuide analysis.
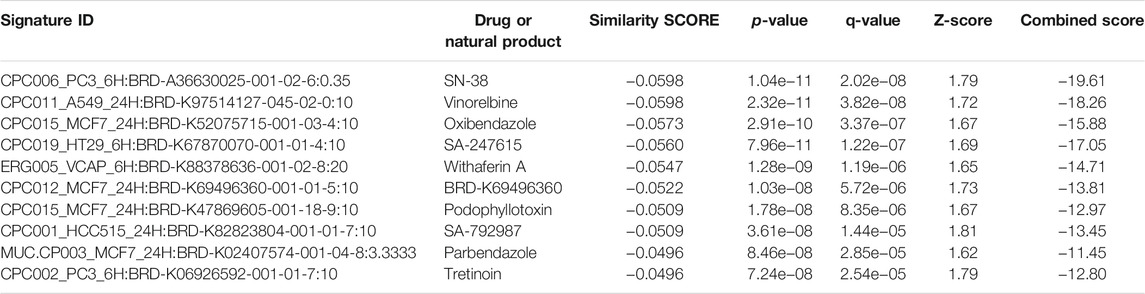
TABLE 6. Natural products and drugs with opposite molecular signatures based on L1000FWD web-based tool for querying gene expression signatures (SARS-CoV-2-NHBE vs. Mock-NHBE) against signatures created from human cell lines treated with over 20,000 small molecules and drugs for the LINCS project.
We identified 14 genes that were commonly expressed between Neuro-COVID and IIH (TcMeta, DCMeta, and monoMeta), as depicted in the Venn diagram (Figure 2A). The upregulated genes (Figure 2B), downregulated genes (Figure 2C), and the common genes between the meta clusters of immune cells in Neuro-COVID were presented as rank diagrams based on log2FC values. The genes GABARAP, GNAI2, COTL1, ATP5F1D, CD81, GNAS, TAF10, and CHCHD10 were significantly upregulated, and genes such as XIST, SLC25A6, MTRNR2L1, C6orf48, NAP1L1, and GPR183 were significantly downregulated in the meta clusters of immune cells in Neuro-COVID (Figure 2D).
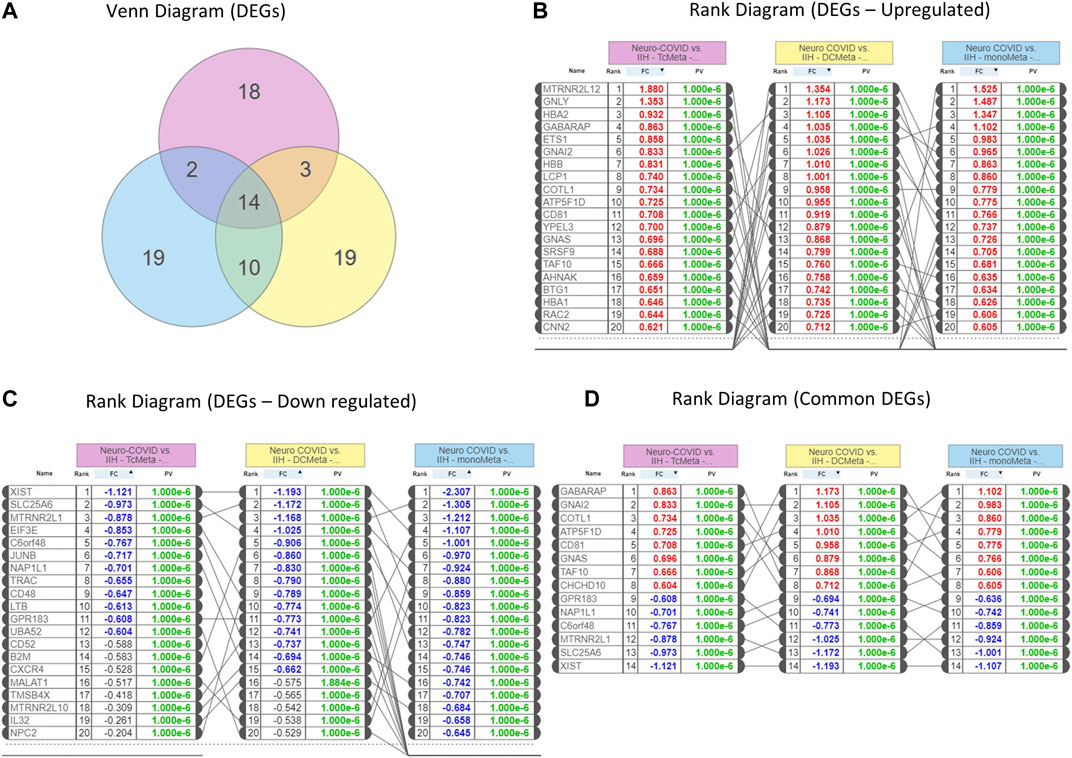
FIGURE 2. Differentially expressed genes (DEGs) in Neuro-COVID vs. IIH comparison based on iPathwayGuide analysis. (A) Venn diagram shows the DEGs between TcMeta, DCMeta, and monoMeta. (B) The rank diagram shows the upregulated DEGs in TcMeta, DCMeta, and monoMeta. (C) The rank diagram shows the downregulated DEGs in TcMeta, DCMeta, and monoMeta. (D) The rank diagram shows the common DEGs between TcMeta, DCMeta, and monoMeta.
GO analysis showed that 61 biological processes (Figure 3A), 13 molecular functions (Figure 3C), and 12 cellular components (Figure 3E) were commonly enriched in the meta clusters of immune cells in Neuro-COVID. The top five biological processes enriched were bicarbonate transport, gas transport, oxygen transport, hydrogen peroxide, and drug transport (Figure 3B), the top five molecular functions enriched were haptoglobin binding, oxygen binding, oxygen carrier activity, heme binding, and tetrapyrrole binding (Figure 3D), and the top five cellular components enriched were endocytic vesicle, haptoglobin-hemoglobin complex, hemoglobin complex, cytosolic small ribosomes, and cytosolic ribosomes (Figure 3F). The top five differentially expressed pathways identified based on iPathwayGuide analysis of immune cell meta clusters from Neuro-COVID patients were malaria, African trypanosomiasis, cocaine addiction, Parkinson’s disease, and leukocyte transendothelial migration. The differentially regulated pathways in the meta clusters of immune cells from patients with Neuro-COVID are provided in Supplementary Table S1. The upstream genes activated in TcMeta, DCMeta, and monoMeta clusters are listed in Supplementary Table S2.
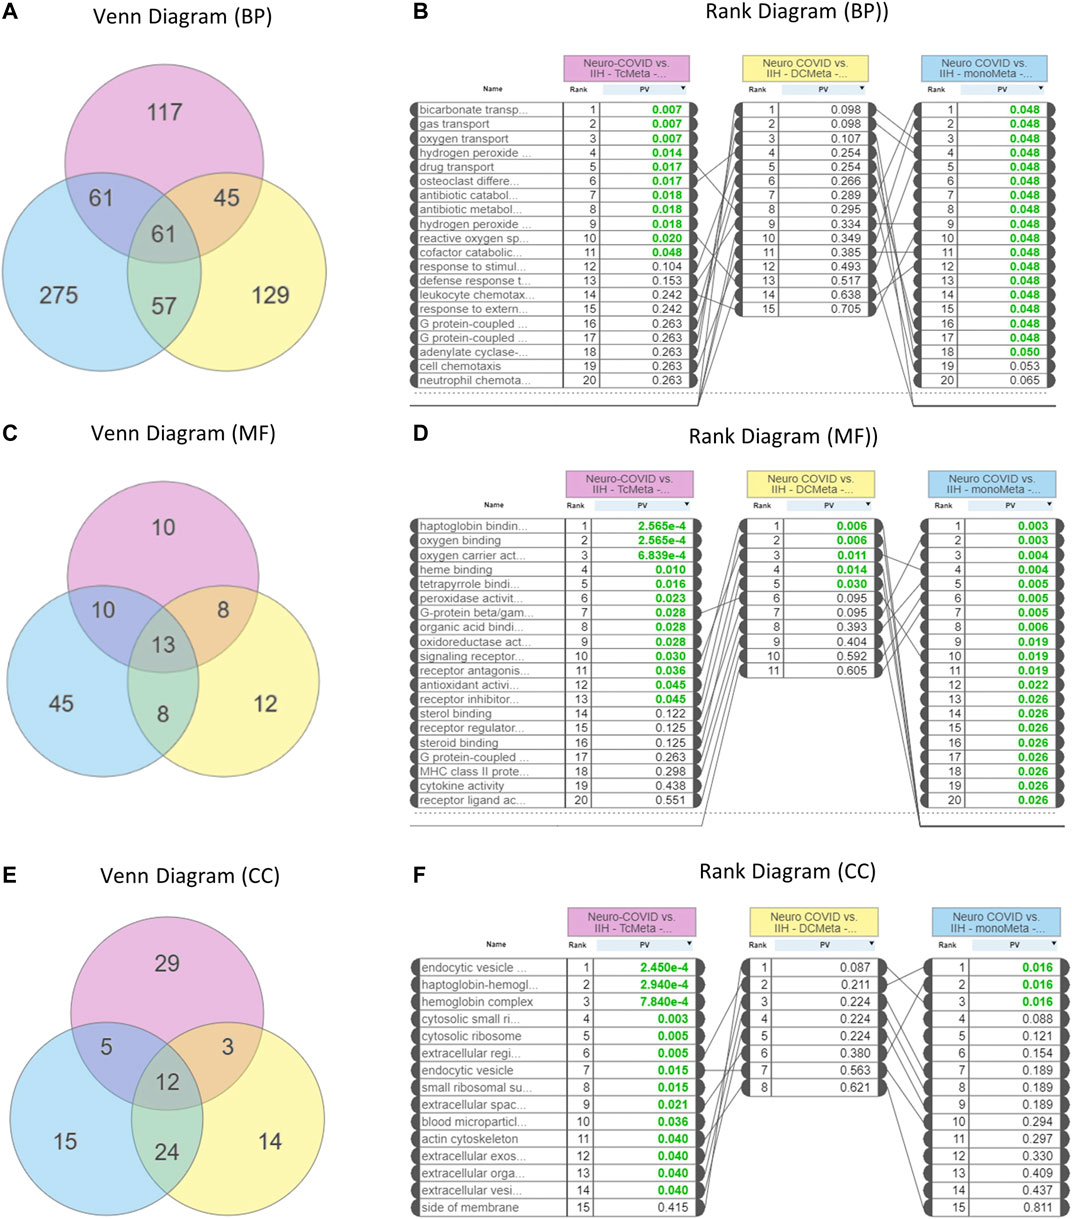
FIGURE 3. Enrichment of gene ontologies (GO) such as biological process (BP), molecular function (MF), and cellular component (CC) in Neuro-COVID vs. IIH comparison based on iPathwayGuide analysis. (A) Venn and (B) rank diagrams show the BP enriched between TcMeta, DCMeta, and monoMeta. (C) Venn and (D) rank diagrams show the MF enriched between TcMeta, DCMeta, and monoMeta. (E) Venn and (F) rank diagrams show the CC enriched between TcMeta, DCMeta, and monoMeta.
The L1000FWD analysis of DEGs of meta clusters of Tc, DC, and Mono of Neuro-COVID compared to IIH revealed that withaferin A was the top molecule capable of reversing the COVID-19 induced gene signatures (Tables 7–9). Furthermore, the rank diagram (Figure 4A) showed that JQ1 was the top drug based on the in silico prediction of insufficient signaling of drugs, natural products, and chemicals in the meta clusters of Tc, DC, and Mono of Neuro-COVID compared to IIH using iPathwayGuide (Figure 4B). The L100CDS2 analysis of DEGs of meta clusters of Tc, DC, and Mono of Neuro-COVID compared to IIH revealed that narciclasine (Figure 4C) and trichostatin A (Figure 4D) were some of the top molecules potentially reversing the Neuro-COVID gene signatures (Tables 10–12).
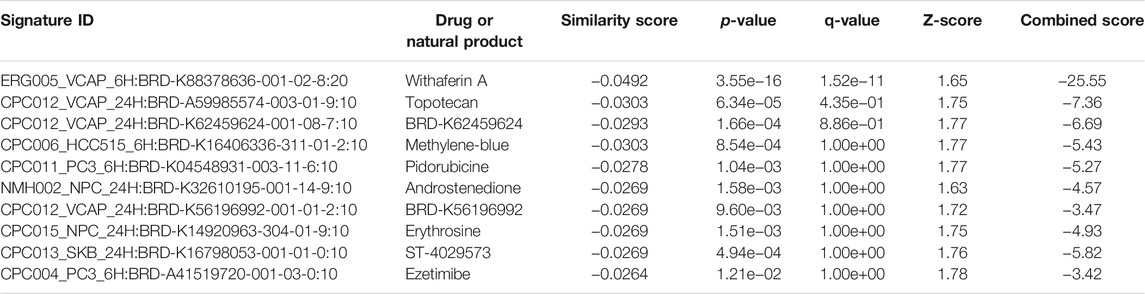
TABLE 7. Top small molecules with opposite molecular signatures based on L1000FWD web-based tool for querying gene expression signatures (Neuro-COVID vs. IIH-Tc Meta) against signatures created from human cell lines treated with over 20,000 small molecules and drugs for the LINCS project.
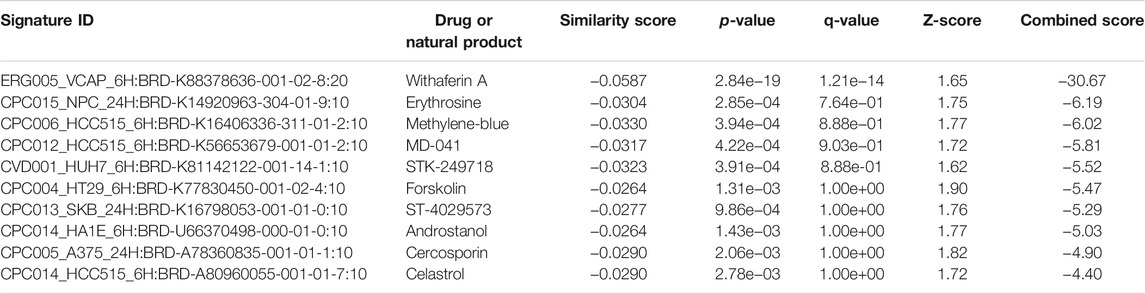
TABLE 8. Top small molecules with opposite molecular signatures based on L1000FWD web-based tool for querying gene expression signatures (Neuro-COVID vs. IIH-DC Meta) against signatures created from human cell lines treated with over 20,000 small molecules and drugs for the LINCS project.
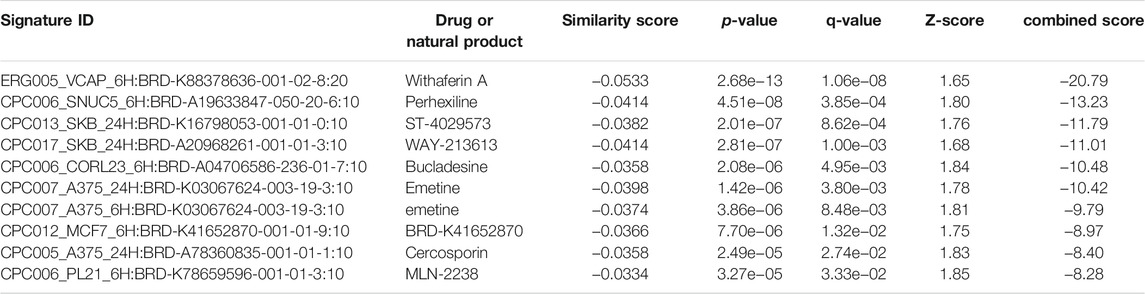
TABLE 9. Top small molecules with opposite molecular signatures based on L1000FWD web-based tool for querying gene expression signatures (Neuro-COVID vs. IIH-monoMeta) against signatures created from human cell lines treated with over 20,000 small molecules and drugs for the LINCS project.
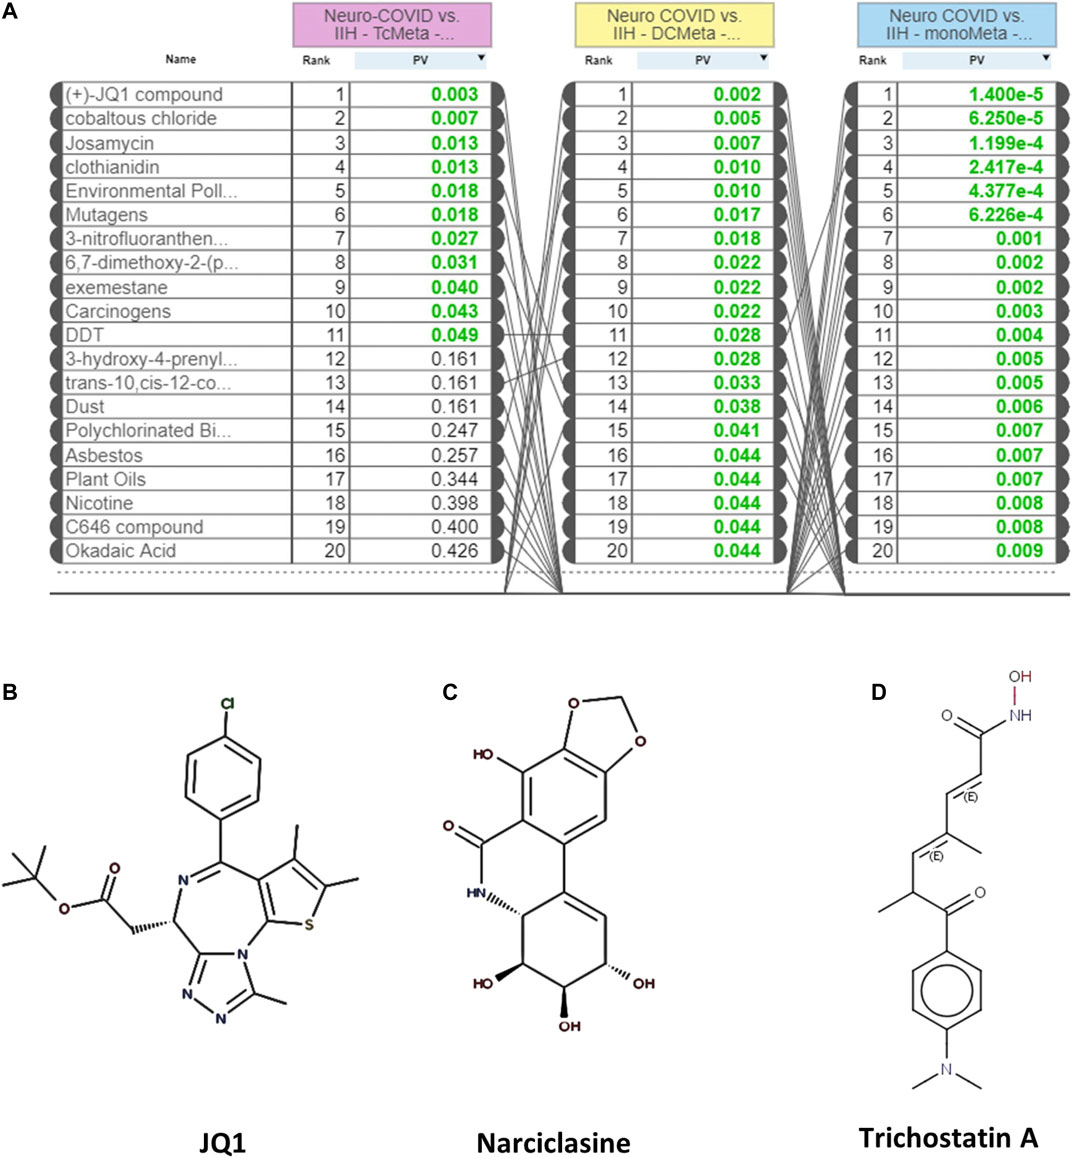
FIGURE 4. (A) The rank diagram based on the in silico prediction of insufficient signaling of drugs and natural products in TcMeta, DCMeta, and monoMeta using iPathwayGuide analysis. (B–D) The two-dimensional structures of JQ1, narciclasine, and trichostatin A.
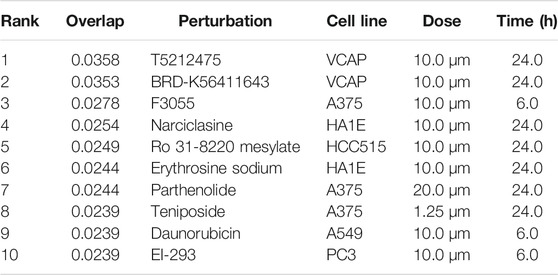
TABLE 10. Top small molecules identified by the L1000CDS2 query that reverse the Neuro-COVID vs. IIH-TcMeta gene signature.
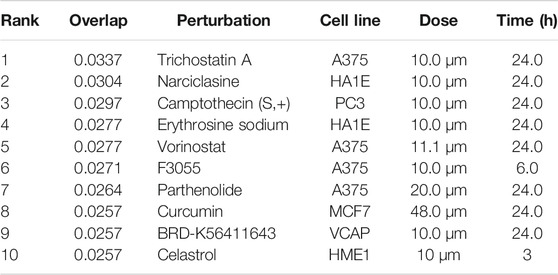
TABLE 11. Top small molecules identified by the L1000CDS2 query that reverse the Neuro-COVID vs. IIH-DCMeta gene signature.
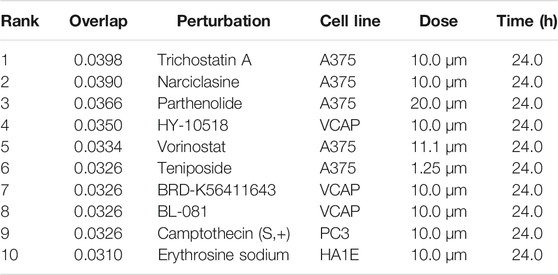
TABLE 12. Top small molecules identified by the L1000CDS2 query that reverse the Neuro-COVID vs. IIH-monoMeta gene signature.
To obtain the specific gene signatures potentially reversed by camptothecin, importazole, and withaferin A, GSEA preranked analysis was performed using ranked DEGs from SARS-CoV-2-NHBE vs. Mock-NHBE comparison against gene signatures differentially regulated by these small molecules derived from the L1000FWD web tool. The gene signature (Signature ID: CPC002_PC3_24H: BRD-A30437061:10.0) downregulated by camptothecin was positively enriched (normalized enrichment score (NES) = 1.32, and q-value = 0.065) and the upregulated genes were negatively enriched (NES = −1.12 and q-value = 0.27) in the SARS CoV2-NHBE cells (Supplementary Figure S2A). The gene signature (Signature ID: CPC006_A375_24H: BRD-A02481876:60.0) downregulated by importazole was positively enriched (NES = 1.31 and q-value = 0.036) (Supplementary Figure S2B) and the gene signature (Signature ID: CPC014_VCAP_6H: BRD-A52193669:10.0) downregulated by withaferin A was significantly enriched (NES = 1.21 and q-value = 0), and the upregulated genes were negatively enriched (NES = −1.21 and q-value = 0.14) in the SARS CoV2-NHBE cells (Supplementary Figure S2C).
Camptothecin potentially reversed 28 genes that were positively enriched in SARS-CoV-2 in NHBE cells, and the top 10 genes were COL6A2, CSE1L, TMEM135, PPA2, MNAT1, BNIP3L, DLGAP5, TMEM47, ARHGAP29, and OLA1. In contrast, 11 genes upregulated by CPT were negatively enriched in SARS-CoV-2- NHBE cells, including RSAD2, CD74, HSPA2, SDC3, ZDHHC11, NEU1, S100A8, ISG15, MAFB, TSPAN7, and PEG3. Importazole potentially reversed 66 genes that were positively enriched in SARS-CoV-2-NHBE cells, and the top 10 genes were CDH19, CD58, TFF3, SNX10, SMC4, TMEM135, MNAT1, PBK, and TFPI. Withaferin A potentially reversed 134 genes that were positively enriched in SARS-CoV-2-NHBE cells, and the top 10 genes were NUDT4, CCNG1, ASPM, NLGN4X, USP1, SERP1, DIAPH2, PLEKHF2, XPO1, SUB1, SMC4, and HSPA6. In contrast, 23 genes upregulated by withaferin A were negatively enriched in SARS-CoV-2- NHBE cells and the top 10 genes were MT1F, CBR3, RAB20, SLC22A18, SLC37A4, EIF4EBP1, IRX5, S100A8, COL1A1, and ABHD14A. In addition, the gene signatures enriched in SARS-CoV-2-NHBE cells that were potentially reversed by withaferin A, camptothecin, and importazole were analyzed using Metascape to identify the enrichment ontology clusters based on GO/KEGG terms, canonical pathways, and hallmark gene sets (Figure 5). The genes enriched in GSEA preranked analysis of SARS CoV2-NHBE vs. Mock-NHBE against the gene signatures of camptothecin, importazole, and withaferin A are provided in Supplementary Datasheet S1.
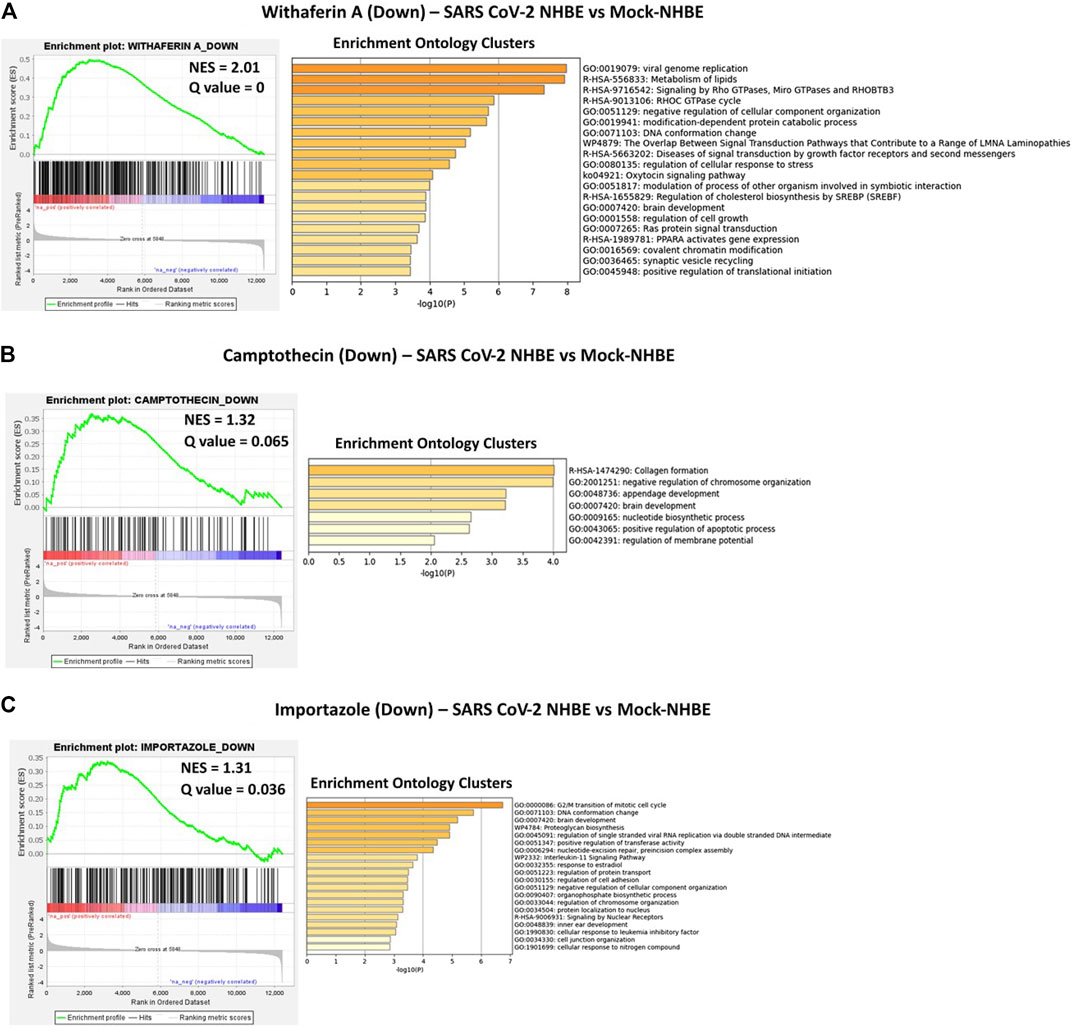
FIGURE 5. GSEA preranked analysis was performed to decipher the potential gene signatures downregulated by camptothecin, importazole, and withaferin A using the RNK file generated from DEGs of SARS CoV2-NHBE vs. Mock-NHBE comparison. The Metascape analyses to decipher the gene ontology clusters based on the (A) enrichment of gene signature (Signature ID: CPC014_VCAP_6H: BRD-A52193669:10.0) downregulated by withaferin A (B) enrichment of gene signature (Signature ID: CPC002_PC3_24H: BRD-A30437061:10.0) downregulated by camptothecin, and (C) enrichment of gene signature (Signature ID: CPC006_A375_24H: BRD-A02481876:60.0) downregulated by importazole in SARS CoV2-NHBE cells.
Similarly, the GSEA preranked analysis was performed using ranked DEGs from Neuro-COVID vs. IIH-TcMeta, Neuro-COVID vs. IIH-DCMeta, and Neuro-COVID vs. IIH_monoMeta comparisons against gene signatures differentially regulated by withaferin A, camptothecin, trichostatin A, narciclasine, and JQ1 small molecules. The gene signature (Signature ID: CPC014_VCAP_6H: BRD-A52193669:10.0) upregulated by withaferin A was positively enriched (NES = 1.62, q = 0.028) in TcMeta, DCMeta (NES = 1.23, q-value <= 0.24), and monoMeta (NES = 1.50, q-value = 0.06). However, the downregulated genes of withaferin A were moderately enriched in TcMeta and DCMeta (Supplementary Figure S3). The gene signature (Signature ID: CPC002_PC3_24H: BRD-A30437061:10.0) downregulated by camptothecin was significantly enriched (NES = 1.52, q = 0.051) in TcMeta and moderately enriched in DCMeta and monoMeta (Supplementary Figure S4).
The gene signature (Signature ID: CPC012_A375_6H: BRD-K68202742:10.0) downregulated by trichostatin A was moderately enriched (NES = 1.34 and q = 0.11) in TcMeta, DCMeta (NES = 0.92 and q-value = 0.59), and monoMeta (NES = 1.2 and q = 0.20). The upregulated genes of trichostatin A were negatively enriched in DCMeta (NES = −1.39 and q-value = 0.085) and monoMeta (NES = −1.47 and q-value = 0.10) (Supplementary Figure S5). The gene signature (Signature ID: CPC006_HA1E_24H: BRD-K06792661:10.0) upregulated by narciclasine was negatively enriched in TcMeta (NES = −1.97 and q-value = 0), DCMeta (NES = −1.65 and q-value = 0), and monoMeta (NES = −2.77 and q-value = 0). The differentially regulated genes of narciclasine were negatively enriched in monoMeta (NES = −2.01 and q-value = 0). However, the downregulated genes of narciclasine were moderately enriched in TcMeta (NES = 1.22 and q-value = 0.19) and DCMeta (NES = 1.32 and q = 0.15) (Supplementary Figure S6). The gene signature (Signature ID: LJP008_A549_24H: BRD-K54606188:10) downregulated by JQ1 was negatively enriched in the DCMeta (NES = −0.68 and q-value = 0.98) and Neuro-COVID vs. IIH-monoMeta (NES = −1.40 and q = 0.14) groups. The upregulated genes of JQ1 were moderately enriched in all three meta clusters of immune cells in Neuro-COVID (Supplementary Figure S7).
The gene signatures upregulated by withaferin A (GNLY CST7 PPIB TSPO BCL2 S100A10 GSTP1), (S100A10, TSPO, PPIB, HLA-DQB1, BCL2, GSTP1, EDF1, and FLOT1), and (S100A9, S100A8, TSPO, and HOMER3) were positively enriched in TcMeta, DCMeta, and monoMeta clusters in Neuro-COVID. Camptothecin potentially reversed seven genes that were positively enriched in TcMeta, including AHNAK, MBNL1, LGALS1, HNRNPA2B1, S100A10, TGFBR2, and CAPN2. Trichostatin A potentially reverses five genes that were positively enriched in DCMeta, such as RGS2. IL32, ZFP36, SRGN, and STAB1, as well as nine genes that were positively enriched in monoMeta, such as SRGN, RGS2, IL32, ZFP36, JUNB, SAT1, PADI2, ALOX5AP, and IL2RG. The upregulated gene signatures of narciclasine (H3F3B, ZFP36, RGS2, and XIST) and (XIST, CREM, ZFP36, JUNB, NR4A2, FOS, EGR1, EVI2A, SAT1, EGR2, IER2, NR4A1, and KDM5A) were negatively enriched in DCMeta and monoMeta, respectively. JQ1 potentially increased six genes that were negatively enriched in DCMeta, such as H3F3B, AP2A2, PIGF, SOS1, TRIO, FHL3, H3F3B, MBNL2, TRIO, AP2A2, PSIP1, and ARHGEF6 in monoMeta. In addition, the gene signatures enriched in Neuro-COVID vs. IIH (TcMeta, DCMeta, and monoMeta) that are potentially reversed by withaferin A, camptothecin, trichostatin A, narciclasine, and JQ1 were analyzed using Metascape to find the enrichment ontology clusters based on GO/KEGG terms, canonical pathways, and hallmark gene sets. The enrichment ontology clusters derived for the gene signatures reversed by withaferin A, trichostatin A, and narciclasine in Neuro-COVID vs. IIH-TcMeta are shown in Figure 6. The genes enriched in GSEA preranked analysis of Neuro-COVID vs. IIH comparison against the gene signatures of withaferin A, camptothecin, trichostatin A, narciclasine, and JQ1 are provided in Supplementary Datasheet S2.
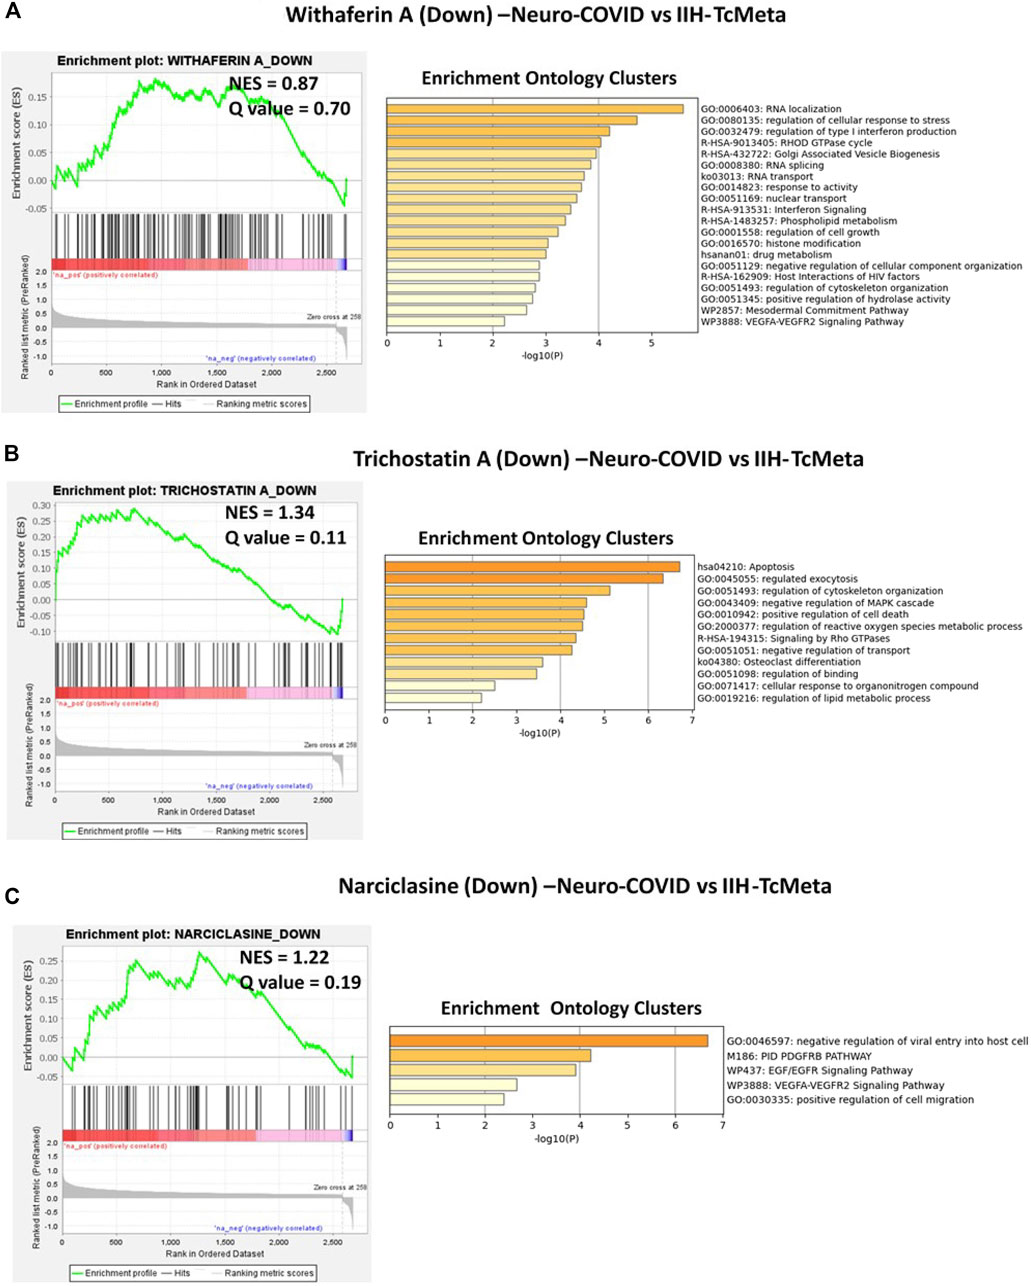
FIGURE 6. GSEA preranked analysis was performed to decipher the potential gene signatures downregulated by withaferin A, trichostatin A, and narciclasine using the RNK file generated from DEGs of Neuro-COVID vs. IIH (TcMeta) comparison. The Metascape analyses to decipher the GO clusters based on the (A) enrichment of gene signature (Signature ID: CPC014_VCAP_6H: BRD-A52193669:10.0) downregulated by withaferin A, (B) enrichment of gene signature (Signature ID: CPC012_A375_6H: BRD-K68202742:10.0) downregulated by trichostatin A, and (C) enrichment of gene signature (Signature ID: CPC006_HA1E_24H: BRD-K06792661:10.0) downregulated by narciclasine in Neuro-COVID vs. IIH-TcMeta.
COVID-19 caused by SARS-CoV-2 infection remains an ongoing pandemic (Huang C. et al., 2020; Liu J. et al., 2020; Novel Coronavirus Pneumonia Emergency Response Epidemiology Team, 2020) and patients with severe COVID-19 may also develop neurological complications called Neuro-COVID (Heming et al., 2021). RNA sequencing is a very recently developed NGS methodology for the whole transcriptome or single-cell transcriptomics approaches (Liu and Di, 2020) and is broadly used to explore biological, cellular, and molecular processes implicated in COVID-19 infection (Liu T. et al., 2020; Liao et al., 2020; Zhou et al., 2020). Hence, either developing novel drug candidates or identifying suitable existing therapeutics for drug repurposing for COVID-19 and Neuro-COVID is essential to decrease the infection rate and control the COVID-19 pandemic and reduce the enormous economic burden on healthcare systems. Because the gene expression profiles of COVID-19 infection models can be used to decipher potential therapeutic targets that could be targeted by known drugs (Daamen et al., 2021), we used RNA-seq datasets from the COVID-19 infection models of NHBE cells, and the scRNA-seq datasets of immune cells isolated from the CSF of Neuro-COVID patients and analyzed using NGKD platforms to understand the disease-specific gene signatures and pathways and further uncover small molecules from both synthetic and natural sources that potentially reverse these diseases.
Here, we found that COVID-19 infection of NHBE cells activated upstream genes such as IL-17, TNF-alpha, STAT2, IRF9, and TLR-4. Biological processes such as humoral immune response, acute-phase response, and molecular functions such as cytokine activity, receptor regulator activity, signaling receptor activity, receptor-ligand activity, and chemokine activity were enriched in the COVID-infected cells. Importantly, the cytokine and cytokine receptor interaction and viral protein interaction with the cytokine and cytokine receptors were activated in COVID-infected NHBE cells. Cytokines are important for both innate and adaptive inflammatory host responses, cell differentiation, cell death, growth, repair and development, and cellular homeostasis (Pushparaj, 2019; Bahlas et al., 2020; Harakeh et al., 2020; Jafri et al., 2020; Pushparaj, 2020). Studies have shown that several circulating cytokines and chemokines such as TNFα, CXCL-10, IL-6, and IL-8 are differentially expressed during SARS-CoV-2 infection, and this cytokine/chemokine storm likely contributes to the poor prognosis of COVID-19 (Liu J. et al., 2020; Vaninov, 2020). RNA sequencing analysis of cell and animal models of SARS-CoV-2 infection, blood, lung, and airway biopsies from COVID-19 patients showed inflammatory responses characterized by low levels of type I and III IFNs, increased interleukin-6 (IL-6), and a variety of chemokines (Blanco-Melo et al., 2020; Daamen et al., 2021). The spike protein (S protein) of SARS-CoV-2 is essential for the attachment between the coronavirus and hACE2 surface receptor through its receptor-binding domain (RBD) (Lan et al., 2020) and is proteolytically activated by human proteases, thus helping the coronavirus to enter the host cells (Shang et al., 2020). A recent study showed that hACE2 was stimulated by IFN in human airway epithelial cells (Ziegler et al., 2020) and thus helps in the entry of SARS-CoV-2 into host cells.
SARS-CoV-2 and other coronaviruses have developed different mechanisms to avoid detection and subsequent destruction by copying and repurposing cytokine and cytokine receptor genes in the host (Heimfarth et al., 2020; Choudhary et al., 2021). COVID-19 induced cytokines and cytokine receptors, chemokines, and other specific cytokine receptors and binding proteins may subvert and alter the host cytokine networks (Choudhary et al., 2021). Here, the COVID-19-induced cytokines, cytokine receptors, receptor-binding proteins, and chemokines may stimulate or prevent cytokine signaling and may significantly alter various facets of host immunity. In addition, Daamen et al. (2021) found that COVID-19 pathogenesis was driven by highly inflammatory myeloid-lineage cells with distinct transcriptional signatures and the absence of cytotoxic cells in the lungs, leading to reduced viral clearance.
Heming et al. (2021) stated that lumbar puncture to obtain immune cells from COVID-19 patients without neurological manifestations as controls was not ethically permitted for scientific purposes. Since IIH is a benign disorder associated with high pressure in the brain, the immune cells derived from the CSF of patients with IIH were used as controls to compare Neuro-COVID. The cluster of differentiation molecule 81 (CD81) is one of the commonly regulated genes in the meta clusters of immune cells from the CSF of patients with Neuro-COVID and belongs to the tetraspanin superfamily, which has been shown to regulate viral entry, viral replication, infectivity, and virion exit of different types of viruses (Benayas et al., 2020). Therefore, it is essential to investigate the importance of CD81 in patients with COVID-19 and Neuro-COVID. One of the upstream genes activated in TcMeta cluster, Cell cycle division 37 (CDC37), a heat shock protein 90 (HSP90) cochaperone that could play an important role in the pathogenesis of Neuro-COVID. COVID-19 progression to a systemic disease could be associated with HSP-related molecular mimicry autoimmune phenomena (Cappello et al. 2020; Kasperkiewicz, 2021). It was postulated that Hsp90 inhibition could also be a potential treatment option for cytokine storm-mediated acute respiratory distress syndrome in COVID-19 patients (Kasperkiewicz, 2021). Recently, Wyler et al. (2021) identified HSP90 as a target for COVID therapy based on transcriptomic profiling of SARS-CoV-2 infected human cell lines.
Interestingly, the top five differentially expressed pathways identified based on iPathwayGuide analysis of immune cell meta clusters from Neuro-COVID patients were malaria, African trypanosomiasis, cocaine addiction, Parkinson’s disease, and leukocyte transendothelial migration. Studies have shown a potential link between the presentation of malaria and COVID-19. The opposite relationship between COVID 19 and malaria has been suggested to be linked with the wide use of antimalarial drugs, including hydroxychloroquine (HCQ) and chloroquine (CQ), in countries that are endemic to malaria (Hussein et al., 2020).
There are many types of COVID-19 vaccines currently available for prophylaxis, and many are under development (Mandolesi et al., 2021). Several therapeutics are available based on WHO guidelines to treat the complications of COVID-19 and related complications (Lamontagne et al., 2021); however, these therapeutics are not specifically designed for the treatment of COVID-19 and its related complications such as Neuro-COVID, and their efficacies substantially differ across the globe and are not very effective in ameliorating disease severity (Surnar et al., 2020). In this study, we utilized NGKD platforms such as iPathwayGuide, L1000FWD, and L1000CDS2 tools to identify promising druggable molecules based on their in silico potential to reverse gene signatures induced by COVID-19 and Neuro-COVID. We found that camptothecin, importazole, and withaferin A had insufficient signaling or gene signatures (or absent) in COVID-19 infected NHBE cells. Based on L1000CDS2 analysis, trichostatin A, a histone deacetylase inhibitor, mildly inhibited the ACE receptors (Takahashi et al., 2021), and narciclasine and camptothecin are some of the top small molecules that reverse the gene signatures in Neuro-COVID vs. IIH immune datasets. In addition, a comparative analysis of the Neuro-COVID vs. IIH immune cell meta cluster datasets showed that JQ1 had insufficient signaling (or absence).
The GSEA preranked analysis calculates if a priori defined sets of genes display statistically significant enrichment at either end of the ranking (Subramanian et al., 2005). The gene signature potentially reversed by withaferin A in SARS-CoV-2 NHBE vs. Mock-NHBE based on preranked GSEA involved in various biological, molecular, and cellular processes, including viral genome replication (GO:0019079), modulation of the process of other organisms involved in symbiotic interactions (GO:0051817), and positive regulation of translational initiation (GO:0045948). The gene signature potentially reversed by importazole in SARS-CoV-2 NHBE vs. Mock-NHBE based on preranked GSEA involved in various biological, molecular, and cellular processes, including regulation of single-stranded viral RNA replication via a double-stranded DNA intermediate (GO:0045091). The gene signature potentially reversed by withaferin A in Neuro-COVID vs. IIH-TcMeta based on preranked GSEA involved in various biological, molecular, and cellular processes, including regulation of type 1 interferon production (GO:0032479) and interferon signaling (R-HSA-913531). The gene signature potentially reversed by withaferin A in Neuro-COVID vs. IIH-TcMeta based on preranked GSEA involved in various biological, molecular, and cellular processes, including regulation of type 1 interferon production (GO:0032479) and interferon signaling (R-HSA-913531). The gene signature potentially reversed by narciclasine in Neuro-COVID vs. IIH-TcMeta based on preranked GSEA involved in negative regulation of viral entry into host cells (GO: 0046597), PDGFR beta signaling pathway (PID-M186), EGF/EGFR signaling pathway (WP437), VEGFA/VEGFR2 signaling pathway (WP3888), and positive regulation of cell migration (GO:0030335). The gene signatures upregulated by withaferin A (GNLY CST7 PPIB TSPO BCL2 S100A10 GSTP1), (S100A10, TSPO, PPIB, HLA-DQB1, BCL2, GSTP1, EDF1, and FLOT1), and S100A9, S100A8, TSPO, and HOMER3) were positively enriched in Neuro-COVID. Granulysin (GNLY) is a member of the saposin-like protein (SAPLIP) family, is located in the cytotoxic granules of T-cells and NK cells, is released on antigen stimuli, and has antimicrobial activity. The S100 genes include 13 members and have antibacterial and antifungal properties (Crinier et al., 2018).
Our L1000FWD analyses showed that withaferin A was the top natural product that reverses the signature of Neuro-COVID in all the meta clusters of immune cells from the CSF of Neuro-COVID patients. Withaferin A is a component of Withania somnifera (ashwagandha or Indian ginseng) (Srivastava et al., 2020). W. somnifera has been used in traditional medicine as an antioxidant, antianxiety, anti-inflammatory, antibacterial, aphrodisiac, and herbal tonic for general health (Sood et al., 2018). The active ingredients include withanolides, saponins, alkaloids, and steroidal lactones. In vitro studies have shown that ashwagandha has neuroprotective, cardioprotective, immunomodulating, and anticancer properties (Singh et al., 2021).
Adjunctive treatment with ashwagandha improved symptoms and stress in patients with schizophrenia, offering beneficial effects on cognitive function in patients with bipolar disorder and improves balance in patients with progressive degenerative cerebral ataxias (Sood et al., 2018; Singh et al., 2021). It was recently shown that withanolides present in ashwagandha possess anti-COVID-19 properties, and these compounds exhibit good absorption and transport kinetics with no related mutagenic or adverse effects (Srivastava et al., 2020). Withaferin A was predicted to bind and stably interact with the binding site of TMPRSS2, similar to its known inhibitor, camostat mesylate (Kumar et al., 2020). Camostat was found to reduce SARS-CoV-2 infection in TMPRSS2 expressing Vero cells (Hoffmann et al., 2020). David et al., 2021 in their MedRixv preprint showed that a common variant of TMPRSS2 protects against COVID-19. In silico screening of several phytochemicals identified that Withanone, one of the constituents of ashwagandha, showed a potential inhibition of ACE2 (Balkrishna et al., 2021). Additionally, Ghosh et al. (2021) used molecular dynamic simulations and pharmacophore modeling approaches to predict the highly potent small-molecule derivative of withaferin A that potentially inhibits SARS-CoV-2 protease (Mpro), a favorable future therapeutic against COVID-19.
Recent studies have demonstrated the antiviral properties of narciclasine, an alkaloid found in various Amaryllidaceae species, and camptothecin, a topoisomerase inhibitor first isolated from the stem of Camptotheca acuminata (used in Chinese traditional medicine) against SARS-CoV-2 (Huang C.-T. et al., 2020; Mamkulathil Devasia et al., 2021). However, importazole, an inhibitor of importin-β transport receptors, and other small molecules identified to reverse COVID-19-induced gene signatures need to be further explored because developing effective therapeutics is essential to control the COVID-19 pandemic (Surnar et al., 2020).
In conclusion, the present study unravels a rapid approach to using high-throughput RNA sequencing technologies coupled with NGKD platforms to decipher specific drugs and small molecules derived either synthetically or from natural sources for the amelioration of COVID-19 related disease pathologies such as Neuro-COVID. Further studies are warranted to validate the small molecules identified in our study using in vitro and in vivo model systems of COVID-19 and Neuro-COVID to determine their mechanism(s) of action followed by suitable clinical trials to confirm the efficacy and safety for possible therapeutic intervention for COVID-19-related disease pathologies.
Publicly available datasets were analyzed in this study. This data can be found here: Gene Expression Omnibus GSE147507 and GSE163005.
PP, MN, and AA designed the experiments. PP and MN conducted the experiments. PP, AA, and MN analyzed the data. PP wrote the manuscript. PP and MN finally revised the manuscript. All authors contributed to the editing of the manuscript and the scientific discussions.
The research work was funded by Institutional Fund Project under grant no. (IFPHI-110-117-2020). Therefore, the authors gratefully acknowledge technical and financial support from the Ministry of Education and King Abdulaziz University, DSR, Jeddah. Saudi Arabia.
The authors declare that the research was conducted in the absence of any commercial or financial relationships that could be construed as a potential conflict of interest.
All claims expressed in this article are solely those of the authors and do not necessarily represent those of their affiliated organizations, or those of the publisher, the editors and the reviewers. Any product that may be evaluated in this article, or claim that may be made by its manufacturer, is not guaranteed or endorsed by the publisher.
The Supplementary Material for this article can be found online at: https://www.frontiersin.org/articles/10.3389/fphar.2021.688227/full#supplementary-material
Supplementary Table S1 | The differentially regulated pathways in the meta clusters of immune cells from patients with Neuro-COVID are provided in Supplementary Table S1.
Supplementary Table S2 | The upstream genes activated in TcMeta, DCMeta, and monoMeta clusters are listed in Supplementary Table S2.
Supplementary Datasheet S1 | The genes enriched in GSEA preranked analysis of SARS CoV2-NHBE vs. Mock-NHBE against the gene signatures of camptothecin, importazole, and withaferin A are provided in Supplementary Datasheet S1.
Supplementary Datasheet S2 | The genes enriched in GSEA preranked analysis of Neuro-COVID vs. IIH comparison against the gene signatures of withaferin A, camptothecin, trichostatin A, narciclasine, and JQ1 are provided in Supplementary Datasheet S2.
Supplementary Figure S1 | (A) Hierarchically clustered interactive heatmaps were generated using the Clustergrammer web tool for visualizing and analyzing high-dimensional RNASeq data (NHBE-SARS CoV2 vs NHBE-Mock). (B) Principal Component Analysis (PCA) was applied to identify global patterns in high-dimensional RNASeq datasets (C) Volcano plot was generated using transformed gene fold changes using log2 and displayed on the x-axis (D) MA plot was based on average gene expression which was calculated using the mean of the normalized gene expression values and displayed on the x-axis.
Supplementary Figure S2 | GSEA Preranked analysis was performed to decipher the potential gene signatures differentially regulated (Combined, Downregulated, and Upregulated) by camptothecin, importazole, and withaferin A using the RNK file generated from DEGs of SARS CoV-NHBE vs Mock-NHBE comparison. (A) The enrichment of gene signature (Signature_ID: CPC002_PC3_24H: BRD-A30437061:10.0) differentially regulated by camptothecin, (B) the enrichment of gene signature (Signature ID: CPC006_A375_24H: BRD-A02481876:60.0) differentially regulated by importazole and (C) the enrichment of gene signature (Signature ID: CPC014_VCAP_6H: BRD-A52193669:10.0) differentially regulated by withaferin A in SARS CoV2-NHBE cells.
Supplementary Figure S3 | GSEA Preranked analysis was performed to decipher the potential gene signatures differentially regulated (Combined, Downregulated, and Upregulated) by withaferin A using the RNK file generated from DEGs of Neuro-COVID vs IIH (TcMeta, DCMeta, and monoMeta) comparisons. The enrichment of gene signature (Signature ID: CPC014_VCAP_6H: BRD-A52193669:10.0) differentially regulated by withaferin A in (A) Neuro-COVID vs IIH-TcMeta (B) Neuro-COVID vs IIH-DCMeta, and (C) Neuro-COVID vs IIH-monoMeta.
Supplementary Figure S4 | GSEA Preranked analysis was performed to decipher the potential gene signatures differentially regulated (Combined, Downregulated, and Upregulated) by camptothecin using the RNK file generated from DEGs of Neuro-COVID vs IIH (TcMeta, DCMeta, and monoMeta) comparisons. The enrichment of gene signature (Signature ID: CPC002_PC3_24H: BRD-A30437061:10.0) differentially regulated by camptothecin in (A) Neuro-COVID vs IIH-TcMeta (B) Neuro-COVID vs IIH-DCMeta, and (C) Neuro-COVID vs IIH-monoMeta.
Supplementary Figure S5 | GSEA Preranked analysis was performed to decipher the potential gene signatures differentially regulated (Combined, Downregulated, and Upregulated) by trichostatin A using the RNK file generated from DEGs of Neuro-COVID vs IIH (TcMeta, DCMeta, and monoMeta) comparisons. The enrichment of gene signature (Signature ID: CPC012_A375_6H: BRD-K68202742:10.0) differentially regulated by trichostatin A in (A) Neuro-COVID vs IIH-TcMeta (B) Neuro-COVID vs IIH-DCMeta, and (C) Neuro-COVID vs IIH-monoMeta.
Supplementary Figure S6 | GSEA Preranked analysis was performed to decipher the potential gene signatures differentially regulated (Combined, Downregulated, and Upregulated) by narciclasine using the RNK file generated from DEGs of Neuro-COVID vs IIH (TcMeta, DCMeta, and monoMeta) comparisons. The enrichment of gene signature (Signature ID: CPC006_HA1E_24H: BRD-K06792661:10.0) differentially regulated by narciclasine in (A) Neuro-COVID vs IIH-TcMeta (B) Neuro-COVID vs IIH-DCMeta, and (C) Neuro-COVID vs IIH-monoMeta.
Supplementary Figure S7 | GSEA Preranked analysis was performed to decipher the potential gene signatures differentially regulated (Combined, Downregulated, and Upregulated) by JQ1 using the RNK file generated from DEGs of Neuro-COVID vs IIH (TcMeta, DCMeta, and monoMeta) comparisons. The enrichment of gene signature (Signature ID: LJP008_A549_24H: BRD-K54606188:10) differentially regulated by JQ1 in (A) Neuro-COVID vs IIH-TcMeta (B) Neuro-COVID vs IIH-DCMeta, and (C) Neuro-COVID vs IIH-monoMeta.
Ashburner, M., and Lewis, S. (2002). On Ontologies for Biologists: The Gene Ontology-Uuntangling the Web. Novartis Found. Symp. 247, 66–52. doi:10.1002/0470857897.ch6
Ashburner, M., Ball, C. A., Blake, J. A., Botstein, D., Butler, H., Cherry, J. M., et al. (2000). Gene Ontology: Tool for the Unification of Biology. Nat. Genet. 25 (1), 25–29. doi:10.1038/75556
Bahlas, S., Damiati, L. A., Al-Hazmi, A. S., and Pushparaj, P. N. (2020). Decoding the Role of Sphingosine-1-Phosphate in Asthma and Other Respiratory System Diseases Using Next Generation Knowledge Discovery Platforms Coupled with Luminex Multiple Analyte Profiling Technology. Front. Cel Dev. Biol. 8, 444. doi:10.3389/fcell.2020.00444
Balkrishna, A., Pokhrel, S., Singh, H., Joshi, M., Mulay, V. P., Haldar, S., et al. (2021). Withanone from Withania Somnifera Attenuates SARS-CoV-2 RBD and Host ACE2 Interactions to Rescue Spike Protein Induced Pathologies in Humanized Zebrafish Model. Dddt 15, 1111–1133. doi:10.2147/DDDT.S292805
Barrett, T., Wilhite, S. E., Ledoux, P., Evangelista, C., Kim, I. F., Tomashevsky, M., et al. (2013). NCBI GEO: Archive for Functional Genomics Data Sets-Update. Nucleic Acids Res. 41 (Database issue), D991–D995. doi:10.1093/nar/gks1193
Benayas, B., Sastre, I., López-Martín, S., Oo, A., Kim, B., Bullido, M. J., et al. (2020). Tetraspanin CD81 Regulates HSV-1 Infection. Med. Microbiol. Immunol. 209 (4), 489–498. doi:10.1007/s00430-020-00684-0
Benjamini, Y., and Hochberg, Y. (1995). Controlling the False Discovery Rate: A Practical and Powerful Approach to Multiple Testing. J. R. Stat. Soc. Ser. B (Methodological) 57 (1), 289–300. doi:10.1111/j.2517-6161.1995.tb02031.x
Benjamini, Y., and Yekutieli, D. (2001). The Control of the False Discovery Rate in Multiple Testing Under Dependency. Ann. Stat. 29 (4), 1165–1188. doi:10.1214/aos/1013699998
Blanco-Melo, D., Nilsson-Payant, B. E., Liu, W.-C., Uhl, S., Hoagland, D., Møller, R., et al. (2020). Imbalanced Host Response to SARS-CoV-2 Drives Development of COVID-19. Cell 181 (5), 1036–1045.e9. doi:10.1016/j.cell.2020.04.026
Bonferroni, C. E. (1935). “Il calcolo delle assicurazioni su gruppi di teste,” in Studi in Onore del Professore Salvatore Ortu Carboni (Rome: Tipografia del Senato), 13–60.
Bonferroni, C. E. (1936). “Teoria statistica delle classi e calcolo delle probabilita,” in Pubblicazioni del Istituto Superiore di Scienze Economiche e Commerciali di Firenze (Firenze: Seeber), 8, 3–62.
Cappello, F., Marino Gammazza, A., Dieli, F., Conway de Macario, E., and Macario, A. J. (2020). Does SARS-CoV-2 Trigger Stress-Induced Autoimmunity by Molecular Mimicry? A Hypothesis. Jcm 9 (7), 2038. doi:10.3390/jcm9072038
Choudhary, S., Sharma, K., and Silakari, O. (2021). The Interplay Between Inflammatory Pathways and COVID-19: A Critical Review on Pathogenesis and Therapeutic Options. Microb. pathogenesis 150, 104673. doi:10.1016/j.micpath.2020.104673
Crinier, A., Milpied, P., Escalière, B., Piperoglou, C., Galluso, J., Balsamo, A., et al. (2018). High-Dimensional Single-Cell Analysis Identifies Organ-specific Signatures and Conserved NK Cell Subsets in Humans and Mice. Immunity 49 (5), 971–986.e5. doi:10.1016/j.immuni.2018.09.009
Cui, J., Li, F., and Shi, Z.-L. (2019). Origin and Evolution of Pathogenic Coronaviruses. Nat. Rev. Microbiol. 17, 181–192. doi:10.1038/s41579-018-0118-9
Daamen, A. R., Bachali, P., Owen, K. A., Kingsmore, K. M., Hubbard, E. L., Labonte, A. C., et al. (2021). Comprehensive Transcriptomic Analysis of COVID-19 Blood, Lung, and Airway. Sci. Rep. 11 (1), 7052. doi:10.1038/s41598-021-86002-x
David, A., Parkinson, N., Peacock, T. P., Pairo-Castineira, E., Khanna, T., Cobat, A., et al. (2021). A Common TMPRSS2 Variant Protects Against Severe COVID-19. MedRxiv [Preprint]. Available at: https://www.medrxiv.org/content/10.1101/2021.03.04.21252931v1.full.pdf. doi:10.1101/2021.03.04.21252931
Davis, A. P., Grondin, C. J., Johnson, R. J., Sciaky, D., Wiegers, J., Wiegers, T. C., et al. (2021). Comparative Toxicogenomics Database (CTD): Update 2021. Nucleic Acids Res. 49 (D1), D1138–D1143. doi:10.1093/nar/gkaa891
Dong, E., Du, H., and Gardner, L. (2020). An Interactive Web-Based Dashboard to Track COVID-19 in Real Time. Lancet Infect. Dis. 20 (5), 533–534. doi:10.1016/S1473-3099(20)30120-1
Draghici, S., Khatri, P., Martins, R. P., Ostermeier, G. C., and Krawetz, S. A. (2003a). Global Functional Profiling of Gene Expression. Genomics 81 (2), 98–104. doi:10.1016/s0888-7543(02)00021-6
Draghici, S. (2011). Statistics and Data Analysis for Microarrays Using R and Bioconductor. 2nd Edn. London: Chapman and Hall/CRC.
Draghici, S., Khatri, P., Bhavsar, P., Shah, A., Krawetz, S., and Tainsky, M. A. (2003b). Onto-Tools, the Toolkit of the Modern Biologist: Onto-Express, Onto-Compare, Onto-Design and Onto-Translate. Nucleic Acids Res. 31 (13), 3775–3781. doi:10.1093/nar/gkg624
Draghici, S., Khatri, P., Tarca, A. L., Amin, K., Done, A., Voichita, C., et al. (2007). A Systems Biology Approach for Pathway Level Analysis. Genome Res. 17 (10), 1537–1545. doi:10.1101/gr.6202607
Duan, Q., Reid, S. P., Clark, N. R., Wang, Z., Fernandez, N. F., Rouillard, A. D., et al. (2016). L1000CDS2: LINCS L1000 Characteristic Direction Signatures Search Engine. Npj Syst. Biol. Appl. 2, 16015. doi:10.1038/npjsba.2016.15
Ewing, B., and Green, P. (1998). Base-Calling of Automated Sequencer Traces UsingPhred.II. Error Probabilities. Genome Res. 8 (3), 186–194. doi:10.1101/gr.8.3.186
Fernandez, N. F., Gundersen, G. W., Rahman, A., Grimes, M. L., Rikova, K., Hornbeck, P., et al. (2017). Clustergrammer, A Web-Based Heatmap Visualization and Analysis Tool for High-Dimensional Biological Data. Sci. Data 4, 170151. doi:10.1038/sdata.2017.151
Fisher, R. A. (1925). Statistical Methods for Research Workers. 11th Edn. Edinburgh, UK: Oliver & Boyd.
Gene Ontology Consortium (2001). Creating the Gene Ontology Resource: Design and Implementation. Genome Res. 11, 1425–1433. doi:10.1101/gr.180801
Gene Ontology Consortium (2004). The Gene Ontology (GO) Database and Informatics Resource. Nucleic Acids Res. 32 (Suppl. 1), D258–D261.
Ghosh, A., Chakraborty, M., Chandra, A., and Alam, M. P. (2021). Structure-activity Relationship (SAR) and Molecular Dynamics Study of Withaferin-A Fragment Derivatives as Potential Therapeutic Lead Against Main Protease (Mpro) of SARS-CoV-2. J. Mol. Model. 27 (3), 97. doi:10.1007/s00894-021-04703-6
Harakeh, S., Kalamegam, G., Pushparaj, P. N., Al-Hejin, A., Alfadul, S. M., Al Amri, T., et al. (2020). Chemokines and Their Association with Body Mass Index Among Healthy Saudis. Saudi J. Biol. Sci. 27 (1), 6–11. doi:10.1016/j.sjbs.2019.03.006
Heimfarth, L., Serafini, M. R., Martins-Filho, P. R., Quintans, J. d. S. S., and Quintans-Júnior, L. J. (2020). Drug Repurposing and Cytokine Management in Response to COVID-19: A Review. Int. immunopharmacology 88, 106947. doi:10.1016/j.intimp.2020.106947
Heming, M., Li, X., Räuber, S., Mausberg, A. K., Börsch, A.-L., Hartlehnert, M., et al. (2021). Neurological Manifestations of COVID-19 Feature T Cell Exhaustion and Dedifferentiated Monocytes in Cerebrospinal Fluid. Immunity 54 (1), 164–175.e6. doi:10.1016/j.immuni.2020.12.011
Hillje, R., Pelicci, P. G., and Luzi, L. (2020). Cerebro: Interactive Visualization of scRNA-Seq Data. Bioinformatics (Oxford, England) 36 (7), 2311–2313. doi:10.1093/bioinformatics/btz877
Hoffmann, M., Kleine-Weber, H., Schroeder, S., Krüger, N., Herrler, T., Erichsen, S., et al. (2020). SARS-CoV-2 Cell Entry Depends on ACE2 and TMPRSS2 and Is Blocked by a Clinically Proven Protease Inhibitor. Cell 181, 271–280.e8. doi:10.1016/j.cell.2020.02.052
Huang, C.-T., Chao, T.-L., Kao, H.-C., Pang, Y.-H., Lee, W.-H., Hsieh, C.-H., et al. (2020b). Enhancement of the IFN-β-Induced Host Signature Informs Repurposed Drugs for COVID-19. Heliyon 6 (12), e05646. doi:10.1016/j.heliyon.2020.e05646
Huang, C., Wang, Y., Li, X., Ren, L., Zhao, J., Hu, Y., et al. (2020a). Clinical Features of Patients Infected with 2019 Novel Coronavirus in Wuhan, China. Lancet 395 (10223), 497–506. doi:10.1016/s0140-6736(20)30183-5
Hussein, M. I. H., Albashir, A. A. D., Elawad, O. A. M. A., and Homeida, A. (2020). Malaria and COVID-19: Unmasking Their Ties. Malar. J. 19 (1), 457. doi:10.1186/s12936-020-03541-w
Jafri, M. A., Kalamegam, G., Abbas, M., Al-Kaff, M., Ahmed, F., Bakhashab, S., et al. (2020). Deciphering the Association of Cytokines, Chemokines, and Growth Factors in Chondrogenic Differentiation of Human Bone Marrow Mesenchymal Stem Cells Using an Ex Vivo Osteochondral Culture System. Front. Cel Dev. Biol. 7, 380. doi:10.3389/fcell.2019.00380
Kanehisa, M., Goto, S., Furumichi, M., Tanabe, M., and Hirakawa, M. (2010). KEGG for Representation and Analysis of Molecular Networks Involving Diseases and Drugs. Nucleic Acids Res. 38, D355–D360. doi:10.1093/nar/gkp896
Kanehisa, M., Goto, S., Kawashima, S., and Nakaya, A. (2002). The KEGG Databases at GenomeNet. Nucleic Acids Res. 30, 42–46. doi:10.1093/nar/30.1.42
Kanehisa, M., and Goto, S. (2000). KEGG: Kyoto Encyclopedia of Genes and Genomes. Nucleic Acids Res. 28, 27–30. doi:10.1093/nar/28.1.27
Kanehisa, M., Goto, S., Sato, Y., Furumichi, M., and Tanabe, M. (2012). KEGG for Integration and Interpretation of Large-Scale Molecular Data Sets. Nucleic Acids Res. 40, D109–D114. doi:10.1093/nar/gkr988
Kanehisa, M., Goto, S., Sato, Y., Kawashima, M., Furumichi, M., and Tanabe, M. (2014). Data, Information, Knowledge and Principle: Back to Metabolism in KEGG. Nucl. Acids Res. 42, D199–D205. doi:10.1093/nar/gkt1076
Kasela, S., Ortega, V. E., Ortega, V. E., Martorella, M., Garudadri, S., Nguyen, J., et al. (2021). Genetic and Non-genetic Factors Affecting the Expression of COVID-19-Relevant Genes in the Large Airway Epithelium. Genome Med. 13 (1), 66. doi:10.1186/s13073-021-00866-2
Kasperkiewicz, M. (2021). Covid-19, Heat Shock Proteins, and Autoimmune Bullous Diseases: A Potential Link Deserving Further Attention. Cell Stress and Chaperones 26 (1), 1–2. doi:10.1007/s12192-020-01180-3
Khatri, P., Draghici, S., Tarca, A. D., Hassan, S. S., and Romero, R. (2007). A System Biology Approach for the Steady-State Analysis of Gene Signaling Networks. Lecture Notes Comput. Sci. (Lncs) 4756, 32–41. doi:10.1007/978-3-540-76725-1_4
Kumar, V., Dhanjal, J. K., Bhargava, P., Kaul, A., Wang, J., Zhang, H., et al. (2020). Withanone and Withaferin-A Are Predicted to Interact with Transmembrane Protease Serine 2 (TMPRSS2) and Block Entry of SARS-CoV-2 into Cells. J. Biomol. Struct. Dyn. 1–13, 1–13. doi:10.1080/07391102.2020.1775704
Lamontagne, F., Agoritsas, T., Siemieniuk, R., Rochwerg, B., Bartoszko, J., Askie, L., et al. (2021). A Living WHO Guideline on Drugs to Prevent Covid-19. Bmj 372, n526. doi:10.1136/bmj.n526
Lan, J., Ge, J., Yu, J., Shan, S., Zhou, H., Fan, S., et al. (2020). Structure of the SARS-CoV-2 Spike Receptor-Binding Domain Bound to the ACE2 Receptor. Nature 581 (7807), 215–220. doi:10.1038/s41586-020-2180-5
Liao, M., Liu, Y., Yuan, J., Wen, Y., Xu, G., Zhao, J., et al. (2020). Single-cell Landscape of Bronchoalveolar Immune Cells in Patients with COVID-19. Nat. Med. 26, 842–844. doi:10.1038/s41591-020-0901-9
Liu, C.-H., and Di, Y. P. (2020). Analysis of RNA Sequencing Data Using CLC Genomics Workbench. Methods Mol. Biol. (Clifton, N.J.) 2102, 61–113. doi:10.1007/978-1-0716-0223-2_4
Liu, J., Zheng, X., Tong, Q., Li, W., Wang, B., Sutter, K., et al. (2020b). Overlapping and Discrete Aspects of the Pathology and Pathogenesis of the Emerging Human Pathogenic Coronaviruses SARS‐CoV, MERS‐CoV, and 2019‐nCoV. J. Med. Virol. 92, 491–494. doi:10.1002/jmv.25709
Liu, T., Jia, P., Fang, B., and Zhao, Z. (2020a). Differential Expression of Viral Transcripts from Single-Cell RNA Sequencing of Moderate and Severe COVID-19 Patients and its Implications for Case Severity. Front. Microbiol. 11, 603509. doi:10.3389/fmicb.2020.603509
Mamkulathil Devasia, R., Altaf, M., Fahad Alrefaei, A., and Manoharadas, S. (2021). Enhanced Production of Camptothecin by Immobilized Callus of Ophiorrhiza mungos and a Bioinformatic Insight into its Potential Antiviral Effect against SARS-CoV-2. J. King Saud Univ. - Sci. 33 (2), 101344. doi:10.1016/j.jksus.2021.101344
Mandolesi, M., Sheward, D. J., Hanke, L., Ma, J., Pushparaj, P., Perez Vidakovics, L., et al. (2021). SARS-CoV-2 Protein Subunit Vaccination of Mice and Rhesus Macaques Elicits Potent and Durable Neutralizing Antibody Responses. Cel Rep. Med. 2 (4), 100252. doi:10.1016/j.xcrm.2021.100252
Novel Coronavirus Pneumonia Emergency Response Epidemiology Team (2020). [The Epidemiological Characteristics of an Outbreak of 2019 Novel Coronavirus Diseases (COVID-19) in China]. Zhonghua Liu Xing Bing Xue Za Zhi 41, 145–151. doi:10.3760/cma.j.issn.0254-6450.2020.02.003
Pushparaj, P. N. (2019). Multiple Analyte Profiling (xMAP) Technology Coupled with Functional Bioinformatics Strategies: Potential Applications in Protein Biomarker Profiling in Autoimmune Inflammatory Diseases. Essentials of Bioinformatics Vol. II, 151–165. doi:10.1007/978-3-030-18375-2_9
Pushparaj, P. N. (2020). Translational Interest of Immune Profiling. Precision Med. Investigators, Pract. Providers 1, 105–122. doi:10.1016/b978-0-12-819178-1.00011-3
Ritchie, M. E., Phipson, B., Wu, D., Hu, Y., Law, C. W., Shi, W., et al. (2015). Limma powers Differential Expression Analyses for RNA-Sequencing and Microarray Studies. Nucleic Acids Res. 43, e47. doi:10.1093/nar/gkv007
Shang, J., Wan, Y., Luo, C., Ye, G., Geng, Q., Auerbach, A., et al. (2020). Cell Entry Mechanisms of SARS-CoV-2. Proc. Natl. Acad. Sci. USA 117 (21), 11727–11734. doi:10.1073/pnas.2003138117
Singh, N., Yadav, S. S., Rao, A. S., Nandal, A., Kumar, S., Ganaie, S. A., et al. (2021). Review on Anticancerous Therapeutic Potential of Withania Somnifera (L.) Dunal. J. ethnopharmacology 270, 113704. doi:10.1016/j.jep.2020.113704
Sood, A., Mehrotra, A., Dhawan, D. K., and Sandhir, R. (2018). Indian Ginseng (Withania Somnifera) Supplementation Ameliorates Oxidative Stress and Mitochondrial Dysfunctions in Experimental Model of Stroke. Metab. Brain Dis. 33 (4), 1261–1274. doi:10.1007/s11011-018-0234-2
Srivastava, A., Siddiqui, S., Ahmad, R., Mehrotra, S., Ahmad, B., and Srivastava, A. N. (2020). Exploring Nature’s Bounty: Identification of Withania Somnifera as a Promising Source of Therapeutic Agents against COVID-19 by Virtual Screening and In Silico Evaluation. J. Biomol. Struct. Dyn., 1–51. [Advance online publication]. doi:10.1080/07391102.2020.1835725
Subramanian, A., Tamayo, P., Mootha, V. K., Mukherjee, S., Ebert, B. L., Gillette, M. A., et al. (2005). Gene Set Enrichment Analysis: A Knowledge-Based Approach for Interpreting Genome-wide Expression Profiles. Proc. Natl. Acad. Sci. 102 (43), 15545–15550. doi:10.1073/pnas.0506580102
Surnar, B., Kamran, M. Z., Shah, A. S., and Dhar, S. (2020). Clinically Approved Antiviral Drug in an Orally Administrable Nanoparticle for COVID-19. ACS Pharmacol. Transl. Sci. 3 (6), 1371–1380. doi:10.1021/acsptsci.0c00179
Szklarczyk, D., Morris, J. H., Cook, H., Kuhn, M., Wyder, S., Simonovic, M., et al. (2017). The STRING Database in 2017: Quality-Controlled Protein-Protein Association Networks, Made Broadly Accessible. Nucleic Acids Res. 45 (D1), D362–D368. doi:10.1093/nar/gkw937
Takahashi, Y., Hayakawa, A., Sano, R., Fukuda, H., Harada, M., Kubo, R., et al. (2021). Histone Deacetylase Inhibitors Suppress ACE2 and ABO Simultaneously, Suggesting a Preventive Potential against COVID-19. Sci. Rep. 11 (1), 3379. doi:10.1038/s41598-021-82970-2
Tarca, A. L., Draghici, S., Khatri, P., Hassan, S. S., Mittal, P., Kim, J.-s., et al. (2009). A Novel Signaling Pathway Impact Analysis. Bioinformatics 25 (1), 75–82. doi:10.1093/bioinformatics/btn577
Torre, D., Lachmann, A., and Ma’ayan, A. (2018). BioJupies: Automated Generation of Interactive Notebooks for RNA-Seq Data Analysis in the Cloud. Cel Syst. 7 (5), 556–561.e3. doi:10.1016/j.cels.2018.10.007
Vaninov, N. (2020). In the Eye of the COVID-19 Cytokine Storm. Nat. Rev. Immunol. 20, 277. doi:10.1038/s41577-020-0305-6
Wang, Z., Lachmann, A., Keenan, A. B., and Ma’ayan, A. (2018). L1000FWD: Fireworks Visualization of Drug-Induced Transcriptomic Signatures. Bioinformatics, 34, 2150, 2152. doi:10.1093/bioinformatics/bty060
Wyler, E., Mösbauer, K., Franke, V., Diag, A., Gottula, L. T., Arsiè, R., et al. (2021). Transcriptomic Profiling of SARS-CoV-2 Infected Human Cell Lines Identifies HSP90 as Target for COVID-19 Therapy. iScience 24 (3), 102151. doi:10.1016/j.isci.2021.102151
Zhou, P., Yang, X.-L., Wang, X.-G., Hu, B., Zhang, L., Zhang, W., et al. (2020). A Pneumonia Outbreak Associated with a New Coronavirus of Probable Bat Origin. Nature 579, 270–273. doi:10.1038/s41586-020-2012-7
Zhou, Y., Zhou, B., Pache, L., Chang, M., Khodabakhshi, A. H., Tanaseichuk, O., et al. (2019). Metascape Provides a Biologist-Oriented Resource for the Analysis of Systems-Level Datasets. Nat. Commun. 10 (1), 1523. doi:10.1038/s41467-019-09234-6
Ziegler, C. G. K., Allon, S. J., Nyquist, S. K., Mbano, I. M., Miao, V. N., Tzouanas, C. N., et al. (2020). SARS-CoV-2 Receptor ACE2 Is an Interferon-Stimulated Gene in Human Airway Epithelial Cells and Is Detected in Specific Cell Subsets across Tissues. Cell 181, 1016–1035.e19. doi:10.1016/j.cell.2020.04.035
Keywords: SARS-CoV-2, COVID-19, Neuro-COVID, bronchial epithelium, cerebrospinal fluid, RNA sequencing, next-generation knowledge discovery platforms, therapeutics
Citation: Pushparaj PN, Abdulkareem AA and Naseer MI (2021) Identification of Novel Gene Signatures using Next-Generation Sequencing Data from COVID-19 Infection Models: Focus on Neuro-COVID and Potential Therapeutics. Front. Pharmacol. 12:688227. doi: 10.3389/fphar.2021.688227
Received: 30 March 2021; Accepted: 16 July 2021;
Published: 31 August 2021.
Edited by:
Ashok Kumar, University of Florida, United StatesReviewed by:
Mehtab Khan, Université de Moncton, CanadaCopyright © 2021 Pushparaj, Abdulkareem and Naseer. This is an open-access article distributed under the terms of the Creative Commons Attribution License (CC BY). The use, distribution or reproduction in other forums is permitted, provided the original author(s) and the copyright owner(s) are credited and that the original publication in this journal is cited, in accordance with accepted academic practice. No use, distribution or reproduction is permitted which does not comply with these terms.
*Correspondence: Peter Natesan Pushparaj, cGV0ZXIubi5wdXNocGFyYWpAZ21haWwuY29t; Muhammad Imran Naseer, bWltcmFubmFzZWVyQHlhaG9vLmNvbQ==
Disclaimer: All claims expressed in this article are solely those of the authors and do not necessarily represent those of their affiliated organizations, or those of the publisher, the editors and the reviewers. Any product that may be evaluated in this article or claim that may be made by its manufacturer is not guaranteed or endorsed by the publisher.
Research integrity at Frontiers
Learn more about the work of our research integrity team to safeguard the quality of each article we publish.