 Jinbin Yuan1*
 Feiting Wei
94% of researchers rate our articles as excellent or good
Learn more about the work of our research integrity team to safeguard the quality of each article we publish.
Find out more
ORIGINAL RESEARCH article
Front. Pharmacol., 19 June 2020
Sec. Ethnopharmacology
Volume 11 - 2020 | https://doi.org/10.3389/fphar.2020.00933
This article is part of the Research TopicSystems Pharmacology and Traditional Chinese MedicineView all 19 articles
Citrus × aurantium L., Chinese name: Fructus Aurantii (FA) has been largely used as Qi-invigorating herb in China for centuries. The main components (meranzin hydrate, naringin, neohesperidin, meranzin, nobiletin) have good physiological activity with relatively high abundance in FA. Few multi-component comparative pharmacokinetics are simultaneously accessible for the flavone glycosides, polymethoxy flavones, and coumarins in FA. In this work, a reliable and rapid ultra-high performance liquid chromatography-tandem mass spectrometry (UPLC-MS/MS) method was established and validated to determine the five ingredients in the SD rat plasma, and further applied to the pharmacokinetic studies after oral administration of monomer, drugs in compatibility, and FA extract. After hydrolysis with β-glucuronidase and sulfatase, the concentration of naringin and neohesperidin in rat plasma were expressed respectively by the total concentration of naringenin and hesperitin which was determined by UPLC-MS/MS. Double-peak phenomenon was observed for naringin and neohesperidin, which may be due to the enterohepatic circulation or multiple site absorption of the two flavone glycosides. Meranzin hydrate and meranzin (coumarins) were absorbed rapidly (Tmax, about 1.0 h) but eliminated slowly (t1/2z exceeds 6.5 h). Nobiletin, a typical polymethoxy flavone, was also rapidly absorbed according to Tmax and AUC(0-t). DAS 3.1 software suggests the pharmacokinetic profiles of the five components in rats be depicted as a two-compartment pharmacokinetic model. There were significant differences in pharmacokinetic parameters for naringenin and hesperetin between the compatibility, FA extract group vs monomer group: ① remarkable increases in the values of AUC(0–∞), AUC(0–t) and Cmax; ② obvious decrease of CLZ/F; and ③ longer tmax and t1/2z. The results suggest that compatibility can promote mutual absorption and affect the elimination behaviors.
Fructus aurantii (FA), also called Zhiqiao in Chinese, refers to the dried unripe fruit of Citrus × aurantium L. or its cultivar (Rutaceae). FA is a very important Qi-invigorating herb in China for thousands of years, and it vigorously modulates the motion of Qi and fortifies the spleen and stomach (Committee of National Pharmacopoeia of RP China, 2015). Modern pharmacological researches have established that FA possesses astoundingly biomedical properties, such as prokinetic effect (Qiu et al., 2011; Zhou et al., 2018), antidepression activity (Wu et al., 2015), anti-inflammation function (Parhiz et al., 2015), anticarcinogenic activity (Park et al., 2014), antihepatotoxicity (Renugadevi and Prabu, 2010), antihypersensitivity (Kobayashi et al., 2015), and hypoglycemic and hypolipidemic effects (Jia et al., 2015). It is well known that the primary chemical compositions in FA are flavonoids, alkaloids, volatile oils, and coumarins (Li et al., 2016). In which the main bioactive compounds are considered to be naringin, neohesperidin, meranzin hydrate (MH), meranzin, Naringenin, hesperetin nobiletin, tangeretin, and auraptene (Qiu et al., 2011; Yuan et al., 2012; Li et al., 2016; Wang et al., 2018; Zhang et al., 2018; Chen et al., 2019).
The therapeutic effects of a drug and its components are closely related to their pharmacokinetic characteristics. The pharmacokinetics of naringin and/or neohesperidin have been extensively studied in rats (Felgines et al., 2000; Fang et al., 2006; Li et al., 2010; Lee et al., 2017; Zeng et al., 2019), dogs (Mata-Bilbao et al., 2007), rabbits (Hsiu et al., 2002), and human beings (Ishii et al., 1996; Ishii et al., 1997; Bai et al., 2020). Multi-component pharmacokinetics can also be accessible for several flavones in FA (Tong et al., 2012; Wang et al., 2018; Zhang et al., 2018). Very recently, the comparative pharmacokinetics of naringin and neohesperidin between different model rats (Xu et al., 2019) and different herbs (Li et al., 2019) have been reported. As a whole, the above pharmacokinetic evaluation mainly focused on pure monomers (mainly flavones) (Ishii et al., 1996; Ishii et al., 1997; Felgines et al., 2000; Hsiu et al., 2002; Fang et al., 2006; Mata-Bilbao et al., 2007; Li et al., 2010; Lee et al., 2017), the extract of a single herb (Tong et al., 2012; Wang et al., 2018; Zhang et al., 2018), or the study of the pharmacokinetic interaction between two or more herbs (Li et al., 2019; Xu et al., 2019). Few pharmacokinetic data can be accessible for the other compounds, such as MH, meranzin, and nobiletin.
Our previous study indicated that the components (MH, meranzin, and nobiletin) have good physiological activity with relatively high abundance in FA besides naringin and neohesperidin. We also found that the drug quality is closely related to the content proportion of naringin vs neohesperidin in FA, which can partly elucidate the geo-authentic origin of the medicinal plant (Chen et al., 2019). So, it is interesting to investigate the pharmacokinetic differences of naringin and neohesperidin between the different forms (monomer, compatibility, and extract).
Some literatures indicated that naringin and neohesperidin transiently exist in the plasma, and the glucuronides/sulfates of their aglycones (naringenin and hesperetin) were the main circulating metabolites (Felgines et al., 2000; Fang et al., 2006; Xu et al., 2019). Free naringenin and hesperetin can be easily obtained from the naringenin-glucronaide and hesperetin-glucronaide in plasma by hydrolysis with β-glucuronidase and sulfatase. In addition, naringenin and hesperetin are relatively low content in FA. So, the concentration of the absorbed naringin and neohesperidin can be detected in the corresponding aglycone form (naringenin and hesperetin).
Hence, a rapid and sensitive ultra-high performance liquid chromatography-tandem mass spectrometry (UPLC-MS/MS) method was developed and validated for the simultaneous determination of the main components (naringin, neohesperidin, MH, meranzin, and nobiletin) in rat plasma, and used for the pharmacokinetic study of the compounds in different forms: monomer, compatibility, and extract.
Fructus aurantii, the dry immature fruit of Citrus × aurantium L., were provided by Jiangxi Zhihui Chinese Medicinal Materianls Co. Ltd. The coordinates of plant picking is 115.226067 East longitude and 28.030638 North latitude (Wucheng Town, Zhangshu, Jiangxi, China). The crude drugs were identified as Citrus junos Sieb. ex Tanaka by Professor Wuliang Yang from Jiangxi University of Traditional Chinese Medicine (JXUTCM), China. Voucher specimens are preserved in the Herbarium of Pharmacognosy in JXUTCM.
Standards including neohesperidin, naringin, meranzin hydrate, naringenin, hesperetin, meranzin, and nobiletin were purchased from Chengdu Desite Biotech Co., Ltd. (Chengdu, China), and their purities were not lower than 98% according to HPLC analysis. Quercetin (Internal standard, IS) (HPLC ≥ 98%) was purchased from Chengdu Mansite Pharmaceticcal Co., Ltd. (Chengdu, China). β-glucuronidase and sulfate esterase were purchased from Shanghai Yuanye Bio-Technology Co., Ltd. (Shanghai, China), Formic acid was purchased from Shanghai Aladdin Bio-Chem Technology Co. Ltd. (Shanghai, China). Chromatographic reagent Methanol (Merck, Germany) and acetonitrile (Tedia, USA) were used throughout. Deionized Water was purified by Milli-Q purification system (Millipore, MA, USA). All other chemical regents were of analytical grade.
The UPLC-MS/MS system consisting of Shimadzu Ultra-High Performance Liquid Chromatograph LC-30A and Triple Quadrupole Mass Spectrometer (LCMS-8050, SHIMADZU, Japan).
The chromatographic separation was achieved on an Agilent C18 column (2.1x100mm, 1.8μm, Agilent, United States) with temperature at 40°C; The mobile phase was composed of water (containing 0.1% formic acid) (solvent A) and Acetonitrile (solvent B). The gradient elution procedures (0.01–5 min, 30 to 50% B, 5–7min, 50% B, 7–7.5min, 50–30% B, 7.5–10.5min, 30% B); The flow rate was 0.3 ml/min and injection volume was 1.0 μl (Yuan et al., 2017).
The mass spectrometer was operated in negative mode for quercetin (IS), naringenin, and hesperetin, and positive mode for meranzin hydrate, meranzin, nobiletin. Quantification was obtained using multiple reaction monitoring (MRM) mode in the following positive/negative MS/MS scan segments. Segment I: 1.5–2.3min in positive mode, meranzin hydrate; Segment II: 2.2–4.5min in negative mode quercetin (IS), naringenin, and hesperetin; Segment III: 4.4–7.5min in positive mode for meranzin and nobiletin. The optimal MS parameters were as follows: Interface ESI, Nebulizing Gas Flow of 3.0 L/min; Heating Gas Flow of 10 L/min; Interface Temperature of 300°C; DL Temperature of 250°C; Heat Block Temperature of 400°C; Drying Gas Flow of 10 L/min; Nebulizing Gas of 3.0 L/min, Drying Gas F1 of 10.0 L/min, Conversion Dy: 10 kV, Detector Volt: 1.92 kV. MS/MS operating conditions were optimized by infusion of the standard solution (200 ng/ml) of each analyte and I.S. into the ESI source via a syringe pump. The optimal MRM parameters for these compounds are shown in Table 1.
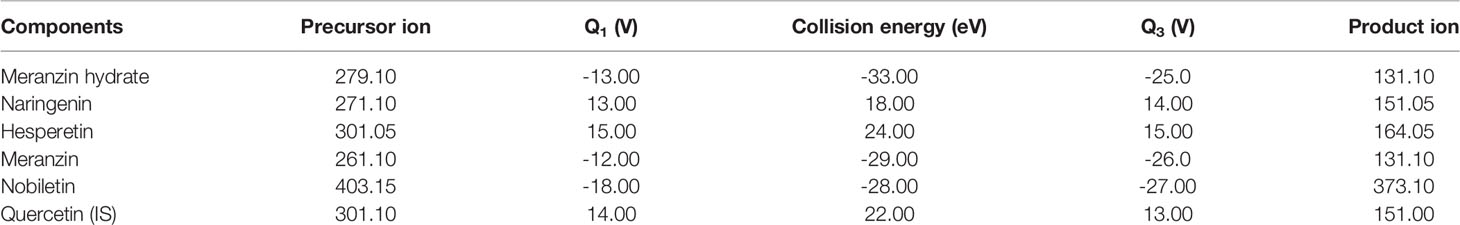
Table 1 MRM detection parameters for the five components and IS.
Male Sprague-Dawley (SD) rats [Certificate No. SCXK(Xiang) 2016-0002] weighing 200 ± 20 g were purchased from Hunan Silaike Laboratory Animal Ltd (Changsha, China). The animals were kept in a controlled breeding room with the following conditions: a temperature of 22 ± 2°C, a relative humidity of (65 ± 5)%, and a 12 h light- dark cycle (Yuan et al., 2017). The Experimental Animal Ethic Committee of JXUTCM approved all animal protocols. The animal experiments were carried out according to the European Community guidelines for the use of experimental animals.
The dried drug was extracted twice by refluxing with boiling Methanol (1:10, w/v) for 2 h, then the two filtrates were merged and evaporated to dryness under vacuum (Tong et al., 2012). The extract (14.56 g) was weighed and the extract yield was 29.14%. The obtained extract was stored at 4 °C until use. To count the dosage, the contents of the main compounds in the FA extract were quantitatively measured by HPLC (Zhang et al., 2018; Chen et al., 2019), and the contents of naringin, neohesperidin, meranzin hydrate, meranzin and nobiletin in the extract were 171.6, 167.5, 1.98, 0.94, and 1.70 mg/g raw herb, respectively (see supplementary material: Figure S1).
The stock solutions of the mixed standards were prepared in methanol with the concentrations of meranzin hydrate (194 µg/ml), naringenin (491 µg/ml), hesperetin (494 µg/ml), meranzin (209 µg/ml), nobiletin (528 µg/ml), and quercetin (IS) (303 µg/ml). All solutions were stored at 4 °C. The concentrations of each analyte in standard mixture solutions were as follows: 19.4 µg/ml for meranzin hydrate, 14.73 µg/ml for naringenin, 12.35 µg/ml for hesperetin, 4.18 µg/ml for meranzin, and 2.112 µg/ml for nobiletin. Then, the standard mixture solution was diluted to a series of concentration (1/2, 1/5, 1/10, 1/20, 1/50, 1/100, 1/250, 1/500, 1/1,000, and 1/2,000) as calibration curves. QC samples were prepared at three concentration levels containing meranzin hydrate (19.4, 388, and 19,400 ng/ml), naringenin (14.73, 294.6, and 14,730 ng/ml), hesperetin (12.35, 247, and 12,350 ng/ml), meranzin (4.18, 83.6, and 4,180 ng/ml), and nobiletin (2.112, 42.2, and 2,112 ng/ml). These samples were stored at −80°C until analysis.
The 20 μl of β-glucuronidase and 15 μl of sulfatase were added into 50 μl of plasma sample. After vortexed for 30 s, the mixture was incubated at 37°C for 2 h in a water bath, then placed in ice water for 5 min to terminate the reaction (Xu et al., 2019). IS solution (20 µl, 5 μg/ml) and acetonitrile (1.0 ml) were added into the mixture and vortexed for 2 min. The mixture was centrifuged at 4,000 rpm at 4°C for 10 min, and the supernatant (850 µl) was transferred into a new eppendorf tube and evaporated to dryness. The residue was redissolved in 100 μl of 50% methanol, and vortexed for 3 min, then centrifuged at 14,000 rpm at 4°C for 10 min, finally the supernatant was used for UPLC-MS/MS analysis.
This method was validated according to the current US FDA Bioanalytical Method Validation Guidance (Guidance for Industry: Bioanalytical Method Validation, 2001). The following parameters were determined: selectivity, linearity, LLOQ, LOD, precision, accuracy, extraction recovery, matrix effect, and stability.
To assess the linearity ranges, a series of the mixed standard solutions (six concentration levels) were prepared in triplicate. Each calibration curve (y = ax + b) was established by plotting the peak area ratio of analyte to IS (y) against the concentrations (x) of the calibration solution with a least square linear regression. The limit of detection (LOD) and limit of quantification (LOQ) were determined when the peak height was three times and ten times the background noise, respectively (Yuan et al., 2017).
Blank plasma samples or the samples spiked with the IS were detected for endogenous or IS interference (Zhang et al., 2018). Specificity and selectivity were investigated by comparing the chromatograms of five individual batches of blank plasma samples, the samples spiked with the 5 analytes and IS, and plasma samples at 0.75 h after oral administration of FA extracts.
The intra- and inter-day precisions and accuracies were calculated by an analysis of variance based on the replicate analysis of QC samples, and the work was accompanied by a standard calibration curve on each analytical run (Yuan et al., 2017). Five samples were measured for each concentration level on the optimal conditions five times within the same day for intra-day variance, and the three different days for inter-day variance. The analytic precision was denoted as the RSD (relative standard deviation), and the accuracy was considered the RE (relative error) of the measured average deviated from the nominal value. The precision and accuracy values (RSD%) were required to be within ±20% for LLOQ (lower limit of quantification) and within ±15% for other concentrations.
The extraction recoveries of the compounds were assessed by comparing the mean peak areas from five plasma samples in the pre-extraction spiked with the analytes and the post-extraction at three QC levels. The matrix effects were evaluated by comparing the peak areas obtained from the spiked plasma matrix with the pure standard solutions at the same concentrations. There was no matrix effect if the ratio was between 85–115%.
The QC samples were assayed under several different conditions to evaluate the stability of the compounds in rat plasma. For the short-term stability, fresh plasma samples were kept at room temperature for 24 h before the sample preparation. After keeping the samples at room temperature for 24 h, post-preparation stability was tested. Freeze-thaw cycles (-20 °C/room temperature) stability were not treated at -20°C for freezing-room temperature melting three times (repeated freezing and thawing three times). In each freeze-thaw cycle, the samples were frozen and stored at -20 °C for 24 h, and subsequently thawed at room. To evaluate the long-term stability of QC plasma samples, following storage at -20 °C for one month. The stability data were acceptable when the bias was within ±15% of the actual value (Yuan et al., 2017).
Rats were randomly divided into the following four groups (6 rats in each group): naringin (NA), neohesperidin (NHE), naringin-neohesperidin (NA-NHE), and FA extract group. The oral administration doses were selected according to the literatures (Tong et al., 2012; Yang et al., 2012; Committee of National Pharmacopoeia of RP China, 2015; Wang et al., 2018; Zhang et al., 2018; Chen et al., 2019), the contents of the five components in FA, and the preliminary experiments. The specific doses were as follows: FA extract (10.8 g/kg of the original medicinal material), 10 ml/kg; naringin and neohesperidin, 1.85 g/kg and 1.81 g/kg, respectively. The drug was suspended in 0.5% CMC-Na.
Blood samples (about 0.5 ml) were collected from the ocular vein using dried heparinized tubes from each six rats at 0, 0.083, 0.167, 0.25, 0.5, 0.75, 1, 1.5, 2.0, 4.0, 6.0, 8.0, 10.0, 12.0, 14.0, 24.0, and 30.0 h after dosing. The rats were intragastric administrated with 1.5 ml of water at the time points of 0.25, 0.5, 2, 4, and 6 h, respectively. The rats had free access to water during the experiment. The blood samples were then immediately centrifuged at 4,000 rpm for 10 min. The plasma was frozen and stored at −80°C until analysis.
The plasma concentration of the studied compounds was determined according to the daily calibration curve. The pharmacokinetic parameters, including Cmax (the peak drug plasma concentration), Tmax (the time to Cmax), AUC(0-t) (the area under the plasma concentration-time curve from 0 to the last time point), AUC(0−∞) (the area under the plasma concentration-time curve from 0 to time infinity), MRT(0–t) (average residence time from 0 to the last time point), and t1/2z (the elimination half-life) were fitted with the proprietary DAS 3.1 pharmacokinetic program (Chinese Pharmacological Society).
All statistical analyses were performed using the SPSS 21.0 software package from SPSS, Inc. (Chicago, IL, USA). *P values < 0.05, or **P values < 0.01 was considered statistically significant difference.
According to the direct full-scan ESI mass spectra, the ion intensities of naringenin, hesperetin, and quercetin (IS) was higher in negative mode, and the other three compounds (meranzin hydrate, meranzin, and nobiletin) got greater sensitivity in positive mode. So, the switch scan method (ESI +/-) was used for the corresponding compounds, and the product ion mass spectra of the six compounds are shown in Figure 1.
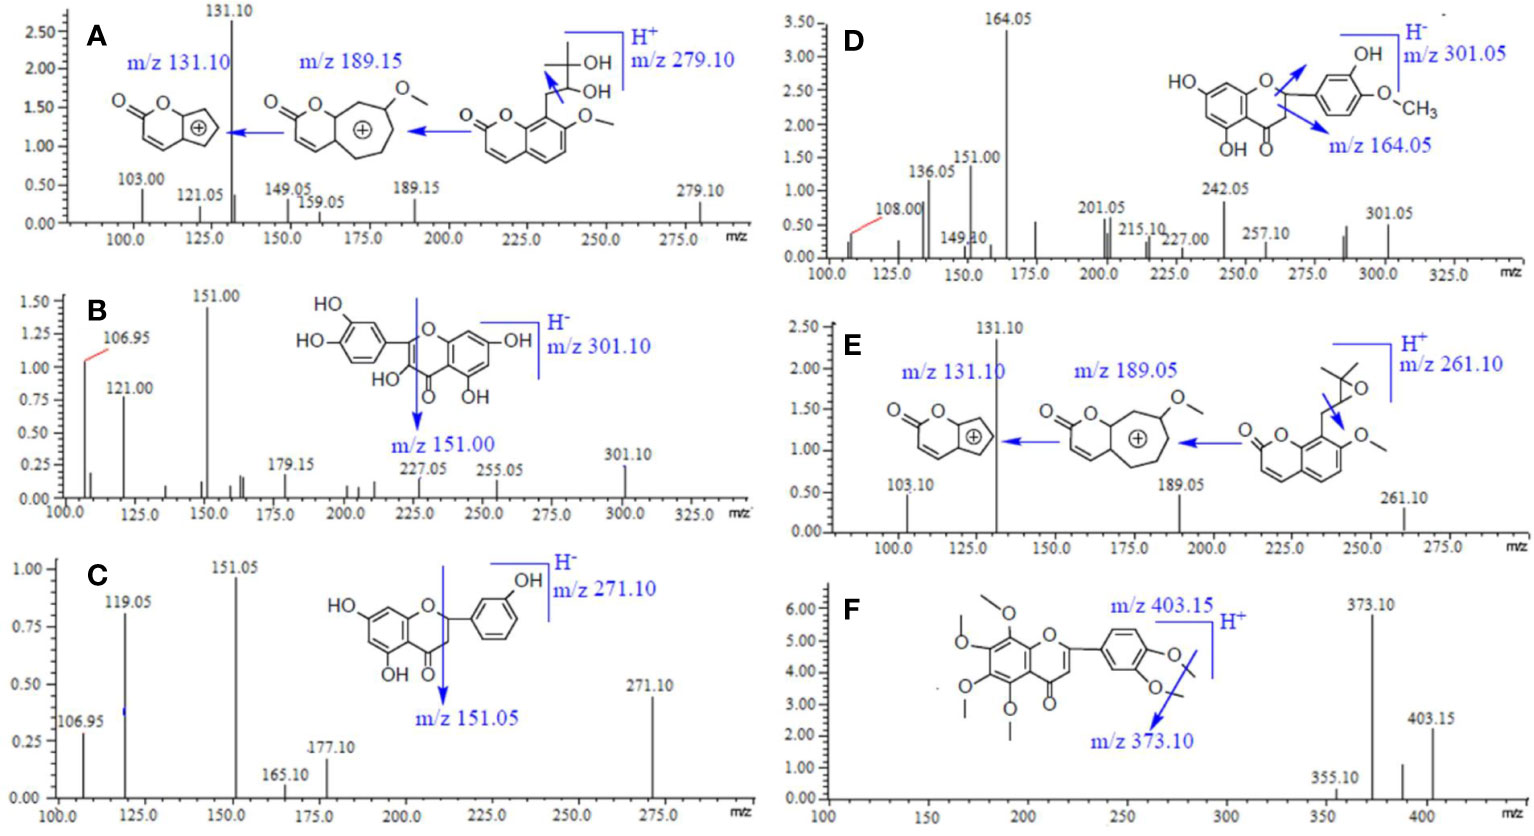
Figure 1 Chemical structures and product ion mass spectra of Meranzin hydrate (A), Quercetin (IS) (B), Naringenin (C), Hesperidin (D), Meranzin (E), and Nobiletin (F).
Based on previous work, chromatographic conditions such as the constituents and the gradient profiles of the mobile phase were further improved to adapt the separation and detection of six components in rat plasma. In addition, the optimum mobile phase was water (containing 0.1% formic acid) and acetonitrile.
Various sample preparation methods including protein precipitation with methanol and acetonitrile were investigated to obtain an efficient cleanup of the biological samples. In this work, acetonitrile was chosen as the protein precipitation agent with simplicity and efficiency.
Typical chromatograms of blank, spiked plasma and plasma samples are shown in Figure 2. No interference was found between endogenous compounds or xenobiotics. The developed method results in six single sharp peaks at the retention time of meranzin hydrate, quercetin (IS), naringenin, hesperetin, meranzin, and nobiletin were 2.03, 2.46, 3.29, 3.63, 5.09, and 5.84 min, respectively.
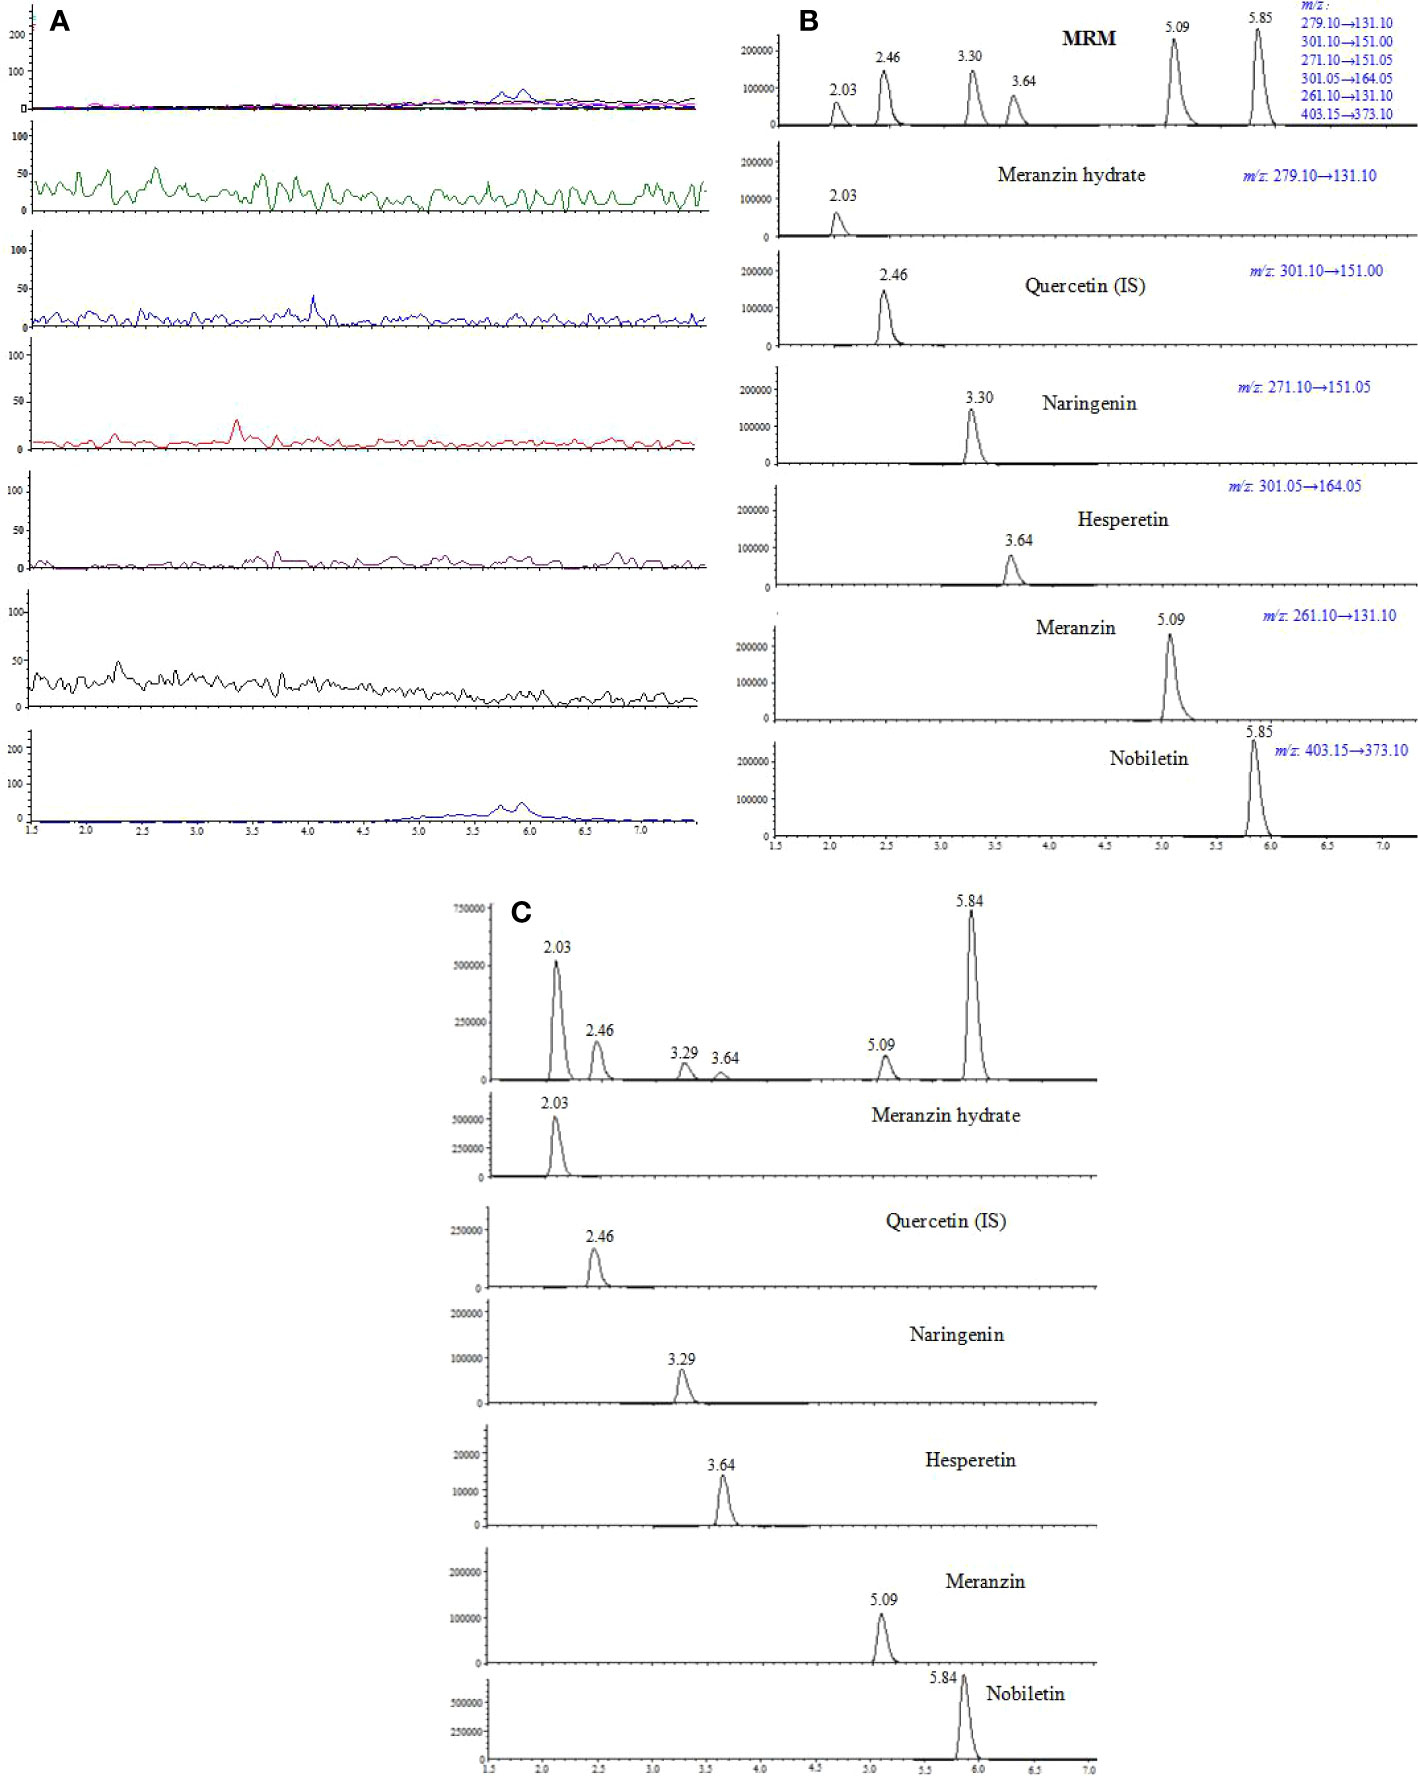
Figure 2 Representative multiple reaction monitoring (MRM) chromatograms of meranzin hydrate, naringenin, hesperetin, meranzin, nobiletin, and quercetin (IS) in rat plasma: (A) blank plasma, (B) blank plasma spiked with the 5 analytes and quercetin (IS), and (C) plasma sample collected at 0.75 h after oral administration of FA extract (10.8 g/kg) to rats.
The linearity parameters of the five components in rat plasma using weighed (1/x2) least-squares linear regression analysis are summarized in Table 2. Within the investigated linear range, good linearity data was obtained with correlation coefficients >0.9941. The results indicate the proposed UPLC-MS/MS method has a wide linear range and high sensitivity.
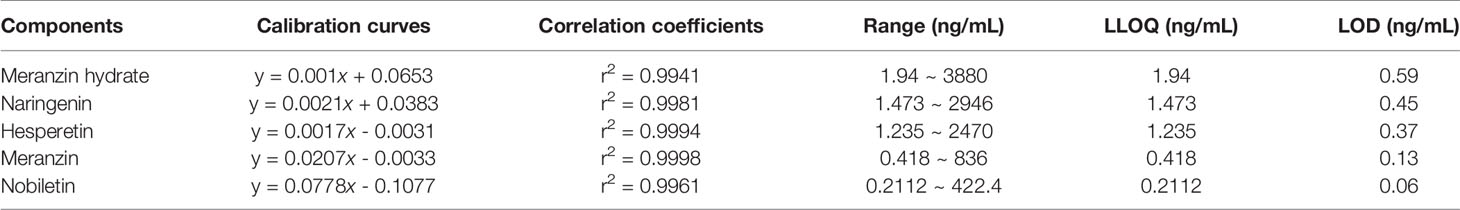
Table 2 Linear parameters of the compounds in rat plasma.
The precision and accuracy results are shown in Table 3, intra-day precision was less than 7.9%, intra-day accuracy was between -8.66 to 9.68%, and inter-day precision was less than 10% for the five compounds. Inter-day accuracies were in the range of -9.34–9.94% expressed by relative errors (RE%). The relative standard deviation and relative error values did not exceed ± 15% (Table 3), this indicate the accuracy and precision are acceptable.
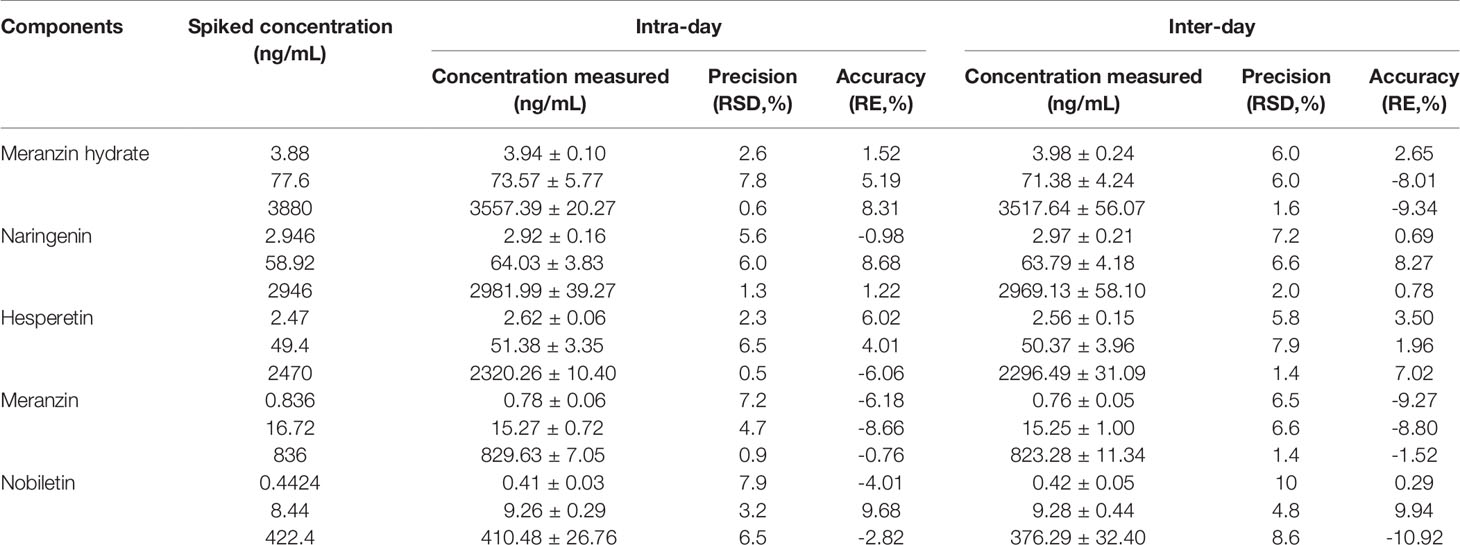
Table 3 Intra-day and inter-day precisions and accuracies of the analytes from QC samples prepared in rat plasma (n=6).
The extraction recovery and matrix effect were summarized in Table 4. The recoveries were between 82.33 to 89.92%, and the matrix effects of the five compounds were in the range of 94.36–101.65%. These data indicate that the UPLC-MS/MS method provides suitable, reproducible, and reliable data and can be used as an analytical tool in rat plasma.
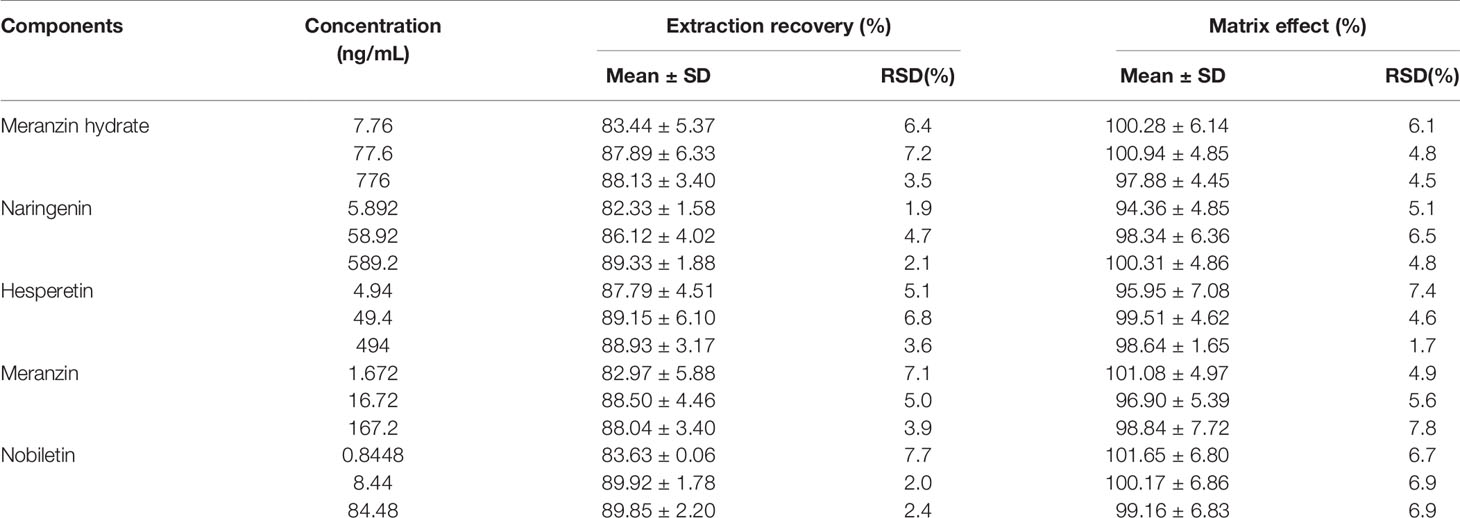
Table 4 Extraction recovery and matrix effects of the analytes in rat plasma (n = 6).
The stability data under different experimental conditions are summarized in Table 5. The results showed all RSD% were less than 8.8% and RE% were in the range from -13.50 to 14.81%, which suggested that rat plasma samples containing 5 analytes were stable under routine laboratory conditions and no additional procedures were necessary to stabilize the sample for pharmacokinetic studies.
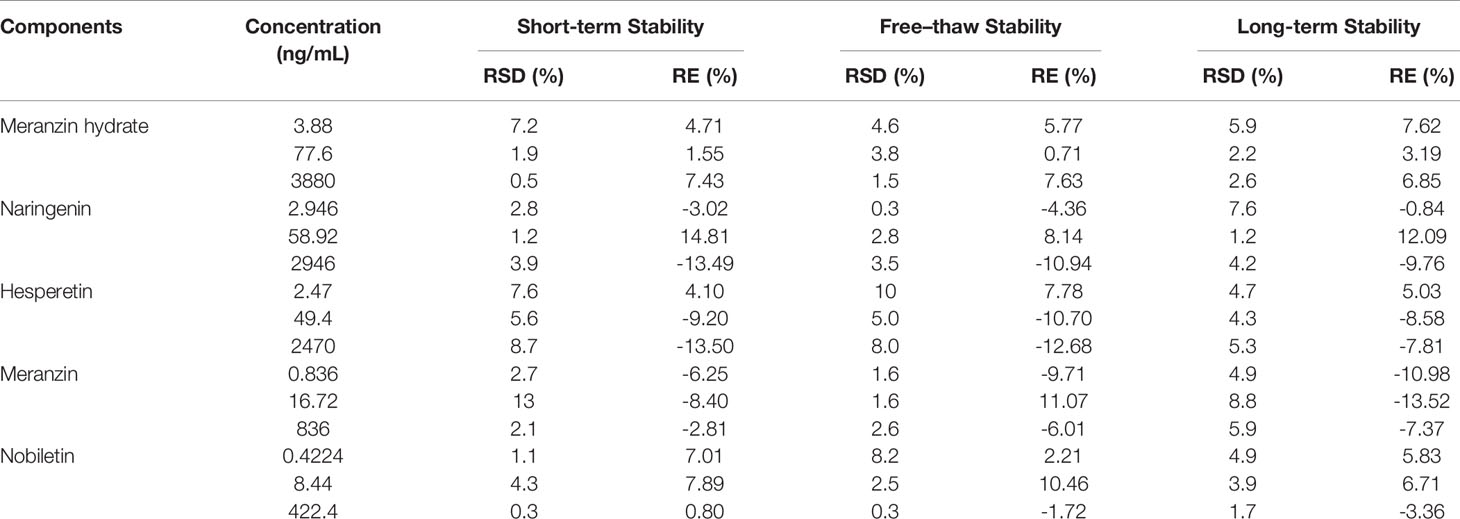
Table 5 Stability of the 5 analytes in rat plasma (n = 6).
The proposed UPLC-MS/MS method was applied to a multi-component pharmacokinetic study of meranzin hydrate, naringenin, hesperetin, meranzin, and nobiletin in SD rats after oral administration of the extract, NA, NHE, and NA-NHE. The plasma concentration-time profiles of the five components were shown in Figure 3, and the corresponding pharmacokinetic parameters were shown in Tables 6 and 7. The physiological disposition conformed to a two-compartment model of the 5 analytes in rats fitted by the DAS 3.1 software. The results suggested that there were significant differences in pharmacokinetic parameters of naringenin and hesperetin between different drug forms, including AUC(0–t), AUC(0–∞), Cmax, tmax, t1/2z, and CLZ/F. The main differences including remarkable increases in the values of AUC(0–∞), AUC(0–t) and Cmax, obvious decrease of CLZ/F, and longer tmax and t1/2z. The comparisons of Cmax and AUC(0–t) of different groups were shown in Figure 4.
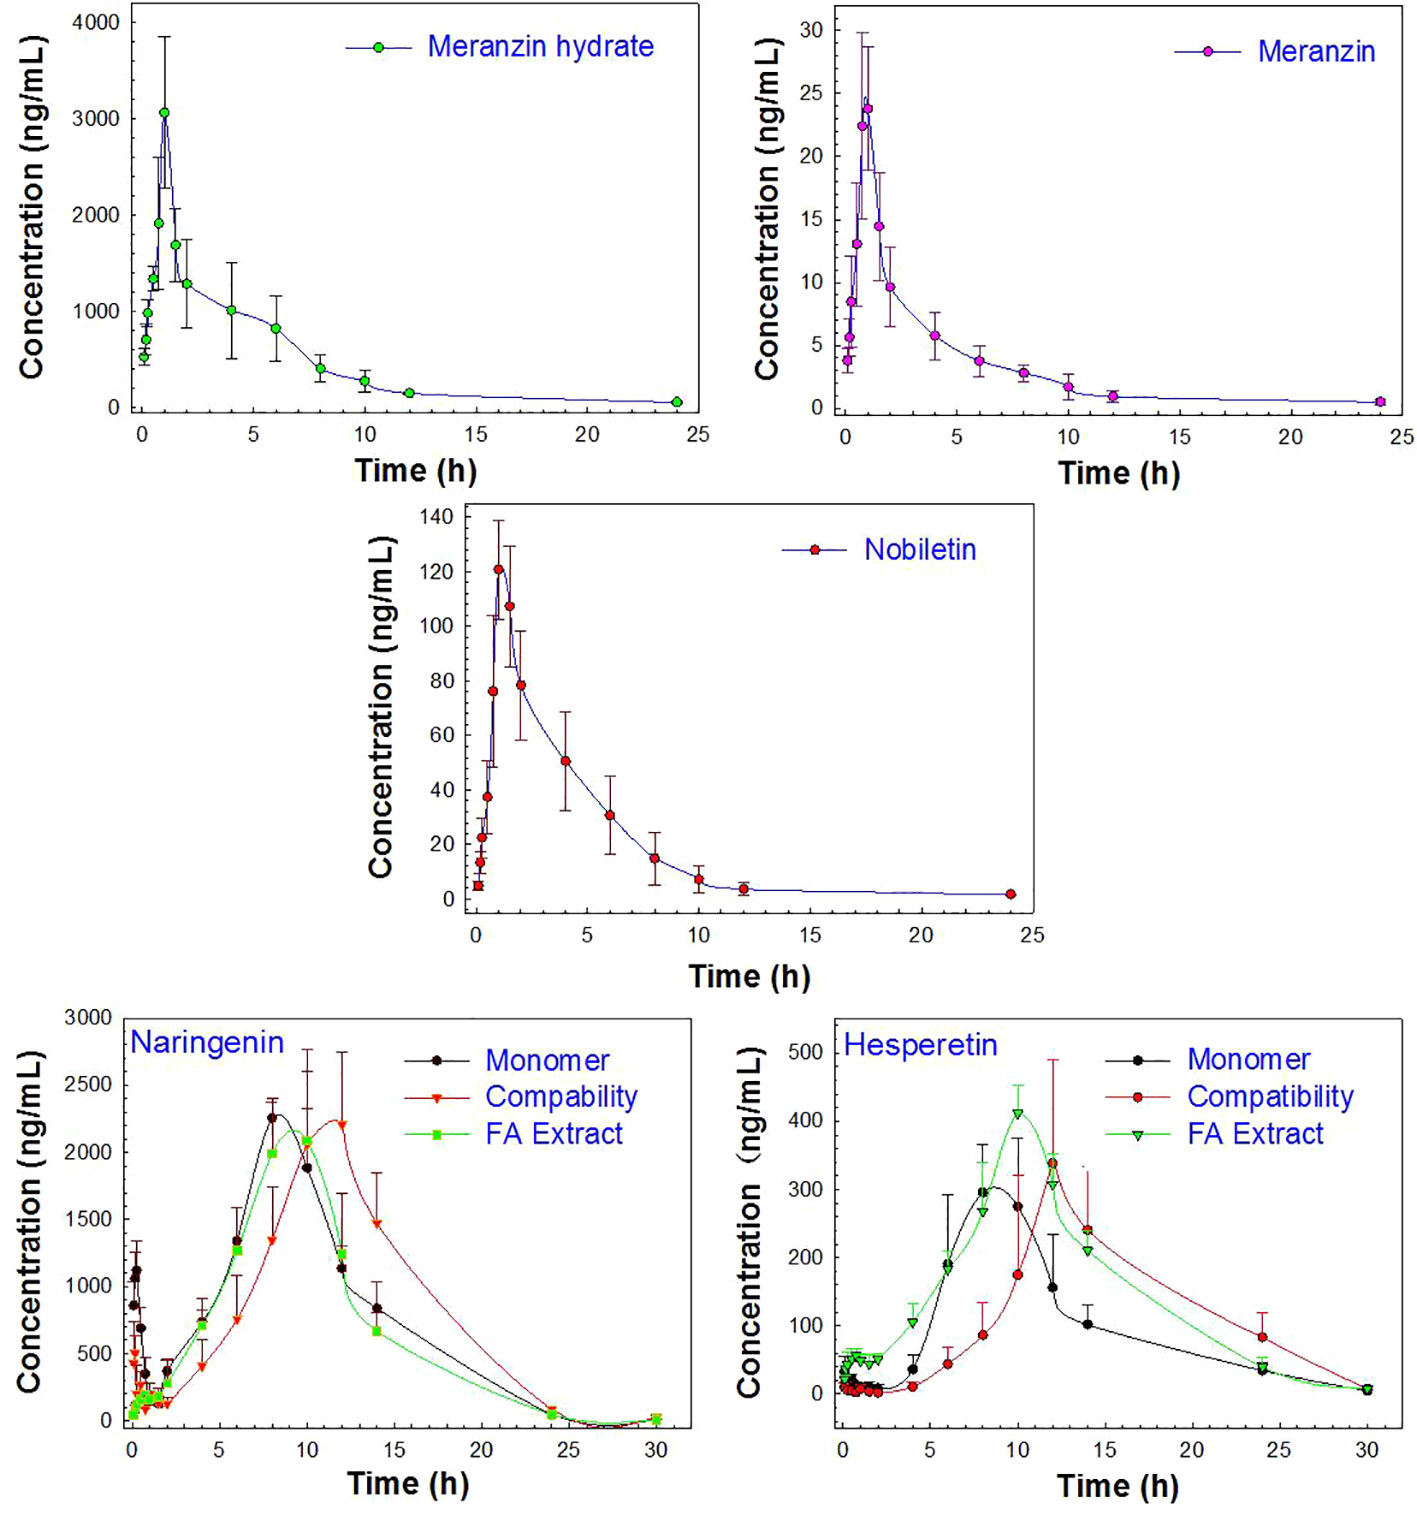
Figure 3 The profiles of the mean plasma concentration over time after oral administration of the monomer (NA or NHE), the compatibility (NA-NHE), and FA extract (FA) form (mean ± SD, n = 6).
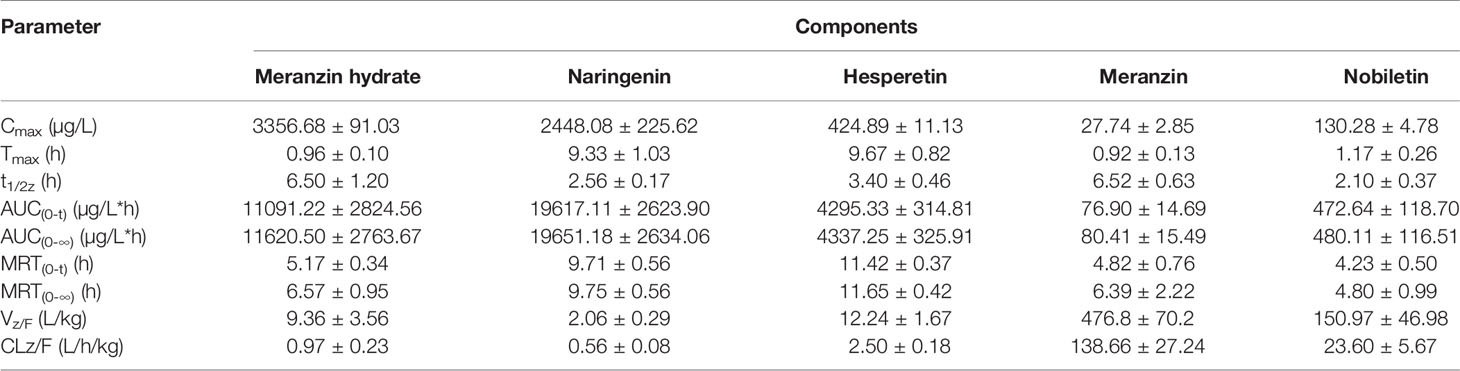
Table 6 Pharmacokinetic parameters of the 5 compounds in male SD rats after oral administration of FA extract (mean ± SD, n = 6).
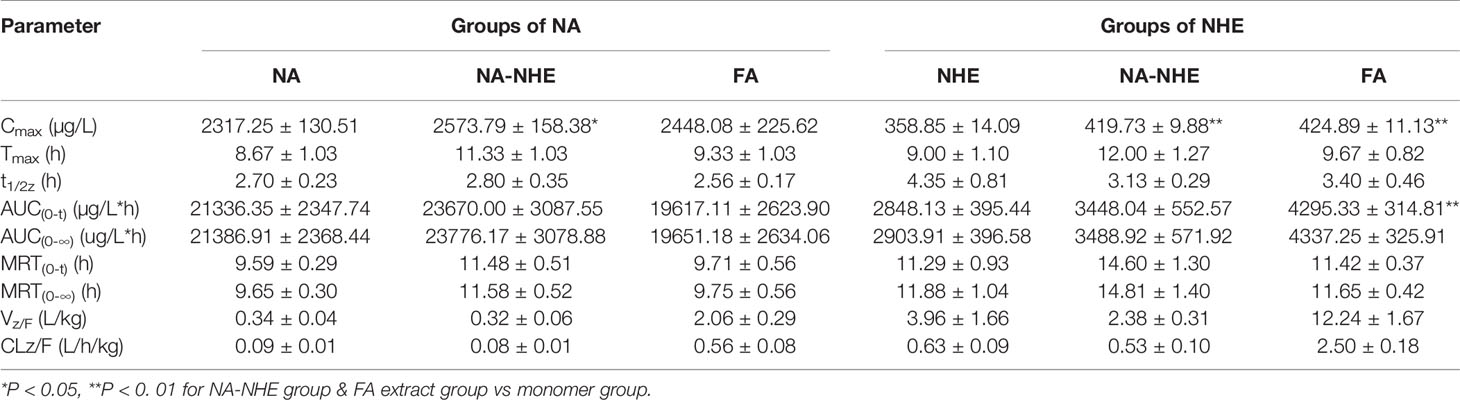
Table 7 Pharmacokinetic parameters of naringin (NA) and neohesperidin (NHE) after oral administration of monomer, the compatibility of NA-NHE, and FA extract form (mean ± SD, n = 6).
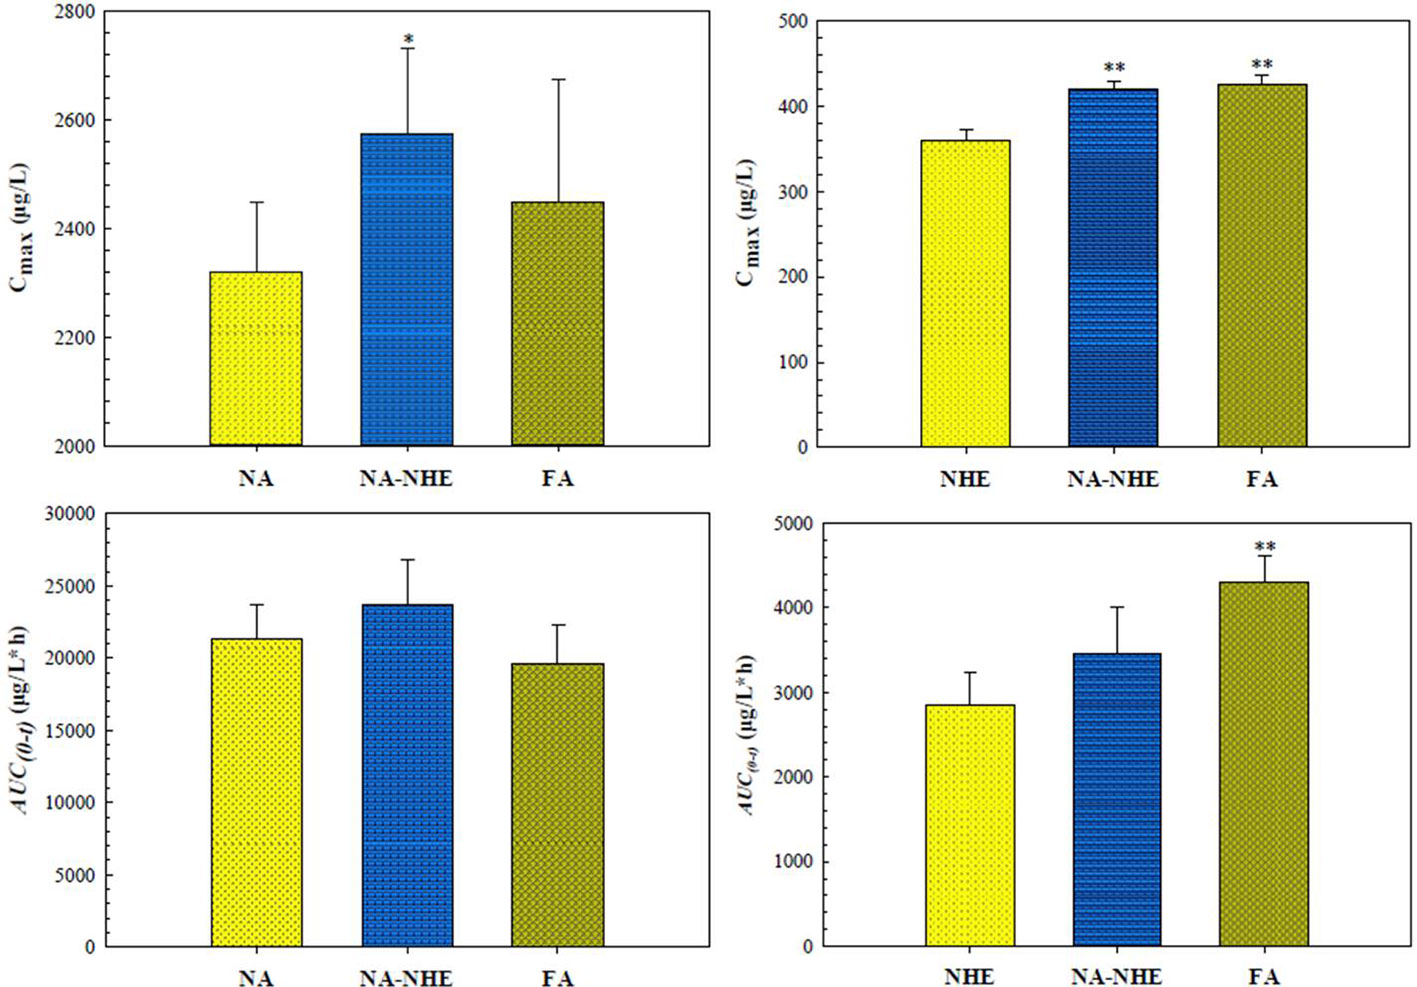
Figure 4 Comparison of Cmax and AUC(0-t) of naringin (NA) and neohesperidin (NHE) after oral administration of monomer (NA or NHE), the compatibility (NA-NHE), and FA extract (FA) form. (mean ± SD, n = 6). *P < 0.05, **P < 0. 01 for NA-NHE group & FA extract group vs monomer group.
UPLC-MS/MS is a powerful analytical tool for the trace compounds in biosamples with high selectivity and sensitivity (Yuan et al., 2017). Various influencing factors were investigated carefully including separation and detection conditions in this work, and the optimal analytical parameters were obtained for the studied analytes. In addition, the mass spectrometer can be switched freely between ESI (Electro-spray Ionization) +/- detection modes in a single injection, and it ensures that each analyte can get the best response. Therefore, the developed method achieved higher sensitivity than the literatures did with lower LODs (see Table 2).
A study (Wang et al., 2018) has reported that flavone glycosides (naringin, hesperidin, and neohesperidin) could not been detected in the rat plasma even after orally administering 30 g/kg FA decoction, which might be associated with the hydrolysis caused by microbial bacterial from the gastrointestinal tract (Hsiu et al., 2002). Naringin can be quickly absorbed, and metabolized into its aglycone and naringenin glucuronide. Hesperidin was also quickly transferred to hesperetin due to the similar structure (Hu et al., 2015; Wang et al., 2018). In general, naringin and hesperidin are hydrolyzed in the gastrointestinal tract by the enzymes of intestinal bacteria followed by absorption and conjugation of their aglycones, and the main present forms are naringenin and hesperitin glucuronide/sulfatase conjugations and a small amount of the free aglycones in plasma (Xu et al., 2019). Therefore, the concentration of naringin and neohesperidin in mouse plasma were expressed respectively by the total (free + conjugated) concentration of naringenin and hesperitin which was determined by UPLC-MS/MS after hydrolysis with β-glucuronidase and sulfatase in this work.
As shown in Figure 3, the change trend in concentration-time profiles of naringenin and hesperetin are basically consistent with previous reports (Xu et al., 2010; Tong et al., 2012; Xu et al., 2019): both had double peaks. The double-peak phenomenon may be due to the enterohepatic circulation and drug reabsorption of naringin and neohesperidin in rats, which was also reported for other flavonoid glycosides from the extract of TCM (Ma et al., 2006; Lu et al., 2007; Zhang et al., 2012; Okada et al., 2017). In addition, these components can be detected in rat plasma within 5 min after dosing with a short Tmax (less than 1 h), and which indicates that they be absorbed easily and rapidly after oral administration. The values of Cmax and AUC of naringenin and hesperitin are relatively big, which indicates their bioavailability is not as low as reported in the literatures (Ma et al., 2006). The metabolic behaviors of the flavonoid glycosides might also be explained by the enterohepatic circulation or multiple site absorption (Wang et al., 2016). Meanwhile, the double-peak phenomenon and the so-called low bioavailability might also suggest that the reabsorption of the metabolites secreted in bile for FA should be more obvious.
Meranzin hydrate and meranzin, as the typical coumarins, were absorbed rapidly (Tmax, about 1 h) but eliminated slowly (t1/2z exceeds 6.5 h). Nobiletin, a polymethoxy flavone, was also rapidly absorbed with Tmax value of 1.17 ± 0.26 h and AUC(0-t) value of 472.64 ± 118.70, which was consistent with the previous report (Onoue et al., 2013; Shen et al., 2019). The average t1/2z of nobiletin was 2.10 ± 0.37 h in rats, suggested that nobiletin should be rapidly distributed and eliminated (Shen et al., 2019), which was partly different from the previous report, probably owing to the interactions among components in FA extract (Qiao et al., 2012; Zhang et al., 2018).
Statistical moment analysis (corresponding to non-compartmental model) and compartmental model analysis can be simultaneously performed in a run of batch analysis by DAS 3.1. In the current in vivo data analysis, the non-compartmental model has become the mainstream processing method and has been recommended by the drug review authorities in various countries (Yuan et al., 2017; Xu et al., 2019). In particular, the statistical moment analysis is more reliable for the drugs with double-peak phenomena. In this work, naringenin and hesperetin are found to have exactly these pharmacokinetic properties. So, the statistical moment parameters are shown in Tables 6 and 7. In the compartmental model analysis, various models and different statistical weights were compared in this work, and two-compartment parameters were found to be the optimal fitting values with the minimum AIC (Akaike's Information Criterion) and the best R (correlation coefficient) values (Yuan et al., 2017; Yang et al., 2019). The compartmental model parameters are shown in Tables S1 and S2.
As mentioned above, the pharmacokinetic characteristics of naringenin and hespeietin are closely related with enterohepatic circulation or multiple site absorption/reabsorption, which indicates their pharmacokinetics may be affected by the forms in which they exist. Therefore, we design the following four groups to investigate the effects: pure monomer (naringenin and hesperitin), compatibility (NA-NHE), and FA extract group. The results demonstrated that there were significant differences in pharmacokinetic parameters between different drug forms, including AUC(0–t), AUC(0–∞), Cmax, tmax, t1/2z, and CLZ/F. The main differences were observed between the compatibility group and the other two groups: ① remarkable increases in the values of AUC(0–∞), AUC(0–t) and Cmax; ② obvious decrease of CLZ/F; and ③ longer tmax and t1/2z. The comparisons of Cmax and AUC(0–t) between different groups were shown in Figure 4. The results suggest that compatibility can promote mutual absorption and affect the metabolic behaviors. Drug-drug interactions often occur, and the detailed effect of compatibility on the pharmacokinetics needs further study.
The proposed UPLC-MS/MS method was suitable for the accurate determination of meranzin hydrate, naringenin, hesperetin, meranzin, and nobiletin in rat plasma with high selectivity and sensitivity. The analytical method has been successfully used for the pharmacokinetic studies following oral administration of monomer, drugs in compatibility, and FA extract. The five components in FA can rapidly be absorbed. Drug compatibility can promote mutual absorption and affect the metabolic behaviors.
All datasets generated for this study are included in the article/Supplementary Material.
The animal study was reviewed and approved by The Experimental Animal Ethic Committee of Jiangxi University of Traditional Chinese Medicine.
JY, FW, and WY conceived and designed the experiments. FW, XL, RQ, MZha, MZho, and HC performed the experiments. FW, JY, and WY analyzed the data. JY and FW wrote the paper. All authors contributed to the article and approved the submitted version.
This work was financially supported by the National Natural Science Foundation of China (No. 81860698 and 81760680) and the Double First-class Discipline of Jiangxi Province (No. JXSYLXK-ZHYAO064).
The authors declare that the research was conducted in the absence of any commercial or financial relationships that could be construed as a potential conflict of interest.
Junwei He (Research Center for the Resourcing of Traditional Chinese Medicine and Minority Medicine, Jiangxi University of Traditional Chinese Medicine) kindly provided some standards, such as quercetin.
The Supplementary Material for this article can be found online at: https://www.frontiersin.org/articles/10.3389/fphar.2020.00933/full#supplementary-material
Bai, Y., Peng, W., Yang, C. P., Zou, W., Liu, M. H., Wu, H., et al. (2020). Pharmacokinetics and metabolism of naringin and active metabolite naringenin in rats, dogs, humans, and the differences between species. Front. Pharmacol. 11, 364. doi: 10.3389/fphar.2020.00364
Chen, H., Gao, M., Luo, X. Q., Chen, H. F., Yuan, J. B., Yang, W. L. (2019). Principal component analysis and discriminant analysis of 12 effective chemical constituents in Aurantii Fructus from different areas. Chin. Tradit. Herb. Drugs 50 (14), 3433–3437. doi: 10.7501/j.issn.0253-2670.2019.14.025
Committee of National Pharmacopoeia of RP China (2015). National pharmacopoeia of RP China: 247. 2015 edition (Beijing: China Medical Science and Technology Press).
Fang, T. Z., Wang, Y. G., Ma, Y., Su, W. W., Bai, Y., Zhao, P. Y. (2006). A rapid LC/MS/MS quantitation assay for naringin and its two metabolites in rats plasma. J. Pharm. Biomed. Anal. 40 (2), 454–459. doi: 10.1016/j.jpba.2005.07.031
Felgines, C., Texier, O., Morand, C., Manach, C., Scalbert, A., Régerat, F., et al. (2000). Bioavailability of the flavanone naringenin and its glycosides in rats. Am. J. Physiol-Gastr. L. 279 (6), G1148–G1154. doi: 10.1152/ajpgi.2000.279.6.G1148
Hsiu, S. L., Huang, T. Y., Hou, Y. C., Chin, D. H., Chao, P. D. L. (2002). Comparison of metabolic pharmacokinetics of naringin and naringenin in rabbits. Life Sci. 70 (13), 1481–1489. doi: 10.1016/S0024-3205(01)01491-6
Hu, D. D., Han, Q. B., Zhong, L. L. D., Li, Y. H., Lin, C. Y., Ho, H. M., et al. (2015). Simultaneous determination of ten compounds in rat plasma by UPLC-MS/MS: application in the pharmacokinetic study of Ma-Zi-Ren-Wan. J. Chromatogr. B. 1000, 136–146. doi: 10.1016/j.jchromb.2015.07.03
Ishii, K., Furuta, T., Kasuya, Y. (1996). Determination of naringin and naringenin in human plasma by high-performance liquid chromatography. J. Chromatogr. B. 683 (2), 225–229. doi: 10.1016/0378-4347(96)00114-4
Ishii, K., Furuta, T., Kasuya, Y. (1997). Determination of naringin and naringenin in human urine by high-performance liquid chromatography utilizing solid-phase extraction. J. Chromatogr. B. 704 (1-2), 299–305. doi: 10.1016/S0378-4347(97)00474-X
Jia, S., Hu, Y., Zhang, W. N., Zhao, X. Y., Chen, Y. H., Sun, C. D., et al. (2015). Hypoglycemic and hypolipidemic effects of neohesperidin derived from Citrus aurantium L. @ in diabetic KK-Ay mice. Food Funct. 6 (3), 878–886. doi: 10.1039/C4FO0093b
Kobayashi, S., Kato, T., Azuma, T., Kikuzaki, H., Abe, K. (2015). Anti-allergenic activity of polymethoxyflavones from Kaempferia parviflora. J. Funct. Foods. 13 (13), 100–107. doi: 10.1016/j.jff.2014.12.029
Lee, J. T., Pao, L. H., Hsieh, C. D., Huang, P. W., Hu, O. Y. P. (2017). Development and validation of an LC-MS/MS method for simultaneous quantification of hesperidin and hesperetin in rat plasma for pharmacokinetic studies. Anal. Methods-UK. 9 (22), 3329–3337. doi: 10.1039/c7ay00051k
Li, X. H., Xiong, Z. L., Lu, S., Zhang, Y., Li, F. M. (2010). Pharmacokinetics of naringin and its metabolite naringenin in rats after oral administration of Rhizoma Drynariae extract assayed by UPLC-MS/MS. Chin. J. Nat. Med. 8 (1), 40–46. doi: 10.1016/S1875-5364(10)60005-2
Li, P., Zeng, S. L., Duan, L., Ma, X. D., Dou, L. L., Wang, L. J., et al. (2016). Comparison of Aurantii Fructus Immaturus and Aurantii Fructus based on multiple chromatographic analysis and chemometrics methods. J. Chromatogr. A. 1469, 96–107. doi: 10.1016/j.chroma.2016.09.061
Li, P., Zeng, S. L., Wang, Z. Y., Yin, Q., Bi, Z. M., Liu, E. H. (2019). Simultaneous Quantification of Five Flavanone Glycosides in Rat Plasma by Ultra-Performance Liquid Chromatography-Tandem Mass Spectrometry: Application to a Comparative Pharmacokinetic Study of Aurantii Fructus Immaturus and Aurantii Fructus Extracts. J. AOAC Int. 102 (3), 781–787. doi: 10.5740/jaoacint.18-0285
Lu, T., Song, J., Huang, F., Deng, Y. X., Xie, L., Wang, G. J., et al. (2007). Comparative pharmacokinetics of baicalin after oral administration of pure baicalin, Radix scutellariae extract and Huang-Lian-Jie-Du-Tang to rats. J. Ethnopharmacol. 110 (3), 412–418. doi: 10.1016/j.jep.2006.09.036
Ma, Y., Li, P. B., Chen, D. W., Fang, T. Z., Li, H. T., Su, W. W. (2006). LC/MS/MS quantitation assay for pharmacokinetics of naringenin and double peaks phenomenon in rats plasma. Int. J. Pharm. 307 (2), 292–299. doi: 10.1016/j.ijpharm.2005.10.018
Mata-Bilbao, M. D. L., Andrés-Lacueva, C., Roura, E., Jáuregui, O., Escribano, E., Torre, C., et al. (2007). Absorption and pharmacokinetics of grapefruit flavanones in beagles. Brit. J. Nutr. 98 (1), 86–92. doi: 10.1017/S0007114507707262
Okada, N., Murakami, A., Urushizaki, S., Matsuda, M., Kawazoe, K., Ishizawa, K. (2017). Extracts of immature orange (Aurantii Fructus Immaturus) and citrus unshiu peel (Citri Unshiu Pericarpium) induce P-glycoprotein and cytochrome P450 3A4 expression via upregulation of pregnane X receptor. Front. Pharmacol. 8, 84. doi: 10.3389/fphar.2017.00084
Onoue, S., Nakamura, T., Uchida, A., Ogawa, K., Yuminoki, K., Hashimoto, N., et al. (2013). Physicochemical and biopharmaceutical characterization of amorphous solid dispersion of nobiletin, a citrus polymethoxylated flavone, with improved hepatoprotective effects. Eur. J. Pharm. Sci. 49 (4), 453–460. doi: 10.1016/j.ejps.2013.05.014
Parhiz, H., Roohbakhsh, A., Soltani, F., Rezaee, R., Iranshahi, M. (2015). Antioxidant and anti-inflammatory properties of the citrus flavonoids hesperidin and hesperetin: an updated review of their molecular mechanisms and experimental models. Phytother. Res. 29 (3), 323–331. doi: 10.1002/ptr.5256
Park, K. I., Park, H. S., Kim, M. K., Hong, G. E., Nagappan, A., Lee, H. J., et al. (2014). Flavonoids identified from Korean Citrus aurantium L. inhibit Non-Small Cell Lung Cancer growth in vivo and in vitro. J. Funct. Foods. 7, 287–297. doi: 10.1016/j.jff.2014.01.032
Qiao, X., Ye, M., Xiang, C., Wang, Q., Liu, C. F., Miao, W. J., et al. (2012). Analytical strategy to reveal the in vivo process of multi-component herbal medicine: a pharmacokinetic study of licorice using liquid chromatography coupled with triple quadrupole mass spectrometry. J. Chromatogr. A. 1258, 84–93. doi: 10.1016/j.chroma.2012.08.041
Qiu, X. J., Huang, X., Chen, Z. Q., Ren, P., Huang, W., Qin, F., et al. (2011). Pharmacokinetic study of the prokinetic compounds meranzin hydrate and ferulic acid following oral administration of Chaihu-Shugan-San to patients with functional dyspepsia. J. Ethnopharmacol. 137 (1), 205–213. doi: 10.1016/j.jep.2011.05.009
Renugadevi, J., Prabu, S. M. (2010). Cadmium-induced hepatotoxicity in rats and the protective effect of naringenin. Exp. Toxicol. Pathol. 62 (2), 171–181. doi: 10.1016/j.etp.2009.03.010
Shen, X. F., Li, L., Ma, Q. H., Chen, H., Wang, J. P., Lv, L., et al. (2019). Pharmacokinetic study of eight bioactive components following oral administration of Zhiqiao Gancao decoction and its clinical efficacy observation. Biomed. Chromatogr. 34 (2), e4706. doi: 10.1002/bmc.4706
Tong, L., Zhou, D. D., Gao, J., Zhu, Y. H., Sun, H., Bi, K. S. (2012). Simultaneous determination of naringin, hesperidin, neohesperidin, naringenin and hesperetin of Fractus aurantii extract in rat plasma by liquid chromatography tandem mass spectrometry. J. Pharm. Biomed. Anal. 58, 58–64. doi: 10.1016/j.jpba.2011.05.001
Wang, J. J., Shi, Q. S., Wu, C. Y., Feng, F. (2016). Dynamic metabolic profile of Zhi-Zi-Da-Huang decoction in rat urine based on hybrid liquid chromatography–mass spectrometry coupled with solid phase extraction. J. Chromatogr. B. 1036, 100–113. doi: 10.1016/j.jchromb.2016.10.003
Wang, W. B., Zhao, L. L., Huang, H. Y., Yao, J. M., Zhou, L., Wang, D. S., et al. (2018). Development of an Ultra-High Performance Liquid Chromatography Method for Simultaneous Determination of Six Active Compounds in Fructus aurantii and Rat Plasma and Its Application to a Comparative Pharmacokinetic Study in Rats Administered with Different Doses. J. Anal. Methods Chem. 2018, 7579136. doi: 10.1155/2018/7579136
Wu, M., Zhang, H. W., Zhou, C., Jia, H. M., Ma, Z., Zou, Z. M. (2015). Identification of the chemical constituents in aqueous extract of Zhi-Qiao and evaluation of its antidepressant effect. Molecules. 20 (4), 6925–6940. doi: 10.3390/molecules.20046925
Xu, F. G., Liu, Y., Dong, H. J., Song, R., Zhang, Z. J. (2010). Pharmacokinetic comparison in rats of six bioactive compounds between Da-Cheng-Qi decoction and its parent herbal medicines. Nat. Prod. Commun. 5 (5), 795–800. doi: 10.1177//1934578X1000500523
Xu, Z. R., Jiang, C. H., Fan, S. Y., Yan, R. J., Xie, N., Wu, C. Z. (2019). Comparative pharmacokinetics of naringin and neohesperidin after oral administration of flavonoid glycosides from Aurantii Fructus Immaturus in normal and gastrointestinal motility disorders mice. Chin. Herb. Med. 11 (3), 314–320. doi: 10.1016/j.chmed.2019.03.011
Yang, C. P., Liu, M. H., Zou, W., Guan, X.-L., Lai, L., Su, W. W. (2012). Toxicokinetics of naringin and its metabolite naringenin after 180-day repeated oral administration in beagle dogs assayed by a rapid resolution liquid chromatography/tandem mass spectrometric method. J. Asian. Nat. Prod. Res. 14 (1), 68–75. doi: 10.1080/10286020.2011.632369
Yang, F., Yang, F., Wang, G. Y., Kong, T., Liu, B. B. (2019). Pharmacokinetics of florfenicol and its metabolite florfenicol amine in crucian carp (Carassius auratus) at three tempetatures after single oral administration. Aquaculture. 503, 446–451. doi: 10.1016/j.aquaculture.2019.01.037
Yuan, J. B., Li, M., Chen, H. F., Yang, W. L., Luo, X. Q., Liu, Y. Y., et al. (2012). An HPLC method for the determination of auraptene in dog plasma: application to pharmacokinetic study. Lat. Am. J. Pharm. 31 (2), 251–256. doi: 10.1358/dof.2012.37.3.1745227
Yuan, J. B., Ren, G., Liang, J., Wang, C. Z., Yan, Z. H., Huang, Q., et al. (2017). Comparative studies on the multi-component pharmacokinetics of Aristolochiae Fructus and honey-fried Aristolochiae Fructus extracts after oral administration in rats. BMC Complem. Altern. Med. 17 (1), 1–11. doi: 10.1186/s12906-017-1626-2
Zeng, X., Su, W. W., Zheng, Y. Y., He, Y. D., He, Y., Rao, H. Y., et al. (2019). Pharmacokinetics, tissue distribution, metabolism, and excretion of naringin in aged rats. Front. Pharmacol. 10, 34. doi: 10.3389/fphar.2019.00034
Zhang, J. Z., Gao, W. Y., Hu, X., Liu, Z., Liu, C. X. (2012). The influence of compatibility of traditional Chinese medicine on the pharmacokinetic of main components in Fructus aurantii. J. Ethnopharmacol. 144 (2), 277–283. doi: 10.1016/j.jep.2012.09.009
Zhang, X. H., Han, L. R., Liu, J., Xu, Q. Y., Guo, Y. X., Zheng, W., et al. (2018). Pharmacokinetic study of 7 compounds following oral administration of Fructus aurantii to depressive rats. Front. Pharmacol. 9, 131. doi: 10.3389/fphar.2018.00131
Keywords: Citrus × aurantium L., Fructus aurantii, naringin, neohesperidin, pharmacokinetics, ultra-high performance liquid chromatography-tandem mass spectrometry
Citation: Yuan J, Wei F, Luo X, Zhang M, Qiao R, Zhong M, Chen H and Yang W (2020) Multi-Component Comparative Pharmacokinetics in Rats After Oral Administration of Fructus aurantii Extract, Naringin, Neohesperidin, and Naringin-Neohesperidin. Front. Pharmacol. 11:933. doi: 10.3389/fphar.2020.00933
Received: 10 December 2019; Accepted: 08 June 2020;
Published: 19 June 2020.
Edited by:
Aiping Lu, Hong Kong Baptist University, Hong KongReviewed by:
Anurag Khatkar, Maharshi Dayanand University, IndiaCopyright © 2020 Yuan, Wei, Luo, Zhang, Qiao, Zhong, Chen and Yang. This is an open-access article distributed under the terms of the Creative Commons Attribution License (CC BY). The use, distribution or reproduction in other forums is permitted, provided the original author(s) and the copyright owner(s) are credited and that the original publication in this journal is cited, in accordance with accepted academic practice. No use, distribution or reproduction is permitted which does not comply with these terms.
*Correspondence: Jinbin Yuan, a2luZ3MyMDA4QDE2My5jb20=; Wuliang Yang, eWFuZ3d1bGlhbmdAMTYzLmNvbQ==
Disclaimer: All claims expressed in this article are solely those of the authors and do not necessarily represent those of their affiliated organizations, or those of the publisher, the editors and the reviewers. Any product that may be evaluated in this article or claim that may be made by its manufacturer is not guaranteed or endorsed by the publisher.
Research integrity at Frontiers
Learn more about the work of our research integrity team to safeguard the quality of each article we publish.