 Yi Liu1,†
 Wensu Zhou
 Xiyue Xiong
- 1NHC Key Laboratory of Birth Defect for Research and Prevention, Hunan Provincial Maternal and Child Health Care Hospital, Changsha, China
- 2School of Public Health, Sun Yat-sen University, Guangzhou, China
- 3School of Xiangya Public Health, Central South University, Changsha, China
Background: The impact of exposure to fine particulate matter (aerodynamic diameter ≤2.5 μm, PM2.5) and greenness during early two year of life on Autism Spectrum Disorder (ASD) symptoms, especially under the combined influence of the two factors, and the sensitive periods of exposure during the early life, remain underexplored.
Objective: This cross-sectional study recruited 108 children with ASD and aimed to quantify the independent and combined effects of PM2.5 and greenness exposure on ASD symptoms during the first two years of life.
Methods: We collected PM2.5 levels and Normalized Difference Vegetation Index (NDVI) values to reflect PM2.5 exposure and greenness levels, meanwhile, assessing ASD symptoms with the Autism Behavior Checklist (ABC) and its sub-scales (sensory, relating, stereotypic behavior, language, and social independence) scores. We identified six sensitive exposure periods: 6 months, 7–12 months, 13–18 months, 19–24 months after birth, and the first and second years after birth. We investigated the independent effects of PM2.5 and greenness on ASD symptoms using multiple linear or logistic regression for continuous or categorical symptom scores, and explored their additive interaction and mediation effects.
Results: Multiple linear models showed reduced total ABC, relating, and social independence scores with greenness exposure at 19–24 months after birth, while 7–12 months and first year exposures benefited social independence. Logistic models showed that PM2.5 exposures during 13–18 months after birth increased symptoms of stereotypic behavior, while low greenness exposure during 19–24 months after birth heightened the risk of social independence impairment. We found high levels of PM2.5 and low greenness during the 13–18 months after birth increased the risk of overall severity. Greenness exposure during 6 months after birth could mitigate the effects of PM2.5 exposures during 13–18 months.
Conclusion: Our findings underscore the importance of reducing air pollution and enhancing greenness to mitigate ASD symptoms.
1 Introduction
Autism Spectrum Disorder (ASD) is characterized by early-onset difficulties in social communication and a distinctive pattern of restricted, repetitive behaviors and interests (1). It is a complex neural disorder, and recent evidence suggests that approximately 1 in 100 children globally are diagnosed with ASD (2). The multifaceted etiology of ASD underscores the importance of addressing the adverse impacts of contributing factors. Previous studies have found that air pollution, which consists of a mixture of several components including gases, organic compounds, and ambient particulate matter (PM), significantly affects the development of ASD (3). Of particular concern is fine particulate matter (PM2.5), which exerts the most substantial impact. Recent studies utilizing case-control and birth cohort designs have demonstrated a significant association between prenatal and postnatal PM2.5 exposure and elevated autism spectrum disorder (ASD) risk (3–7). Potential mechanisms linking air pollutants and ASD including the detrimental impact of particulate matter on the immune system leading to neuroinflammatory responses and oxidative stress, which are associated with ASD-like behaviors (8); complex gene-environment interactions and epigenetic factors (9, 10); and other potential molecular mechanisms like abnormalities in oxidative stress biomarkers, such as catalase (CAT) (11).
In addition to the risk of ASD, there is evidence indicating a connection between PM2.5 and the exacerbation of ASD symptoms (12, 13). This is significant because the considerable clinical diversity observed in individuals with autism highlights the need to understand how environmental factors impact the condition (3), although this area of research is not as thoroughly explored. Moreover, the early-life exposure to air pollution is particularly concerning, considering the critical development phase of the brain post-birth. Indeed, ASD typically manifests within the first two years of life and previous studies have shown strong evidence of a heightened risk for ASD associated with exposure to PM2.5 during this period (6, 10). However, findings regarding the impact of PM2.5 exposure during first two years of life on ASD symptoms have been inconsistent across studies (12–14). When examining the impact of air pollutants on ASD risk or symptom severity, the exposure window is often direct defined as the first or two years after birth (12, 13, 15–17). Nevertheless, a conceivable scenario is that individuals who developed ASD prior to the age of diagnosis are not influenced by the air pollution they were exposed to after this age. It is necessary to accurately assess the exposure level by taking into account the age at which the diagnosis was made. Understanding the temporal aspects of these associations is vital for identifying critical exposure periods and for avoiding measurement bias in research. Furthermore, it is also intriguing to explore the impact of air pollution exposure prior to diagnosis on the severity of ASD. It can offer evidence of the long-term, short-term, or incubation effects of air pollution. However, current discussions on the relationship between pre-diagnosis exposure of PM2.5 and ASD symptoms are inadequate (6).
Previous studies have indicated that exposure to green spaces is beneficial for early childhood development, cognitive growth, physical and mental health, this topic has become particularly significant against the background of their continual degradation caused by urbanization (18–20). Indeed, green spaces offer a range of health benefits and promote well-being through both direct and indirect pathways. They facilitate physical activity and social interaction, and help mitigate environmental factors like noise, heat, and air pollution (21, 22). In relation to enhancing neurodevelopment in autistic children, interaction with natural environments serves as a restorative factor that stimulates essential emotional states and improves gut health, which closely related to the reduction of ASD symptoms (23–25). Epidemiological evidence supports that access to green spaces may decrease the likelihood of ASD, yet, the impact of green spaces on the severity of ASD remains under-researched (18, 26, 27).
Although to date, several studies have examined the potential of greenness to mediate the effects of air pollution on ASD prevalence (26, 28), the potential interactive and mediating effects of greenness on the relationship between PM2.5 and ASD symptoms also warrant quantification. Let alone, PM2.5 also can mediate the effect of greenness on health outcomes (29, 30), but relevant evidence on the symptoms of ASD is limited. An additional area of interest is the role of green spaces throughout the early life of children with ASD, specifically whether exposure to green spaces can counteract the harmful effects of concurrent air pollution exposure or offer enduring protection against the detrimental impacts of subsequent harmful exposures, thereby potentially leading to a reduction in autistic symptoms. This hypothesis gains plausibility from the enduring benefits of green spaces on child development, which begin in early life and persist into older age (19, 31).
Therefore, by analyzing effects of multiple exposure windows, our formalized hypothesis is that exposure to PM2.5 increases the risk of more severe symptoms of ASD. Additionally, greater greenness can reduce the symptoms of ASD. Furthermore, there are combined effects of PM2.5 and greenness on symptoms, including interaction and mediation effects.
2 Materials and methods
2.1 Study design, participants and produces
Our cross-sectional study is a part of the China Multi-Center Children Autism Project (CMCAP), with the specific dataset employed in our research being sourced from Hunan Province; detailed description has been published elsewhere (32). We recruited participants from Changsha city, the capital of Hunan, during the period from March 2018 to May 2019. Changsha is a major megacity in Central China with a high level of air pollution and rapid urbanization (urbanization rate was 84% in 2022). Through random sampling design, stratified by district, we selected four special education institutions from a total of ten for our research. These institutions, located across four of six main urban districts of Changsha (Tianxin, Kaifu, Wangcheng, Yuhua), are recognized for their relative substantial size and function as designated centers for disabled children's rehabilitation and rescue assistance. These institutions were identified through the government's department (Hunan Disabled Persons' Federation). These centers are adept at providing behavioral and speech therapy to autistic children under 12 years old. All ASD children were recruited from special education institutions but primarily resided at home, with their family serving as their main caregivers.
The participants for this study were selected from children with a diagnosis of ASD documented at these centers. This diagnosis was verified through outpatient or inpatient records provided by a psychiatrist, psychologist, or neurodevelopmental pediatrician from a tertiary hospital. The inclusion criteria specified children formally diagnosed with ASD according to the DSM-V or DSM-IV criteria, excluding Pervasive Developmental Disorder-Not Otherwise Specified (PDD-NOS) and Asperger Syndrome. Additionally, eligible participants were those older than 24 months at the time of the interview (as early ASD symptoms are typically identified between 12 and 24 months), who had resided in the survey city from birth until the interview (ensuring a consistent and long-term exposure assessment), and who consented to participate in the study. Ultimately, 108 children with ASD, including 24 females and 84 males were enrolled in the study. The participants reside across all six major districts of the city. All provided their residence of home addresses, which at district-level and geocoded with a 6-digit zip code. Hence, this study assumed that subjects residing in the same district experienced same levels of exposure.
We collected demographic characteristics of children using a structured questionnaire. The primary caregivers of the children, such as parents or grandparents, provided their informed consent after receiving a comprehensive explanation of the study's purpose. Trained graduate students from the Xiangya School of Public Health at Central South University assisted the participants in completing the questionnaire. This assistance included clarifying questions and helping to record information. The interviewee further provided detailed information about the age at clinical diagnosis of ASD based on the hospital records. In this paper, we consider the diagnosis age of ASD made by medical institutions as the incidence time of ASD. Because we believe that this indicator offers a relatively accurate assessment for ASD, distinguishing it from developmental delays and other neurological disorders that may complicate the diagnosis of ASD. Additionally, in such a city survey site, the majority of parents possessed at least a high school education and would seek medical assistance upon noticing early symptoms. In our sample, over half of the subjects (75%) were diagnosed with ASD before the age of 3, which is close to the onset of early ASD symptoms. Ethics approval was provided by the Ethics Committee of Hunan Provincial Maternal and Child Health Care Hospital (EC20180318).
2.2 ASD symptoms
The evaluation of ASD symptoms was conducted using a widely recognized tool, the Autism Behavior Checklist (ABC). This instrument is frequently used to assess the core symptoms and severity of ASD. Demonstrating reliable and valid results, the ABC is suitable for children aged over 18 months and enables the assessment of symptoms in autistic children, with their caregivers completing the checklist. It comprises a 57-item checklist, categorized into five dimensions: sensory, relating, stereotypic behaviour, language, and social independence. Each item is rated on a scale from 1 to 4, reflecting the severity of symptoms. The screening threshold is set at a score of 53, with scores of 68 or higher indicating a likely ASD diagnosis (33). Higher scores are associated with more severe challenges. According to the Autism Diagnosis, Treatment, and Rehabilitation guidelines in China, a score below 31 is deemed normal. This benchmark was established based on studies with Chinese children, where a cut-off of 31 maintained the scale's reliability and validity (34, 35). This cut-off was chosen for this study, considering potential biases such as mothers' misinterpretations of items or failure to recognize autistic behaviors in their children. Therefore, in this study, scores calculated from ABC scales were continues variables and scores ranging from 31 to 67 are defined as indicative of mild symptoms, while scores of 68 or above suggest moderate to severe symptoms (36).
2.3 Assessment of Pm2.5 and greenness exposure
The daily PM2.5 and PM10 concentration data from 2007 to 2018 were obtained from the CHAP (China High Air Pollutants) database (37, 38), which provided mean daily estimates of ambient PM2.5. The PM2.5 data is part of the China High Air Pollutants series, a comprehensive dataset of ground-level air pollutants in China known for its long-term coverage, high resolution, and quality. It boasts a high accuracy level, evidenced by a cross-validation coefficient of determination (CV-R2) of 0.92, a root-mean-square error (RMSE) of 10.76 µg/m3, and a mean absolute error (MAE) of 6.32 µg/m3 on a daily basis (37). Our research primarily focused on PM2.5, hence, PM10 data was incorporated in a sensitivity analysis to validate the impact of particle size. For evaluating exposure to greenery, we utilized the Normalized Difference Vegetation Index (NDVI), a well-established measure for assessing vegetation coverage. NDVI reflects the extent of greenness, considering the quantity and spatial distribution of trees and vegetation. It is calculated using land surface reflectance in the visible (red) and near-infrared parts of the spectrum: NDVI = (NIR − red)/(NIR + red). We acquired NDVI data from NASA's Earth Observing System's global Moderate Resolution Imaging Spectroradiometer (MODIS) via Google Earth Engine, which offers a spatial resolution of 500 m × 500 m (MOD13A1). The NDVI values, ranging from −1 to 1, with higher positive values indicating denser vegetation. For our study, we used monthly NDVI values to assess exposure, reflecting the real-world rate of vegetation growth. Figure 1 presents monthly greenness and daily PM2.5 of Changsha city during 2007–2018.
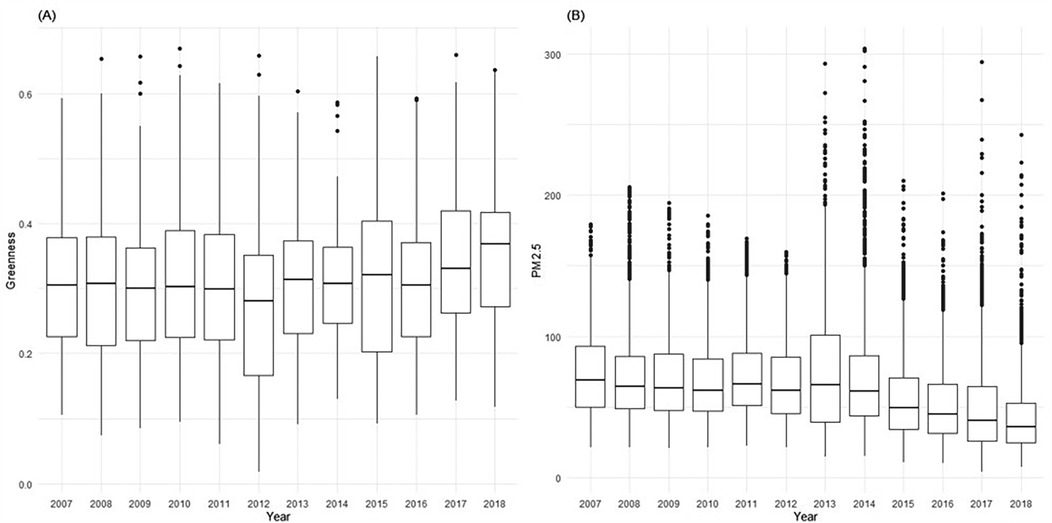
Figure 1. Boxplots of monthly greenness (A) and daily PM2.5 (B) of Changsha city during 2007–2018.
2.4 Exploration on the sensitive exposure window
Our study primarily focuses on the exposure periods during the first two years of life. Thus, we segmented the exposure period of participants into six stages based on their age at ASD diagnosis and birth dates, calculating mean exposures for these intervals. According to the previous study (6), the exposure windows were defined as follow: 6 months after date of birth (Stage 1), 7 months after date of birth - 12 months after date of birth (stage 2), 13 months after date of birth - 18 months after date of birth (stage 3), 19 months after date of birth - 24 months after date of birth (stage 4), first year after birth (i.e., age 1) (stage 5), second year after birth (i.e., age 2) (stage 6). Notably, the sample sizes varied across these exposure windows due to differences in age at diagnosis. For example, participants diagnosed with ASD after 12 months had exposure experiences in Stages 1 and 2 (n = 108), but unaffected by exposure in Stage 3. These details are listed in Table 1, indicating that various sub-samples were identified for separate analyses. Additionally, we did not consider exposures occurring before the diagnosis as they showed less or no significant association with ASD symptoms, as indicated in Supplementary Table S1.
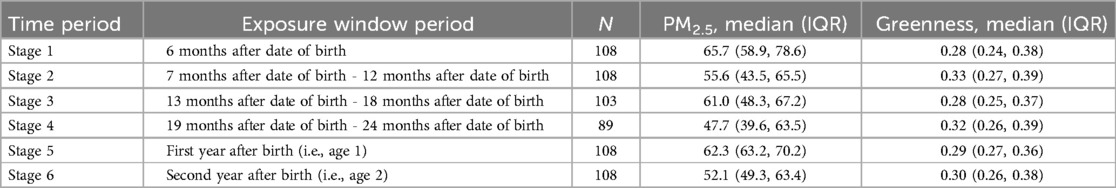
Table 1. Summary of the sensitive windows of exposure.
2.5 Covariates
In our study, we identified relevant covariates associated with ASD risk based on prior research (12, 15, 39). These covariates include the child's sex (boy or girl), race/ethnicity (Han or minority), maternal education level (junior high school or less, high school, college graduate or higher), maternal age at delivery (≤27, 28–30, >30), age of male parents (≤27, 28–30, >30), maternal occupation (employed or unemployed), maternal marital status (married or unmarried), birth year (categorized into four periods: 2007–2011, 2012–2013, 2014, 2015, and 2016), the season of birth (hot months, from May to September) or cold months. We included birth year as an important factor because previous study has reported that the risk of ASD is highest for fall births (i.e., conceived in the winter) and lowest for spring births (i.e., conceived in the summer) (40). Based on the findings of a published survey, we chose not to include gestational week (<37, 37–41, >41) as a confounding factor in our model. This decision was made on the grounds that gestational week might be part of the causal pathway linking air pollution to ASD (39).
2.6 Statistical analyses
We described the demographic characteristics of the children in our study. Categorical variables were presented as numbers and percentages. For continuous variables, we reported the mean ± standard deviation (SD) when they conformed to a normal distribution. Alternatively, if the distribution was not normal, we calculated the median ± interquartile range (IQR).
Our analysis focused on examining the association between PM2.5, greenness, and ASD symptoms, measured by the total scores of the ABC and its subscale scores for specific symptoms. These scores were log-transformed to address skewness and to meet the assumptions of multiple linear regression models, as done in previous study (13). We reported the results for each 10-unit increase in PM2.5 and per 0.1-unit increase in NDVI. Separate models were executed for each sensitive window period and we reported the β with a 95% confidence interval (95% CI) for effect estimations. We computed variance inflation factors (VIFs) to quantify multicollinearity between the exposures and covariates, and we did not find any violation of assumptions in the analysis. Using total scores as an example, the VIFs range from 1.03 to 1.11, which showed not multicollinearity existed. To further elucidate the findings, we examined potential dose-response relationships using restricted cubic spline (RCS) models with 3 knots.
Next, we referred to the 68 cut-off of the ABC to categorize severity levels as binary variables, distinguishing between milder and moderate to severe severity. Each specific symptoms of the ABC was similarly divided into two groups based on its median value as: higher severity (≥Median) and milder severity (<Median). To analyze the impact of PM2.5 and greenness on these binary symptom variables, we employed logistic regression models. This approach allows for a nuanced understanding of how these environmental factors might affect the likelihood of more severe ASD symptoms as categorized by the ABC scores. These models were utilized to calculate the odds ratios (OR) and 95%CI for effect estimation. Given the nested structure of our data, with individual participants situated within various districts, we initially contemplated incorporating multilevel regression into our analysis. We started with a “null” model analysis, which employed either continuous scores or binary variables of the ABC as the dependent variable without including any independent variables. The null model revealed Intra-class Correlation Coefficients (ICCs) of 0.004 for ABC total scores and less than 0.001 for categorical variables, hence, little of the variation in symptoms were attributable to differences at the district level. This led us to conclude that the use of multilevel models was not warranted for further analysis.
In our study, we conducted interaction analyses to investigate the combined effects of PM2.5 and greenness on the severity of ASD. We primarily focused on examining the additive interactions between PM2.5 and greenness on ASD symptoms. Because is the more relevant public health implication and the estimated interaction on an additive scale better reflect biological interaction (41). The dependent variables in this model were the binary variables of the overall and specific scores of the ABC, as previously described. Herein, PM2.5 and NDVI levels were transformed into categorical variables based on their median values: high level (≥Median) and low level (<Median). To evaluate the potential interaction, we calculated the relative excess risk due to interaction (RERI) using the formula: RERI = OR11 − OR10 − OR01 + 1. Here, OR11 represents the combined exposure to high levels of PM2.5 and low levels of NDVI, while OR01 and OR10 denote the presence (1) or absence (0) of each exposure separately. A positive RERI value (RERI > 0) suggests a synergistic effect, indicating a positively additive interaction. Conversely, a negative RERI value (RERI < 0) indicates an antagonistic and negatively additive interaction. If the 95% CI for RERI includes 0, it suggests null additive interaction.
Finally, we employed mediation analyses to investigate the potential mediating role of greenness/PM2.5 in the relationship between PM2.5/greenness and the overall and specific symptoms using causal mediation analyses. In this model, PM2.5/greenness served as the independent variable (X), and greenness/PM2.5 was considered the mediator (M). Total effects are categorized into average causal mediation effects (ACME) and average direct effects (ADE), namely, two components including the indirect effect (through M) and the direct effect (effect of X on ASD severity not mediated by M). The indirect effects evaluate the relationship between PM2.5/greenness and the overall and specific symptoms, mediated by greenness/PM2.5. A nonparametric bootstrap method with 1,000 resamples was employed to test the mediation estimates. Considering the numerous combinations of X and M across various exposure windows, our mediation analyses were grounded in the significant findings of the primary analysis. Specifically, we concentrated on the significant associations between PM2.5/greenness and symptoms as our total effects.
Lastly, to ensure the robustness of our findings, we adopted several strategies for validation. We used PM10 as an alternative proxy for air pollution to confirm the effects observed with PM2.5 on ASD symptoms. Additionally, we repeated significant analyses by altering the cut-off for the total ABC scores (using a threshold of <53 vs. ≥53) to assess the consistency of our results across different severity categorizations. All statistical analyses were conducted using R (version 4.2.2; R Development Core Team). We considered a two-sided p-value of less than 0.05 as indicative of statistical significance.
3 Result
3.1 Characteristic of participants
Table 2 describes the general characteristics of the participants in our study. The study consisted of 108 children with a mean age of 4.57 years (SD = 1.76) at the time of the interview. The sample included more boys (77.8%) than girls. The majority of mothers were aged over 30 years at the time of delivery and had attained a high school education or higher education level. The mean scores of the ABC were recorded as 61.00 (IQR = 31.25). As exposure in stage 1 an example (see Table 1), the median concentrations of PM2.5 and NDVI were 65.7 μg/m3 (IQR = 19.7) and 0.28 (IQR = 0.14), respectively.
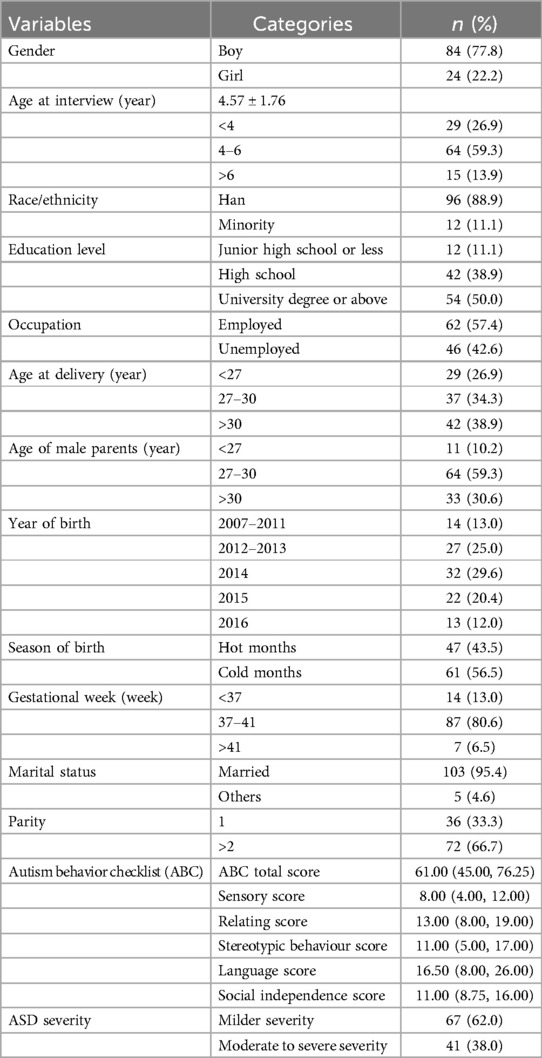
Table 2. Distribution of children's general information and ASD symptoms.
3.2 Associations of Pm2.5 and greenness with ASD severity
Figures 2A, 3A illustrate the association between PM2.5 exposures and ASD symptoms by linear and logistic regression models, respectively. No significant relationship was found between PM2.5 exposures and the total scores or specific scores (Figure 2A). However, a positive association was observed when considering the stereotypic behavior scores as a binary variable. To be specific, exposure to PM2.5 between 13 and 18 months after birth (Stage 3) was linked to an increased likelihood of more severe stereotypic behaviour symptoms (OR: 1.67, 95% CI: 1.06–2.64, P = 0.03, see Figure 3A).
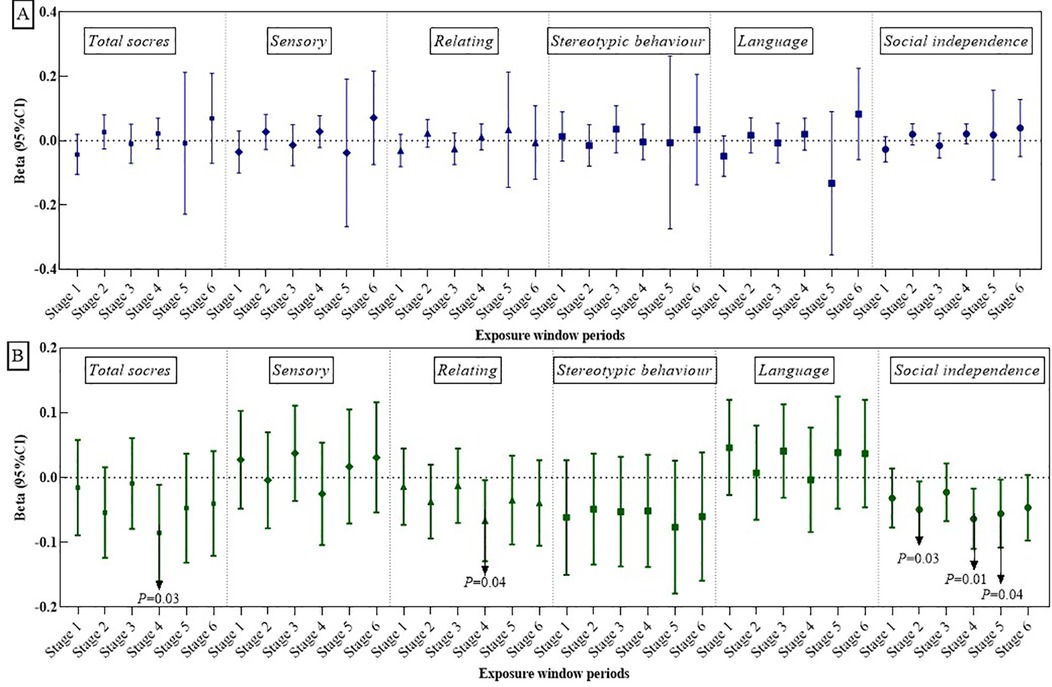
Figure 2. The relationships of PM2.5 exposure (A) and greenness exposure (B) with total ABC scores and its specific sub-scores.
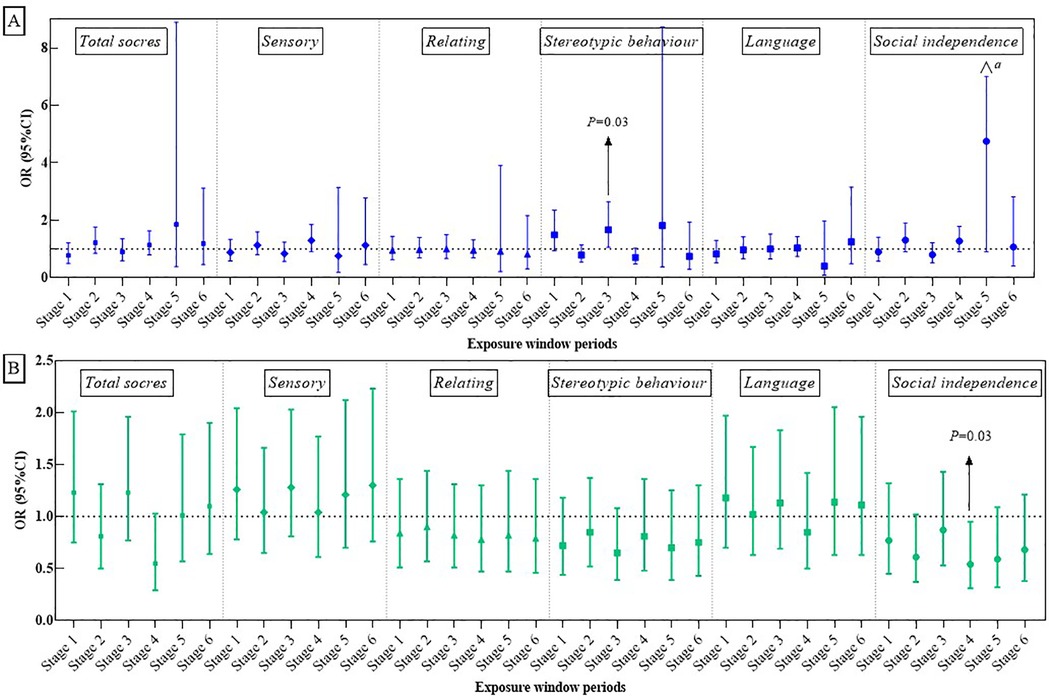
Figure 3. Associations of PM2.5 (A) and greenness exposure (B) with overall and domain-specific ASD symptom categories (categorical variables). a = 24.98.
Figures 2B, 3B present the impact of greenness on ASD severity. Exposure to greenness between 19 and 24 months after birth (Stage 4) was significantly associated with a lower risk of more severe symptoms (β: −0.09, 95% CI: −0.16, −0.01, P = 0.03 for total scores; β: −0.07, 95% CI: −0.13, −0.00, P = 0.04 for relating; β: −0.07, 95% CI: −0.11, −0.02, P = 0.01 for social independence). Notably, each 0.1-unit increase in greenness during this period was significantly associated with a decreased occurrence of moderate and higher severity symptoms in the social independence scale (OR: 0.54, 95%CI: 0.31, 0.95, P = 0.03). Linear models (Figures 2B) further showed reduced social independence scores with greenness exposure at 7–12 months after birth (Stage 2) (β: −0.05, 95% CI: −0.09, −0.01, P = 0.03) and exposure at age 1 (Stage 5) (β: −0.06, 95% CI: −0.11, −0.02, P = 0.04) benefited social independence. According to the dose-response relationship analysis, we did not find strong evidence of non-linear associations between PM2.5 and greenness with ASD symptoms (Supplementary Table S2).
3.3 Interaction effects of Pm2.5 and greenness on ASD severity
Based on logistic regression models, we examined the additive interaction effects between PM2.5 and NDVI during sensitive window periods on ASD symptoms (Supplementary Table S3–S4). Herein, we documented significant additive interactions in Table 3. We observed a synergistic effect of high PM2.5 during 13–18 months after birth (Stage 3) and low greenness during 6 months after birth (Stage 1) on ASD symptoms (RERI: 1.75, 95% CI: 0.33, 3.17). For high PM2.5 and low greenness during Stage 3, the estimates suggested a synergistic effect, suggesting that joint effects were more than expected for additive risks (RERI: 1.44, 95% CI: 0.42, 2.45). Additionally, significant synergistic effects were found for high levels of PM2.5 during Stage 3 and low levels of greenness after Stage 1 on language scores (RERI: 1.40, 95%CI: 0.09, 2.72).
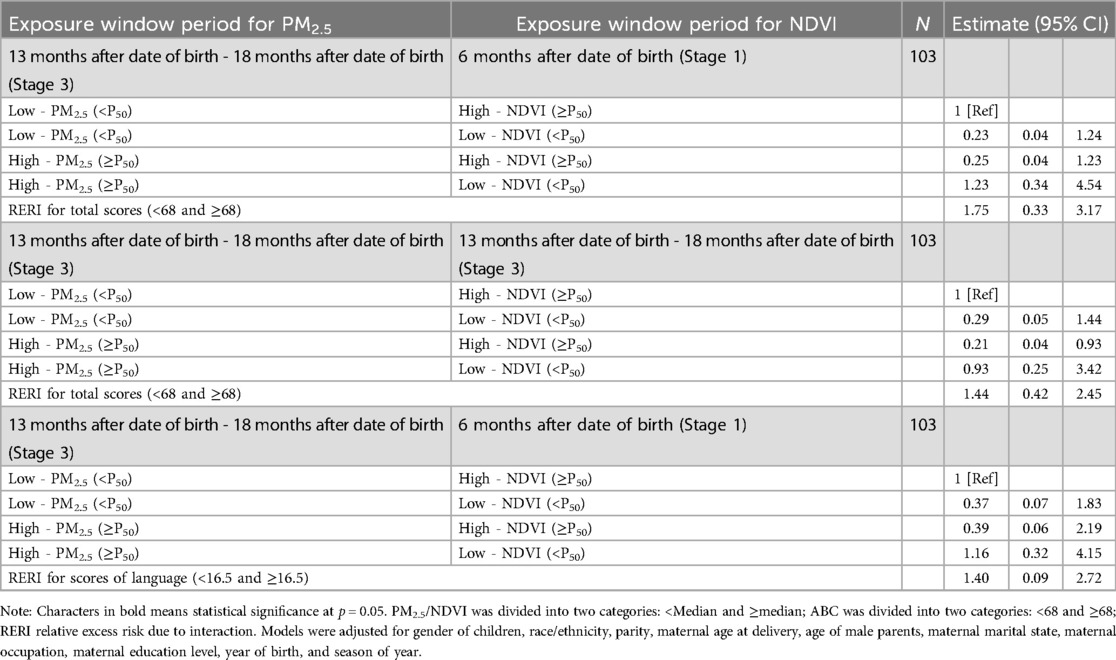
Table 3. Additive interaction between PM2.5 and greenness exposure on ASD symptoms based on logistic regression models.
3.4 Mediation effects of Pm2.5 and greenness ASD severity
Causal mediation analyses were conducted to explore the role of greenness/PM2.5 in the relationship between PM2.5/greenness and ASD symptoms (see Figures 4, 5). All analyses were conducted based on the main effects results for the association between PM2.5/greenness and ASD symptoms (refer to Figures 2, 3). Figure 4 illustrates the impact of PM2.5 on the relationship between greenness and ASD symptoms (measured by continuous scores), where no significant mediation effects were observed (the 95%CI for mediation effects overlap the null hypothesis). Likewise, no significant mediation effects were found in Figure 5.
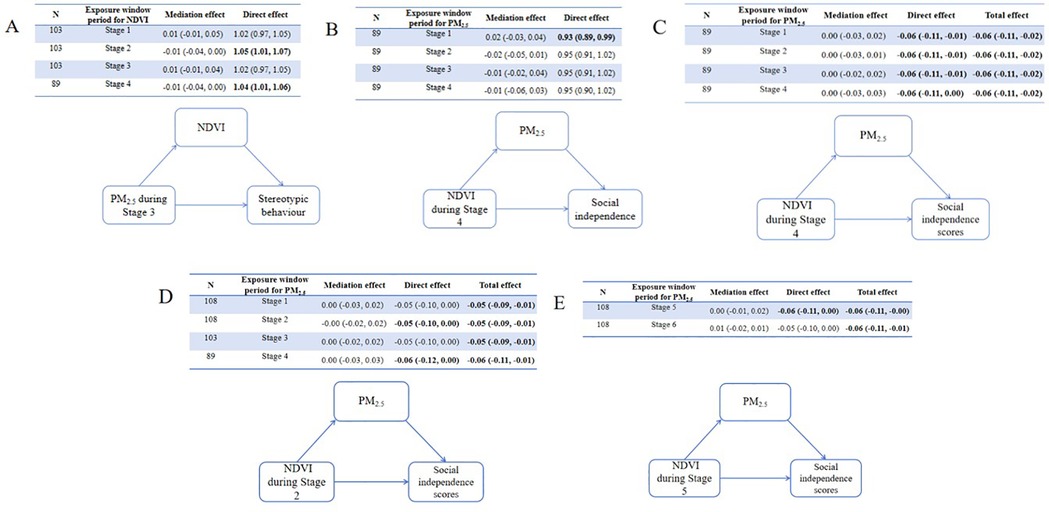
Figure 4. Results of mediation analyses (estimate, 95% CI) for PM2.5 on the associations (A) between greenness during stage 4 and total ABC scores, (B) between greenness during stage 4 and relating scores, (C) between greenness during stage 4 and social independence scores, (D) between greenness during stage 2 and social independence scores, (E) between greenness during stage 5 and social independence scores.
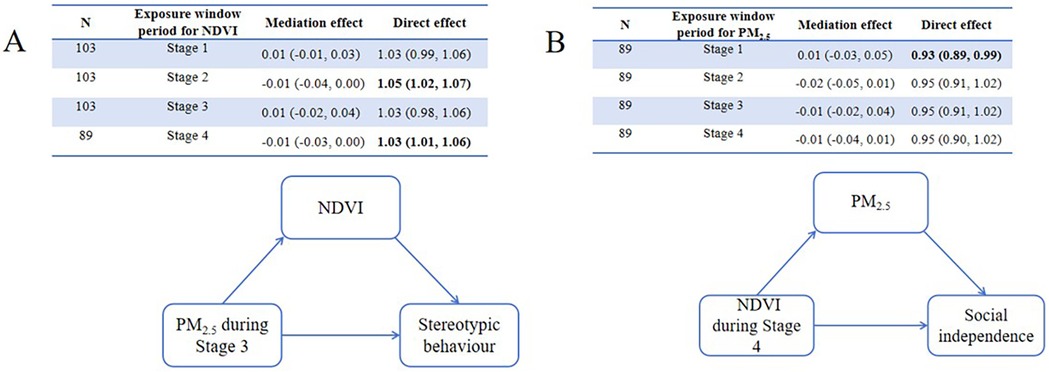
Figure 5. Mediation of associations (estimate, 95% CI) between residential greenness PM2.5 and ASD symptoms, by PM2.5 greenness. (A) Mediation analyses for greenness on the associations between PM2.5 during Stage 3 and stereotypic behaviour, (B) mediation analyses for PM2.5 between greenness during Stage 4 and social independence.
3.5 Sensitivity analyses
In our sensitivity analyses, associations between PM10 and stereotypic behavior symptoms were identified (OR: 1.51, 95%CI: 1.04–2.20, P = 0.03, see Supplementary Figure S2A), consistent with our main findings. By altering the cut-off for total ABC scores (defined as <53 vs. ≥53), we did not find a significant association between PM2.5 exposures, greenness, and ASD symptoms (Supplementary Figure S3), with consistent results observed for the main analysis. Regarding interaction effects, altering the cut-off for total ABC scores did not change our results (Supplementary Table S5). Additionally, the additive interaction of PM10 and greenness was weaker than the combined effects of PM2.5 and greenness reported in our analysis (Supplementary Table S5). These findings suggest that the sensitivity analyses did not substantially alter our initial findings.
4 Discussion
To the best of our knowledge, this study is the first to examine the independent and combined effects of PM2.5 and greenness on ASD symptoms, focusing especially on critical exposure periods in the first two years of life. The research reveals three key findings. First, exposure to PM2.5 is linked to a heightened risk of more severe ASD symptoms in stereotypic behavior scale. In contrast, greenness seems to reduce the severity of overall ASD symptoms, relating and social independence impairment. Second, the most crucial exposure periods are mainly in the second year of life, with fewer vital periods in the first year. Third, high PM2.5 levels combined with low greenness are associated with more severe ASD symptoms. Besides, significant additive effects were observed in various combinations of exposure periods. This study introduces a new perspective and contributes to the existing research in this field.
In the past few decades, substantial evidence has been reported to assess the impact of PM2.5 on the likelihood of ASD during pregnancy and the prenatal period; researchers also provide related explanations including neuroinflammatory responses and oxidative stress (7, 39, 42, 43). Besides, early life exposure to PM2.5 is also considered a risk period related to ASD (16, 43, 44), as this is a time of particular vulnerability to external environmental factors, potentially influencing various aspects like cognition, brain structure, and the structural development of the heart, lungs, or atopy (10). However, studies specifically focusing on the association between PM2.5 and ASD symptoms are limited and their results vary considerably (12–14, 45). For instance, a Korean study involving children with ASD aged 5–14 found that high short-term exposure to PM2.5 was linked to a higher risk of hospital admissions, suggesting the detrimental impact of air pollution on ASD symptoms early in life (45). Similar findings were observed in a Chinese study that used the first three years after birth as the window period to examine the PM2.5-ASD odds association (14). In contrast, Tara et al. found no evidence of an association between ASD severity and PM2.5 exposure during pregnancy and the first year of life (13), and Santos et al. also reported that exposure to PM after the first year of life was not significantly associated with higher symptom severity (12). These conflicting conclusions might stem from differences in exposure levels and inadequate consideration of the true exposure experiences. Specially, we collected time of diagnosis, and identifying specific time intervals as exposure window periods. This approach allows us to address the temporality of associations commonly not be sufficient illustrated in previous studies. While we reported no relationship between total scores and symptoms, we identified detrimental effects of PM2.5 exposure occurring 13–18 months after birth, which could lead to an increased risk of more severe stereotypic behaviour symptoms. This aligns with published literature indicating that the second year of life is a critical window period related to increased ASD risks (15, 16). Our study also highlights the importance of this period, which coincides with critical periods of child brain development. As analysis from the largest neuroimaging dataset showed that the rate of growth (velocity) for total white matter volume (WMV) peaked in infancy and early childhood at around 2.4 years, and cortical thickness peaked distinctly early at 1.7 years, with the brain reaching approximately 80% of its maximum size by age 3 (46). Another explanation is that children are more likely to breathe more external air when they are outdoors during the second and third years after birth than in the first year (16).
Our study further investigated the relationship between greenness and ASD symptoms, a topic less explored in prior research. Our results reveal a negative correlation between increased greenness and the severity of ASD symptoms, affecting not only overall scores but also the subscales of relating and social independence. Notably, we observed a stronger link between greenness and symptoms during the second year of a child's life, followed by the first year. Previous studies have also reported the advantages of green spaces in reducing the risk of ASD in children. For instance, a study involving children aged 5–12 from 543 California public elementary schools found a decreased risk of ASD with higher green space exposure, including forests, grasslands, and tree canopies (27). Similarly, Pagalan et al.'s 2022 cohort study of 129,222 Canadian births reported lower ASD risks associated with increased prenatal greenness (28). Chen et al.'s 2023 analysis indicated that greenness in the first 1–3 years post-birth reduces ASD incidence risks (26). Unlike these studies, which focused on ASD risk, our research extended previous work by setting ASD symptoms as the dependent outcome. Nevertheless, our findings also confirmed the beneficial effects of greenness on ASD, as reported in previous studies. Our research emphasizes early-life exposure to assess the greenness-ASD link, a crucial period for brain growth and development in early childhood. While the biological mechanisms underlying the benefits of greenness on ASD remain unclear, several theories support our findings. Generally, green spaces offer environmental advantages by mitigating triggers like air and noise pollution and high temperatures (47). Interaction with natural settings and biodiversity enhances capabilities, specifically physical activities and social engagements (48, 49). For instance, it aids in developing communication skills, understanding and following simple instructions, and regulating daily behavior. These skills are crucial for the rehabilitation and symptom relief of children with autism. Natural environment also promotes psychological restoration, enhancing relating, attention, memory, and stress reduction, and may decrease sleep disturbances, further easing severe ASD symptoms (50). Also, natural vegetation can improve the human microbiome and its immunomodulatory capacity, linked to enriched skin and gut microbial diversity, in turn, may enhance brain development, possibly through immune response regulation (25, 51). Additionally, the associations between green space and childhood development were more pronounced among boys than girls (52), which further suggesting potential benefits for autistic children, the majority of whom are boys. Thus, our results emphasized the significance of developing green spaces, particularly in areas undergoing rapid urbanization.
This study presents a crucial advancement in understanding the interaction between PM2.5 and greenness on ASD symptoms, uncovering a synergistic effect where increased PM2.5 and reduced greenness correlate with heightened risks of severe ASD symptoms. In other words, our findings imply that increasing greenness while diminishing air pollution could potentially alleviate the progression of more severe symptoms in children with ASD. Previous research has underscored the mitigating influence of greenness on PM2.5 and birth outcomes (53, 54). Indeed, greenness confers a plethora of benefits, including shielding against air pollution and diminishing the detrimental effects of toxic substances in polluted air. A notable discovery is the protective role of early exposure to greenness (i.e., 6 months after birth) against the adverse effects of air pollution encountered 13–18 months after birth. This protective impact is significant both for overall ASD symptom scores and specific sub-scales, namely, language development. Literature supports the association of early childhood exposure to greenness with improved visual memory in mid-childhood (55), enhanced working memory, and decreased inattentiveness in 7-year-old children (31) and as well as better neurodevelopmental assessments in 2-year-olds (18). Researchers emphasize that the protective benefits of green spaces accumulate over time and highlight their continued importance throughout childhood (56). For instance, there exists a cumulative relationship between green space exposure and the development of the human microbiome, such as early childhood gut microbiota, which potentially strengthens the human immune system and lays the groundwork for a fundamentally healthy bodily environment (57, 58). Engagement with natural environments is regarded as a positive experience, fostering engagement, control, and stress-processing abilities; this interaction promotes psychological restoration, and positively influences ecological behaviors (59), hence, equipping individuals to better handle environmental challenges later in life. Furthermore, our sensitivity analyses indicated that co-exposure to PM2.5 and a lack of greenness was more closely associated with higher symptom severity than the combination of greenness and PM10. This is primarily due to the smaller size of PM2.5 particles, which are more likely to penetrate the lungs and cross the blood-brain barrier, potentially leading to greater neurodevelopmental issues among autistic children. Consequently, our findings advocate for the enhancement of accessible green spaces alongside improvements in air quality.
Our study acknowledges several limitations. Firstly, due to the unavailability of exact home addresses, we assumed that participants living in the same district were exposed to similar levels, potentially introducing measurement bias. This assumption was necessary as most caregivers, wary of the stigma associated with ASD, were reluctant to provide addresses during the process of interview. Addressing this limitation in future research is important. Secondly, it is unavoidable that the onset of early symptoms of ASD may not align with the time of diagnosis, which could affect the accuracy of our findings. Thirdly, no additional information was present potentially related to environmental exposure, such as time spent outdoors or frequency of using green spaces, which can significantly affect the impact of air pollution or greenness on ASD symptoms. Fourthly, our study focused on children with ASD recruited from urban special education schools, where there is a higher availability of ASD-diagnosed subjects. Future studies should extend to rural populations to enhance the generalizability of our findings. We acknowledge that the limited sample size may impact the generalization of our results. We also emphasize that our findings do not establish a causal link; they are merely correlational. Changes in ASD symptoms post-diagnosis could introduce some bias. However, as the ABC scale assesses both current and past behaviors, we are confident in the thorough documentation of symptoms. Lastly, we used PM2.5 as the primary air pollution exposure because it is the most widely discussed pollutant and has significantly contributed to the risks of ASD. In contrast, evidence levels regarding other air pollutants and their association with ASD or its severity is poor (3). Future research should focus on elucidating the biological mechanisms linking multiple air pollutants to ASD, and exploring the interaction effects with other environmental factors on ASD severity. Despite these limitations, our study addresses gaps in previous research by considering the temporality of associations and utilizing diagnosis timing for a more precise interpretation of the relationship between environmental factors and ASD symptoms. The ABC scale, suitable for a wide range of children's ages, offers multiple symptom assessments. We concurrently examined the impacts of air pollution and green spaces on ASD symptoms, conducted interaction and mediation analyses across different exposure periods, and provided new insights into the early-life benefits of green spaces. This enhances the existing body of research and deepens our understanding of these associations.
5 Conclusions
In conclusion, our research lends support to the hypothesis that severe symptoms of ASD are linked to exposure to PM2.5 and a scarcity of green spaces. Notably, our findings indicate that the second year of life is a particularly sensitive period in this context. We observed a synergistic effect in the combined influence of high PM2.5 levels and limited greenness, suggesting an additive interaction. This synergistic effect was also pronounced with high PM2.5 exposures during the 13–18 months after birth period, coupled with low exposure to green spaces during six months after birth, in relation to ASD symptoms. Our study did not find substantial evidence supporting a mediating role of greenness in the relationship between PM2.5 and ASD symptoms. This aspect of our research adds a good addition to current knowledge on the influences of environmental factors on ASD symptoms and also enhance our understanding of the potential dual benefits of reducing air pollution and increasing access to green spaces, particularly during the critical early years of children's lives who are diagnosed with ASD.
Data availability statement
The original contributions presented in the study are included in the article/Supplementary Material, further inquiries can be directed to the corresponding authors.
Ethics statement
The studies involving humans were approved by Ethics Committee of Hunan Provincial Maternal and Child Health Care Hospital. The studies were conducted in accordance with the local legislation and institutional requirements. Written informed consent for participation in this study was provided by the participants' legal guardians/next of kin.
Author contributions
YL: Data curation, Formal analysis, Software, Writing – original draft, Writing – review & editing. WZ: Conceptualization, Data curation, Formal analysis, Software, Validation, Visualization, Writing – original draft. ML: Data curation, Visualization, Writing – original draft. YW: Resources, Supervision, Validation, Writing – original draft. SC: Data curation, Resources, Validation, Writing – original draft, Writing – review & editing. XX: Data curation, Funding acquisition, Resources, Validation, Writing – original draft, Writing – review & editing.
Funding
The author(s) declare that financial support was received for the research and/or publication of this article. This study was financially supported by Hunan Provincial Health High-Level Talent Scientific Research Project (R2023159).
Acknowledgments
We sincerely appreciate caregivers’ cooperation, as well as teachers’ support from rehabilitation centers.
Conflict of interest
The authors declare that the research was conducted in the absence of any commercial or financial relationships that could be construed as a potential conflict of interest.
Generative AI statement
The author(s) declare that no Generative AI was used in the creation of this manuscript.
Publisher's note
All claims expressed in this article are solely those of the authors and do not necessarily represent those of their affiliated organizations, or those of the publisher, the editors and the reviewers. Any product that may be evaluated in this article, or claim that may be made by its manufacturer, is not guaranteed or endorsed by the publisher.
Supplementary material
The Supplementary Material for this article can be found online at: https://www.frontiersin.org/articles/10.3389/fped.2025.1561476/full#supplementary-material
References
1. Lai MC, Lombardo MV, Baron-Cohen S. Autism. Lancet. (2014) 383(9920):896–910. doi: 10.1016/s0140-6736(13)61539-1
2. Zeidan J, Fombonne E, Scorah J, Ibrahim A, Durkin MS, Saxena S, et al. Global prevalence of autism: a systematic review update. Autism Res. (2022) 15(5):778–90. doi: 10.1002/aur.2696
3. Dutheil F, Comptour A, Morlon R, Mermillod M, Pereira B, Baker JS, et al. Autism spectrum disorder and air pollution: a systematic review and meta-analysis. Environ Pollut. (2021) 278:116856. doi: 10.1016/j.envpol.2021.116856
4. Liu H, Ding L, Qu G, Guo X, Liang M, Ma S, et al. Particulate matter exposure during pregnancy and infancy and risks of autism Spectrum disorder in children: a systematic review and meta-analysis. Sci Total Environ. (2023) 855:158830. doi: 10.1016/j.scitotenv.2022.158830
5. Pelch KE, Bolden AL, Kwiatkowski CF. Environmental chemicals and autism: a scoping review of the human and animal research. Environ Health Perspect. (2019) 127(4):46001. doi: 10.1289/EHP4386
6. Lin LZ, Zhan XL, Jin CY, Liang JH, Jing J, Dong GH. The epidemiological evidence linking exposure to ambient particulate matter with neurodevelopmental disorders: a systematic review and meta-analysis. Environ Res. (2022) 209:112876. doi: 10.1016/j.envres.2022.112876
7. Raz R, Roberts AL, Lyall K, Hart JE, Just AC, Laden F, et al. Autism spectrum disorder and particulate matter air pollution before, during, and after pregnancy: a nested case-control analysis within the Nurses’ health study ii cohort. Environ Health Perspect. (2015) 123(3):264–70. doi: 10.1289/ehp.1408133
8. Careaga M, Hansen RL, Hertz-Piccotto I, Van de Water J, Ashwood P. Increased anti-phospholipid antibodies in autism Spectrum disorders. Mediat Inflamm. (2013) 2013:935608. doi: 10.1155/2013/935608
9. Zhou Q, Tian Y, Xu C, Wang J, Jin Y. Prenatal and postnatal traffic pollution exposure, DNA methylation in Shank3 and Mecp2 promoter regions, H3k4me3 and H3k27me3 and sociability in Rats’ offspring. Clin Epigenetics. (2021) 13(1):180. doi: 10.1186/s13148-021-01170-x
10. Fox SE, Levitt P, Nelson CA 3rd. How the timing and quality of early experiences influence the development of brain architecture. Child Dev. (2010) 81(1):28–40. doi: 10.1111/j.1467-8624.2009.01380.x
11. Shabani S. A mechanistic view on the neurotoxic effects of air pollution on central nervous system: risk for autism and neurodegenerative diseases. Environ Sci Pollut Res Int. (2021) 28(6):6349–73. doi: 10.1007/s11356-020-11620-3
12. Santos JX, Sampaio P, Rasga C, Martiniano H, Faria C, Cafe C, et al. Evidence for an association of prenatal exposure to particulate matter with clinical severity of autism Spectrum disorder. Environ Res. (2023) 228:115795. doi: 10.1016/j.envres.2023.115795
13. Kerin T, Volk H, Li W, Lurmann F, Eckel S, McConnell R, et al. Association between air pollution exposure, cognitive and adaptive function, and asd severity among children with autism spectrum disorder. J Autism Dev Disord. (2017) 48(1):137–50. doi: 10.1007/s10803-017-3304-0
14. Geng R, Fang S, Li G. The association between particulate matter 2.5 exposure and children with autism spectrum disorder. Int J Dev Neurosci. (2019) 75:59–63. doi: 10.1016/j.ijdevneu.2019.05.003
15. Goodrich AJ, Kleeman MJ, Tancredi DJ, Ludena YJ, Bennett DH, Hertz-Picciotto I, et al. Ultrafine particulate matter exposure during second year of life, but not before, associated with increased risk of autism spectrum disorder in bkmr mixtures model of multiple air pollutants. Environ Res. (2023) 242:117624. doi: 10.1016/j.envres.2023.117624
16. Chen G, Jin Z, Li S, Jin X, Tong S, Liu S, et al. Early life exposure to particulate matter air pollution (pm(1), pm(2.5) and pm(10)) and autism in Shanghai, China: a case-control study. Environ Int. (2018) 121(Pt 2):1121–7. doi: 10.1016/j.envint.2018.10.026
17. Gong T, Dalman C, Wicks S, Dal H, Magnusson C, Lundholm C, et al. Perinatal exposure to traffic-related air pollution and autism spectrum disorders. Environ Health Perspect. (2017) 125(1):119–26. doi: 10.1289/EHP118
18. Liao J, Zhang B, Xia W, Cao Z, Zhang Y, Liang S, et al. Residential exposure to green space and early childhood neurodevelopment. Environ Int. (2019) 128:70–6. doi: 10.1016/j.envint.2019.03.070
19. Zare Sakhvidi MJ, Knobel P, Bauwelinck M, de Keijzer C, Boll LM, Spano G, et al. Greenspace exposure and children behavior: a systematic review. Sci Total Environ. (2022) 824:153608. doi: 10.1016/j.scitotenv.2022.153608
20. Bijnens EM, Derom C, Thiery E, Weyers S, Nawrot TS. Residential green space and child intelligence and behavior across urban, suburban, and rural areas in Belgium: a longitudinal birth cohort study of twins. PLoS Med. (2020) 17(8):e1003213. doi: 10.1371/journal.pmed.1003213
21. Dzhambov AM, Browning M, Markevych I, Hartig T, Lercher P. Analytical approaches to testing pathways linking greenspace to health: a scoping review of the empirical literature. Environ Res. (2020) 186:109613. doi: 10.1016/j.envres.2020.109613
22. Astell-Burt T, Feng X. Paths through the woods. Int J Epidemiol. (2022) 51(1):1–5. doi: 10.1093/ije/dyab233
23. Dadvand P, Nieuwenhuijsen MJ, Esnaola M, Forns J, Basagana X, Alvarez-Pedrerol M, et al. Green spaces and cognitive development in primary schoolchildren. Proc Natl Acad Sci U S A. (2015) 112(26):7937–42. doi: 10.1073/pnas.1503402112
24. Bowyer RCE, Twohig-Bennett C, Coombes E, Wells PM, Spector TD, Jones AP, et al. Microbiota composition is moderately associated with greenspace composition in a UK cohort of twins. Sci Total Environ. (2022) 813:152321. doi: 10.1016/j.scitotenv.2021.152321
25. Elten M, Benchimol EI, Fell DB, Kuenzig ME, Smith G, Kaplan GG, et al. Residential greenspace in childhood reduces risk of pediatric inflammatory bowel disease: a population-based cohort study. Am J Gastroenterol. (2021) 116(2):347–53. doi: 10.14309/ajg.0000000000000990
26. Chen Y, Chen G, Liu Y, Dong GH, Yang BY, Li S, et al. Exposure to greenness during pregnancy and the first three years after birth and autism spectrum disorder: a matched case-control study in Shanghai, China. Environ Pollut. (2024) 340(Pt 1):122677. doi: 10.1016/j.envpol.2023.122677
27. Wu J, Jackson L. Inverse relationship between urban green space and childhood autism in California elementary school districts. Environ Int. (2017) 107:140–6. doi: 10.1016/j.envint.2017.07.010
28. Pagalan L, Oberlander TF, Hanley GE, Rosella LC, Bickford C, Weikum W, et al. The association between prenatal greenspace exposure and autism spectrum disorder, and the potentially mediating role of air pollution reduction: a population-based birth cohort study. Environ Int. (2022) 167:107445. doi: 10.1016/j.envint.2022.107445
29. Luo YN, Yang BY, Zou Z, Markevych I, Browning M, Heinrich J, et al. Associations of greenness surrounding schools with blood pressure and hypertension: a nationwide cross-sectional study of 61,229 children and adolescents in China. Environ Res. (2021) 204(Pt A):112004–13. doi: 10.1016/j.envres.2021.112004
30. Huang WZ, Yang BY, Yu HY, Bloom MS, Markevych I, Heinrich J, et al. Association between community greenness and obesity in urban-dwelling Chinese adults. Sci Total Environ. (2020) 702:135040. doi: 10.1016/j.scitotenv.2019.135040
31. Dadvand P, Pujol J, Macia D, Martinez-Vilavella G, Blanco-Hinojo L, Mortamais M, et al. The association between lifelong greenspace exposure and 3-dimensional brain magnetic resonance imaging in Barcelona schoolchildren. Environ Health Perspect. (2018) 126(2):027012. doi: 10.1289/EHP1876
32. Xiang X, Yang T, Chen J, Chen L, Dai Y, Zhang J, et al. Association of feeding patterns in infancy with later autism symptoms and neurodevelopment: a national multicentre survey. BMC Psychiatry. (2023) 23(1):174. doi: 10.1186/s12888-023-04667-2
33. Krug DA, Arick J, Almond P. Behavior checklist for identifying severely handicapped individuals with high levels of autistic behavior. J Child Psychol Psychiatry. (1980) 21(3):221–9. doi: 10.1111/j.1469-7610.1980.tb01797.x
34. Cai Z, Hu L, Wang Z, Xie G, Lin X. Comparative analysis of several common screening and assessment scales for childhood autism Spectrum disease (in Chinese). Chinese Gen Pract. (2022) 25(24):2998–3004. doi: 10.12114/j.issn.1007-9572.2022.0231
35. Yang JH, Strodl E, Wu CA, Yin XN, Wen GM, Sun DL, et al. Association between environmental tobacco smoke exposure in early life and autistic-like behaviors in Chinese preschoolers. J Psychosom Res. (2021) 152:110680. doi: 10.1016/j.jpsychores.2021.110680
36. Tamanaha AC, Perissinoto J, Chiari BM. Development of autistic children based on maternal responses to the autism behavior checklist. Pro Fono. (2008) 20(3):165–70. doi: 10.1590/s0104-56872008000300005
37. Wei J, Li Z, Lyapustin A, Sun L, Peng Y, Xue W, et al. Reconstructing 1-km-resolution high-quality Pm2.5 data records from 2000 to 2018 in China: spatiotemporal variations and policy implications. Remote Sens Environ. (2021) 252:112136–53. doi: 10.1016/j.rse.2020.112136
38. Wei J, Li Z, Xue W, Sun L, Fan T, Liu L, et al. The Chinahighpm10 dataset: generation, validation, and spatiotemporal variations from 2015 to 2019 across China. Environ Int. (2021) 146:106290. doi: 10.1016/j.envint.2020.106290
39. Rahman MM, Shu YH, Chow T, Lurmann FW, Yu X, Martinez MP, et al. Prenatal exposure to air pollution and autism spectrum disorder: sensitive windows of exposure and sex differences. Environ Health Perspect. (2022) 130(1):17008. doi: 10.1289/EHP9509
40. Lee BK, Gross R, Francis RW, Karlsson H, Schendel DE, Sourander A, et al. Birth seasonality and risk of autism Spectrum disorder. Eur J Epidemiol. (2019) 34(8):785–92. doi: 10.1007/s10654-019-00506-5
41. VanderWeele TJ, Knol MJ. A tutorial on interaction. Epidemiol Method. (2014) 3(1):33–72. doi: 10.1515/em-2013-0005
42. Pagalan L, Bickford C, Weikum W, Lanphear B, Brauer M, Lanphear N, et al. Association of prenatal exposure to air pollution with autism spectrum disorder. JAMA Pediatr. (2019) 173(1):86–92. doi: 10.1001/jamapediatrics.2018.3101
43. McGuinn LA, Windham GC, Kalkbrenner AE, Bradley C, Di Q, Croen LA, et al. Early life exposure to air pollution and autism spectrum disorder: findings from a multisite case-control study. Epidemiology. (2020) 31(1):103–14. doi: 10.1097/EDE.0000000000001109
44. McGuinn LA, Windham GC, Messer LC, Di Q, Schwartz J, Croen LA, et al. Air pollution, neighborhood deprivation, and autism spectrum disorder in the study to explore early development. Environ Epidemiol. (2019) 3(5):e067–74. doi: 10.1097/ee9.0000000000000067
45. Kim KN, Sohn JH, Cho SJ, Seo HY, Kim S, Hong YC. Effects of short-term exposure to air pollution on hospital admissions for autism spectrum disorder in Korean school-aged children: a nationwide time-series study. BMJ Open. (2022) 12(9):e058286. doi: 10.1136/bmjopen-2021-058286
46. Bethlehem RAI, Seidlitz J, White SR, Vogel JW, Anderson KM, Adamson C, et al. Brain charts for the human lifespan. Nature. (2022) 604(7906):525–33. doi: 10.1038/s41586-022-04554-y
47. Fong KC, Hart JE, James P. A review of epidemiologic studies on greenness and health: updated literature through 2017. Curr Environ Health Rep. (2018) 5(1):77–87. doi: 10.1007/s40572-018-0179-y
48. Sarkar C, Webster C, Gallacher J. Residential greenness and prevalence of Major depressive disorders: a cross-sectional, observational, associational study of 94 879 adult UK biobank participants. Lancet Planetary Health. (2018) 2(4):e162–e73. doi: 10.1016/s2542-5196(18)30051-2
49. Astell-Burt T, Navakatikyan M, Eckermann S, Hackett M, Feng X. Is urban green space associated with lower mental healthcare expenditure? Soc Sci Med. (2022) 292:114503. doi: 10.1016/j.socscimed.2021.114503
50. Andrusaityte S, Grazuleviciene R, Dedele A, Balseviciene B. The effect of residential greenness and city park visiting habits on preschool children’s mental and general health in Lithuania: a cross-sectional study. Int J Hyg Environ Health. (2020) 223(1):142–50. doi: 10.1016/j.ijheh.2019.09.009
51. Dadvand P, Villanueva CM, Font-Ribera L, Martinez D, Basagana X, Belmonte J, et al. Risks and benefits of green spaces for children: a cross-sectional study of associations with sedentary behavior, obesity, asthma, and allergy. Environ Health Perspect. (2014) 122(12):1329–35. doi: 10.1289/ehp.1308038
52. Islam MZ, Johnston J, Sly PD. Green space and early childhood development: a systematic review. Rev Environ Health. (2020) 35(2):189–200. doi: 10.1515/reveh-2019-0046
53. Lee PC, Wu CD, Tsai HJ, Tsai HY, Lin SH, Wu CK, et al. Residential greenness and birth outcomes: evaluating the mediation and interaction effects of particulate air pollution. Ecotoxicol Environ Saf. (2021) 211:111915. doi: 10.1016/j.ecoenv.2021.111915
54. Laurent O, Benmarhnia T, Milesi C, Hu J, Kleeman MJ, Cockburn M, et al. Relationships between greenness and low birth weight: investigating the interaction and mediation effects of air pollution. Environ Res. (2019) 175:124–32. doi: 10.1016/j.envres.2019.05.002
55. Jimenez MP, Shoaff J, Kioumourtzoglou MA, Korrick S, Rifas-Shiman SL, Hivert MF, et al. Early-Life exposure to green space and mid-childhood cognition in the project Viva cohort, Massachusetts. Am J Epidemiol. (2022) 191(1):115–25. doi: 10.1093/aje/kwab209
56. Engemann K, Pedersen CB, Arge L, Tsirogiannis C, Mortensen PB, Svenning JC. Residential green space in childhood is associated with lower risk of psychiatric disorders from adolescence into adulthood. Proc Natl Acad Sci U S A. (2019) 116(11):5188–93. doi: 10.1073/pnas.1807504116
57. Rook GA. Regulation of the immune system by biodiversity from the natural environment: an ecosystem service essential to health. Proc Natl Acad Sci U S A. (2013) 110(46):18360–7. doi: 10.1073/pnas.1313731110
58. Galland L. The gut microbiome and the brain. J Med Food. (2014) 17(12):1261–72. doi: 10.1089/jmf.2014.7000
Keywords: air pollution, greenness, autism spectrum disorder, symptoms, child health
Citation: Liu Y, Zhou W, Liu M, Wang Y, Chen S and Xiong X (2025) Independent and combined effects of fine particulate matter and greenness on autism spectrum disorder symptoms: investigating sensitive periods of exposure in the early two years of life. Front. Pediatr. 13:1561476. doi: 10.3389/fped.2025.1561476
Received: 16 January 2025; Accepted: 25 March 2025;
Published: 10 April 2025.
Edited by:
Erin Kristin Zinkhan, The University of Utah, United StatesReviewed by:
German Torres, New York Institute of Technology, United StatesAustin Rau, Hite Consulting, Inc., United States
Copyright: © 2025 Liu, Zhou, Liu, Wang, Chen and Xiong. This is an open-access article distributed under the terms of the Creative Commons Attribution License (CC BY). The use, distribution or reproduction in other forums is permitted, provided the original author(s) and the copyright owner(s) are credited and that the original publication in this journal is cited, in accordance with accepted academic practice. No use, distribution or reproduction is permitted which does not comply with these terms.
*Correspondence: Shu Chen, ODEzMDg5MzFAcXEuY29t; Xiyue Xiong, eGlvbmdfZnliakAxNjMuY29t
†These authors have contributed equally to this work