 Xiao-min Ye
 Xiang-Lan Wen
94% of researchers rate our articles as excellent or good
Learn more about the work of our research integrity team to safeguard the quality of each article we publish.
Find out more
ORIGINAL RESEARCH article
Front. Pediatr. , 18 February 2025
Sec. Children and Health
Volume 13 - 2025 | https://doi.org/10.3389/fped.2025.1448309
Objective: To construct a growth curve for children aged 6–12 years residing in Zhuzhou, assess the height distribution among local elementary school students, and analyze the factors contributing to short stature.
Methods: We measured the heights of children from 110 elementary schools in Zhuzhou using cluster sampling. A total of 106,864 samples of children aged 6–12 years were collected and divided into 25 age groups, each spanning three months. The Lambda-Mu-Sigma (LMS) method was employed to calculate the 3rd, 10th, 25th, 50th, 75th, 90th, and 97th percentiles of height for each age group. Children below the 3rd percentile according to the national growth curve made in 2005 were considered to be short stature. The heights of boys and girls in Zhuzhou were compared with the national average heights from 2005. The height growth curve was constructed using the curve estimation function of SPSS software and the influencing factors for the prevalence of short stature were identified using logistic regression analysis based on data obtained from parental questionnaires.
Results: The prevalence of short stature among children aged 6–12 years in Zhuzhou was found to be 3.97%. Boys exhibited a significantly higher incidence of short stature at 4.53% compared to girls at 3.37%. Children residing in suburban areas showed a notably higher prevalence of short stature (5.80%) compared to their urban counterparts (3.67%), with these disparities proving statistically significant. Logistic regression analysis identified several contributing factors for short stature in this population, including low birth weight, inadequate daily physical activity (less than 0.5 h), father's educational qualification of junior college level or below, short stature of parents, insufficient sleep duration, and male gender.
Conclusion: To improve children's height in Zhuzhou, it's important for them to exercise for over 30 min daily and sleep for more than 10 h each night. Regular monitoring of growth and nutrition is crucial. Health education for families with less educated fathers and early intervention for children with short-statured parents are also key strategies.
Height serves as a primary indicator of physical growth in children, playing a crucial role in assessing their nutritional status and overall health. Adherence to established height standards enables the identification of growth retardation in children, which remains a significant public health concern globally and within specific regions. Regional studies within our country have demonstrated varying rates of growth retardation, underscoring disparities in height distribution (1). Notably, there are currently no research reports on the height status incidence rates or influencing factors of short stature among school-aged children in Zhuzhou.
This study utilizes SPSS software to conduct curve fitting analysis on height data collected from children aged 6–12 years in Zhuzhou. The aim is to characterize the regional height distribution in this age group and compare it with national data. Additionally, through parent surveys, the study focuses on factors that contribute to short stature among children in the area. These findings aim to provide a theoretical foundation for developing targeted health interventions aimed at reducing the incidence of short stature in this city.
The data analyzed for this study were obtained from the 2022 Zhuzhou City general survey of physical growth among school-aged children aged 6–12. The survey encompassed 115,227 children from 110 elementary schools, employing a cluster sampling approach. Data collected included information on gender, age, and height. Exclusion criteria were applied to children younger than 6 or older than 12 years and 2 months; non-residents of Zhuzhou; and those with specific conditions such as limb disabilities, cardiopulmonary diseases, chromosomal disorders, congenital diseases, skeletal development disorders, or severe intellectual disabilities. Ultimately, the study included 106,864 children comprising 55,734 boys and 51,130 girls. Among them, 91,633 attended urban schools within Zhuzhou (47,714 boys and 43,920 girls), while 15,230 attended suburban schools (8,020 boys and 7,210 girls). Children were categorized into 25 age groups based on gender, with each group representing a three-month age increment from 6 years up to 12 years.
Height measurements were conducted uniformly by trained staff using standardized instruments that were calibrated according to established protocols. The specific measurement methods adhered to guidelines outlined in Pediatric Health Care (4th edition) (2).
Human height data are skewed distribution data, thus initially requiring the application of the coefficient of skewness-median-coefficient of variation (CSMCV, LMS) (3, 4). Data normalization was achieved through Box-Cox transformation, typically performed using LMS software, or mathematical formulas. This transformation estimates the parameter λ (often using maximum likelihood estimation), yielding an optional λ value (denoted as L). Age, serving as the independent variable for grouping in anthropometric data, was utilized to fit L values across all age groups into a smooth curve. Subsequently, the M (median) and S (coefficient of variation) values for each age group were derived and integrated into the M curve and S curve (5).
Using the LMS formula: C100a(t) = M(t)[1 + L(t)S(t)Zα][1/L(t)], the percentile values corresponding to specific Zα values (where Zα represents normal deviations for tail areas P3, P10, P25, P50, P75, P90, and P95 with Z values −1.88, −1.28, −0.67, 0, 0.67, 1.28, and 1.88 respectively), were calculated (6). Here, C100a represents the percentile corresponding to Zα. The variables t denotes age, M(t), L(t), and S(t) represent the corresponding M, L, and S values, respectively. By substituting these values into formula (1), the respective percentiles can be calculated. This calculation methodology follows the approach details by Lei (7).
In this study, the L, M, and S curves were not graphically plotted; the L, M, and S values for each age group were computed using described formula, thereby determining the corresponding percentile for each age category. This study's curve fitting process utilized SPSS 23.0 software. Initially, organized age and percentile height data were grouped by age and imported into the SPSS data window. The ‘Analysis' dropdown menu was assessed where ‘Regression’ and ‘Curve Estimation’ options were selected to determine the most appropriate fitting model. Subsequently, percentile values for the height of boys across each age group —specifically the 3rd (P3), 10th (P10), 25th (P25), 50th (P50), 75th (P75), 90th (P90), and 97th (P97) percentiles — were imported and used to generate the respective curves based on the selected model. Final adjustments to the curves were made using the ‘Apply Template’ function following the method described by Chang (8).
Four evaluation methods were utilized in order to assess the effectiveness of the constructed curves. Firstly, the curve fitting models were evaluated based on the coefficient of multiple correlation (R) where a value closer to 1 indicates a better fit (9). Secondly, the relative error between measured values and fitted curve values was computed; a smaller relative error indicates a more accurate fit. Thirdly, the mean absolute percentage error (MAPE) was calculated using the formula MAPE = (1/n) * Σ (|measured value—fitted value|/measured value) * 100, where n is the sample size, with a lower MAPE value indicating better accuracy fit (10). Finally, the intra-class correlation coefficient (ICC) was determined to assess consistency between measured values and fitted values, with an ICC >0.9 indicating high consistency and a significance level (P < 0.05) indicating statistically significant differences (11).
The diagnostic criterion for short stature in this study is defined as a height below the 3rd percentile (P3) of the 2005 national height growth curve for nine cities. To identify the potential influencing factors of short stature, parental questionnaires were distributed concurrent with the census and voluntarily completed, resulting in 26,757 valid responses. The questionnaire included variables such as gender, gestational age (preterm, full-term, and post-term), birth weight (< 2.5 kg, 2.5–4 kg, and >4 kg), history of allergies, daily duration of physical activity (< 0.5 h, 0.5–1 h, and >1 h), sleep duration at night (< 8 h, 8–10 h, >10 h), mother's height, father's height, father's educational background (junior college and below, bachelor's degree, and graduate degree), and mother's educational background (junior college and below, bachelor's degree, and graduate degree). Binary logistic regression analysis was utilized to identify factors influencing the incidence of short stature. Among them, 15,010 parent questionnaires provided valid responses regarding annual household income, which was categorized into four groups based on the 2022 Zhuzhou City Statistics Bureau data: below 48,000 yuan, 48,000–120,000 yuan, 120,000–240,000 yuan, and above 240,000 yuan.
The short stature rates between urban and suburban areas and between boys and girls were compared using the Chi-square test. Binary logistic regression, stature in combination with the parental questionnaire, was used to analyze the influencing factors of the prevalence of short stature.
Figures 1A,B depict the growth curves for boys’ and girls’ height in Zhuzhou, constructed using SPSS software. Each curve in the diagrams includes seven lines arranged vertically, representing the percentiles P3, P10, P25, P50, P75, P90, and P97 respectively. These curves exhibit smooth trajectories and consistent trends, reflecting highly satisfactory fitting results.
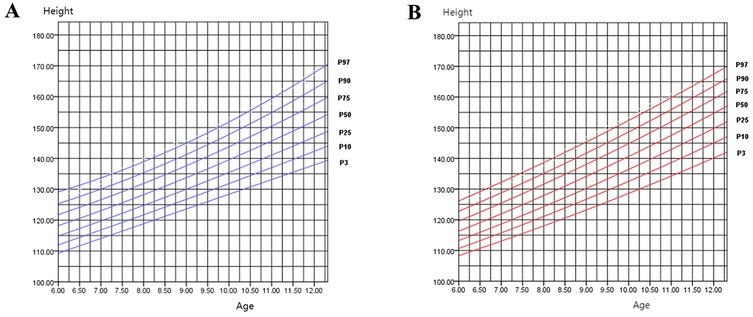
Figure 1. (A) Height percentile curve for boys aged 6–12 in Zhuzhou city; (B) height percentile curve for girls aged 6–12 in Zhuzhou city.
Table 1 presents the parameters of the fitting models for boys’ percentile curves, where R2 values exceed 0.9, indicating significant statistical reliability of the constructed models (P < 0.001). Among the models evaluated, the quadratic and cubic models exhibit the highest R values. The linear model also shows a notable R value, possibly due to capturing the gradual linear growth phase typical in children aged 6–12. Based on the methodology outlined by Chang et al., a quadratic model was selected to construct the boys’ height percentile curve, while a regression model was chosen for the girls’ height percentile curve (8).
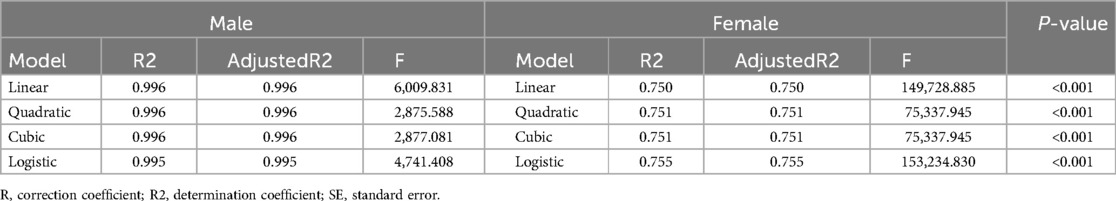
Table 1. Parameters for children's growth curve fitting model.
Using boys as an example to assess the fitting quality of the height curve, Table 2 provides the fitted values and measured values of boys’ heights at P10, P50, and P90 percentiles across each age group, calculated using the LMS method. The relative error of the fitted values at these percentile for each age group is consistently below 1%.
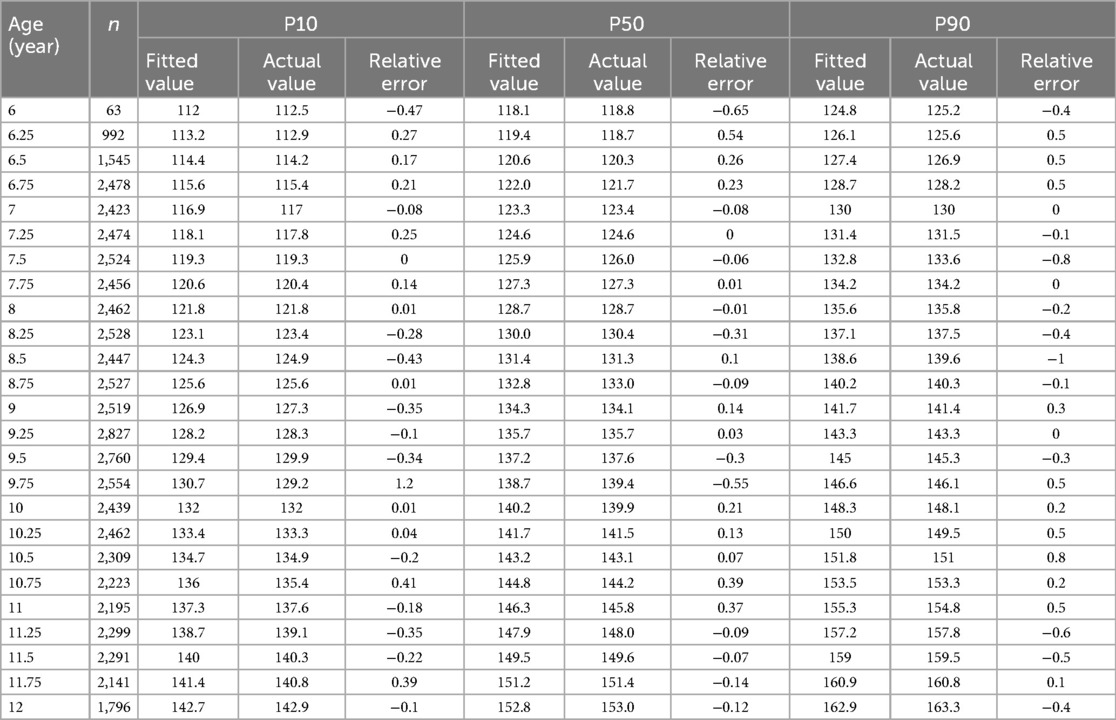
Table 2. Measured values, fitted values, and relative error for heights P10, P50 and P90 of boys aged 6–12 in Zhuzhou city.
Table 3 displays the MAPE values comparing different percentile fitted values with measured values across age groups. The MAPE values for P3 to P97 are all below 1%, suggesting highly accurate curve fitting results.

Table 3. MAPE between percentile estimates and measured values.
In Table 4, the Intra-class Correlation Coefficient (ICC) is presented for fitted values of boys’ heights at P10, P50, and P90 percentiles compared to actual values across ages 6–12. All ICC values are close to 1, with P < 0.001. These findings collectively affirm the effectiveness of the curve fitting process.
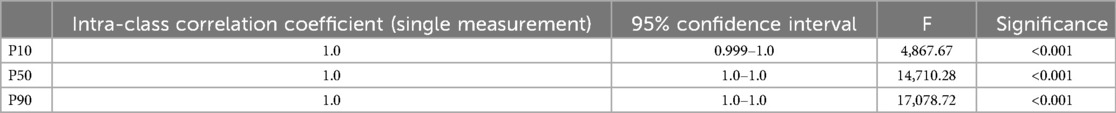
Table 4. Consistency comparison of measured and fitted values for heights P10, P50, and P90 Among boys in different Age groups.
Figure 2 illustrates that girls in Zhuzhou surpass the boys in height at approximately 8.75 years of age at P50 percentile level. Figures 3A,B compare the heights of boys and girls in Zhuzhou with the national average heights from 2005. It is observed that boys in Zhuzhou are slightly below the national average from ages 6–11 but exceed it after age 11. Girls in Zhuzhou are slightly below the national average from ages 6–9.5 but exceed it after 9.5 years of age.
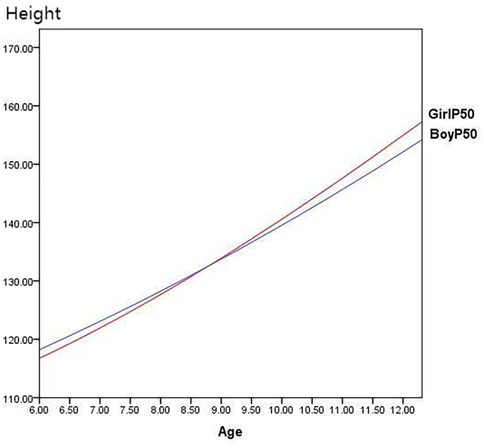
Figure 2. Comparison of P50 height between boys and girls in Zhuzhou city.
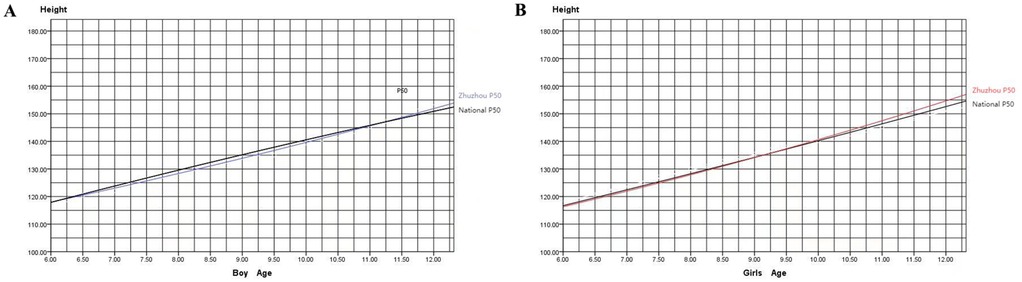
Figure 3. (A) Comparison of heights between boys aged 6–12 in Zhuzhou city and the national average; (B) comparison of heights between girls aged 6–12 in Zhuzhou city and the national average. Note: The blue curve represents Zhuzhou city boys, the red curve represents Zhuzhou city girls, and the black curve represents the 2005 national growth curve.
In Zhuzhou, the overall incidence of short stature among children aged 6–12 is 3.98% (4,248/106,864). Specifically, the urban incidence is 3.67% (3,365/91,633), while the suburban incidence is higher at 5.80% (883/15,230). Table 5 highlights that in both urban and suburban areas, boys have significantly higher incidences of short stature compared to girls, with the suburban incidence also significantly higher than urban incidence, indicating statistically significant differences.
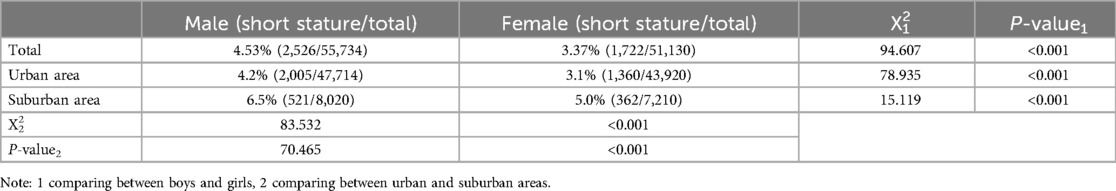
Table 5. Comparison of short stature rates Among children aged 6–12 in zhuzhou city.
Binary logistic regression analysis detailed in Table 6 demonstrates that gestational age (full-term and post-term) were not included in the model equation. The Hosmer-Lemeshow test showed a chi-squared value of 5.472 with a P-value of 0.706 (> 0.05), indicating a good model fit. The analysis identifies independent risk factors for short stature including birth weight <2.5 kg, daily physical activity <0.5 h, father's education background of junior college or below, being male, and underweight (body mass index <P5). Conversely, parents’ height, genetic target height (for boys: Height (cm) = (mother's height + father's height + 13)/2, for girls: Height (cm) = (mother's height + father's height—13)/2), and sleep duration of 8–10 h (compared to >10 h) are negatively associated with short stature. Notably, gestational age and allergy history show no significant correlation with the incidence of short stature in this population.
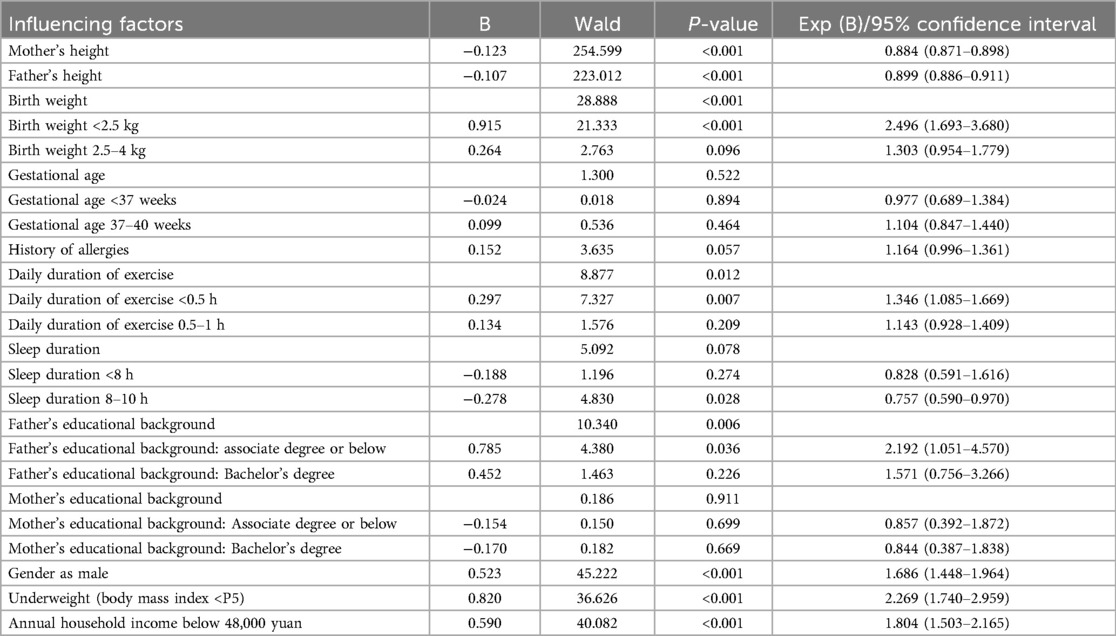
Table 6. Influencing factors of stunted growth in children aged 6–12 in Zhuzhou city.
Additionally, we analyzed the relationship between annual household income and the prevalence of short stature using the 15,010 parent questionnaires with valid income responses. The chi-square test results indicated that the proportion of children with short stature was higher among households with an annual income below 48,000 yuan compared to those without short stature, and the difference was statistically significant (Table 7). Binary regression analysis also revealed that an annual household income below 48,000 yuan is an independent risk factor for short stature (Table 6).
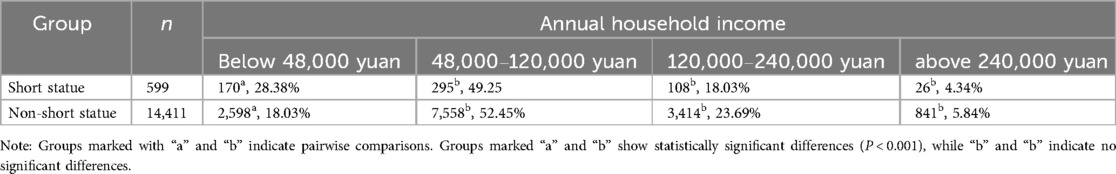
Table 7. Chi-square test of the relationship between annual household income and short statue.
Compared to national averages, the heights at the P50 percentile level for boys and girls aged 6 to 12 in Zhuzhou are consistently below the national level before puberty, indicating that the overall height of children in Zhuzhou lags behind the national average of 2005. However, after approximately age 11 for boys and age 9 for girls, the heights in Zhuzhou exceed the national average. This could be associated with earlier onset of sexual development in children influencing the growth patterns.
In the 2005 national growth curves from nine cities, girls typically surpass boys in height around 10.5 years of age with boys catching up and surpassing girls after 12.5 years of age, reflecting a typical pattern of earlier onset of puberty in girls than boys by approximately two years. Comparatively in Zhuzhou, the average height of girls exceeds that of boys after 8.75 years.
Similar findings have been observed by other regions by researchers such as Zhang (12) in Hanzhong, Shanxi, where girls’ heights gradually exceeds boys’ height around age 9, and by Li in Changsha, where girls aged 6–14 show higher heights between ages 9 and 11 (12, 13). These observations may be linked to the global trend of earlier onset of puberty and increasing incidence of central precocious puberty (14–17). The 2022 Chinese expert consensus on the diagnosis and treatment of central precocious puberty has revised the diagnostic age for girls to 7.5 years, emphasizing the importance of monitoring sexual development in children during physical surveys (18). Early detection and intervention of precocious puberty are anticipated to positively impact final adult height outcomes.
The 2021 meta-analysis covering 20 provinces, municipalities, and autonomous regions in China revealed a national overall incidence of short stature is 3.2%, with rural children exhibiting higher incidence compared to urban children (4.7% vs. 2.8%). Regional disparities were notable, with the Southwest region reporting the highest incidence (5.2%) followed by Central China (2.3%), East China (2.9%), and the Northeast (0.6%) (1). In Zhuzhou, the overall incidence of short stature stands at 4%, slightly higher than the national average with urban and suburban incidences at 3.7% and 5.8%, respectively. Logistic regression analysis identified several factors influencing short stature including lower parental heights, shorter genetic target height, shorter sleep duration and lesser weekly exercise consistent with broader patterns observed in child growth dynamics. The odds ratio EXP(B) from logistic analysis highlighted birth weight under 2.5 kg as the most significant risk factor for short stature. International studies corroborate that low birth weight, associated generally with maternal gestational health, nutritional status, lifestyle, and fetal nutrition, increases the likelihood of shorter stature, underscoring the importance of maternal health monitoring during gestation and vigilance in monitoring the growth of low birth weight children (19, 20). Malnutrition is also a risk factor for stunting in children aged 6–12 years, consistent with the findings of EI-Shafie et al. (21) Strengthening nutritional management for primary school students may thus contribute to height growth. Additionally, lower paternal education and low household annual income emerged as a risk factor for short stature, aligning with finding from Huang's study (22). Studies suggest that lower paternal education correlates with higher screen time and reduced physical activity among children (23, 24). In contrast, families where the father has received higher education often enjoy better economic conditions and nutritional status which may promote better physical growth in children (The father's level of education may have a more significant impact on the incidence of short stature in children compared to the mother's educational level due to traditional family values in China, where men often hold higher family status).
This study did not find significant associations between preterm birth, allergic diseases, and short stature among children aged 6–12 in Zhuzhou. While asthma has been linked to short stature in some studies, specific dermatitis showed no correlation (25, 26). However, the study acknowledges limitations such as non-classification of allergic diseases in the questionnaire and potential biases due to cluster sampling and low response rates to parental questionnaires. Further studies should address these limitations to refine understanding and interventions aimed at reducing short stature incidence effectively.
In conclusion, the average height of children aged 6–12 in the Zhuzhou area remains below the national average of 2005. In addition, the incidence of short stature is higher than national level compared to the meta-analysis in 2021. To address this, it is essential to ensure that children engage in more than half an hour of physical exercise daily and achieve over ten hours of sleep per night. Additionally, early monitoring and management of growth and development, as well as prioritizing the monitoring and management of nutritional status in primary school students, are crucial for children with low birth weight. Enhancing health education for families with less educated fathers and initiating early monitoring and intervention for children with short-statured parents are also vital strategies. These measures are likely to improve the height outcomes for children in Zhuzhou.
The raw data supporting the conclusions of this article will be made available by the authors, without undue reservation.
The studies involving humans were approved by this study was conducted with approval from the Ethics Committee of Zhuzhou Hospital Affifiliated to Xiangya Medical College (ZZCHEC2021121-01). The studies were conducted in accordance with the local legislation and institutional requirements. Written informed consent for participation in this study was provided by the participants’ legal guardians/next of kin.
X-mY: Data curation, Formal Analysis, Investigation, Writing – original draft, Writing – review & editing. QT: Formal Analysis, Investigation, Methodology, Writing – review & editing. Y-cY: Conceptualization, Data curation, Formal Analysis, Writing – original draft. X-LW: Conceptualization, Funding acquisition, Methodology, Writing – original draft, Writing – review & editing.
The author(s) declare financial support was received for the research, authorship, and/or publication of this article. Zhuzhou City Health Talents “135” Project Special Fund in 2020.
We would like to acknowledge the hard and dedicated work of all the staff who implemented the intervention and evaluation components of the study.
The authors declare that the research was conducted in the absence of any commercial or financial relationships that could be construed as a potential conflict of interest.
All claims expressed in this article are solely those of the authors and do not necessarily represent those of their affiliated organizations, or those of the publisher, the editors and the reviewers. Any product that may be evaluated in this article, or claim that may be made by its manufacturer, is not guaranteed or endorsed by the publisher.
SPSS, statistical product and service solutions; LMS, coefficient of skewness-median-coefficient of variation; MAPE, mean absolute percentage error; ICC, intra-class correlation coefficient.
1. Li F, Liu K, Zhao Q, Chen J, Liu L, Xie Q, et al. Prevalence of short stature among children in China: a systematic review. Pediatr Investig. (2021) 5(2):140–7. doi: 10.1002/ped4.12233
2. Mao M, Jiang F. Child Health Care. 4th Ed. Beijing: People’s Medical Publishing House (2020). p. 65–72.
3. Cole TJ. Figmg smoothed centile curves to reference data. J R Statist Soc A. (1988) 151:385–418. doi: 10.2307/2982992
4. Cole TJ, Freeman JV, Preece MA. Body mass index reference curves for UK, 1990. Arch Dis Child. (1995) 73:25–9. doi: 10.1136/adc.73.1.25
5. Cole TJ. The LMS method for constructing normalized growth standards. Eur J Clin Nutr. (1990) 44(1):45–60.2354692
6. Cole T J. Using the LMS method to measure skewness in the NCHS and Dutch national height standards. Ann Hum Biol. (1989) 16(5):407–19. doi: 10.1080/03014468900000532
7. Shang L, Xu YY, Chen CS, Zhang SP, Zhou YR, Li SD, et al. The body weight percentile curve of 0∼18 years old population in Xi `an was established by LMS method. Chin J Health Stat. (2000) 17(1):8–10. doi: 10.3969/j.issn.1002-3674.2000.01.003
8. Chen C, Wei M, Liu SJ, Jin XM. The growth curve of children was quickly constructed with SPSS software. Appl Psychol Meas. (2009) 29(3):279–82. doi: 10.3724/SP.J.1008.2009.00279
9. Zhang SQ. Discussion on goodness of fit index of curve regression. Chin J Health Stat. (2002) 01:9–11. doi: 10.3969/j.issn.1002-3674.2002.01.003
10. De Myttenaere A, Golden B, Le Grand B, Rossi F. Using the mean absolute percentage error for regression models. jneucom.2015.12.114.
11. Endo Y, Ito A, Hotta S, Yakabi A, Onoda K, Tani H, et al. Intraclass correlation coefficient of trunk muscle thicknesses in different positions measured using ultrasonography. J Phys Ther Sci. (2021) 33(3):283–7. doi: 10.1589/jpts.33.283
12. Zhang L, Ma WW, Wang J, Zhang Q. Height characteristics and incidence of short stature in children aged 3∼12 years in Hanzhong city. Hainan Med J. (2023) 34(3):404–8. doi: 10.3969/j.issn.1003-6350.2023.03.026
13. Li Y, Chen Y, Xu X, Tan B, Liu Y, Peng X, et al. Analysis of prevalence, influencing Factors, and countermeasures of short stature in children and adolescents aged 6–14 in Furong district, Changsha city, in 2020. Evid Based Complement Alternat Med. (2021) 2021:3933854. doi: 10.1155/2021/3933854
14. Cheuiche AV, da Silveira LG, de Paula L, Lucena IRS, Silveiro SP. Diagnosis and management of precocious sexual maturation: an updated review. Eur J Pediatr. (2021) 180(10):3073–87. doi: 10.1007/s00431-021-04022-1
15. Liu Y, Yu T, Li X, Pan D, Lai X, Chen Y, et al. Prevalence of precocious puberty among Chinese children: a school population-based study. Endocrine. (2021) 72(2):573–81. doi: 10.1007/s12020-021-02630-3
16. Pu JQ, Zhang JW, Chen RM, Mireguli MMT, Luo JS, Chen SK, et al. A survey of height and weight status of urban children in different tanner stages in China. Chin J Pediatr. (2021) 59(12):1065–73. doi: 10.3760/cma.j.cn112140-20210525-00453
17. Eckert Lind C, Busch AS, Petersen JH, Biro FM, Butler G, Bräuner EV, et al. Worldwide secular trends in age at pubertal onset assessed by breast development among girls: a systematic review and meta-analysis. JAMA Pediatr. (2020) 174(4):e195881. doi: 10.1001/jamapediatrics.2019.5881
18. Endocrinology, Genetics and Metabolism Group. Expert consensus on the diagnosis and treatment of central precocious puberty (2022). Chin J Pediatr. (2023) 61(1):16–22. doi: 10.3760/cma.j.cn112140-20220802-00693
19. Majcher A, Pyrżak B, Bielecka-Jasiocha J, Witkowska-Sędek E. Mała urodzeniowa masa ciała–dodatkowy ważny czynnik w diagnostyce niedoboru wzrostu u dzieci low birth weight–additional important factor of diagnosis in children with short stature. Pediatr Endocrinol Diabetes Metab. (2010) 16(3):148–52.21092691
20. Diabelková J, Rimárová K, Urdzík P, Dorko E, Houžvičková A, Andraščíková Š, et al. Risk factors associated with low birth weight. Cent Eur J Public Health. (2022) 30(Supplement):S43–9. doi: 10.21101/cejph.a6883
21. El-Shafie AM, Kasemy ZA, Omar ZA, Alkalash SH, Salama AA, Mahrous KS, et al. Prevalence of short stature and malnutrition among Egyptian primary school children and their coexistence with Anemia. Ital J Pediatr. (2020) 46(1):91. doi: 10.1186/s13052-020-00855-y
22. Huang S, Chen Z, Chen R, Zhang Z, Sun J, Chen H. Analysis of risk factors and construction of a prediction model for short stature in children. Front Pediatr. (2022) 10:1006011. doi: 10.3389/fped.2022.1006011
23. Chen Q, Zhang JF. The influence of family-related factors on weekend video viewing time of preschool children. Chin J School Health. (2020) 41(2):194–6. doi: 10.16835/j.cnki.1000-9817.2020.02.009
24. Fernández-Alvira JM, Te Velde SJ, Singh A, Jiménez-Pavón D, De Bourdeaudhuij I, Bere E, et al. Parental modeling, education and children’s sports and TV time: the ENERGY-project. Prev Med. (2015) 70:96–101. doi: 10.1016/j.ypmed.2014.11.021
25. Ferguson AC, Murray AB, Tze WJ. Short stature and delayed skeletal maturation in children with allergic disease. J Allergy Clin Immunol. (1982) 69(5):461–6. doi: 10.1016/0091-6749(82)90122-1
Keywords: growth curve, height, incidence of short stature, influencing factors, school-aged children
Citation: Ye X-m, Tang Q, Yang Y-c and Wen X-L (2025) Research on the height of primary school students in Zhuzhou and analysis of influencing factors of short stature. Front. Pediatr. 13:1448309. doi: 10.3389/fped.2025.1448309
Received: 13 June 2024; Accepted: 20 January 2025;
Published: 18 February 2025.
Edited by:
Arzu Uzuner, MARSEV MArmara Health Education and Research Center, TürkiyeReviewed by:
Chetna Mangat, Mayo Clinic, United StatesCopyright: © 2025 Ye, Tang, Yang and Wen. This is an open-access article distributed under the terms of the Creative Commons Attribution License (CC BY). The use, distribution or reproduction in other forums is permitted, provided the original author(s) and the copyright owner(s) are credited and that the original publication in this journal is cited, in accordance with accepted academic practice. No use, distribution or reproduction is permitted which does not comply with these terms.
*Correspondence: Xiang-Lan Wen, d2VueGlhbmdsaWFud3hsQDEyNi5jb20=
Disclaimer: All claims expressed in this article are solely those of the authors and do not necessarily represent those of their affiliated organizations, or those of the publisher, the editors and the reviewers. Any product that may be evaluated in this article or claim that may be made by its manufacturer is not guaranteed or endorsed by the publisher.
Research integrity at Frontiers
Learn more about the work of our research integrity team to safeguard the quality of each article we publish.