 Emma E. Williams
 Theodore Dassios
 Christopher Harris1,2
 Anne Greenough
95% of researchers rate our articles as excellent or good
Learn more about the work of our research integrity team to safeguard the quality of each article we publish.
Find out more
PERSPECTIVE article
Front. Pediatr. , 04 April 2024
Sec. Neonatology
Volume 12 - 2024 | https://doi.org/10.3389/fped.2024.1396846
End-tidal capnography can provide useful clinical information displayed on the ventilator screen or bedside monitor. It is important that clinicians can assess and utilise this information to assist in identifying underlying complications and pulmonary pathology. Sudden change or loss of the CO2 waveform can act as a safety measure in alerting clinicians of a dislodged or blocked endotracheal tube, considering the concurrent flow and volume waveforms. Visual pattern recognition by the clinicians of commonly seen waveform traces may act as an adjunct to other modes of ventilatory monitoring techniques. Waveforms traces can aid clinical management, help identify cases of ventilation asynchrony between the infant and the ventilator. We present some common clinical scenarios where tidal capnography can be useful in the timely identification of pulmonary complication and for practical troubleshooting at the cot-side.
Tidal capnography is a non-invasive method to continuously measure exhaled carbon dioxide (CO2) via a CO2 sensor which is placed between the endotracheal tube (ETT) and the ventilator circuit. Historically, there has been some scepticism on the accuracy of capnography in neonatal care, based on technological limitations rising from the very small tidal volumes and high breathing rates of neonates, especially the more preterm ones. Recent advances have largely addressed these limitations and have enabled more widespread use of capnography within neonatal care (1).
Maintenance of CO2 within the desired range is clinically important in the newborn to avoid the adverse outcomes associated with too high or too low CO2 levels (2, 3). As CO2 is a potent moderator of cerebral vascular tone, both extremes can lead to detrimental side effects such as intraventricular haemorrhage (IVH) and periventricular leucomalacia (4). Moreover, fluctuations of CO2 during the early days of life or during initial stabilisation in the delivery room have been strongly associated with the development of IVH (5).
Waveform capnography can provide information over and above a solitary value of exhaled carbon dioxide, and it is important that clinicians at the bedside can interpret the contemporaneous and stored/trend information which can be provided by the capnography waveform (6). Clinical real-time interpretation of waveforms may identify life threatening complications of mechanical ventilation such as dislodged or blocked ETT (7), or describe established or impending lung pathologies (8). The CO2 waveforms are more useful when evaluated with the concurrent flow, volume and pressure waveforms (9), although not all ventilators present them at a synchronous scale. This short overview aims to cover the practical basics of neonatal capnography, providing an aid for clinicians asking the following question: “In newborn infants requiring mechanical ventilation, what value does the capnography waveform have in supporting diagnosis and clinical troubleshooting?”
Both main- and side- stream capnographs are placed in-line with the ventilator circuit, between the ETT and ventilator tubing (10). The difference between them is where the CO2 is analysed. In mainstream capnographs, there is an infra-red sensor that sits in-line with the capnograph, and analysis is undertaken in real time. In sidestream capnographs, there is a sample line which exports exhaled gas to an infra-red analyser away from the ventilator circuit (8). There can be a small time delay in reading due to the transit time of the CO2 molecules along the sample line to the infra-red sensor. Importantly, with the sidestream capnograph the waveform may be affected by water droplets within the sample line (11), which form as the side-stream tube is cooled outside the incubator, especially in extremely preterm infants who require high incubator humidity.
The capnogram is divided into three phases (Figure 1A). Phase I is the first part of expiration during which gas is expired from the large conducting airways, this phase contains little or no carbon dioxide. Phase II is the second part where there is mixing of gas from the large and small airways, thus exhaled carbon dioxide levels rapidly rise. Phase III is the final part which contains alveolar gas; it is this phase where the end-tidal carbon dioxide (EtCO2) value is determined. A steep phase III occurs if there is ventilation inhomogeneity, as different lung units with differing time constants empty unevenly during expiration (12). The alveolar plateau might be shorter in preterm infants with high breathing rates or absent in spontaneous breaths during synchronised ventilation as expiration might finish before complete emptying of the alveolar gas: in these cases, the EtCO2 will underestimate the “true” alveolar CO2. Interpretation of neonatal tidal capnography should also take into account that in ventilated preterm infants, the correlation between arterial and EtCO2 is acceptable but the agreement is suboptimal with a fixed mean difference of 0.54 kPa between arterial and EtCO2 values (13). Of note, this correlation is negatively influenced by the severity of lung disease, with lower correlation in more severe lung disease (13). Although rarely used in neonatal clinical practice, exhaled CO2 can also be plotted against the expired tidal volume (volumetric capnography) and the resulting capnograms can be used to calculate respiratory dead-space and quantify ventilation inhomogeneity (14).
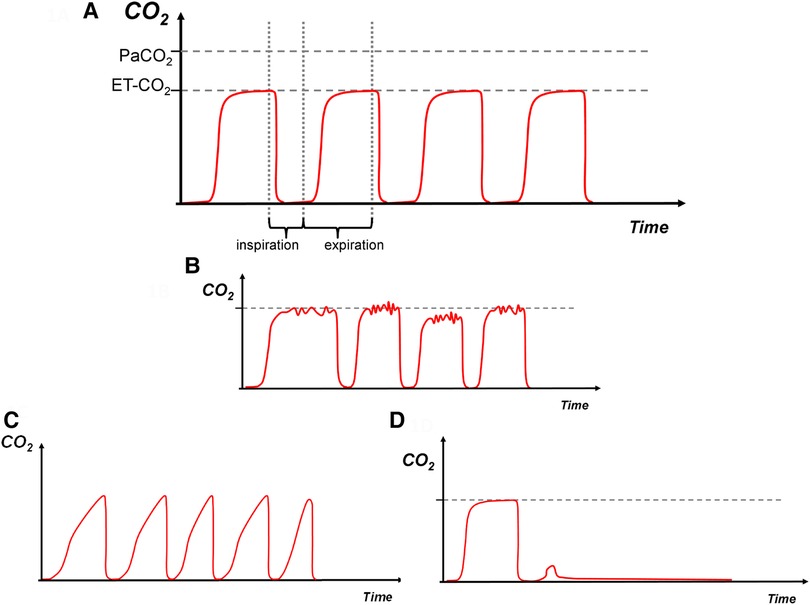
Figure 1. (A)—normal, (B)—water in the circuit, (C)—increased expiratory resistance, (D)—dislodged endotracheal tube. Carbon dioxide on y-axis with time on x-axis. The red trace depicts the capnography waveform. PaCO2: arterial CO2, EtCO2: end tidal CO2.
We present some graphic representations of commonly seen time-based capnograms, based on observed patterns.
Conventional mechanical ventilation inflations in a term infant without respiratory pathology. Inspiratory baseline during phase one followed by a sharp vertical upstroke during the initial expiration of gas from the large conducting airways, followed by a relatively horizontal plateau phase. It is expected that the EtCO2 is lower than the PaCO2 due to some degree of respiratory dead space (Figure 1A).
Water droplets or humidity within the ventilator tubing can lead to turbulent flow and a non-smooth trace as interference occurs (Figure 1B). Removal of the droplets will usually smoothen the signal.
There is a consistent upward slant in the third phase, which can be referred to as a “shark fin” appearance. Commonly seen in cases of ventilation inhomogeneity and increased expiratory resistance such as in bronchopulmonary dysplasia (Figure 1C).
Sudden drop of the waveform trace with loss of EtCO2 as no expired CO2 is detected, may occur if the ETT is dislodged, blocked kinked, or when the ventilator is disconnected from the infant (Figure 1D). This pattern can also occur if there is sudden blockage of the ETT or the infant splints its respiratory muscles enough to prevent an inflation.
Rising baseline with EtCO2 not returning to zero during inspiration; increased re-breathing of CO2 (breathing of expired gas) occurs from low tidal volume or increased apparatus dead space, leading to ineffective removal of CO2 from the circuit. The EtCO2 value rises with consecutive breathing cycles (Figure 2A).
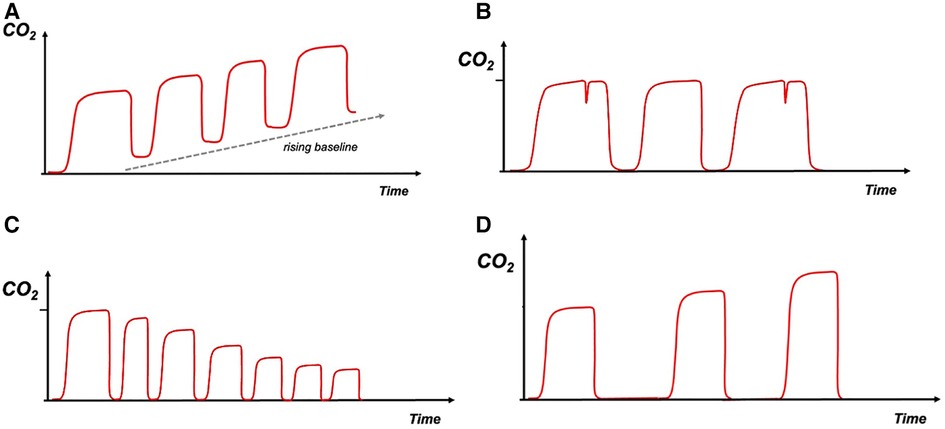
Figure 2. (A)—rebreathing, (B)—infant asynchrony, (C)—hyperventilation, (D)—hypoventilation. Carbon dioxide on y-axis with time on x-axis. The red trace depicts the capnography waveform.
Breathing out of synchrony with the ventilator, could cause a “beaking” pattern on the waveform as the infant tries to inspire during expiration. This pattern can also be seen in cases of inadequate flow to trigger the ventilator (Figure 2B). This type of asynchrony could also be evaluated by the flow and volume waveforms.
Decreasing EtCO2 level and speeding up of the breathing frequency are observed (Figure 2C).
Increasing EtCO2 level and slowing down of the breathing frequency are observed (Figure 2D).
We have presented a practical approach to neonatal tidal capnography used as a clinical adjunct to respiratory monitoring at the cot-side. With the emergence of continuous tidal capnography as a reliable monitoring tool in neonatal intensive care, we believe that the general neonatal audience would benefit from this targeted education on the interpretation of CO2 waveforms.
It is interesting to note that similarly to the clinical estimation of the work of breathing and the utilisation of blood gases and chest radiographs, waveform monitoring holds unique information that describes the respiratory condition of a single subject at a specific time point (1). For example, the slope of phase III of a time capnogram, holds information on ventilation inhomogeneity which is not available from the waveforms of flow, volume or pressure, chest radiograms or blood gas analysis. Although interpretation of the CO2 waveforms can be undertaken taking into consideration the concurrent waveforms of pressure, flow and volume (7), this approach is not always possible in everyday clinical practice as some ventilators do not display the CO2 traces in synchrony with volume and flow, while some other units display the CO2 traces in the monitoring screen rather that the ventilator display.
We should note that unlike some other methods of respiratory monitoring, tidal capnography is non-invasive and provides real-time breath by breath information.
Since CO2 fluctuations during initial stabilisation in the labour ward have been associated with IVH (5), there is significant potential in using capnography as part of standard monitoring after birth. In the current era, furthermore, the majority of preterm infants are managed mostly on non-invasive respiratory support, and during this period high levels of CO2 can be implicated in impaired oxygenation (15). There is scope, thus, in expanding the use of CO2 monitoring during non-invasive support, which will require the future development of novel interfaces and lighter capnographs.
Tidal capnography is arguably not the only way to monitor CO2 and is not possible in high frequency modes due to very high breathing rates. An alternative monitoring method is via transcutaneous CO2 measurement, which measures CO2 at the tissue level and the value is thus closer to the arterial one (16). Tidal CO2 measurements can be influenced by the settings and mode of ventilation as a high breathing frequency may exceed the capnograph's response capabilities, while a significant ETT leak, high airway resistance and respiratory rate may also decrease the accuracy of the measurement (17).
In conclusion, we have described patterns of clinical scenarios where tidal capnography can be useful in diagnosis and troubleshooting at the cot-side.
The data for this study are available for the corresponding authors upon reasonable request.
The studies involving humans were approved by London (Camden and King's Cross) Research Ethics Committee. The studies were conducted in accordance with the local legislation and institutional requirements. Written informed consent for participation in this study was provided by the participants’ legal guardians/next of kin.
EW: Conceptualization, Formal Analysis, Visualization, Writing – original draft. TD: Conceptualization, Methodology, Supervision, Visualization, Writing – review & editing. CH: Conceptualization, Methodology, Writing – review & editing. AG: Conceptualization, Funding acquisition, Investigation, Project administration, Supervision, Writing – review & editing.
The author(s) declare that financial support was received for the research, authorship, and/or publication of this article.
This project was funded by King's College London 2018 Medical Research Council Confidence in Concept Award through the King's Health Partners’ Research and Development Challenge Fund.
The authors declare that the research was conducted in the absence of any commercial or financial relationships that could be construed as a potential conflict of interest.
All claims expressed in this article are solely those of the authors and do not necessarily represent those of their affiliated organizations, or those of the publisher, the editors and the reviewers. Any product that may be evaluated in this article, or claim that may be made by its manufacturer, is not guaranteed or endorsed by the publisher.
1. Williams E, Dassios T, Greenough A. Carbon dioxide monitoring in the newborn infant. Pediatr Pulmonol. (2021) 56:3148–56. doi: 10.1002/ppul.25605
2. Kaiser JR, Gauss CH, Pont MM, Williams DK. Hypercapnia during the first 3 days of life is associated with severe intraventricular hemorrhage in very low birth weight infants. J Perinatol. (2006) 26:279–85. doi: 10.1038/sj.jp.7211492
3. Shankaran S, Langer JC, Kazzi SN, Laptook AR, Walsh M, National Institute of Child H. Cumulative index of exposure to hypocarbia and hyperoxia as risk factors for periventricular leukomalacia in low birth weight infants. Pediatrics. (2006) 118:1654–9. doi: 10.1542/peds.2005-2463
4. Fabres J, Carlo WA, Phillips V, Howard G, Ambalavanan N. Both extremes of arterial carbon dioxide pressure and the magnitude of fluctuations in arterial carbon dioxide pressure are associated with severe intraventricular hemorrhage in preterm infants. Pediatrics. (2007) 119:299–305. doi: 10.1542/peds.2006-2434
5. Tamura K, Williams EE, Dassios T, Pahuja A, Hunt KA, Murthy V, et al. End-tidal carbon dioxide levels during resuscitation and carbon dioxide levels in the immediate neonatal period and intraventricular haemorrhage. Eur J Pediatr. (2020) 179:555–9. doi: 10.1007/s00431-019-03543-0
6. Hagerty JJ, Kleinman ME, Zurakowski D, Lyons AC, Krauss B. Accuracy of a new low-flow sidestream capnography technology in newborns: a pilot study. J Perinatol. (2002) 22:219–25. doi: 10.1038/sj.jp.7210672
7. Schmalisch G. Basic principles of respiratory function monitoring in ventilated newborns: a review. Paediatr Respir Rev. (2016) 20:76–82. doi: 10.1016/j.prrv.2016.01.004
8. Schmalisch G. Neonatal monitoring. In: Paulus DA, Gravenstein JS, Jaffe MB, Gravenstein N, editors. Capnography, 2nd ed. Cambridge: Cambridge University Press (2011). p. 80–95.
9. van Vonderen JJ, van Zanten HA, Schilleman K, Hooper SB, Kitchen MJ, Witlox RS, et al. Cardiorespiratory monitoring during neonatal resuscitation for direct feedback and audit. Front Pediatr. (2016) 4:38. doi: 10.3389/fped.2016.00038
10. van der Heijden HHACM, Truin GJ, Verhaeg J, van der Pol P, Lemson J. Validity of sidestream endtidal carbon dioxide measurement in critically ill, mechanically ventilated children. Pediatric Anesthesia. (2016) 26:294–9. doi: 10.1111/pan.12827
11. Anderson CT, Breen PH. Carbon dioxide kinetics and capnography during critical care. Crit Care. (2000) 4:207–15. doi: 10.1186/cc696
12. Williams EE, Dassios T, Hunt KA, Greenough A. Volumetric capnography pre- and post-surfactant during initial resuscitation of premature infants. Pediatr Res. (2022) 91:1551–6. doi: 10.1038/s41390-021-01578-4
13. Williams E, Dassios T, Greenough A. Assessment of sidestream end-tidal capnography in ventilated infants on the neonatal unit. Pediatr Pulmonol. (2020) 55(6):1468–73. doi: 10.1002/ppul.24738
14. Dassios T, Dixon P, Williams E, Greenough A. Volumetric capnography slopes in ventilated term and preterm infants. Physiol Meas. (2020) 41:055001. doi: 10.1088/1361-6579/ab89c7
15. Dassios T, Williams EE, Kaltsogianni O, Greenough A. Permissive hypercapnia and oxygenation impairment in premature ventilated infants. Respir Physiol Neurobiol. (2023) 317:104144. doi: 10.1016/j.resp.2023.104144
16. Tingay DG, Mun KS, Perkins EJ. End tidal carbon dioxide is as reliable as transcutaneous monitoring in ventilated postsurgical neonates. Arch Dis Child Fetal Neonatal Ed. (2013) 98(2):F161–4. doi: 10.1136/fetalneonatal-2011-301606
Keywords: capnography, infant, end-tidal, ventilation, waveform
Citation: Williams EE, Dassios T, Harris C and Greenough A (2024) Capnography waveforms: basic interpretation in neonatal intensive care. Front. Pediatr. 12:1396846. doi: 10.3389/fped.2024.1396846
Received: 6 March 2024; Accepted: 26 March 2024;
Published: 4 April 2024.
Edited by:
Gianluca Lista, Ospedale dei Bambini Vittore Buzzi, ItalyReviewed by:
Lukas Peter Mileder, Medical University of Graz, Austria© 2024 Williams, Dassios, Harris and Greenough. This is an open-access article distributed under the terms of the Creative Commons Attribution License (CC BY). The use, distribution or reproduction in other forums is permitted, provided the original author(s) and the copyright owner(s) are credited and that the original publication in this journal is cited, in accordance with accepted academic practice. No use, distribution or reproduction is permitted which does not comply with these terms.
*Correspondence: Theodore Dassios dGhlb2RvcmUuZGFzc2lvc0BrY2wuYWMudWs=
Disclaimer: All claims expressed in this article are solely those of the authors and do not necessarily represent those of their affiliated organizations, or those of the publisher, the editors and the reviewers. Any product that may be evaluated in this article or claim that may be made by its manufacturer is not guaranteed or endorsed by the publisher.
Research integrity at Frontiers
Learn more about the work of our research integrity team to safeguard the quality of each article we publish.