 Jascha Wiehn1
 Tobias Kurth1
 Ulrike Ravens-Sieberer2
 Christof Prugger1
 Marco Piccininni1,3
 Franziska Reiss2*
- 1Institute of Public Health, Charité – Universitätsmedizin Berlin, Berlin, Germany
- 2Department of Child and Adolescent Psychiatry, Psychotherapy, and Psychosomatics, University Medical Center Hamburg-Eppendorf, Hamburg, Germany
- 3Center for Stroke Research Berlin, Charité – Universitätsmedizin Berlin, Berlin, Germany
Objectives: Depression is a major contributor of young people's burden of disease. In this study we aim to estimate the effect of elevated depressive symptoms on physical health-related quality of life.
Design: We used self-reported information from the prospective BELLA cohort study, which included adolescents selected from the general population in Germany. The baseline assessment (2003–2006) and the 1-, 2-, and 6-year follow-up waves provide the data basis.
Participants: The baseline study population consisted of 1,460 adolescents between the ages of 12 and 17 who, according to their caregivers, did not suffer from depression.
Variables: The primary outcome, as measured by the physical component score (PCS) of the SF-36 at a 6-year follow-up (range: 0–100), is physical health-related quality of life. The exposure of interest is depressive symptoms, as measured by the Center for Epidemiological Studies Depression Scale for Children (CES-DC) at baseline, 1-year follow-up and 2-year follow-ups (range: 0–60). We dichotomized the exposure into subthreshold (≤15) and elevated depressive symptoms (>15). For the main analyses we considered a cumulative index for elevated depressive symptoms across the three time points (range: 0–3). Considered confounders are sex, age, socioeconomic status, migrant background, social support, anxiety symptoms, physical activity, chronic diseases, and sleeping problems.
Statistical methods: We used multiple imputation to account for missing values. Within each imputed dataset, we applied inverse probability weighting (IPW) to estimate the effect of the cumulative index for elevated depressive symptoms at baseline, 1- and 2-year follow-up on physical health-related quality of life at 6-year follow-up. We derived 95% confidence intervals by bootstrapping.
Results: After adjusting with IPW, the effect of the cumulative index per one unit increase of elevated depressive symptoms on the physical component score was −1.71 (95% CI: −3.51 to −0.04). The adjusted effect estimates of single exposure of elevated depressive symptoms on physical health-related quality of life were −0.83 (95% CI: −3.69 to 1.87) at baseline, −2.96 (95% CI: −4.94 to −0.52) at 1-year follow-up and −1.32 (95% CI: −3.85 to 1.15) at 2-year follow-up.
Conclusion: Findings suggest that elevated depressive symptoms during adolescence decrease physical health-related quality of life in young adulthood.
Introduction
Adolescence is a critical stage of biological, social, behavioral, and psychological changes (1). Vulnerabilities and resiliencies are developed throughout the transition from infancy to maturity (2). This life stage is the foundation for mental health across the life cycle (3), and accomplishments and setbacks during this period are known to shape young people's personalities and wellbeing (4, 5).
At this vulnerable age, depressive symptoms can increase rapidly (6). Thus, if elevated depressive symptoms are to be detected, screening should ideally be repeated at regular intervals (7). Elevated depressive symptoms are characterized by the loss of energy, interest, or pleasure (anhedonia) and the continuous feeling of being sad (low mood) (8). It is estimated that between 30% and 38% of adolescents worldwide suffer from elevated depressive symptoms (9). Experiencing elevated levels of depressive symptoms in adolescence is linked to various adverse health outcomes in young adulthood (10, 11). Among the adverse health outcomes is lower health-related quality of life (12), which can be defined as “how well a person functions in their life and his or her perceived wellbeing in physical, mental, and social domains of health” (13).
Numerous studies have shown that elevated depressive symptoms are associated with lower health-related quality of life. However, many of these studies have recruited adult (14–29), clinical (16, 18–23, 25–28, 30–38), or community samples (14, 15, 24, 29, 39, 40), with limited generalizability. Rarely studies have included children and adolescents from the general population (41). Moreover, it may be challenging to establish causal relationships using cross-sectional data (14–22, 24–27, 29–41), and the few longitudinal studies that exist, recruited at risk youths (42), adult clinical (28) or pregnant samples (23). One cohort study sampling adolescents, found that the elevated depressive symptoms may precede the health-related quality of life domains “ability to cope” and “social relationships”, but not overall health-related quality of life (43). However, the authors did not investigate whether elevated depressive symptoms affect physical health-related quality of life.
Studying the impact of depressive symptoms during adolescence on the physical health-related quality of life in young adulthood holds significant potential in unraveling the factors that influence the well-being of young individuals. This research can provide public health professionals with valuable insights on the physical benefits of good mental health and help them to make informed decisions pertaining to the allocation of resources for prevention strategies that target both mental and physical health. Our study aimed at quantifying the effect of elevated depressive symptoms during adolescence on the physical component of health-related quality of life in young adulthood.
Methods
Study design
The present study is based on longitudinal data from the BELLA cohort study (44). The BELLA study is the mental health module of the German National Health Interview and Examination Survey for Children and Adolescents (KiGGS), which was prepared and conducted by the Robert Koch Institute (Berlin, Germany). The KiGGS study aimed to enroll children and adolescents aged 0–17 years living in Germany, based on their official residence listed in local registration offices (45).
As part of the KiGGS study, the BELLA study is a population-based, nationwide cohort study that collects data on mental health and well-being of children and adolescents in Germany. The baseline assessment took place between 2003 and 2006 (see Figure 1). Three follow-up waves have been conducted one year (2004–2007), two years (2005–2008), six years (2009–2012) and eleven years (2014–2017) after the baseline data collection. This analysis is based on the baseline assessment and the first three follow-up waves. For the BELLA 6-year follow-up, the KiGGS study team had to request caregivers to give an additional informed written consent to be invited, due to new German data protection regulations. 1,891 families gave their consent. The BELLA study team then re-invited 1,679 subjects and 1,429 of those participated at the 6-year follow-up. For further details on the design and procedure of the BELLA or the KiGGS study, please refer to previously published methodology reports (44–46).
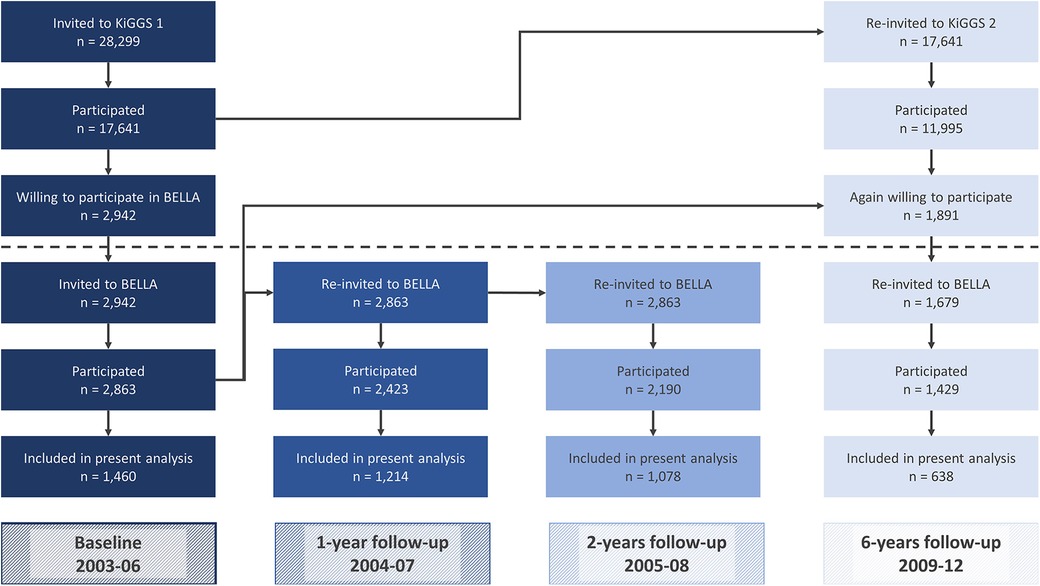
Figure 1 Flow of participants of the KIGGS and the BELLA study as well as participants in the present analysis.
We specified our population of interest based on three inclusion and exclusion criteria: First, adolescents had to participate at baseline. Second, participants had to be aged 12–17 years at baseline. Third, adolescents should not have a parent-reported current or former depression at baseline.
Prior to data collection, written informed consent was obtained from adolescents (aged 14 years or older) and parents to participate in the study. Participation in the survey was voluntary, and respondents could cancel their participation at any time without having to give reasons. The ethics committee of the Charité – Universitätsmedizin Berlin and the Federal Commissioner for Data Protection in Germany approved the study (44).
Variables
Health-related quality of life
The primary outcome of the present study is physical health-related quality of life at 6-year follow-up (18–23 year olds), as measured by the German translation of the version 2.0 of the 36-Item Short Form Survey (SF-36) (47–50). The SF-36 is the most widely used generic instrument to assess health-related quality of life in the general population (51, 52). It is a self-reported multidimensional instrument with 36 items to depict vitality, bodily pain, general health perceptions, mental health, physical functioning, physical role functioning, emotional role functioning, and social role functioning. These eight health domains yield in two summary scores: the physical component score (PCS) and the mental component score (MCS) (53). Out of 36 items, 21 items are summed to calculate the PCS and 14 items are summed to calculate the MCS. The item that measures how general health status changed over the past year is not applied. Both summary scores can range from 0 to 100, with a higher score indicating better quality of life within the last four weeks. In this investigation, we rely on the PCS as the outcome of interest. Both the original English and the German version of the SF-36 showed good psychometric proprieties in terms of validity and reliability (49, 54–56).
Depressive symptoms
The exposure of interest was depressive symptoms, as measured by self-reported depressive symptoms assessed at baseline, 1- and 2-year follow-ups using the German version of the Center for Epidemiological Studies Depression Scale for Children (CES-DC) (57–59). The CES-DC is a widely-used self-reported screening tool that measures six domains of depressiveness through 20 items (60). The CES-DC is adapted from the CES-D, which is a depression screening tool for adults (61). The items of the CES-DC refer to depressive symptoms experienced in the past week, and responses are recorded on a four-point Likert scale. Four of the items are phrased positively and are reverse-coded for scoring. The total score ranges from 0 to 60, with higher scores indicating greater depressiveness. The German CES-DC has been shown to be a reliable and valid instrument, and self-reported data is considered more valid than parental information (59). To analyze the data, the CES-DC scores at each exposure time point were dichotomized using the Weissmann cut-off of >15 (58), which is optimal for screening children and adolescents for current major depressive disorder or dysthymia (62). For the modelling, we summarized the exposure at the three measurement times into a cumulative exposure index cum(ā) counting the number of times the participant had a CES-DC score higher than the threshold. This results in a range from 0 (never elevated depressive symptoms) to 3 (elevated depressive symptoms at all three measurement points).
Covariates
To identify confounding variables, we drew a directed acyclic graph (DAG) to represent our assumptions about the data generation process (63). The DAG is schematically represented in Figure 2. We identified both time-fixed confounders (Z) and time-varying confounders (L). Further information about the use of DAGs can be found elsewhere (63–68).
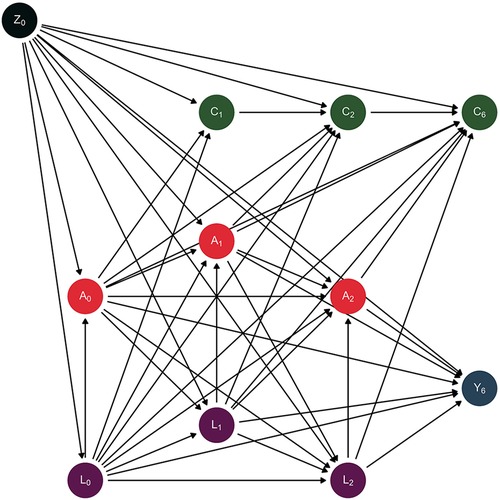
Figure 2 Directed acyclic graph depicting the assumed data generation process. Causal direct effects are represented by arrows.
We considered as time-fixed confounders the following variables: biological sex (male, female), socioeconomic status (SES-Index, range: 3–21, measured by parental education, household income and parental employment) (69), migrant background (yes, no) (70), and age (years). These parent-reported covariates were measured at baseline. We considered as time-varying confounders the following variables: anxiety symptoms (range: 0–10; The Screen for Child Anxiety Related Emotional Disorders – SCARED-5) (71, 72), social support (range: 1–5; Social Support Survey) (73, 74), physical activity (hours per week), chronic diseases or disability (yes, no), and sleeping problems (yes, no). These time-varying confounding variables were all self-reported and measured at baseline, 1- and 2-year follow-up waves. Finally, censoring (C) is also depicted as non-participation (yes, no) at 1-, 2- and 6-year follow-up.
The graph visualizes the assumed causal relationship between elevated depressive symptoms (A) and physical health-related quality of life (Y) as well as time-fixed confounders (biological sex, socioeconomic status, migrant background, age; Z), time-varying confounders (anxiety symptoms, social support, physical activity, chronic diseases or disability, sleeping problems; L) and censoring (non-participation; C). The subscript numbers correspond to the respective time of measurement at baseline (Z0, A0, L0), 1-year follow-up (C1, A1, L1), 2-year follow-up (C2, A2, L2) or 6-year follow-up (C6, Y6).
Statistical methods
Our statistical analysis consisted of three main steps. First, we used multiple imputation to handle missing information due to non-response. Second, within each of the imputed datasets we used inverse probability weighting (IPW) to account for exposure-confounder-feedback and differential loss to follow-up. Third, we estimated the unadjusted and adjusted effect of different patterns of depressive symptoms over a period of two years on the physical component of health-related quality of life at six years follow-up.
Multiple imputation
Overall, 22% of the raw data was missing (see Supplementary S1 for the proportion of missing values in each variable). Complete data for all time points was available for 250 individuals. Information was either missing because (i) participants did not attend the follow-up (non-participation) or (ii) they did not provide information when they attended (non-response). Under a missing at random (MAR) assumption (75), we used multiple imputation by chained equations (76) with five imputed datasets to impute the missing values for individuals who were not lost to follow up but did not give information (non-response). In order to create a closed cohort, we considered a participant lost to follow-up if he or she did not participate in a visit, regardless of participation to following visits, even if this caused a loss of information. We imputed missing values due to non-response for those subjects who were not lost to follow-up using the baseline variables of sex, age, socioeconomic status, migrant background, social support, anxiety symptoms, physical activity, chronic diseases, sleeping problems, and depressive symptoms. After imputing missing values, the overall percentage of missing data in the whole dataset decreased to 15.3%. We could therefore include 546 complete cases in the main analysis.
Inverse probability weighting
Then, for each of the five imputed data sets, IPW was utilized. In order to quantify the probability of elevated depressive symptoms at baseline, 1- and 2-year follow-up, we fitted three logistic regression models. In the first model, we utilized baseline covariates as predictors for the baseline exposure. For the 1- and 2-year follow-up models, we fit the regressions among participants not lost to follow-up and included all covariates of the respective and the previous waves as well as elevated depressive symptoms (binary) from earlier waves. We used the coefficients of these three regression models to calculate the probability of reporting elevated vs. subthreshold depressive symptoms at each time point and for each individual. To calculate the probability of being lost to follow-up at 1-, 2-, and 6-year follow-ups, we fitted three further logistic regression models using all available data on covariates and exposure from the previous waves.
We then calculated the weights for the exposure for each individual and each time point as the inverse of the probability of being in their levels of depressive symptoms (elevated vs. subthreshold) at the given time point (WA0, WA1, WA2). Subsequently, we calculated the weights for the censorship as zero for individuals who are lost to follow-up and the inverse of the probability of not being lost to follow-up at the given time point for individuals not lost to follow-up (WC1, WC2, WC6). We multiply these six weights to gain a single weight (W). For the subsequent effect estimation, this single weight variable was applied to each subject in the weighted regression models within the five imputed datasets.
Effect estimation
First, we estimated the unadjusted association between the cumulative exposure index and the physical component score at 6-year follow-up (Y6) (model 1). We assessed the effect of this cumulative exposure index on the outcome using a linear regression model. We therefore assumed that the expected physical component score is a linear function of the cumulative index for elevated depressive symptoms, regardless of the specific symptom pattern (63).
In the first weighted linear regression model, we estimated the effect of cumulative exposure index on the physical component score at 6-year follow-up (Y6) (model 2). In the second weighted regression model, we estimated the effect of the different depression symptoms patterns on the physical component score at 6-years considering the three exposure statuses as single binary variables rather than relying on the cumulative exposure index (model 3). Point estimates were obtained by averaging the estimated coefficients across the five imputed datasets. For all models, we ran 500 iteration bootstraps to obtain 95% confidence intervals of the coefficients (CI) (77).
We used R version 4.2.1 and RStudio version 2022.12.0 for data analysis.
Results
In total, 2,863 children and adolescents aged 7–17 years, participated at the baseline of the BELLA study (Figure 1). With reference to our inclusion criteria, we excluded 1,394 participants aged 11 years and younger at baseline, four adolescents whose parents indicated that their kids were currently depressed at baseline and another five youths whose parents reported that their kids were formerly depressed at baseline. This resulted in a final baseline sample of 1,460 adolescents aged 12–17 years at baseline (Table 1).
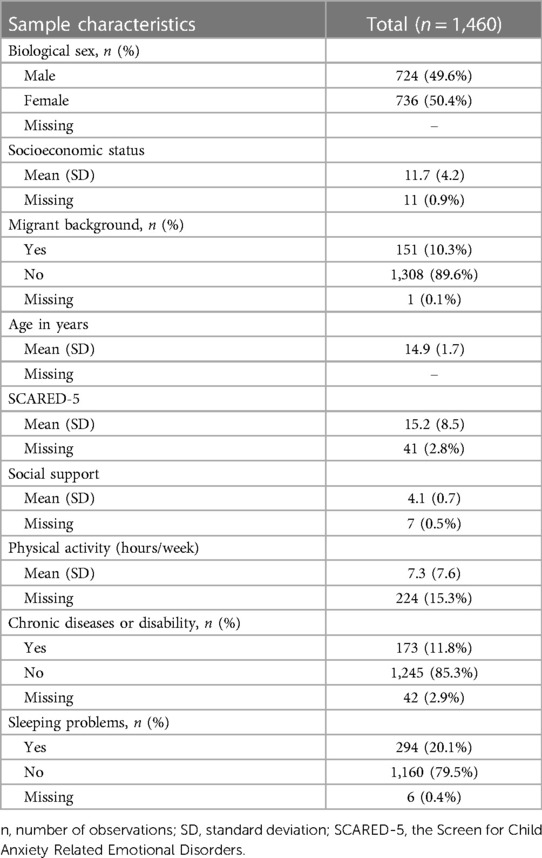
Table 1 Baseline characteristics of study participants.
Exposure data
Mean depressive symptoms at baseline were 10.1 (SD: 7.0). After dichotomization (CES-DC > 15), 251 out of 1,460 participants (17.2%) were classified as showing elevated levels of depressive symptom at the beginning of the study. The proportion of adolescents with elevated depressive symptoms was 11.5% at the 1-year follow-up and 9.7% at the 2-year follow-up. During the baseline, 1-year and 2-year follow-up surveys, 602 of 1,460 adolescents (41.2%) reported depressive symptoms below the threshold at all three time points. Another 173 youths reported elevated levels of depressive symptoms at one of the three assessment points (11.8%), 63 at two assessment points (4.3%) and 33 at all three assessment points (2.3%).
Outcome data
At 6-year follow-up, the physical component score of the SF-36 had a mean of 55.1 (SD: 5.5, missing: 59%). Figure 3 shows that participants reporting lower depressive symptoms at baseline on average had better physical health-related quality of life scores at 6-year follow-up compared to those reporting elevated depressive symptoms at baseline (mean: 55.5, SD: 5.1 vs. mean: 53.2, SD: 6.2). Higher levels of the physical component score on average were also observed among subjects with subthreshold depressive symptoms at 1-year follow-up (mean: 55.5, SD: 5.0 vs. mean: 52.6, SD: 6.2) as well as at 2-year follow-up (mean: 55.4, SD: 5.0 vs. mean: 53.0, SD: 6.8).
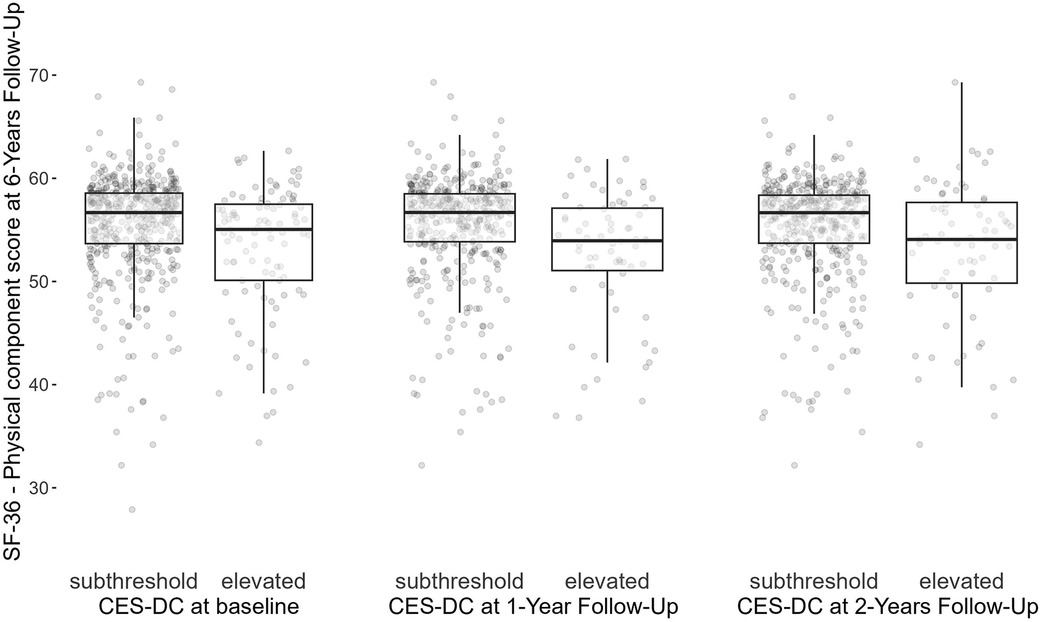
Figure 3 Physical component score of the SF-36 at 6-year follow-up by elevated levels of depressive symptoms (>15) at baseline, 1- and 2-year follow-up waves. CES-DC, the Center for Epidemiological Studies Depression Scale for Children; SF-36, 36-Item Short Form Survey.
Main results
As depicted in Table 2, the unadjusted association between the cumulative index for elevated depressive symptoms and physical component score of SF-36 at 6-year follow-up was −1.49 [95% confidence interval (CI): −2.18 to −0.83] (model 1). After adjusting for confounding and loss to follow-up via IPW, the effect of the cumulative exposure index cum(Ā) on the physical component score was −1.71 (−3.51 to −0.04) (model 2). In model 3, all coefficients were negative and the null value was not included in the confidence interval for the effect estimate of the exposure at 1-year follow-up.
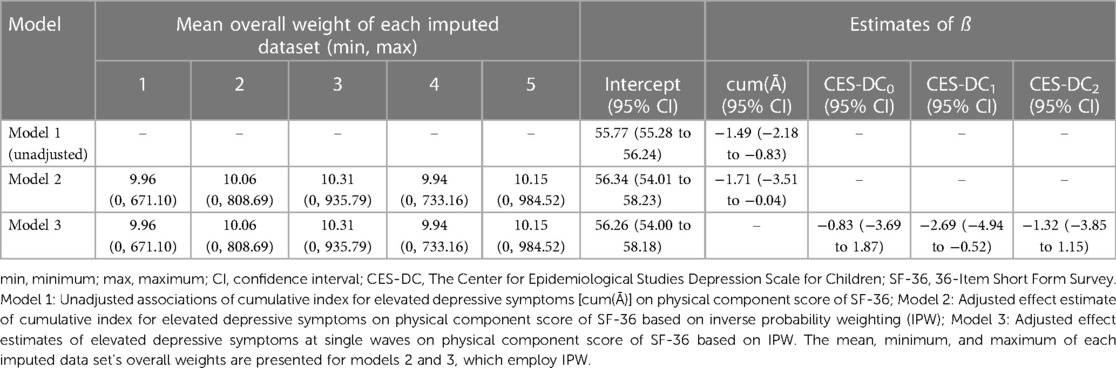
Table 2 Unadjusted and adjusted effect estimates of depressive symptoms on physical component score of SF-36.
Discussion
Key results and interpretations
Our research aimed to estimate the effect of different patterns of elevated depressive symptoms during adolescence on the physical component of health-related quality of life in young adulthood. Our adjusted analyses showed that the average physical quality of life of young adults decreased by 1.7 units with each measurement time point they reported elevated depressive symptoms. This suggests that the physical health-related quality of life tends to decline as adolescents show depressive symptoms above the threshold for a longer period. Our analysis showed that young individuals who experienced elevated depressive symptoms at all time points had an average physical component score of 51.2. This score is 5.1 points lower compared to the expected score of young people who did not experience depressive symptoms at any time point (56.3).
We found a statistically significant association between elevated depressive symptoms at 1-year follow-up and physical health-related quality of life when we relaxed the assumption of linearity of the effect of the cumulative exposure index. However, there was no statistically significant association between baseline and 2-year follow-up levels of elevated depressive symptoms and the outcome. This may be explained by the fact that relaxing the linearity assumption requires the estimation of more parameters, which ultimately reduces statistical power.
Comparison with other observational studies
Cross-sectional studies
In line with our results, prior cross-sectional studies found that elevated depressive symptoms were statistically associated with physical health related quality of life in adolescents (32, 35, 39–41) and adults (15–17, 21). On the contrary, in one cross-sectional study in adults, no evidence of association was found (19). According to the authors, this could be due to the fact that their clinical sample included participants with Friedreich's ataxia suffering from severely impaired physical functioning. Depending on the timing of depressive symptoms and physical health-related quality of life, cross-sectional studies may not provide a causal estimate as both are measured at a single time point and these variables affect each other in a complex way. Nevertheless, cross-sectional data can provide meaningful information in terms of generating (causal) hypothesis (78, 79).
Longitudinal studies
Several longitudinal studies have been conducted. These studies provide additional evidence supporting the relationship between depressive symptoms and health-related quality of life, although each study has its own unique focus, methodology, and limitations.
In a clinical multicenter cohort study in the United States, the relationship between depressive symptoms and health-related quality of life was examined in 147 adults with epilepsy (28). The study found that depressive symptoms accounted for a significant portion of the variation in health-related quality of life in adult epilepsy patients. However, the limitations of the study, including its descriptive nature, clinical sample, disease-specific measurement instrument, and chosen statistical analysis, restrict the comparability of the findings to other studies.
An Irish longitudinal study aimed to investigate the relationship between health-related quality of life, depressive symptoms, body mass index (BMI), and weight change desires in children and adolescents (42). The study suggested that elevated depressive symptoms mediated the link between weight change desires and health-related quality of life. Despite differences in sample, measurement tools, and analysis methods, the study supported the directionality of the association between depressive symptoms and health-related quality of life observed in the current study.
A Taiwanese cohort study examined the mediating role of depressive and anxiety symptoms in the relationship between attention-deficit/hyperactivity disorder (ADHD) symptoms and quality of life, but also whether depressive symptoms may account for poorer quality of life in adolescents (80). The study found that elevated depressive symptoms at baseline resulted in a decrease in health-related quality of life at the 1-year follow-up. Although the study differed in objectives, measurements, and analysis, it provided additional support for the finding that elevated depressive symptoms contribute to poorer overall quality of life in adolescents.
An Australian cohort study of 1,393 adolescents aged 11–14 examined the bi-directional relationship between depressive symptoms, health-related quality of life, and eating disorder symptoms over one year (43). The study found that elevated depressive symptoms at baseline predicted certain aspects of health-related quality of life at the 1-year follow-up. However, the study did not address physical health-related quality of life, adjust for confounders, consider repeated exposure to depressive symptoms, or have the same time interval between exposure and outcome as the current study.
Another US cohort study incorporated variability of depressive symptoms over time to estimate the effect of change in depressive symptoms on health-related quality of life during and after pregnancy (23). The study identified different groups based on patterns of depressive symptoms over time and found a decline in physical health-related quality of life with elevated depressive symptoms. Although the study's focus on pregnant women limits direct comparison to the current study, it provides valuable insights into the impact of depressive symptoms on health-related quality of life.
Strengths
Through our study, we aim to advance the current knowledge and provide robust evidence regarding the causal nature of the relationship between depressive symptoms and health-related quality of life.
Our study stands out from prior descriptive and predictive studies (81, 82) or those that remain vague and ambiguous in their objectives (83) by explicitly formulating a causal question. Many studies in the field of psychology, for instance, tend to avoid explicit causal inference when working with observational data. For example, researchers investigating psychological topics often avoid explicit causal inference on the basis of observational data (84). While they may not use causal language in their objectives, they often implicitly draw causal implications in their discussions or solely refer to the associational nature of their findings (85). Therefore, their added value in terms of informing interventions and making public health decisions remains unclear (86).
To reduce the risk of tautological inferences, we defined physical health-related quality of life as our primary outcome, because mental health-related quality of life (15, 29, 87) and overall health-related quality of life (40, 88) (which includes a mental component) may conceptually and empirically overlap with the measurement of depressive symptoms (89–93).
We used data from the BELLA cohort study with repeated measures of exposure and confounding variables. This allows us to establish a causal relation and model the dynamic and time dependent nature of the data structure across multiple time points. Furthermore, the data consists of information provided by adolescents drawn from the general population, which strengthens the external validity of our results.
We used state-of-the-art causal methods. That is, we drew a DAG (82) to make our assumptions about the underlying causal structure explicit and open to scrutiny (94). Moreover, we applied IPW to addresses confounding and selection bias, including exposure-confounder-feedback and differential loss to follow-up (63, 95, 96). DAGs can help to identify variables to fulfill the conditional exchangeability assumption, enabling us to use IPW to validly estimate the average causal effect of different exposure patterns despite the presence of treatment confounding feedback (63).
Finally, we used multiple imputation to impute missing values, thus reducing potential risks of non-response bias and increasing statistical power (97, 98).
Limitations
Advocates of the interventionist causal framework may argue that elevated depressive symptoms is an ill-defined exposure (86, 99, 100). This is because having elevated depressive symptoms is a state rather than a manipulable intervention. It is possible to conceive different interventions that alter the depressive symptoms, with possibly different effects on the outcome. As a result of this violation of the consistency identification assumption (63, 100), the causal effect of having elevated depressive symptoms can be hard to define in counterfactual terms. This challenge is not unique to our study but applies also to previous research on depressive symptoms and health-related quality of life, as well as other studies examining non-manipulable etiological factors (101–104). We take a pragmatic stance and acknowledge that elevated depressive symptoms may represent an ill-defined intervention in terms of the potential outcome framework. Although our results do not provide a precise indication of which interventions contribute to enhancing physical health related quality of life, they are useful to make a general case for early depression prevention.
A relatively small number of participants took part in all follow-up waves and some participants had missing values for some relevant variables. We relied on IPW to address differential loss to follow-up and used multiple imputation by chained equations to impute missing values. Despite the use of state-of-the-art methods to account for non-participation and non-response, the limited sample size reduced our statistical power, increasing the degree of uncertainty of our findings. We emphasize, however, that a small sample size should not be used as an argument to dismiss analysis of observational data for relevant causal questions (105).
For the results of our statistical analysis to be valid, we must have correctly specified the models and correctly identified the confounding variables (106). For example, we assumed that drinking (107, 108) and smoking (109, 110) are not a cause but only a consequence of depressive symptoms. These health risk behaviors were therefore not conceived as confounders but as mediators on the path from depressive symptoms to physical health-related quality of life. Despite employing directed acyclic graphs, it is impossible to verify if the conditional exchangeability assumption is met. We need to rely on our expert knowledge and put our set of covariates up for scientific discussion.
Even if we accurately specified our adjustment set, measurement errors could still result in bias. For example, in the BELLA study, the level of physical activity per week was assessed using a single self-reported item. This measurement may not accurately reflect the true level of physical activity due to recall and social desirability bias. This is a general issue in observational studies interested in physical activity. In recent years, “next generation” epidemiologic studies started utilizing wearable devices to measure physical activity and sedentary behavior, instead of relying on self-reported assessments (111). Similarly, misclassifying the exposure, outcome, or confounder status could lead to information bias in our study. For instance, adolescents with elevated depressive symptoms may be more concerned about their health status, which could cause them to report the physical health consequences of their depressive symptoms more accurately or report worse health consistently with a more negative view. Another source of measurement error in our study is the covariate socioeconomic status, which we measured only at baseline and which we assumed to be constant during the follow-up waves. Of course, changes in parents' education, job promotions, or job loss could result in misclassification of socioeconomic status during the follow-up period. However, given the short duration of our follow-up period and the relatively stable social mobility in Germany, we assume that any variations in socioeconomic status during the follow-up period would be negligible. In support of this, data from the German Socio-Economic Panel suggest that the total variance of individual income trends in Germany between 2008 and 2013 was zero (112).
Generalizability and implications
Our study sample is a subsample of the KiGGS study population, which aimed at enrolling a representative sample of children and adolescents aged 0–17 years living in Germany (45). For this reason, we consider our findings to be generalizable to the population of adolescents living in Germany aged 12–17 years. Taking into account cultural and social factors, we believe that our findings may also be transportable to similar settings (e.g., other Central European countries).
Numerous systematic reviews and meta-analyses have shown that early prevention interventions, especially selective and indicated programs, can reduce depressive symptoms in children and adolescents (113–124). For example, Wijnhoven et al. showed that in schoolgirls aged 11–15 years with elevated depressive symptoms, cognitive behavioral therapy sessions were effective in reducing depressive symptoms during the intervention and at 6-month follow-up compared to no treatment (125). Our results suggest that physical health-related quality of life increases each time depressive symptoms remain below the threshold. Therefore, if adolescents with elevated depressive symptoms receive interventions such as cognitive behavioral therapy, this could have a positive impact not only on their mental health, but also on their physical health-related quality of life in young adulthood.
Indeed, our results are compatible with the idea that these interventions may have some co-benefits: if interventions can prevent adolescents from experiencing elevated depressive symptoms, this may not only serve the mental health of these adolescents but can also have an impact on their physical health-related quality of life. We refer to the added physical health gains over and above mental health as the physical co-benefits of depression prevention in adolescence. In practical terms, these physical co-benefits could give additional justification to preventive interventions since the overall health gains could outweigh the economic costs of early mental health interventions.
Conclusion
In this study, we found that elevated depressive symptoms in adolescence reduce physical health-related quality of life in young adulthood. Our results support that health-related quality of life is the product of the dynamic interplay between mental health and physical health-related factors.
Data availability statement
The datasets presented in this article are not readily available because their use is restricted to non-commercial purposes. Requests to access the datasets should be directed to FR,Zi5yZWlzc0B1a2UuZGU=.
Ethics statement
The studies involving humans were approved by Ethics Committee of the Charité – Universitätsmedizin Berlin and the Federal Commissioner for Data Protection in Germany. The studies were conducted in accordance with the local legislation and institutional requirements. Written informed consent for participation in this study was provided by the participants’ legal guardians/next of kin.
Author contributions
JW is the guarantor and conceived the idea for the project with the advice of CP. JW, TK and MP designed the methodology. UR was responsible for the funding acquisition, conception, and design of the BELLA study from baseline to 6-year follow-up. FR substantially contributed to the design of the BELLA study at 6 year-follow-up, the project administration, data collection and data processing. JW conducted the analysis. MP provided guidance in the application of causal methods. JW and MP interpreted the results. JW wrote the first draft of the manuscript. TK, CP, UR, MP and FR edited the manuscript critically for important intellectual content. All authors contributed to the article and approved the submitted version.
Funding
The BELLA study has been financially supported by various grants. Baseline, 1-year and 2-year follow-ups were financed by the German Science Foundation. The 6-year follow-up was funded by the German Federal Ministry of Health (BMG). We acknowledge financial support from the Open Access Publication Fund of UKE - Universitätsklinikum Hamburg-Eppendorf.
Acknowledgments
The authors thank all children, adolescents, their parents, and young adults who participated in the BELLA study for their time and involvement. We are very grateful to all the researchers and students who worked on this project and made it possible.
Conflict of interest
MP reports having received partial funding for a self-initiated research project from Novartis Pharma. MP further reports being awarded a research grant from the Center for Stroke Research Berlin (private donations) for a self-initiated project. TK reports, outside of the submitted work, having received research grants from Gemeinsamer Bundesausschuss (G-BA - Federal Joint Committee, Germany), the Bundesministerium für Gesundheit (BMG - Federal Ministry of Health, Germany). He further has received personal compensation from Eli Lilly and Company, The BMJ, and Frontiers Media S.A.
The remaining authors declare that the research was conducted in the absence of any commercial or financial relationships that could be construed as a potential conflict of interest.
Publisher's note
All claims expressed in this article are solely those of the authors and do not necessarily represent those of their affiliated organizations, or those of the publisher, the editors and the reviewers. Any product that may be evaluated in this article, or claim that may be made by its manufacturer, is not guaranteed or endorsed by the publisher.
Supplementary material
The Supplementary Material for this article can be found online at: https://www.frontiersin.org/articles/10.3389/fped.2024.1252964/full#supplementary-material
References
1. Sawyer SM, Azzopardi PS, Wickremarathne D, Patton GC. The age of adolescence. Lancet Child Adolesc Health. (2018) 2:223–8. doi: 10.1016/S2352-4642(18)30022-1
2. Burt KB, Masten AS. Development in the transition to adulthood: vulnerabilities and opportunities. In: Grant JE, Potenza MN, editors. Young Adult Mental Health. Oxford: Oxford University Press (2010). p. 5–18.
3. Kinnunen P, Laukkanen E, Kylmä J. Associations between psychosomatic symptoms in adolescence and mental health symptoms in early adulthood. Int J Nurs Pract. (2010) 16:43–50. doi: 10.1111/j.1440-172X.2009.01782.x
4. Schultze-Lutter F, Schimmelmann BG, Schmidt SJ. Resilience, risk, mental health and well-being: associations and conceptual differences. Eur Child Adolesc Psychiatry. (2016) 25:459–66. doi: 10.1007/s00787-016-0851-4
5. World Health Organization. Risks to mental health: An overview of vulnerabilities and risk factors: Background Paper by WHO Secretariat for the Development of a comprehensive mental health action plan. Geneva (2012). Available online at: https://www.who.int/publications/m/item/risks-to-mental-health (cited October 28, 2022).
6. Kwong AS, Manley D, Timpson NJ, Pearson RM, Heron J, Sallis H, et al. Identifying critical points of trajectories of depressive symptoms from childhood to young adulthood. J Youth Adolesc. (2019) 48:815–27. doi: 10.1007/s10964-018-0976-5
7. US Preventive Services Task Force. Screening for depression and suicide risk in children and adolescents: US Preventive Services Task Force recommendation statement. JAMA. (2022) 328:1534–42. doi: 10.1001/jama.2022.16946
8. Dekker RL, Lennie TA, Doering LV, Chung ML, Wu J-R, Moser DK. Coexisting anxiety and depressive symptoms in patients with heart failure. Eur J Cardiovasc Nurs. (2014) 13:168–76. doi: 10.1177/1474515113519520
9. Shorey S, Ng ED, Wong CH. Global prevalence of depression and elevated depressive symptoms among adolescents: a systematic review and meta-analysis. Br J Clin Psychol. (2022) 61:287–305. doi: 10.1111/bjc.12333
10. Bulhões C, Ramos E, Severo M, Dias S, Barros H. Trajectories of depressive symptoms through adolescence and young adulthood: social and health outcomes. Eur Child Adolesc Psychiatry. (2021) 30:65–74. doi: 10.1007/s00787-020-01493-9
11. Chaiton M, Contreras G, Brunet J, Sabiston CM, O'Loughlin E, Low NC, et al. Heterogeneity of depressive symptom trajectories through adolescence: predicting outcomes in young adulthood. J Can Acad Child Adolesc Psychiatry. (2013) 22:96–105. PMID: 23667355
12. Bertha EA, Balázs J. Subthreshold depression in adolescence: a systematic review. Eur Child Adolesc Psychiatry. (2013) 22:589–603. doi: 10.1007/s00787-013-0411-0
13. Hays RD, Reeve BB. Measurement and modeling of health-related quality of life. In: Killewo J, Heggenhougen HK, Quah SR, editors. Epidemiology and Demography in Public Health. Amsterdam: Academic Press (2008). p. 195–205.
14. Arslan G, Ayranci U, Unsal A, Arslantas D. Prevalence of depression, its correlates among students, and its effect on health-related quality of life in a Turkish university. Ups J Med Sci. (2009) 114:170–7. doi: 10.1080/03009730903174339
15. Çam HH, Top FU. The relationship between health-related quality of life and prevalence of depressive symptoms among undergraduate nursing students in Turkey. Med Sci. (2017) 7:154–7. doi: 10.5455/medscience.2017.06.8714
16. Knudsen KB, Pressler T, Mortensen LH, Jarden M, Skov M, Quittner AL, et al. Associations between adherence, depressive symptoms and health-related quality of life in young adults with cystic fibrosis. SpringerPlus. (2016) 5:1216. doi: 10.1186/s40064-016-2862-5
17. Nan H, Lee PH, Ni MY, Chan BH, Lam T-H. Effects of depressive symptoms and family satisfaction on health related quality of life: the Hong Kong FAMILY study. PLoS One. (2013) 8:e58436. doi: 10.1371/journal.pone.0058436
18. Nicholson WK, Setse R, Hill-Briggs F, Cooper LA, Strobino D, Powe NR. Depressive symptoms and health-related quality of life in early pregnancy. Obstet Gynecol. (2006) 107:798–806. doi: 10.1097/01.AOG.0000204190.96352.05
19. Pérez-Flores J, Hernández-Torres A, Montón F, Nieto A. Health-related quality of life and depressive symptoms in Friedreich ataxia. Qual Life Res. (2020) 29:413–20. doi: 10.1007/s11136-019-02311-9
20. Pinquart M, Koch A, Eberhardt B, Brix C, Wedding U, Röhrig B. Associations of functional status and depressive symptoms with health-related quality of life in cancer patients. Qual Life Res. (2006) 15:1565–70. doi: 10.1007/s11136-006-0016-x
21. Reyes-Gibby CC, Anderson KO, Morrow PK, Shete S, Hassan S. Depressive symptoms and health-related quality of life in breast cancer survivors. J Women’s Health. (2011) 21:311–8. doi: 10.1089/jwh.2011.2852
22. Ritt-Olson A, Miller K, Baezconde-Garbanati L, Freyer D, Ramirez C, Hamilton A, et al. Depressive symptoms and quality of life among adolescent and young adult cancer survivors: impact of gender and Latino culture. J Adolesc Young Adult Oncol. (2018) 7:384–8. doi: 10.1089/jayao.2017.0078
23. Setse R, Grogan R, Pham L, Cooper LA, Strobino D, Powe NR, et al. Longitudinal study of depressive symptoms and health-related quality of life during pregnancy and after delivery: the health status in pregnancy (HIP) study. Matern Child Health J. (2009) 13:577–87. doi: 10.1007/s10995-008-0392-7
24. Souza IM, Da Paro HB, Morales RR, Pinto RD, da Silva CH. Health-related quality of life and depressive symptoms in undergraduate nursing students. Rev Lat Am Enfermagem. (2012) 20:736–43. doi: 10.1590/s0104-11692012000400014
25. Teh WL, Liu J, Satghare P, Samari E, Mok YM, Subramaniam M. Depressive symptoms and health-related quality of life in a heterogeneous psychiatric sample: conditional indirect effects of pain severity and interference. BMC Psychiatry. (2021) 21:470. doi: 10.1186/s12888-021-03470-1
26. Verma SK, Luo N, Subramaniam M, Sum CF, Stahl D, Liow PH, et al. Impact of depression on health related quality of life in patients with diabetes. Ann Acad Med Singap. (2010) 39:913–7. doi: 10.47102/annals-acadmedsg.V39N12p913
27. Weigel A, König H-H, Gumz A, Löwe B, Brettschneider C. Correlates of health related quality of life in anorexia nervosa. Int J Eat Disord. (2016) 49:630–4. doi: 10.1002/eat.22512
28. Whatley AD, DiIorio CK, Yeager K. Examining the relationships of depressive symptoms, stigma, social support and regimen-specific support on quality of life in adult patients with epilepsy. Health Educ Res. (2010) 25:575–84. doi: 10.1093/her/cyq001
29. Zhong X, Liu Y, Pu J, Tian L, Gui S, Song X, et al. Depressive symptoms and quality of life among Chinese medical postgraduates: a national cross-sectional study. Psychol Health Med. (2019) 24:1015–27. doi: 10.1080/13548506.2019.1626453
30. Anderson BJ, Edelstein S, Abramson NW, Katz LE, Yasuda PM, Lavietes SJ, et al. Depressive symptoms and quality of life in adolescents with type 2 diabetes: baseline data from the TODAY study. Diabetes Care. (2011) 34:2205–7. doi: 10.2337/dc11-0431
31. Graves JK, Hodge C, Jacob E. Depression, anxiety, and quality of life in children and adolescents with sickle cell disease. Pediatr Nurs. (2016) 42(3):113–9, 144. PMID: 27468512
32. Lim CS, Gowey MA, Silverstein J, Dumont-Driscoll M, Janicke DM. Depressive symptoms, ethnic identity, and health-related quality of life in obese youth. J Pediatr Psychol. (2016) 41:441–52. doi: 10.1093/jpepsy/jsv014
33. Loreaux KL, Gray WN, Denson LA, Hommel KA. Health-Related quality of life in adolescents with inflammatory bowel disease: the relation of parent and adolescent depressive symptoms. Children’s Health Care. (2015) 44:119–35. doi: 10.1080/02739615.2014.912943
34. Moreira JM, Soares BM, Maria C, Teixeira AL, e Silva S, Cristina A, et al. Anxiety, depression, resilience and quality of life in children and adolescents with pre-dialysis chronic kidney disease. Pediatr Nephrol. (2015) 30:2153–62. doi: 10.1007/s00467-015-3159-6
35. Sano F, Kanemura H, Tando T, Goto Y, Hosaka H, Sugita K, et al. Depressive symptoms contribute to quality of life in children with epilepsy. Eur J Paediatr Neurol. (2014) 18:774–9. doi: 10.1016/j.ejpn.2014.08.002
36. Sehlo MG, Kamfar HZ. Depression and quality of life in children with sickle cell disease: the effect of social support. BMC Psychiatry. (2015) 15:78. doi: 10.1186/s12888-015-0461-6
37. Winger A, Kvarstein G, Wyller VB, Ekstedt M, Sulheim D, Fagermoen E, et al. Health related quality of life in adolescents with chronic fatigue syndrome: a cross-sectional study. Health Qual Life Outcomes. (2015) 13:96. doi: 10.1186/s12955-015-0288-3
38. Zeller MH, Modi AC. Predictors of health-related quality of life in obese youth. Obesity. (2006) 14:122–30. doi: 10.1038/oby.2006.15
39. Freire T, Ferreira G. Health-related quality of life of adolescents: relations with positive and negative psychological dimensions. Int J Adolesc Youth. (2016) 23:11–24. doi: 10.1080/02673843.2016.1262268
40. Reinfjell T, Hjemdal O, Aune T, Vikan A, Diseth TH. The pediatric quality of life inventory (PedsQL™) 4.0 as an assessment measure for depressive symptoms: a correlational study with young adolescents. Nord J Psychiatry. (2008) 62:279–86. doi: 10.1080/08039480801983950
41. Bettge S, Wille N, Barkmann C, Schulte-Markwort M, Ravens-Sieberer U. The BELLA study group. Depressive symptoms of children and adolescents in a German representative sample: results of the BELLA study. Eur Child Adolesc Psychiatry. (2008) 17:71–81. doi: 10.1007/s00787-008-1008-x
42. Wynne C, Comiskey C, McGilloway S. The role of body mass index, weight change desires and depressive symptoms in the health-related quality of life of children living in urban disadvantage: testing mediation models. Psychol Health. (2016) 31:147–65. doi: 10.1080/08870446.2015.1082560
43. Kenny B, Bowe SJ, Taylor CB, Moodie M, Brown V, Hoban E, et al. Longitudinal relationships between sub-clinical depression, sub-clinical eating disorders and health-related quality of life in early adolescence. Int J Eat Disord. (2023) 56:1114–24. doi: 10.1002/eat.23928
44. Ravens-Sieberer U, Otto C, Kriston L, Rothenberger A, Döpfner M, Herpertz-Dahlmann B, et al. The longitudinal BELLA study: design, methods and first results on the course of mental health problems. Eur Child Adolesc Psychiatry. (2015) 24:651–63. doi: 10.1007/s00787-014-0638-4
45. Mauz E, Lange M, Houben R, Hoffmann R, Allen J, Gößwald A, et al. Cohort profile: KiGGS cohort longitudinal study on the health of children, adolescents and young adults in Germany. Int J Epidemiol. (2020) 49:375–375k. doi: 10.1093/ije/dyz231
46. Ravens-Sieberer U, Kurth B-M. The mental health module (BELLA study) within the German health interview and examination survey of children and adolescents (KiGGS): study design and methods. Eur Child Adolesc Psychiatry. (2008) 17(Suppl 1):10–21. doi: 10.1007/s00787-008-1002-3
47. Morfeld M, Bullinger M, Nantke J, Brähler E. Die version 2.0 des SF-36 health survey - ergebnisse einer bevölkerungsrepräsentativen studie. Soz- Präventivmed. (2005) 50:292–300. doi: 10.1007/s00038-005-4090-6
48. Morfeld M, Stritter W, Bullinger M. 3 Der SF-36 health survey. In: Schöffski O, von der Schulenburg G, Matthias J, editors. Gesundheitsökonomische Evaluationen. Berlin, Heidelberg: Springer Berlin Heidelberg (2012). p. 393–410.
49. Bullinger M, Kirchberger I, Ware J. Der deutsche SF-36 health survey Übersetzung und psychometrische testung eines krankheitsübergreifenden instruments zur erfassung der gesundheitsbezogenen lebensqualität. Z f Gesundheitswiss. (1995) 3:21–36. doi: 10.1007/BF02959944
50. Ware JE, Sherbourne CD. The MOS 36-ltem short-form health survey (SF-36). Med Care. (1992) 30:473–83. doi: 10.1097/00005650-199206000-00002
51. Pequeno NPF, Cabral NLA, Marchioni DM, Lima SCVC, Lyra CO. Quality of life assessment instruments for adults: a systematic review of population-based studies. Health Qual Life Outcomes. (2020) 18:208. doi: 10.1186/s12955-020-01347-7
52. Coons SJ, Rao S, Keininger DL, Hays RD. A comparative review of generic quality-of-life instruments. PharmacoEconomics. (2000) 17:13–35. doi: 10.2165/00019053-200017010-00002
53. Ware JE, Kosinski M, Bayliss MS, McHorney CA, Rogers WH, Raczek A. Comparison of methods for the scoring and statistical analysis of SF-36 health profile and summary measures: summary of results from the medical outcomes study. Med Care. (1995) 33:AS264–79. PMID: 7723455
54. Hemingway H, Stafford M, Stansfeld S, Shipley M, Marmot M. Is the SF-36 a valid measure of change in population health? Results from the Whitehall II study. Br Med J. (1997) 315:1273. doi: 10.1136/bmj.315.7118.1273
55. McHorney CA, Ware JE JR, Rachel Lu JF, Sherbourne CD. The MOS 36-ltem short-form health survey (SF-36): III. Tests of data quality, scaling assumptions, and reliability across diverse patient groups. Med Care. (1994) 32:40–66. doi: 10.1097/00005650-199401000-00004
56. McHorney CA, Johne W Jr, Anastasiae R. The MOS 36-item short-form health survey (SF-36): II. Psychometric and clinical tests of validity in measuring physical and mental health constructs. Med Care. (1993) 31:247–63. doi: 10.1097/00005650-199303000-00006
57. Faulstich ME, Carey MP, Ruggiero L, Enyart P, Gresham F. Assessment of depression in childhood and adolescence: an evaluation of the center for epidemiological studies depression scale for children (CES-DC). Am J Psychiatry. (1986) 143:1024–7. doi: 10.1176/ajp.143.8.1024
58. Weissman MM, Orvaschel H, Padian N. Children’s symptom and social functioning self-report scales comparison of mothers’ and children’s reports. J Nerv Ment Dis. (1980) 168:736–40. doi: 10.1097/00005053-198012000-00005
59. Barkmann C, Erhart M, Schulte-Markwort M, The BELLA Study Group. The German version of the centre for epidemiological studies depression scale for children: psychometric evaluation in a population-based survey of 7 to 17 years old children and adolescents – results of the BELLA study. Eur Child Adolesc Psychiatry. (2008) 17:116–24. doi: 10.1007/s00787-008-1013-0
60. Stockings E, Degenhardt L, Lee YY, Mihalopoulos C, Liu A, Hobbs M, et al. Symptom screening scales for detecting major depressive disorder in children and adolescents: a systematic review and meta-analysis of reliability, validity and diagnostic utility. J Affect Disord. (2015) 174:447–63. doi: 10.1016/j.jad.2014.11.061
61. Radloff LS. The CES-D scale: a self-report depression scale for research in the general population. Appl Psychol Meas. (1977) 1:385–401. doi: 10.1177/014662167700100306
62. Fendrich M, Weissman MM, Warner V. Screening for depressive disorder in children and adolescents: validating the center for epidemiologic studees depression scale for children. Am J Epidemiol. (1990) 131:538–51. doi: 10.1093/oxfordjournals.aje.a115529
64. Pearl J, Mackenzie D. The Book of why: The New Science of Cause and Effect. New York: Penguin Books (2019, cop. 2018). X, 418 str.
65. Greenland S, Pearl J, Robins JM. Causal diagrams for epidemiologic research. Epidemiology. (1999) 10:37–48. doi: 10.1097/00001648-199901000-00008
66. Pearl J. Causality: Models, Reasoning, and Inference. Cambridge: Cambridge University Press (2009). p. 465.
67. Shrier I, Platt RW. Reducing bias through directed acyclic graphs. BMC Med Res Methodol. (2008) 8:70. doi: 10.1186/1471-2288-8-70
68. Rohrer JM. Thinking clearly about correlations and causation: graphical causal models for observational data. Adv Methods Pract Psychol Sci. (2018) 1:27–42. doi: 10.1177/2515245917745629
69. Lampert T, Müters S, Stolzenberg H, Kroll LE, KiGGS Study Group. Messung des sozioökonomischen status in der KiGGS-studie. Bundesgesundheitsbl. (2014) 57:762–70. doi: 10.1007/s00103-014-1974-8
70. Schenk L, Ellert U, Neuhauser H. Kinder und jugendliche mit migrationshintergrund in deutschland. Bundesgesundheitsbl. (2007) 50:590–9. doi: 10.1007/s00103-007-0220-z
71. Birmaher B, Brent DA, Chiapetta L, Bridge J, Monga S, Baugher M. Psychometric properties of the screen for child anxiety related emotional disorders (SCARED): a replication study. J Am Acad Child Adolesc Psychiatry. (1999) 38:1230–6. doi: 10.1097/00004583-199910000-00011
72. Birmaher B, Khetarpal S, Brent D, Cully M, Balach L, Kaufman J, et al. The screen for child anxiety related emotional disorders (SCARED): scale construction and psychometric characteristics. J Am Acad Child Adolesc Psychiatry. (1997) 36:545–53. doi: 10.1097/00004583-199704000-00018
73. Moser A, Stuck AE, Silliman RA, Ganz PA, Clough-Gorr KM. The eight-item modified medical outcomes study social support survey: psychometric evaluation showed excellent performance. J Clin Epidemiol. (2012) 65:1107–16. doi: 10.1016/j.jclinepi.2012.04.007
74. Sherbourne CD, Stewart AL. The MOS social support survey. Soc Sci Med. (1991) 32:705–14. doi: 10.1016/0277-9536(91)90150-B
75. Little RJ, Rubin DB. Statistical Analysis with Missing Data. Hoboken: John Wiley & Sons (2014). 1 online resource.
76. Azur MJ, Stuart EA, Frangakis C, Leaf PJ. Multiple imputation by chained equations: what is it and how does it work? Int J Methods Psychiatr Res. (2011) 20:40–9. doi: 10.1002/mpr.329
77. Schomaker M, Heumann C. Bootstrap inference when using multiple imputation. Stat Med. (2018) 37:2252–66. doi: 10.1002/sim.7654
78. Fox MP, Murray EJ, Lesko CR, Sealy-Jefferson S. On the need to revitalize descriptive epidemiology. Am J Epidemiol. (2022) 191:1174–9. doi: 10.1093/aje/kwac056
79. Conroy S, Murray EJ. Let the question determine the methods: descriptive epidemiology done right. Br J Cancer. (2020) 123:1351–2. doi: 10.1038/s41416-020-1019-z
80. Pan P-Y, Yeh C-B. Impact of depressive/anxiety symptoms on the quality of life of adolescents with ADHD: a community-based 1-year prospective follow-up study. Eur Child Adolesc Psychiatry. (2017) 26:659–67. doi: 10.1007/s00787-016-0929-z
82. Hernán MA, Hsu J, Healy B. A second chance to get causal inference right: a classification of data science tasks. CHANCE. (2019) 32:42–9. doi: 10.1080/09332480.2019.1579578
83. Glymour MM, Hamad R. Causal thinking as a critical tool for eliminating social inequalities in health. Am J Public Health. (2018) 108:623. doi: 10.2105/AJPH.2018.304383
84. Grosz MP, Rohrer JM, Thoemmes F. The taboo against explicit causal inference in nonexperimental psychology. Perspect Psychol Sci. (2020) 15:1243–55. doi: 10.1177/1745691620921521
85. Rutter M. Proceeding from observed correlation to causal inference: the use of natural experiments. Perspect Psychol Sci. (2007) 2:377–95. doi: 10.1111/j.1745-6916.2007.00050.x
86. Hernán MA. Invited commentary: hypothetical interventions to define causal effects—afterthought or prerequisite? Am J Epidemiol. (2005) 162:618–20. doi: 10.1093/aje/kwi255
87. Rubio JM, Olfson M, Pérez-Fuentes G, Garcia-Toro M, Wang S, Blanco C. Effect of first episode axis I disorders on quality of life. J Nerv Ment Dis. (2014) 202:271–4. doi: 10.1097/NMD.0000000000000117
88. Shin H, Jeon S, Cho I. Factors influencing health-related quality of life in adolescent girls: a path analysis using a multi-mediation model. Health Qual Life Outcomes. (2022) 20:50. doi: 10.1186/s12955-022-01954-6
89. Hays RD, Fayers PM. Overlap of depressive symptoms with health-related quality-of-life measures. PharmacoEconomics. (2021) 39:627–30. doi: 10.1007/s40273-020-00972-w
90. Angermeyer MC, Holzinger A, Matschinger H, Stengler-Wenzke K. Depression and quality of life: results of a follow-up study. Int J Soc Psychiatry. (2002) 48:189–99. doi: 10.1177/002076402128783235
91. Katschnig H. Quality of life in mental disorders: challenges for research and clinical practice. World Psychiatry. (2006) 5:139–45. PMID: 17139340
92. Katschnig H, Angermeyer M. Quality of life in depression. In: Katschnig H, Freeman H, Sartorius N, editors. Quality of Life in Mental DisordersQuality of Life in Mental Disorders. New York: Wiley (1997). p. 137–47.
93. Katschnig H, Freeman H, Sartorius N. Quality of Life in Mental DisordersQuality of Life in Mental Disorders. New York: Wiley (1997).
94. Suttorp MM, Siegerink B, Jager KJ, Zoccali C, Dekker FW. Graphical presentation of confounding in directed acyclic graphs. Nephrol Dial Transplant. (2015) 30:1418–23. doi: 10.1093/ndt/gfu325
95. Biele G, Gustavson K, Czajkowski NO, Nilsen RM, Reichborn-Kjennerud T, Magnus PM, et al. Bias from self selection and loss to follow-up in prospective cohort studies. Eur J Epidemiol. (2019) 34:927–38. doi: 10.1007/s10654-019-00550-1
96. Howe CJ, Cole SR, Lau B, Napravnik S, Eron JJ. Selection bias due to loss to follow up in cohort studies. Epidemiology. (2016) 27:91–7. doi: 10.1097/EDE.0000000000000409
97. Karahalios A, Baglietto L, Carlin JB, English DR, Simpson JA. A review of the reporting and handling of missing data in cohort studies with repeated assessment of exposure measures. BMC Med Res Methodol. (2012) 12:96. doi: 10.1186/1471-2288-12-96
98. Hayati Rezvan P, Lee KJ, Simpson JA. The rise of multiple imputation: a review of the reporting and implementation of the method in medical research. BMC Med Res Methodol. (2015) 15:30. doi: 10.1186/s12874-015-0022-1
99. Hernán MA. Does water kill? A call for less casual causal inferences. Ann Epidemiol. (2016) 26:674–80. doi: 10.1016/j.annepidem.2016.08.016
100. Hernán MA, Taubman SL. Does obesity shorten life? The importance of well-defined interventions to answer causal questions. Int J Obes (Lond). (2008) 32(Suppl 3):S8–14. doi: 10.1038/ijo.2008.82
101. Glymour C, Glymour MR. Commentary: race and sex are causes. Epidemiology. (2014) 25:488–90. doi: 10.1097/EDE.0000000000000122
102. Schwartz S, Gatto NM, Campbell UB. Causal identification: a charge of epidemiology in danger of marginalization. Ann Epidemiol. (2016) 26:669–73. doi: 10.1016/j.annepidem.2016.03.013
103. Schwartz S, Prins SJ, Campbell UB, Gatto NM. Is the “well-defined intervention assumption” politically conservative? Soc Sci Med. (2016) 166:254–7. doi: 10.1016/j.socscimed.2015.10.054
104. Pearl J. Does obesity shorten life? Or is it the Soda? On Non-Manipulable Causes. (2018) 6:1–7. doi: 10.1515/jci-2018-2001
105. Hernán MA. Causal analyses of existing databases: no power calculations required. J Clin Epidemiol. (2022) 144:203–5. doi: 10.1016/j.jclinepi.2021.08.028
106. Chesnaye NC, Stel VS, Tripepi G, Dekker FW, Fu EL, Zoccali C, et al. An introduction to inverse probability of treatment weighting in observational research. Clin Kidney J. (2022) 15:14–20. doi: 10.1093/ckj/sfab158
107. Polimanti R, Peterson RE, Ong J-S, MacGregor S, Edwards AC, Clarke T-K, et al. Evidence of causal effect of major depression on alcohol dependence: findings from the psychiatric genomics consortium. Psychol Med. (2019) 49:1218–26. doi: 10.1017/S0033291719000667
108. Chao M, Li X, McGue M. The causal role of alcohol use in adolescent externalizing and internalizing problems: a Mendelian randomization study. Alcohol Clin Exp Res. (2017) 41:1953–60. doi: 10.1111/acer.13493
109. Bjørngaard JH, Gunnell D, Elvestad MB, Smith GD, Skorpen F, Krokan H, et al. The causal role of smoking in anxiety and depression: a Mendelian randomization analysis of the HUNT study. Psychol Med. (2013) 43:711–9. doi: 10.1017/S0033291712001274
110. Taylor AE, Fluharty ME, Bjørngaard JH, Gabrielsen ME, Skorpen F, Marioni RE, et al. Investigating the possible causal association of smoking with depression and anxiety using Mendelian randomisation meta-analysis: the CARTA consortium. BMJ Open. (2014) 4:e006141. doi: 10.1136/bmjopen-2014-006141
111. Lee I-M, Shiroma EJ, Evenson KR, Kamada M, LaCroix AZ, Buring JE. Using devices to assess physical activity and sedentary behavior in a large cohort study, the women’s health study. J Meas Phys Behav. (2018) 1:60–9. doi: 10.1123/jmpb.2018-0005
113. Feiss R, Dolinger SB, Merritt M, Reiche E, Martin K, Yanes JA, et al. A systematic review and meta-analysis of school-based stress, anxiety, and depression prevention programs for adolescents. J Youth Adolesc. (2019) 48:1668–85. doi: 10.1007/s10964-019-01085-0
114. Hetrick SE, Cox GR, Witt KG, Bir JJ, Merry SN. Cognitive behavioural therapy (CBT), third-wave CBT and interpersonal therapy (IPT) based interventions for preventing depression in children and adolescents. Cochrane Database Syst Rev. (2016) 2016(8):CD003380. doi: 10.1002/14651858.CD003380.pub4
115. Johnstone KM, Kemps E, Chen J. A meta-analysis of universal school-based prevention programs for anxiety and depression in children. Clin Child Fam Psychol Rev. (2018) 21:466–81. doi: 10.1007/s10567-018-0266-5
116. Rasing SP, Creemers DH, Janssens JMAM, Scholte RH. Depression and anxiety prevention based on cognitive behavioral therapy for at-risk adolescents: a meta-analytic review. Front Psychol. (2017) 8:1066. doi: 10.3389/fpsyg.2017.01066
117. Stockings EA, Degenhardt L, Dobbins T, Lee YY, Erskine HE, Whiteford HA, et al. Preventing depression and anxiety in young people: a review of the joint efficacy of universal, selective and indicated prevention. Psychol Med. (2016) 46:11–26. doi: 10.1017/S0033291715001725
118. Tejada-Gallardo C, Blasco-Belled A, Torrelles-Nadal C, Alsinet C. Effects of school-based multicomponent positive psychology interventions on well-being and distress in adolescents: a systematic review and meta-analysis. J Youth Adolesc. (2020) 49:1943–60. doi: 10.1007/s10964-020-01289-9
119. Werner-Seidler A, Perry Y, Calear AL, Newby JM, Christensen H. School-based depression and anxiety prevention programs for young people: a systematic review and meta-analysis. Clin Psychol Rev. (2017) 51:30–47. doi: 10.1016/j.cpr.2016.10.005
120. Werner-Seidler A, Spanos S, Calear AL, Perry Y, Torok M, O'Dea B, et al. School-based depression and anxiety prevention programs: an updated systematic review and meta-analysis. Clin Psychol Rev. (2021) 89:102079. doi: 10.1016/j.cpr.2021.102079
121. Ahlen J, Lenhard F, Ghaderi A. Universal prevention for anxiety and depressive symptoms in children: a meta-analysis of randomized and cluster-randomized trials. J Prim Prev. (2015) 36:387–403. doi: 10.1007/s10935-015-0405-4
122. Calear AL, Christensen H. Systematic review of school-based prevention and early intervention programs for depression. J Adolesc. (2010) 33:429–38. doi: 10.1016/j.adolescence.2009.07.004
123. Corrieri S, Heider D, Conrad I, Blume A, König H-H, Riedel-Heller SG. School-based prevention programs for depression and anxiety in adolescence: a systematic review. Health Promot Int. (2014) 29:427–41. doi: 10.1093/heapro/dat001
124. Merry SN, Hetrick SE, Cox GR, Brudevold-Iversen T, Bir JJ, McDowell H. Cochrane review: psychological and educational interventions for preventing depression in children and adolescents. Evid-Based Child Health. (2012) 7:1409–685. doi: 10.1002/ebch.1867
125. Wijnhoven LA, Creemers DH, Vermulst AA, Scholte RH, Engels RC. Randomized controlled trial testing the effectiveness of a depression prevention program (‘op volle kracht’) among adolescent girls with elevated depressive symptoms. J Abnorm Child Psychol. (2014) 42:217–28. doi: 10.1007/s10802-013-9773-5
Keywords: BELLA study, longitudinal, childhood, depression, patient-reported outcomes, physical functioning, observational study, causality
Citation: Wiehn J, Kurth T, Ravens-Sieberer U, Prugger C, Piccininni M and Reiss F (2024) Effect of elevated depressive symptoms during adolescence on health-related quality of life in young adulthood—a six-year cohort study with repeated exposure measurements. Front. Pediatr. 12:1252964. doi: 10.3389/fped.2024.1252964
Received: 4 July 2023; Accepted: 21 June 2024;
Published: 11 July 2024.
Edited by:
Tim S Nawrot, University of Hasselt, BelgiumReviewed by:
Robert J. Wellman, UMass Chan Medical School, United StatesAndrea-René Angeramo, European University of Rome, Italy
© 2024 Wiehn, Kurth, Ravens-Sieberer, Prugger, Piccininni and Reiss. This is an open-access article distributed under the terms of the Creative Commons Attribution License (CC BY). The use, distribution or reproduction in other forums is permitted, provided the original author(s) and the copyright owner(s) are credited and that the original publication in this journal is cited, in accordance with accepted academic practice. No use, distribution or reproduction is permitted which does not comply with these terms.
*Correspondence: Franziska Reiss, Zi5yZWlzc0B1a2UuZGU=