
95% of researchers rate our articles as excellent or good
Learn more about the work of our research integrity team to safeguard the quality of each article we publish.
Find out more
ORIGINAL RESEARCH article
Front. Pediatr. , 14 June 2023
Sec. Neonatology
Volume 11 - 2023 | https://doi.org/10.3389/fped.2023.1173685
This article is part of the Research Topic Women in Neonatology: 2022 View all 8 articles
 Ruta Morkuniene1
 Tim J. Cole2,†
 Egle Marija Jakimaviciene1
 Agne Bankauskiene3Jelena Isakova4Nijole Drazdiene5Vytautas Basys6
 Janina Tutkuviene1*†
Introduction: There is no global consensus as to which standards are the most appropriate for the assessment of birth weight and length. The study aimed to compare the applicability of regional and global standards to the Lithuanian newborn population by sex and gestational age, based on the prevalence of small or large for gestational age (SGA/LGA).
Materials and Methods: Analysis was performed on neonatal length and weight data obtained from the Lithuanian Medical Birth Register from 1995 to 2015 (618,235 newborns of 24–42 gestational weeks). Their distributions by gestation and sex were estimated using generalized additive models for location, scale, and shape (GAMLSS), and the results were compared with the INTERGROWTH-21st (IG-21) standard to evaluate the prevalence of SGA/LGA (10th/90th centile) at different gestational ages.
Results: The difference in median length at term between the local reference and IG-21 was 3 cm–4 cm, while median weight at term differed by 200 g. The Lithuanian median weight at term was higher than in IG-21 by a full centile channel width, while the median length at term was higher by two channel widths. Based on the regional reference, the prevalence rates of SGA/LGA were 9.7%/10.1% for boys and 10.1%/9.9% for girls, close to the nominal 10%. Conversely, based on IG-21, the prevalence of SGA in boys/girls was less than half (4.1%/4.4%), while the prevalence of LGA was double (20.7%/19.1%).
Discussion: Regional population-based neonatal references represent Lithuanian neonatal weight and length much more accurately than the global standard IG-21 which provides the prevalence rates for SGA/LGA that differ from the true values by a factor of two.
The health status of a newborn is reflected by its body size at birth. Therefore, the assessment of birth weight and length by applying appropriate standards not only plays an essential role in good clinical care but is also sustainable with an increasing evidence of preventable adverse growth-related outcomes (1).
When considering neonatal body size, two groups with an increased risk for negative perinatal outcomes and future cardio-metabolic changes have been identified (2): infants born Small for Gestational Age (SGA) and infants born Large for Gestational Age (LGA). The WHO expert committee defined SGA as infants born below the 10th centile of birth weight for gestational age and sex specific reference population (3). Accordingly, LGA is defined as birth weight above the 90th centile. Importantly, SGA refers to both, infants who are constitutionally small and fall within the lower tail of the distribution and those with intra-uterine growth restriction (IUGR) due to various adverse factors (4).
Moreover, a range of recent publications established the relationship between the preterm newborn body's parameters at birth, postnatal growth restriction and later growth failure with short- and long-term health consequences (5–7).
Thus, from a clinical perspective, the priority would be to reduce health effects related to size at birth by providing a preventive and promotive care, and monitoring for complications (8). Adequate early nutrition is extremely important in clinical practice to foster optimal neurodevelopmental outcomes to avoid negative consequences of aggressive nutritional approaches in the future. However, to provide the mentioned nutrition, doctors must properly evaluate the newborn size according to their gestational age (small, large, and appropriate) at birth. This classification is difficult to achieve, especially for preterm infants who are a unique and highly heterogeneous group. Currently, neonatal standards and references are the most widely used tools for categorizing newborns into sub-groups.
At present, several types of charts for growth assessment of premature newborns are available. One of the commonly used types is intrauterine growth charts based on cross-sectional anthropometric measurements taken from infants of varying gestational ages at birth presented as the gold standard for premature infant growth (9). However, the application of intrauterine growth rates to VLBW infants in an extra-uterine environment is considered controversial (10, 11). Instead, a separate set of postnatal growth curves is promoted. This group of charts reflects the longitudinal growth of preterm infants experiencing various clinical conditions which might be treated with different nutritional management plans (12). And while postnatal growth curves increase our understanding of postnatal preterm born child growth, they also have their drawbacks, such as being too highly influenced by medical and nutritional support practices applied to the sample size (13).
Another point of debate is the choice between customized and population-based references. Proponents of customized charts claim that they improve the prediction of adverse perinatal outcomes and differentiate better between “small-but-healthy” infants and growth-restricted ones (14, 15). Opponents argue that the existing customization models may be confusing pathological and physiological causes of “smallness” and that customizing birthweight centiles for maternal characteristics has little justification (16, 17). Instead, the best estimate of a given infant's birthweight is claimed to be the one that is close to the population average (16).
A similar discussion arises when choosing between the regional or global references (9, 18–21). Recently, the Intergrowth-21st (IG-21) consortium proposed to adopt their single set of international standards for assessment of newborn size and physical status but found little support (22–24). With the rising evidence that there is a normal physiological variation between different countries and ethnic groups, the “one-size-fits-all” standard seems to fit less than expected.
Considering all the above, in this study, we have set several objectives: (a) to construct the national birth weight/length reference values and curves for Lithuanian newborns from 22 to 42 GA weeks; (b) to compare the results with the recently adopted global IG-21 (18, 20) standards; (c) to assess the diagnostic accuracy of clinical practice in identifying and classifying newborns of various gestational age as SGA and LGA infants, by using different tools.
Birth data from the Lithuanian Medical Data of Births for the period of 1995–2015 were retrieved from the Health Information Center of the Institute of Hygiene in Vilnius, Lithuania, including liveborn singletons of between 22 and 42 completed weeks of gestational age (GA). We excluded multiple births, stillbirths, infants with undetermined sex or major congenital malformations and syndromes, and those with incomplete data. Also, the cases where weight or length were more than 3 standard deviations (SD) from the mean, following WHO standards (25), were excluded. In total, 618,235 newborns were included. Figure 1 shows the flow diagram.
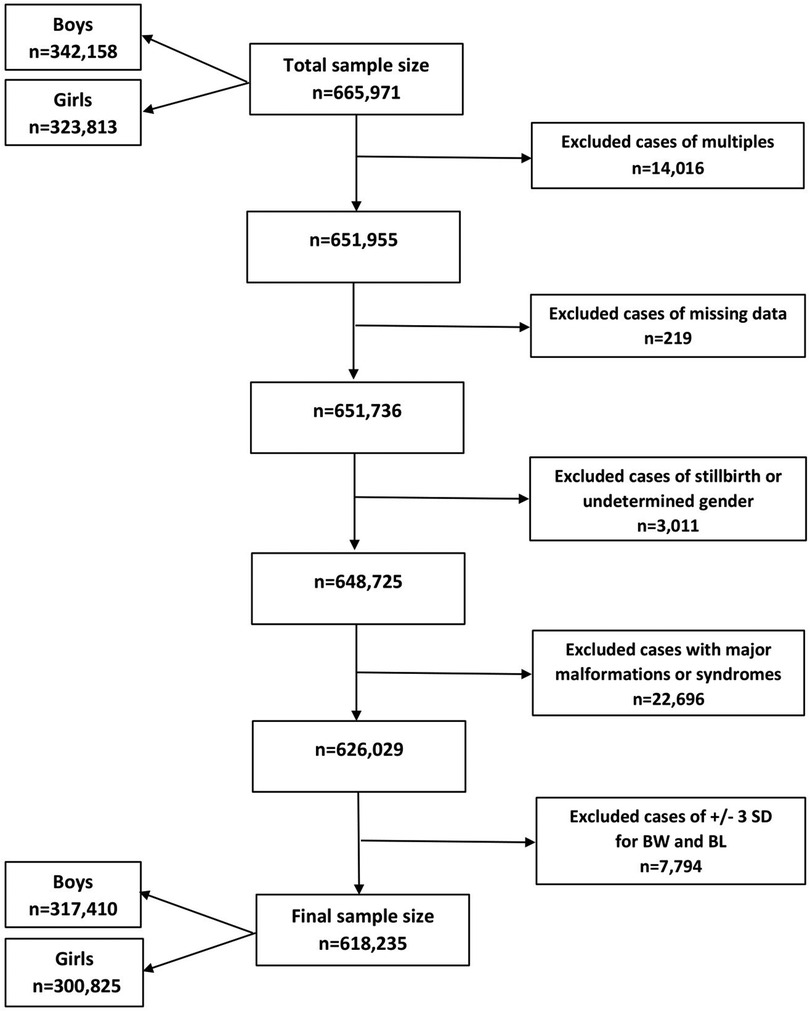
Figure 1. Flow diagram of the sampling procedure and exclusion criteria in this study. BW, birth weight; BL, birth length; n, number; SD, standard deviation.
The LMS method estimates growth reference centiles by modelling any skewness present in the measurement distribution (26). It assumes that a power transformation can normalize the data by adjusting for skewness. LMST method (27) is an extension of the LMS method that models both skewness and leptokurtosis using the Box-Cox t (BCT) distribution. It can be used to model excess kurtosis over the normal distribution (leptokurtic data) when the Box-Cox transformation fails to transform the data close to normality due to the presence of kurtosis. The BCT distribution is defined by a power transformation, Yν, which follows a truncated t distribution that is shifted and scaled. The truncated t distribution has a degrees of freedom parameter, τ. The BCT distribution is characterized by four parameters and is denoted as BCT (µ, σ, ν, τ). The parameters µ, σ, ν and τ may be interpreted as relating to location (median), scale (centile-based coefficient of variation), skewness (power transformation to symmetry) and kurtosis (degrees of freedom), respectively.
Generalized additive models for location, scale, and shape (GAMLSS) were fitted to obtain the centile (3rd, 10th, 25th, 50th, 75th, 90th and 97th) reference values and curves of birth weight/length by GA and sex separately (26). The LMST method (BCT distribution) was applied to the data obtained on each sex and each measurement. The resulting main centiles (3rd, 10th, 50th, 90th and 97th) from 24 gestational weeks were compared with their counterparts in IG-21 (18, 20). The analysis was carried out using the GAMLSS package (version 4.3-3) of R 4.0.3 (28).
Two published standards of the IG-21 project (18, 20) were presented for both sexes for every gestational week and day separately (e.g., 30 + 0, 30 + 1), while GA of the present study was recorded as complete gestational weeks (e.g., 30, 31). Therefore, the comparison of present study with IG-21 project by GA was made comparing the middle day of gestational week of IG-21 (i.e., 30 + 3) which referred to the mean of birth weight/length of the certain gestational week. The validity of this procedure was checked and proved mathematically. The frequency and percentage of neonates meeting the criteria for SGA defined as birth weight below the 10th centile and LGA defined as birth weight above the 90th centile were determined and compared using the cut-off values based on our reference and the IG-21.
The sample size of our study (Table 1) increased steeply with gestational age from less than 50 neonates at 22–24 gestational weeks to more than 140,000 at term for each sex. The mean birth weight of boys was ∼50–100 g larger than for girls at preterm gestations, and larger by ∼100–180 g at term and post-term periods. The difference in mean birth length between sexes varied mainly from 0.1 to 0.6 cm at preterm period, and from 0.6 to 0.8 cm at later gestations (Table 1).
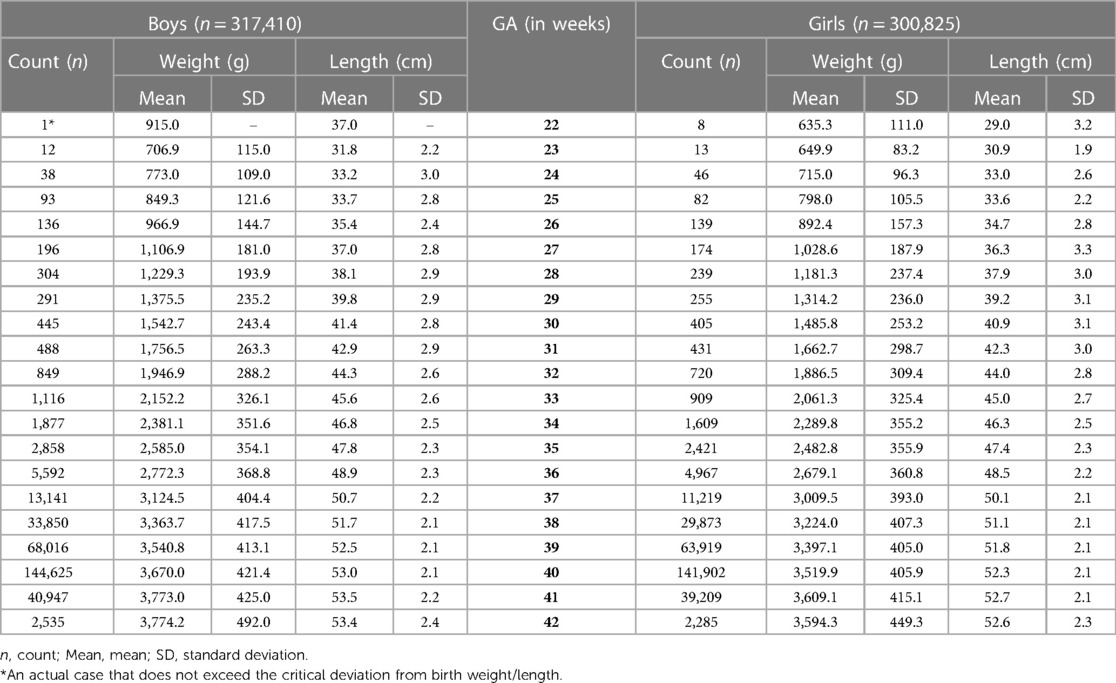
Table 1. Birth weight (g) and length (cm) of Lithuanian newborns by sex and gestational age (GA).
Our study constructed the 3rd, 10th, 25th, 50th, 75th, 90th, and 97th smoothed centile curves according to gestational age and sex for birth weight and length of Lithuanian newborns (Figures 2–5). The variability of birth weight rose with gestational age for both sexes. In contrast, the variability of birth length fell with increasing gestation, and negative skewness in the distribution was evident (Figures 2–5). Tables 2, 3 demonstrate the values of smoothed gestational age- and sex-adjusted centiles (3rd–97th) for birth weight/length of Lithuanian newborns. The LMS parameters for birth weight/length by sex and gestational age are presented in Supplementary Tables S1, S2.
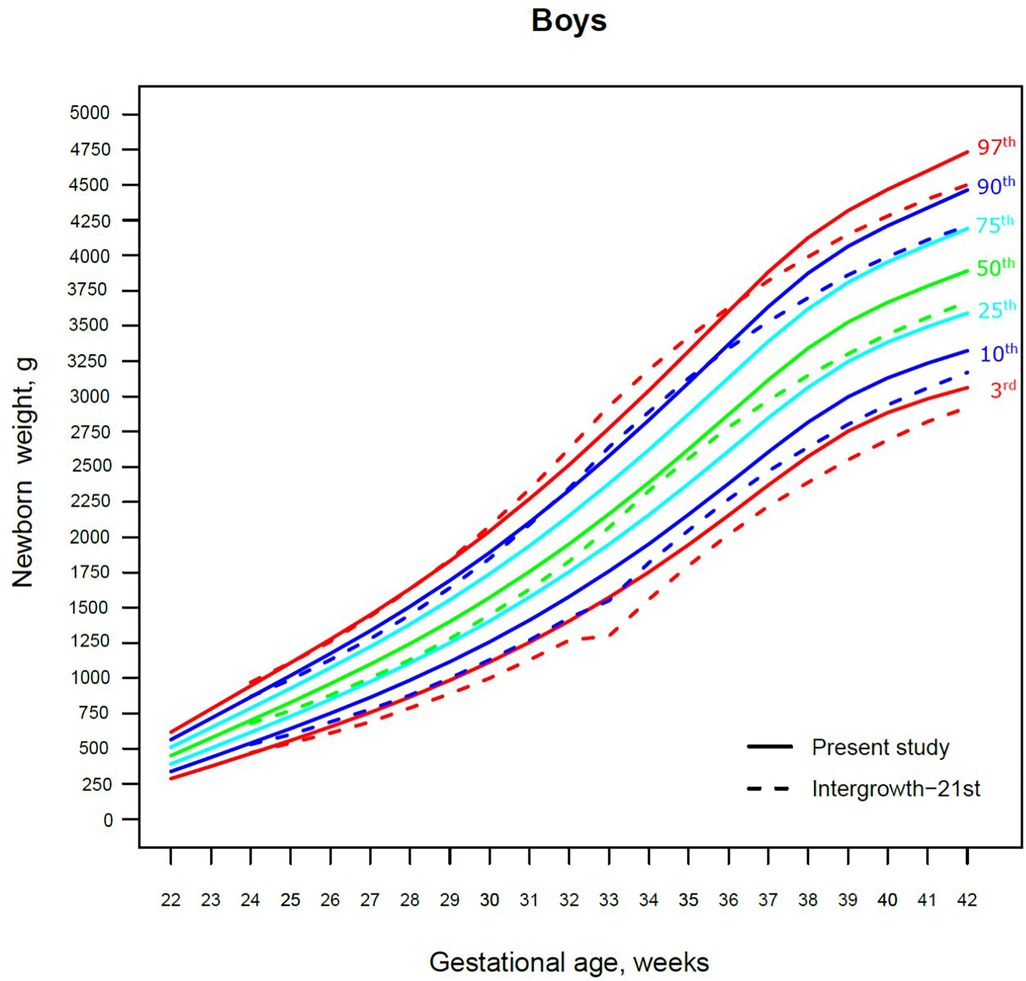
Figure 2. The 3rd, 10th, 25th, 50th, 75th, 90th and 97th smoothed centile curves for birth weight (g) in Lithuanian boys and the 3rd, 10th, 50th, 90th and 97th centiles for INTERGROWTH-21st.
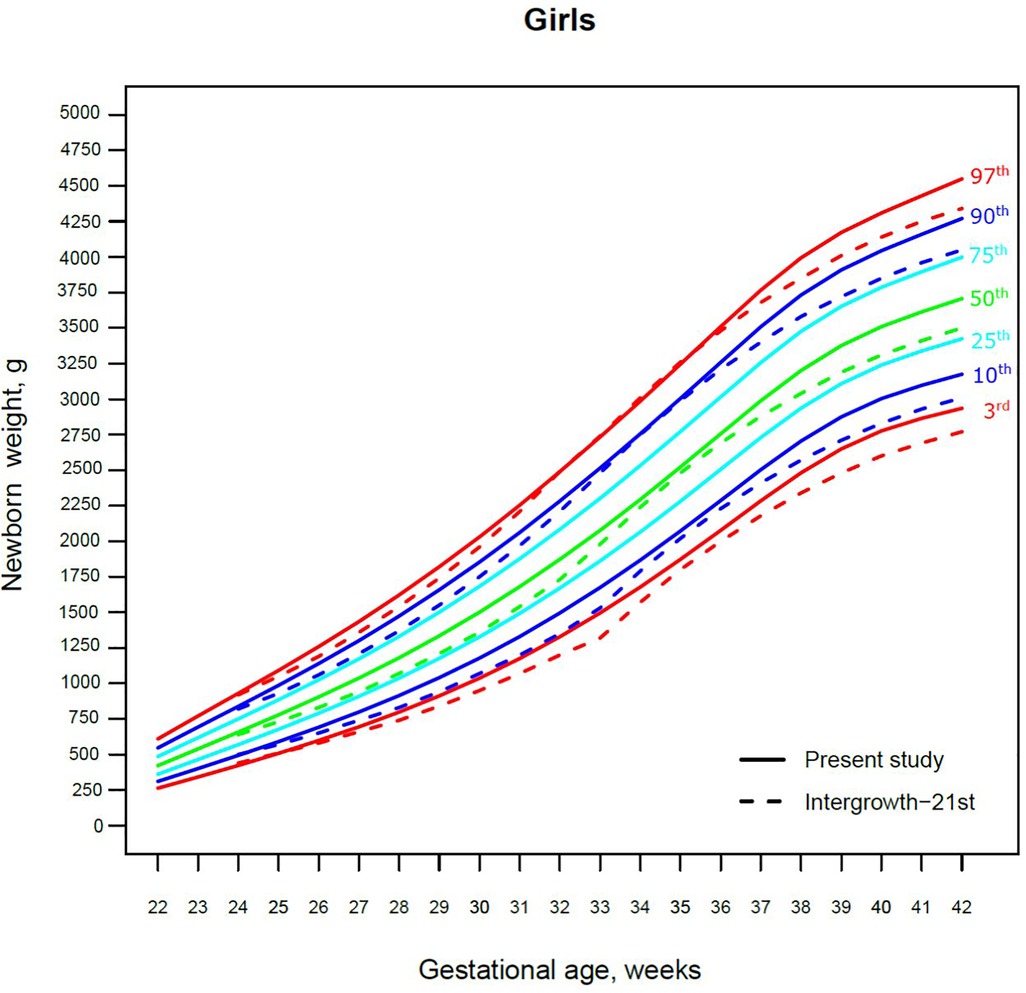
Figure 3. The 3rd, 10th, 25th, 50th, 75th, 90th and 97th smoothed centile curves for birth weight (g) in Lithuanian girls and the 3rd, 10th, 50th, 90th and 97th centiles for INTERGROWTH-21st.
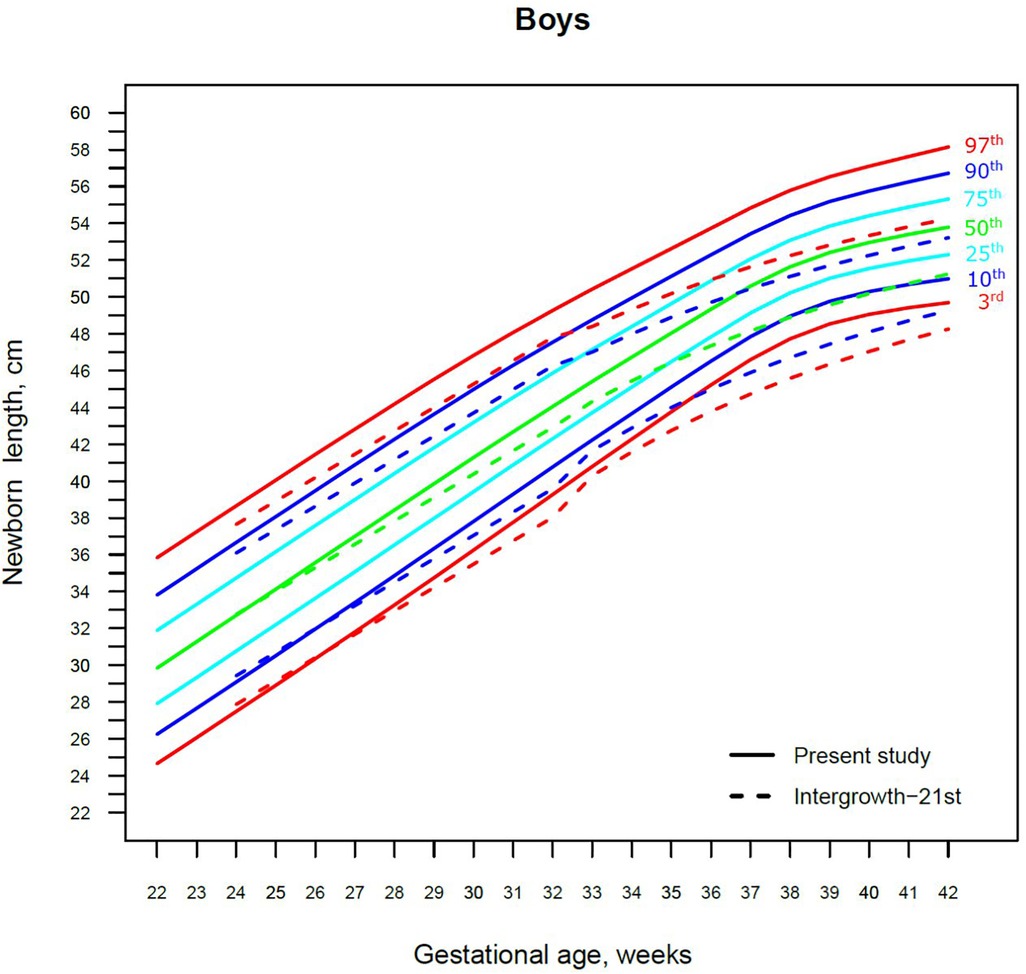
Figure 4. The 3rd, 10th, 25th, 50th, 75th, 90th and 97th smoothed centile curves for birth length (cm) in Lithuanian boys and the 3rd, 10th, 50th, 90th and 97th centiles for INTERGROWTH-21st.
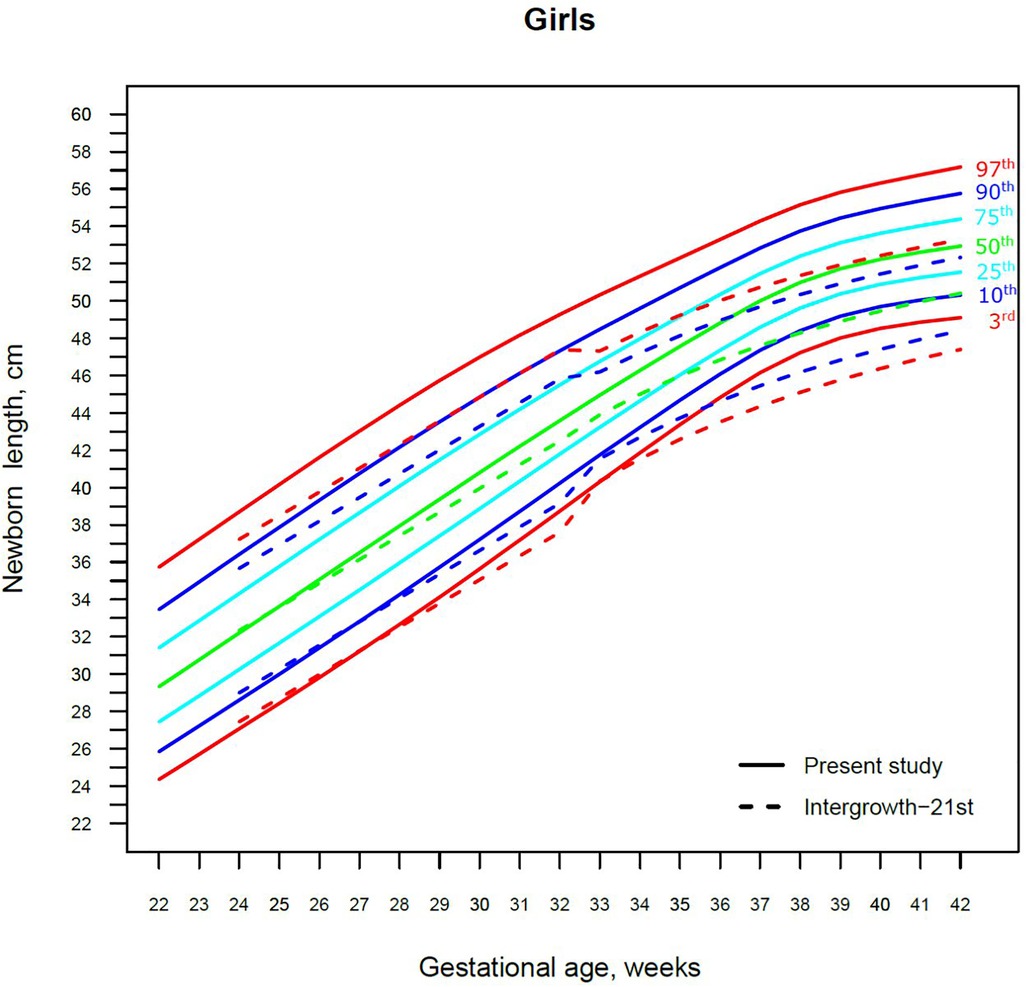
Figure 5. The 3rd, 10th, 25th, 50th, 75th, 90th and 97th smoothed centile curves for birth length (cm) in Lithuanian girls and the 3rd, 10th, 50th, 90th and 97th centiles for INTERGROWTH-21st.
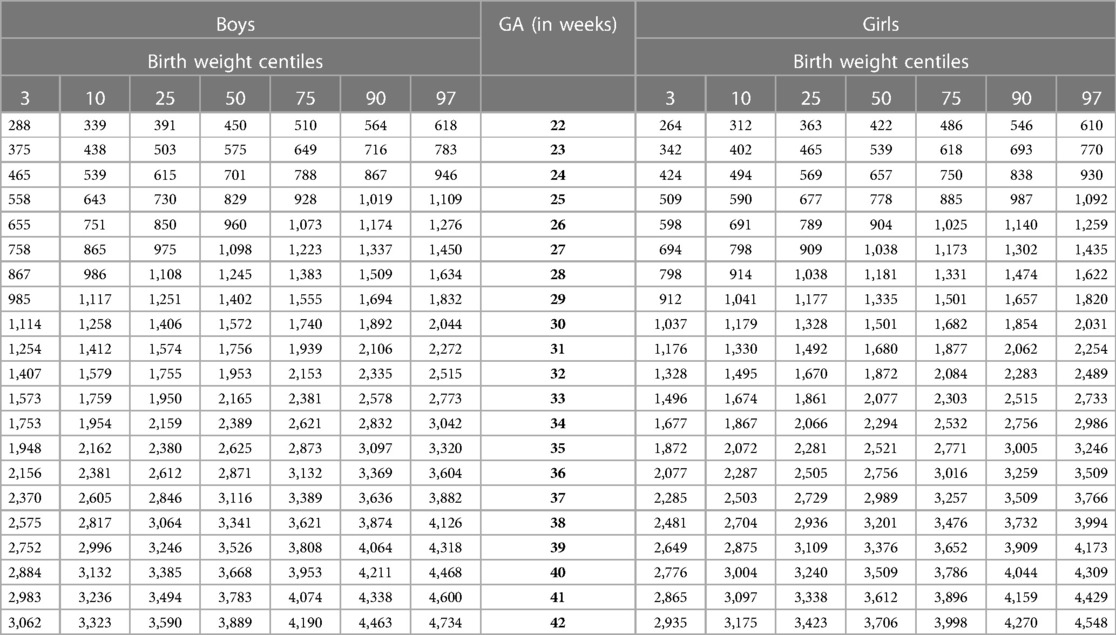
Table 2. Smoothed centiles for Lithuanian birth weight (g) by sex and gestational age (GA).
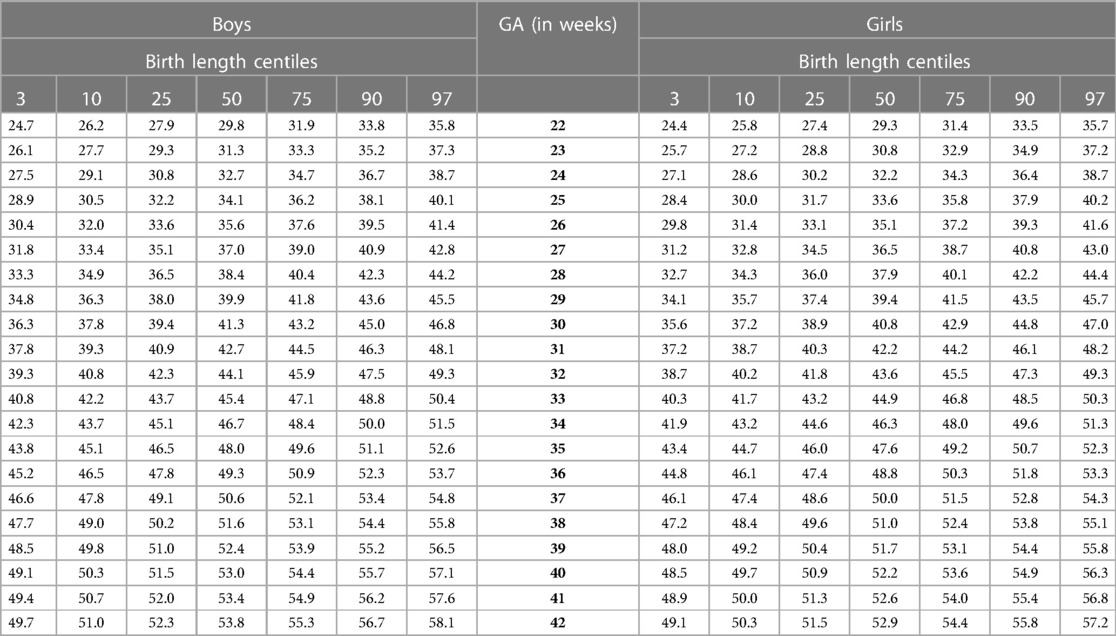
Table 3. Smoothed centiles for Lithuanian birth length (cm) by sex and gestational age (GA).
The 3rd, 50th and 97th Lithuanian birth weight centiles by sex and gestation were similar to those of IG-21 at extremely early gestations (24–27 weeks), especially for boys and the 97th centile (Figures 2, 3). With increasing gestation, and particularly after 37 weeks, the gap between the Lithuanian and IG-21 centiles widened to almost one centile channel or two-thirds of an SD (Figures 2, 3). The IG-21 median was close to the Lithuanian 25th centile (difference of ∼200 g), while the 97th IG-21 centile was near the Lithuanian 90th (difference of ∼350 g). At the 3rd centile, the differences among term newborns (37–40 gestational weeks) were more pronounced (200 g) than post-term (100 g) (Figures 2, 3).
For birth length, the median and lower IG-21 centiles were close to the Lithuanian centiles at early gestations, while the higher centiles differed by almost a full centile channel, i.e., 1.0–1.5 cm (Figures 4, 5). In late preterm (34–36 weeks) the differences became more pronounced and extended across all centiles, the gap widening to nearly two centile channels. The 97th IG-21 centile fell to near the Lithuanian 50th, while the 50th IG-21 centile fell to the Lithuanian 10th. At the 50th and 97th centiles, the differences at term amounted to 3 cm–4 cm, while at the 3rd centile, the difference was less at 2 cm (Figures 4, 5).
A total of 9.7% (30,859) boys were SGA based on the Lithuanian 10th centile, compared to 4.1% based on the IG-21 10th centile, less than half the prevalence (Table 4). Similarly for girls, the prevalence of SGA was 10.1% Lithuanian (30,439) vs. 4.4% IG-21. Both instruments showed the highest prevalence of SGA in very and late preterm and post-term gestations of both sexes. What is more, the older the gestational age, the larger the discrepancy between the studies. At extremely preterm gestations (24–27 weeks), IG-21 underestimated SGA in boys by up to 3.1%, and in girls up to 6.9%. The largest SGA discrepancies at term and post-term were 6.9% for boys and 8.1% for girls (Table 4). The 10th centile curves in Figures 2, 3 illustrate the discrepancies in SGA. The IG-21 10th centile is close to the Lithuanian 3rd centile until 32 weeks, and only slightly higher at later gestations (Figures 2, 3).
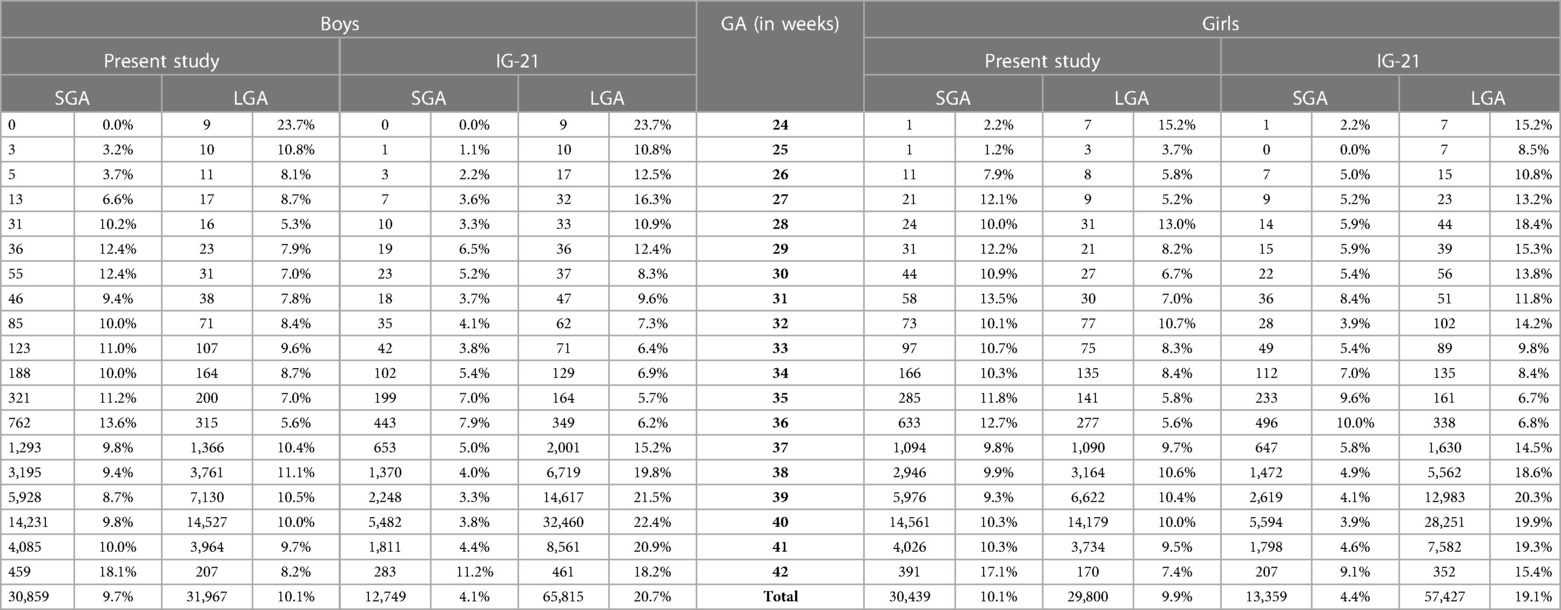
Table 4. Prevalence of small for gestational age (SGA, birth weight <10th centile) and large for gestational age (LGA, birth weight >90th centile) according to the present study's Lithuanian reference and INTERGROWTH-21st (IG-21) by sex and gestational age (GA).
In contrast, the incidence of LGA was 10.1% (31,972) for boys based on the Lithuanian 90th centile as against 20.7% using the IG-21 90th centile, i.e., more than double (Table 4). Similarly in girls, LGA prevalence was 9.9% (29,810) vs. 19.1%. The differences in prevalence were particularly marked in extremely preterm (4.4%–8%) and term, post-term periods (the difference of 4.8%–12.4% more expressed for boys). The 90th centile curves in Figures 2, 3 illustrate the discrepancies in LGA between the studies. The IG-21 90th centile is near the Lithuanian 75th centile at extremely preterm and term, with a gap of almost one centile channel post-term (Figures 2, 3).
Growth centiles as clinical tools for assessing the infant's physical status have gained much importance in recent years. The choices between global or regional, and between customized and population-based growth references or growth standards for different populations are under debate (29, 30). The findings of our study advocate the use of regional population-based growth curves that more precisely represent the neonatal body size of Lithuanian population than the global standard IG-21 which provides the prevalence rates for SGA/LGA that differ from the true values by a factor of two in term neonates.
Our study revealed slightly better agreement in the main centiles of extremely preterm newborns (Figures 2–5). However, considering the way too modest sample size for <37 gestational weeks of the IG-21 (18), the parallels observed between the studies in the extreme centiles at early gestations should be evaluated with caution. A low sample size may explain the “waves” observed at 33 gestational weeks in the centile curves of the IG-21 (Figures 2–5).
Moreover, a larger discrepancy was observed starting from the late preterm period (34–36 gestational weeks) with certain disparities evident in mean newborn weight and length data at term (Figures 2–5). Noteworthy, our previous study comparing the Lithuanian neonatal head circumference reference with the IG-21 showed similar concerning results for term newborns (31). Likewise, other studies from different continents also found their regional neonatal reference charts to be significantly different from the neonatal standards provided by the IG-21 (24, 29, 32–35). In spite of the fact that the IG-21 found some support (36, 37), an increasing number of studies consider the IG-21 with caution including the findings of our study that support this position.
In addition, the insights drawn from the comparison of centiles between the studies when supplemented with the categorization of newborns as SGA/LGA (Table 4) demonstrate a particular relevance of the application of these standards in clinical practice. The SGA/LGA outliers were derived from the same sample of Lithuanian newborns as the regional neonatal reference curves. As shown in the results, both tails of the birth weight distribution would be strongly affected if evaluated by international standard. The possibility to evaluate the prevalence of SGA/LGA newborns at all gestational weeks may be considered a major strength of our study. While there are studies examining the newborn size categorization at term period depending on the tools used (2, 33, 38), less of them are focused on the SGA/LGA prevalence in different gestations (39). This is of a particular interest in terms of a deeper understanding of biological processes during the fetal development. Fetal growth is characterized by rapid cellular hyperplasia during the first 16 weeks, cellular hyperplasia combined with hypertrophy extending up to 32 gestational week, and cellular hypertrophy dominating afterwards till term (40). This explains the different outcomes and prognosis of being categorized as SGA at different gestational age. When the phase of cellular hyperplasia is affected (early type or symmetric hypertrophy), irreversible neurological and other sequelae of the bodily systems take place. Thus, SGA newborns born less than 32 gestational weeks experience a higher risk of death and major morbidities (41). When the phase of cellular hypertrophy is affected (late type or asymmetric hypertrophy), the processes are reversible if hypoxic ischemic encephalopathy is avoided, and the prognosis for such neonates is much more optimistic. Indeed, while newborns with birth weight of <10th centile (mild hypotrophy) may be intrinsically small because of normal biological, ethnic and other factors, it would be clinically meaningful to pay great attention to the newborns born of less than 3rd centile (severe hypotrophy) as the ones having most adverse outcomes. In this context, emphasis should be laid that adapting suitable neonatal charts is highly important for clinical practice, as failure to do so may lead to misclassification of newborns in need of timely interventions to avoid adverse consequences to their future health. Indeed, clinical decisions should be based on careful evaluation of the individual clinical case, and suitable neonatal charts are one of the tools in the decision-making algorithm.
In addition to the strengths mentioned above, our study has some limitations. Using these growth centiles for monitoring postnatal growth of preterm infants may not be realistic or ideal, because they do not reflect the initial water and weight loss that occurs in infants during the first 2–3 weeks (11, 42). Understanding this, we have set ourselves a goal of creating growth curves based on longitudinal growth data in the future.
It should also be noted that IG-21 was designed to become an international standard and included only low-risk pregnancies with women whose health and nutritional needs were met and who received adequate antenatal care in 8 socioeconomically stable developing or developed countries such as Lithuania. The data of our study included all births regardless of maternal socioeconomic status. Therefore, we believe that the main findings of our study would be even more pronounced if we had only applied the same inclusion criteria as IG-21. There are around 15% of ethnic minorities in Lithuania and Lithuanian newborns were found to be the biggest in size in comparison to newborns of other ethnic groups (43). What is more, our previous comparison (43) of newborns’ weight by mother's ethnicity in relation to education level revealed nearly no discrepancies between size of newborns from mothers with the same education level at different ethnic groups. Thus, even if ethnic differences may have influenced the discrepancies of this study, socioeconomic factors probably would be determining.
In conclusion, the global standard IG-21 should be considered with caution, as requiring validation before implementation. Instead, the findings of our study advocate the use of regional population-based neonatal centiles that more accurately represent the size of the Lithuanian newborn population. Furthermore, the prevalence of SGA/LGA at different gestations depending on the instrument used reveals the clinical importance of using local standards to benefit the most vulnerable infant populations.
The data are available from the authors upon a reasonable request and with the permission of the Health Information Center of the Institute of Hygiene of Lithuania.
The studies involving human participants were reviewed and approved by the Lithuanian Bioethics Committee (Permission No. 57, last update of February 6, 2017) and was performed in accordance with the relevant ethical guidelines and regulations. Written informed consent from the participants’ legal guardian/next of kin was not required to participate in this study in accordance with the national legislation and the institutional requirements.
RM analysed the data, performed the calculations, and took the lead in writing the manuscript with input from other authors. JT raised the main conceptual idea, designed and supervised the study, helped in data interpretation and manuscript writing, and revised the final version. TJC contributed to revising the manuscript and advising on the valuable improvements to the quality and the conceptual idea of the study. EJ, ND, and VB contributed to the interpretation of the results and the final version of the manuscript. JI collected the database according to the required inclusion criteria. AB performed the statistical analysis and provided suggestions for data interpretation. All authors contributed to the article and approved the submitted version.
The authors declare that the research was conducted in the absence of any commercial or financial relationships that could be construed as a potential conflict of interest.
All claims expressed in this article are solely those of the authors and do not necessarily represent those of their affiliated organizations, or those of the publisher, the editors and the reviewers. Any product that may be evaluated in this article, or claim that may be made by its manufacturer, is not guaranteed or endorsed by the publisher.
The Supplementary Material for this article can be found online at: https://www.frontiersin.org/articles/10.3389/fped.2023.1173685/full#supplementary-material.
1. Rugolo LS. Growth and developmental outcomes of the extremely preterm infant. J Pediatr (Rio J). (2005) 81:S101–10. doi: 10.2223/1309
2. Chiavaroli V, Marcovecchio ML, de Giorgis T, Diesse L, Chiarelli F, Mohn A. Progression of cardio-metabolic risk factors in subjects born small and large for gestational age. PLoS One. (2014) 9(8):e104278. doi: 10.1371/journal.pone.0104278
3. WHO Expert Committee on Physical Status: the Use and Interpretation of Anthropometry (1993: Geneva S, Organization WH). Physical status: the use of and interpretation of anthropometry, report of a WHO expert committee. World Health Organization. (1995). Available at: https://apps.who.int/iris/handle/10665/37003 (Cited February 1, 2023).
4. Smith GCS, Lees CC. Disorders of fetal growth and assessment of fetal well-being. In: Edmonds DK, editor. Dewhurst’s textbook of obstetrics & gynaecology. London, UK: John Wiley & Sons, Ltd (2012). p. 200–7. Available at: https://onlinelibrary.wiley.com/doi/abs/10.1002/9781119979449.ch18 (Cited February 1, 2023).
5. Casey PH. Growth of low birth weight preterm children. Semin Perinatol. (2008) 32(1):20–7. doi: 10.1053/j.semperi.2007.12.004
6. Euser AM, Wit Cd, Finken MJJ, Rijken M, Wit JM. Growth of preterm born children. HRP. (2008) 70(6):319–28. doi: 10.1159/000161862
7. Curtis MD, Rigo J. Extrauterine growth restriction in very-low-birthweight infants. Acta Pædiatrica. (2004) 93(12):1563–8. doi: 10.1111/j.1651-2227.2004.tb00844.x
8. WHO recommendations for care of the preterm or low-birth-weight infant. Available at: https://www.who.int/publications-detail-redirect/9789240058262 (Cited February 2, 2023).
9. Fenton TR. A new growth chart for preterm babies: babson and benda’s chart updated with recent data and a new format. BMC Pediatr. (2003) 3:13. doi: 10.1186/1471-2431-3-13
10. Thomas P, Peabody J, Turnier V, Clark RH. A new look at intrauterine growth and the impact of race, altitude, and gender. Pediatrics. (2000) 106(2):E21. doi: 10.1542/peds.106.2.e21
11. Moyer-Mileur LJ. Anthropometric and laboratory assessment of very low birth weight infants: the most helpful measurements and why. Semin Perinatol. (2007) 31(2):96–103. doi: 10.1053/j.semperi.2007.02.006
12. Ehrenkranz RA, Younes N, Lemons JA, Fanaroff AA, Donovan EF, Wright LL, et al. Longitudinal growth of hospitalized very low birth weight infants. Pediatrics. (1999) 104(2 Pt 1):280–9. doi: 10.1542/peds.104.2.280
13. Olsen IE, Richardson DK, Schmid CH, Ausman LM, Dwyer JT. Intersite differences in weight growth velocity of extremely premature infants. Pediatrics. (2002) 110(6):1125–32. doi: 10.1542/peds.110.6.1125
14. Gibbons K, Chang A, Flenady V, Mahomed K, Gardener G, Gray PH, et al. Customised birthweight models: do they increase identification of at-risk infants? J Paediatr Child Health. (2013) 49(5):380. doi: 10.1111/jpc.12189
15. Gardosi J, Francis A, Turner S, Williams M. Customized growth charts: rationale, validation and clinical benefits. Am J Obstet Gynecol. (2018) 218(2, Supplement):S609–18. doi: 10.1016/j.ajog.2017.12.011
16. Hutcheon JA, Zhang X, Platt RW, Cnattingius S, Kramer MS. The case against customised birthweight standards. Paediatr Perinat Epidemiol. (2011) 25(1):11–6. doi: 10.1111/j.1365-3016.2010.01155.x
17. Hutcheon JA, Zhang X, Cnattingius S, Kramer MS, Platt RW. Customised birthweight percentiles: does adjusting for maternal characteristics matter? BJOG. (2008) 115(11):1397–404. doi: 10.1111/j.1471-0528.2008.01870.x
18. Villar J, Giuliani F, Fenton TR, Ohuma EO, Ismail LC, Kennedy SH. INTERGROWTH-21st very preterm size at birth reference charts. Lancet. (2016) 387(10021):844–5. doi: 10.1016/S0140-6736(16)00384-6
19. Villar J, Giuliani F, Bhutta ZA, Bertino E, Ohuma EO, Ismail LC, et al. Postnatal growth standards for preterm infants: the preterm postnatal follow-up study of the INTERGROWTH-21 st project. Lancet Glob Health. (2015) 3(11):e681–91. doi: 10.1016/S2214-109X(15)00163-1
20. Villar J, Ismail LC, Victora CG, Ohuma EO, Bertino E, Altman DG, et al. International standards for newborn weight, length, and head circumference by gestational age and sex: the newborn cross-sectional study of the INTERGROWTH-21st project. Lancet. (2014) 384(9946):857–68. doi: 10.1016/S0140-6736(14)60932-6
21. Fenton TR, Kim JH. A systematic review and meta-analysis to revise the fenton growth chart for preterm infants. BMC Pediatr. (2013) 13(1):59. doi: 10.1186/1471-2431-13-59
22. Francis A, Hugh O, Gardosi J. Customized vs INTERGROWTH-21st standards for the assessment of birthweight and stillbirth risk at term. Am J Obstet Gynecol. (2018) 218(2):S692–9. doi: 10.1016/j.ajog.2017.12.013
23. Lee AC, Kozuki N, Cousens S, Stevens GA, Blencowe H, Silveira MF, et al. Estimates of burden and consequences of infants born small for gestational age in low and middle income countries with INTERGROWTH-21st standard: analysis of CHERG datasets. Br Med J. (2017) 358:j3677. doi: 10.1136/bmj.j3677
24. Fay E, Hugh O, Francis A, Katz R, Sitcov K, Souter V, et al. Customized GROW vs INTERGROWTH-21st birthweight standards to identify small for gestational age associated perinatal outcomes at term. Am J Obstet Gynecol MFM. (2022) 4(2):100545. doi: 10.1016/j.ajogmf.2021.100545
25. Weltgesundheitsorganisation, Onis M de, Weltgesundheitsorganisation, editors. WHO Child growth standards: Length/height-for-age, weight-for-age, weight-for-length, weight-for-height and body mass index-for-age ; methods and development. Geneva: WHO Press (2006). 312.
26. Cole TJ. The LMS method for constructing normalized growth standards. Eur J Clin Nutr. (1990) 44(1):45–60.2354692
27. Rigby RA, Stasinopoulos DM. Using the box-cox t distribution in GAMLSS to model skewness and kurtosis. Stat Modelling. (2006) 6(3):209–29. doi: 10.1191/1471082X06st122oa
28. R: The R Project for Statistical Computing. Available at: https://www.r-project.org/ (Cited January 14, 2023).
29. Bendor-Samuel OM, Zivanovic S, Odd D, Roehr CC. A comparison of UK preterm anthropometric charts and INTERGROWTH-21st: is it time to change growth charts? NEO. (2020) 117(3):300–7. doi: 10.1159/000507024
30. Sletner L, Kiserud T, Vangen S, Nakstad B, Jenum AK. Effects of applying universal fetal growth standards in a scandinavian multi-ethnic population. Acta Obstet Gynecol Scand. (2018) 97(2):168–79. doi: 10.1111/aogs.13269
31. Morkuniene R, Tutkuviene J, Cole TJ, Jakimaviciene EM, Isakova J, Bankauskiene A, et al. Neonatal head circumference by gestation reflects adaptation to maternal body size: comparison of different standards. Sci Rep. (2022) 12(1):11057. doi: 10.1038/s41598-022-15128-3
32. Zhang YQ, Li H, Zong XN, Wu HH. Comparison of updated birth weight, length and head circumference charts by gestational age in China with the INTERGROWTH-21st NCSS charts: a population-based study. World J Pediatr. (2023) 19(1):96–105. doi: 10.1007/s12519-022-00631-4
33. Jakubowski D, Salloum D, Maciejewski M, Bednarek-Jędrzejek M, Kajdy A, Cymbaluk-Płoska A, et al. Comparison of application of fenton, intergrowth-21st and WHO growth charts in a population of Polish newborns. CEOG. (2021) 48(4):949–54. doi: 10.31083/j.ceog4804150
34. Cardoso VC, Grandi C, Silveira RC, Duarte JLB, Viana MCFB, Ferreira DdL, et al. Growth phenotypes of very low birth weight infants for prediction of neonatal outcomes from a Brazilian cohort: comparison with INTERGROWTH. J Pediatr (Rio J). (2023) 99(1):86–93. doi: 10.1016/j.jped.2022.07.007
35. Anderson NH, Sadler LC, McKinlay CJD, McCowan LME. INTERGROWTH-21st vs customized birthweight standards for identification of perinatal mortality and morbidity. Am J Obstet Gynecol. (2016) 214(4):509.e1–e7. doi: 10.1016/j.ajog.2015.10.931
36. Silveira RC, Procianoy RS. Preterm newborn’s postnatal growth patterns: how to evaluate them. J Pediatr (Rio J). (2019) 95:S42–8. doi: 10.1016/j.jped.2018.10.006
37. Fernandez MT, Martinez RG, Lopez AIA, Perales AB. A comparasion between intergrowth-21 and spanish neonatal standards applied to very low birth weight infants. Clin Nutr ESPEN. (2020) 40:673. doi: 10.1016/j.clnesp.2020.09.807
38. Hocquette A, Durox M, Wood R, Klungsøyr K, Szamotulska K, Berrut S, et al. International versus national growth charts for identifying small and large-for-gestational age newborns: a population-based study in 15 European countries. Lancet Reg Health Eur. (2021) 8:1–9. doi: 10.1016/j.lanepe.2021.100167 Available at: https://www.thelancet.com/journals/lanepe/article/PIIS2666-7762(21)00144-7/fulltext (Cited February 1, 2023).34557855
39. Anne RP, Vardhelli V, Murki S, Deshabhotla SK, Oleti TP. Comparison of fenton, INTERGROWTH-21st, and population-based growth charts in predicting outcomes of very preterm small-for-gestational-age neonates. Indian J Pediatr. (2022) 89(10):1034–6. doi: 10.1007/s12098-022-04175-3
40. Cunningham FG, Leveno KJ, Bloom SL, Dashe JS, Hoffman BL, Casey BM, et al. Fetal-Growth disorders. In: Cunningham F, Leveno KJ, Bloom SL, Dashe JS, Hoffman BL, Casey BM, et al. editors. Williams obstetrics, 25th ed. New York, NY: McGraw-Hill Education (2018) p. 844–62. Available at: accessmedicine.mhmedical.com/content.aspx?aid=1160784580 (Cited January 31, 2023).
41. Jensen EA, Foglia EE, Dysart KC, Simmons RA, Aghai ZH, Cook A, et al. Adverse effects of small for gestational age differ by gestational week among very preterm infants. Arch Dis Child Fetal Neonatal Ed. (2019) 104(2):F192–8. doi: 10.1136/archdischild-2017-314171
42. Cole TJ, Statnikov Y, Santhakumaran S, Pan H, Modi N, on behalf of the Neonatal Data Analysis Unit and the Preterm Growth Investigator Group. Birth weight and longitudinal growth in infants born below 32 weeks’ gestation: a UK population study. Arch Dis Child Fetal Neonatal Ed. (2014) 99(1):F34–40. doi: 10.1136/archdischild-2012-303536
Keywords: birth, growth charts, newborns, preterm (birth), SGA (small for gestational age), LGA (large for gestational age), global, regional
Citation: Morkuniene R, Cole TJ, Jakimaviciene EM, Bankauskiene A, Isakova J, Drazdiene N, Basys V and Tutkuviene J (2023) Regional references vs. international standards for assessing weight and length by gestational age in Lithuanian neonates. Front. Pediatr. 11:1173685. doi: 10.3389/fped.2023.1173685
Received: 24 February 2023; Accepted: 30 May 2023;
Published: 14 June 2023.
Edited by:
Ju Lee Oei, University of New South Wales, AustraliaReviewed by:
Elena Spada, Independent researcher, Milan, Italy© 2023 Morkuniene, Cole, Jakimaviciene, Bankauskiene, Isakova, Drazdiene, Basys and Tutkuviene. This is an open-access article distributed under the terms of the Creative Commons Attribution License (CC BY). The use, distribution or reproduction in other forums is permitted, provided the original author(s) and the copyright owner(s) are credited and that the original publication in this journal is cited, in accordance with accepted academic practice. No use, distribution or reproduction is permitted which does not comply with these terms.
*Correspondence: Janina Tutkuviene amFuaW5hLnR1dGt1dmllbmVAbWYudnUubHQ=
†These authors have contributed equally to this work and share senior authorship
Disclaimer: All claims expressed in this article are solely those of the authors and do not necessarily represent those of their affiliated organizations, or those of the publisher, the editors and the reviewers. Any product that may be evaluated in this article or claim that may be made by its manufacturer is not guaranteed or endorsed by the publisher.
Research integrity at Frontiers
Learn more about the work of our research integrity team to safeguard the quality of each article we publish.