 Zhimeng Huang
 Yue Qiu2
 Jinzhun Wu
95% of researchers rate our articles as excellent or good
Learn more about the work of our research integrity team to safeguard the quality of each article we publish.
Find out more
ORIGINAL RESEARCH article
Front. Pediatr. , 25 May 2023
Sec. Genetics of Common and Rare Diseases
Volume 11 - 2023 | https://doi.org/10.3389/fped.2023.1132885
Objective: To explore the relationship between common air pollution and common birth defects, and to provide reference for the prevention of birth defects.
Methods: We conducted a case-control study in Xiamen, a city in southeastern China from 2019 to 2020. Logistics regression was used to analyze the relationship between sulfur dioxide(SO2), fine particulate matter 2.5(PM2.5), nitrogen dioxide(NO2), ozone(O3), carbon monoxide(CO) and the occurrence of common birth defects such as congenital heart disease, facial cleft, and finger deformity.
Results: SO2 significantly increased the risk of birth defects such as congenital heart disease, cleft lip and/or cleft palate, and ear deformity in the first and second months of pregnancy.
Conclusion: Exposure to common air pollutants increases the risk of birth defects, and SO2 significantly affects the occurrence of birth defects in the first two months of pregnancy.
Birth defects also known as congenital malformations or congenital diseases, is due to external environmental factors, genetic factors or both lead to embryonic growth, differentiation in the process of structural, functional, metabolic abnormalities (1). With the advancement of modern medicine, the number of perinatal deaths has decreased by 23.5%, of which 40% are due to infectious diseases, while perinatal deaths caused by congenital malformations have only decreased by 8.4%, indicating the importance of preventing birth defects (2), Children with birth defects are more likely to suffer from neonatal asphyxia, infections and even death in hospital than those without birth defects, research suggests (3). Congenital malformations are the second most common cause of infant death after preterm birth, accounting for at least 20% of infant deaths (4). According to the data released by China’s latest birth defect prevention and control report, the incidence of birth defects in China is close to 5.6% in middle-income developed countries, with an annual increase of about 900,000 cases. The proportion of birth defects in infant deaths has risen from the fourth to the second (5).
About 65%–75% of the causes of birth defects are caused by multiple genes or other mixed factors, of which monogenic diseases account for about 15%–20%, chromosomal abnormalities account for about 5%, and environmental factors account for about 10% (6). Air pollutants such as O3, PM2.5, PM10 can increase the incidence of respiratory infections, asthma, coronary heart disease, birth defects and other diseases, eventually leading to increased mortality (7, 8). Since 2005, Beate Ritz used a case-control study to find that with the increase of CO exposure dose, the incidence of ventricular septal defect increased in a dose-response relationship. Similarly, the risk of aortic valve defects, pulmonary valve malformations, and conotruncal defects also increased with increasing O3 exposure (9). The research on air pollution and birth defects is more and more in-depth. For example, Cijiang Yao et al.divided the period of air pollution exposure into four periods: pre-pregnancy and pregnancy, and found that for every 10 μg/m3 increase in SO2 concentration in the first three months of pregnancy, the risk of birth defects increased by about 20% (10). A population-based case-control study in Taiwan also showed that exposure to pollutants such as O3, PM10, and SO2 during early pregnancy increases the risk of various congenital heart disease subtypes (11).
In this paper, 69,995 cases of neonatal births in Xiamen, a city in southeast China, were counted, and the data of birth defects were analyzed. The general situation of children with birth defects, the relationship between disease order, the occurrence and development trend of air pollution, and the relationship between air pollutants and birth defects were analyzed. It is hoped to help readers understand the occurrence of birth defects and related causes in southeastern China.
The clinical case data of this study were derived from a retrospective case-control study conducted in Xiamen City from April 1, 2019 to June 30, 2020. Hospitals diagnosed and reported birth defects according to the requirements of the “China Birth Defects Monitoring Program”. The data of birth defects were extracted from the monitoring platform of birth defects of women and children affiliated to Xiamen University. The birth data of the healthy control group in the same period and the same area were obtained from the electronic medical record system (EMR) of Xiamen University Women’s and Children’s Hospital, including maternal age, parity, nationality, pregnancy disease, infant gestational age, birth weight, gender, birth defect category, and so on (12). This study passed the ethical review of maternal and child health care institutions in Xiamen, and our research was conducted in accordance with local and national regulations.
We collected air pollution data from January 1, 2019 to December 31, 2019. These data were from Xiamen Ecological Environment Bureau. A total of 39 air-quality monitoring stations (AQMS) monitored common air pollutants such as SO2, PM2.5, NO2, O3, and CO to obtain hourly average data and calculate monthly average data. We took the last menstrual time as the starting time of exposure (13). For pregnant women with less than 15 days of pregnancy, exposure analysis was performed according to the previous month, which was divided into the first month of pregnancy, the second month of pregnancy, and the third month of pregnancy (14). The geographical coordinates were obtained from the residence of pregnant women. The Kriging interpolation method was used to match the time and place exposure of pollutant values in the first three months of pregnancy, and the spatial location exposure values were obtained (15, 16).
Inclusion criteria: 1. Regular prenatal examination and resident population in Xiamen; 2. Birth defect group was diagnosed by doctors during pregnancy or childbirth with birth defect diseases; 3. The control group was a healthy fetus with full-term normal birth weight, and no abnormalities were found by imaging physicians, obstetricians, and neonatologists.
Exclusion criteria:1. No regular prenatal examination or floating population in Xiamen; 2. There were low birth weight, macrosomia, birth defects in the control group; 3. There are clear genetic diseases in the birth defect group, such as Down syndrome, Turner syndrome or other chromosomal and genetic abnormalities; 4. The duration of pregnancy in the birth defect group did not exceed 3 months.
Descriptive analysis was performed on the occurrence of common air pollutants and common birth defect diseases, and the social demographic characteristics of the birth defect group and the control group were compared by Chi-square test. Mann-Kendall trend test was used to analyze the time trend of air pollutant concentration. Pearson test was used to analyze the correlation between air pollution concentration and birth defects. The variance inflation factor (VIF) was used to verify the collinearity between air pollutants and birth defect diseases. When VIF > 10, it was suggested that there was collinearity and relevant factors could not be included in the analysis (12).
The occurrence of birth defects such as congenital heart disease, finger deformity, and ear deformity was regarded as a binary dependent variable. The exposure concentration of air pollutants such as SO2, PM2.5, NO2, O3, and CO was regarded as an independent variable. Factors such as age, nationality, parity, and pregnancy disease were used as covariates. Finally, logistic regression was used to analyze the correlation between common air pollutants and common birth defects. The incidence of birth defects (/ten thousand) = the number of related birth defects/the number of perinatal infants × 10,000. Epidata3.1 was used to collect data, Arcmap10.3 was used to analyze and process air pollution data, and pollutant distribution map was made. R4.04 was used for relevant statistical analysis. Bilateral test was used, and P < 0.05 indicated that the difference was statistically significant.
A total of 1,208 children with birth defects were born, with a total of 69,995 births. The incidence of birth defects was 172.58/10,000. The common birth defects were congenital heart disease (86.72/10,000), finger deformity (10.85/10,000), cleft lip and (or) cleft palate (6.85/10,000), ear deformity (6.86/10,000) and other diseases (Table 1). In the case group, there were 686 cases (56.79%) of pregnant women over 30 years old, 923 cases (76.41%) of pregnant women living in urban areas, and 682 cases (56.46%) of male children. Chi-square test X2 = 4.38, P < 0.05, indicating that the difference between fetuses of different genders was statistically significant. There were 824 cases (68.21%) of full-term infants with gestational age greater than 37 weeks. Chi-square test X2 = 41.87, P < 0.05, indicating that there was statistical significance between different gestational weeks. There were 79 cases (6.51%) of gestational diabetes during pregnancy. Chi-square test X2 = 19.5, P < 0.05, indicating that gestational diabetes during pregnancy was statistically significant (Table 2).
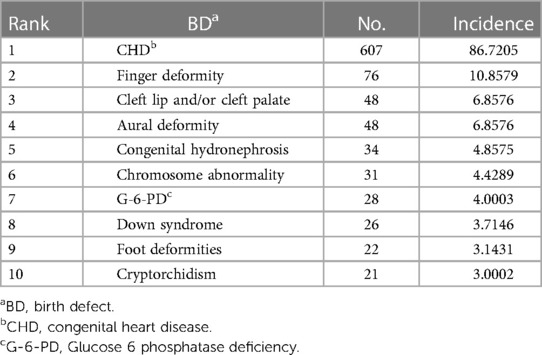
Table 1. Birth defect disease sequence.
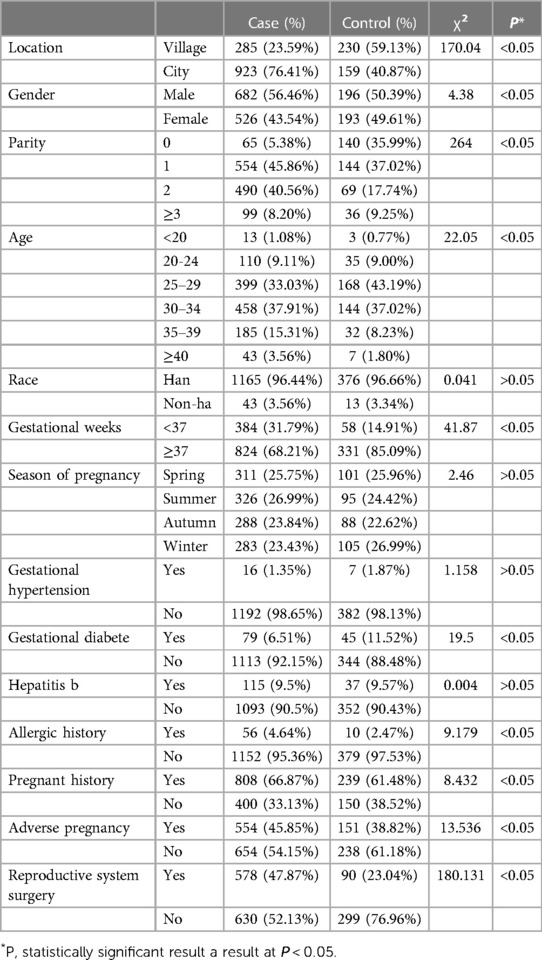
Table 2. General analysis of birth defects.
A total of 39 air-quality monitoring stations (AQMS) in Xiamen City monitored the real-time changes of air pollutant concentrations such as SO2, NO2, O3, PM2.5 and CO from January 1, 2019 to December 31, 2019 (Figure 1). It can be seen from Table 3 that the average concentration of air pollutants in different months is different. The average concentration of SO2 reaches the maximum in March, which is 11.19 ug/m3, and the concentration reaches the minimum in February, which is 5.03 ug/m3. The results of variance analysis show that F = 4.214, P < 0.05, indicating that there are statistical differences between the concentrations in different months, and the concentration of SO2 varies in different months. The trend test of air pollutant concentration showed that Z = −0.62, P > 0.05, indicating that there was no downward trend in concentration between different months (Table 3).
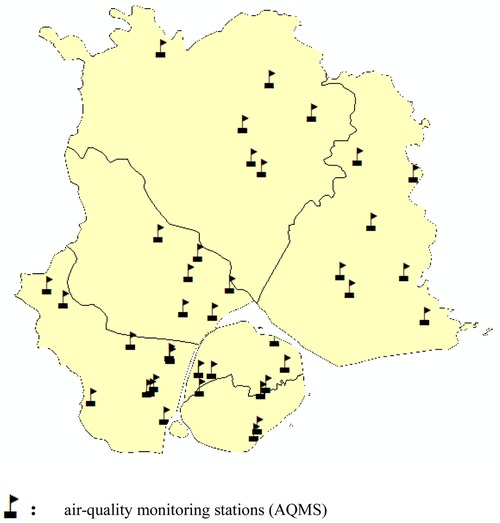
Figure 1. Location of air-quality monitoring station.
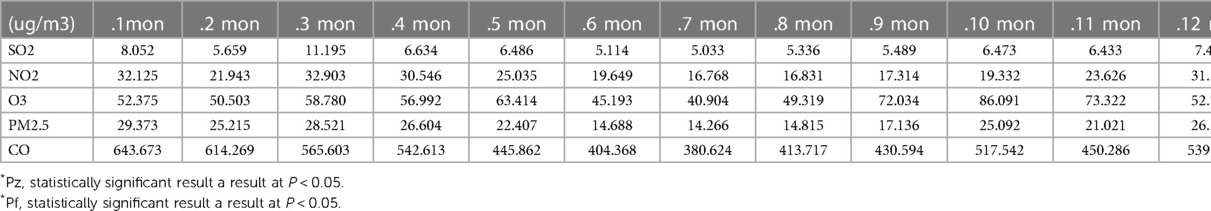
Table 3. Air pollutants in general.
Descriptive analysis of the concentration of air pollutants in the birth defect group and the control group showed that the mean concentrations of SO2 and O3 in the birth defect group were 5.88 ug/m3 and 58.46 ug/m3, respectively, which were higher than those in the healthy control group. The mean concentrations of NO2, PM2.5 and CO in the control group were higher than those in the birth defect group. The rank sum test of SO2 concentration in the birth defect group and the control group showed that Z = −0.87, P = 0.38, the difference was not statistically significant. Other pollutants P < 0.05, indicating that the difference in the concentration of O3, NO2, CO and PM2.5 between the birth defect group and the control group was statistically significant (Table 4).
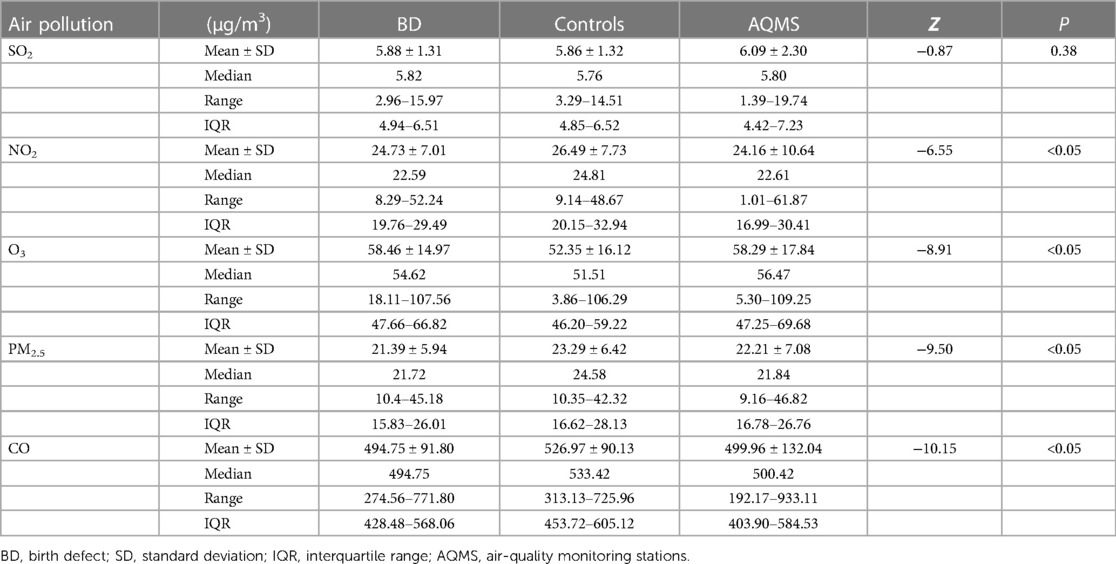
Table 4. Air pollutant concentration distribution.
Pearson correlation analysis was performed on common air pollutants and birth defect diseases. The results showed that SO2 was strongly positively correlated with NO2, SO2 was positively correlated with PM2.5 and CO, NO2 was strongly positively correlated with PM2.5, NO2 was positively correlated with CO, and PM2.5 was strongly positively correlated with CO (Table 5).
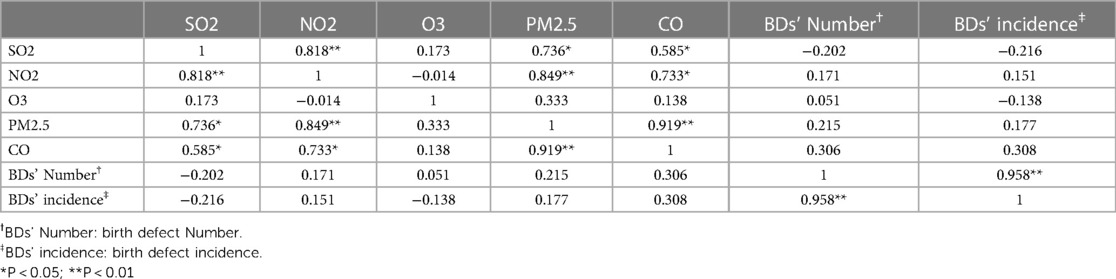
Table 5. Correlation analysis between air pollution and birth defects.
The results of collinearity analysis between air pollutants and birth defect diseases showed that there was no collinearity between birth defect diseases and air pollution such as SO2, NO2, O3, PM2.5 and CO, and VIF was less than 10, so they could be included in the single pollutant model respectively. The defect diseases and SO2, NO2, O3, PM2.5, CO and other air pollution are analyzed together. The results show that PM2.5 has collinearity in the first month of pregnancy and the second month of pregnancy, and VIF is equal to 12.62 and 13.35 respectively. Therefore, PM2.5 is not included in the co-pollutant model (Table 6).
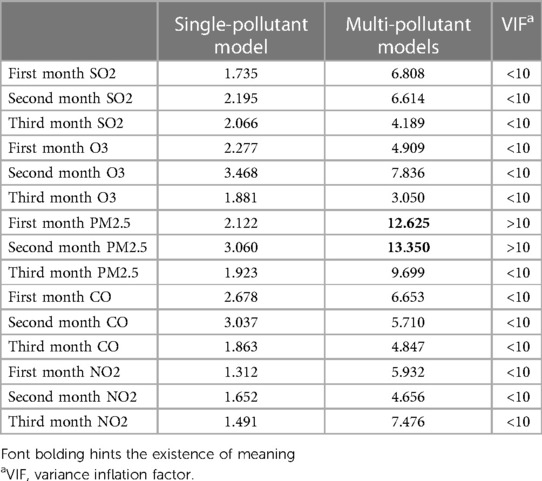
Table 6. The collinearity analysis of air pollution and birth defects.
All birth defect diseases, congenital heart disease, finger deformity, cleft lip and (or) cleft palate, external ear deformity and air pollution such as SO2, NO2, O3, PM2.5 and CO were analyzed by logistics regression analysis of single pollutants in the first three months of pregnancy. The results showed that SO2, NO2, O3, PM2.5 and CO had positive effects on different birth defect diseases in the first three months of pregnancy, among which SO2 had the greatest impact on various birth defect diseases.
SO2 during the first and (or) second trimesters of pregnancy increases the incidence of all birth defects, congenital heart disease, cleft lip and (or) palate, and external ear malformations. In the first month of pregnancy and the second month of pregnancy, every 10ug/m3 increase in SO2 will lead to an increase of 21%, 35% and 31%, 33% in all birth defects and congenital heart disease, respectively. In the second month of pregnancy, for every 10 ug/m3 increase in SO2, the cOR of cleft lip and (or) cleft palate was 1.37,95% CI = (1.00,1.89). The maternal age, nationality, parity, pregnancy disease and other factors were brought into the analysis as covariates, and aOR = 1.498,95% CI = (1.062,2.113). In the first month of pregnancy, for every 10 ug/m3 increase in SO2, the incidence of ear malformations increased by 65%, and aOR = 1.613 after covariate adjustment, the change was not significant. The remaining pollutants CO, NO2, O3 and PM2.5 will have positive effects on different birth defect diseases in the first three months of pregnancy, but have little effect on birth defect diseases (Tables 7, 8).

Table 7. Single pollutant model of air pollutants and birth defects.
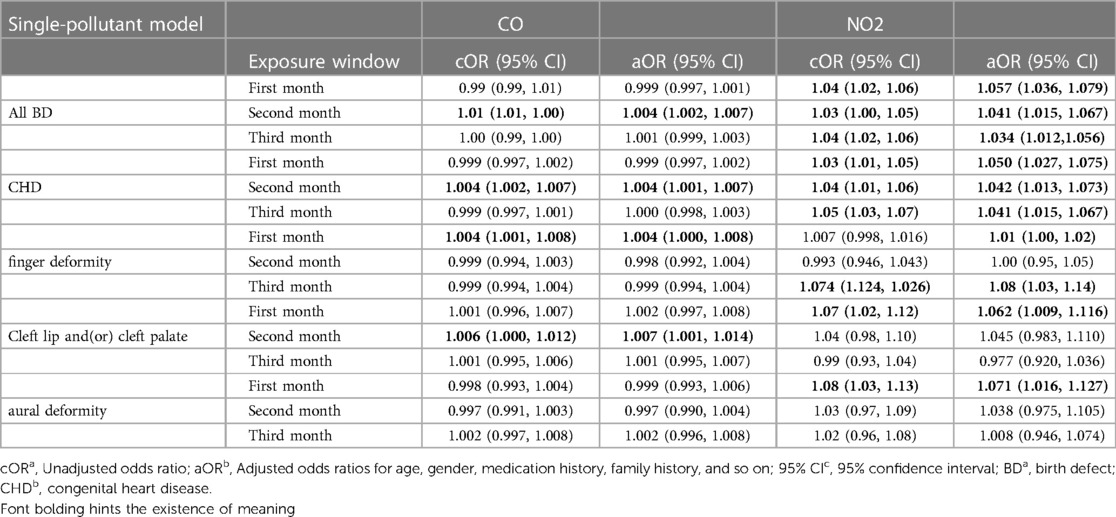
Table 8. Single pollutant model of air pollutants and birth defects.
In the multi-pollutant model, it can be seen from the above that PM2.5 has collinearity with other pollutants in the first two months of pregnancy, so PM2.5 is not included in the co-pollutant model. The results showed that SO2, CO, NO2 and O3 had different effects on all birth defects, congenital heart disease, cleft lip and (or) cleft palate, finger deformity and external ear deformity in the first three months of pregnancy. Among them, SO2 has a greater impact on the occurrence of cleft lip and (or) cleft palate and external ear malformations in the second month of pregnancy. For every 10 ug/m3 increase in SO2, the occurrence of cleft lip and/or cleft palate and external ear malformations will increase by 73% and 150%, respectively. After covariate adjustment, aOR was 1.968 and 2.347, respectively. The remaining pollutants CO, NO2 and O3 will have positive effects on different birth defect diseases in the first three months of pregnancy, but have little effect on birth defect diseases (Tables 9, 10).
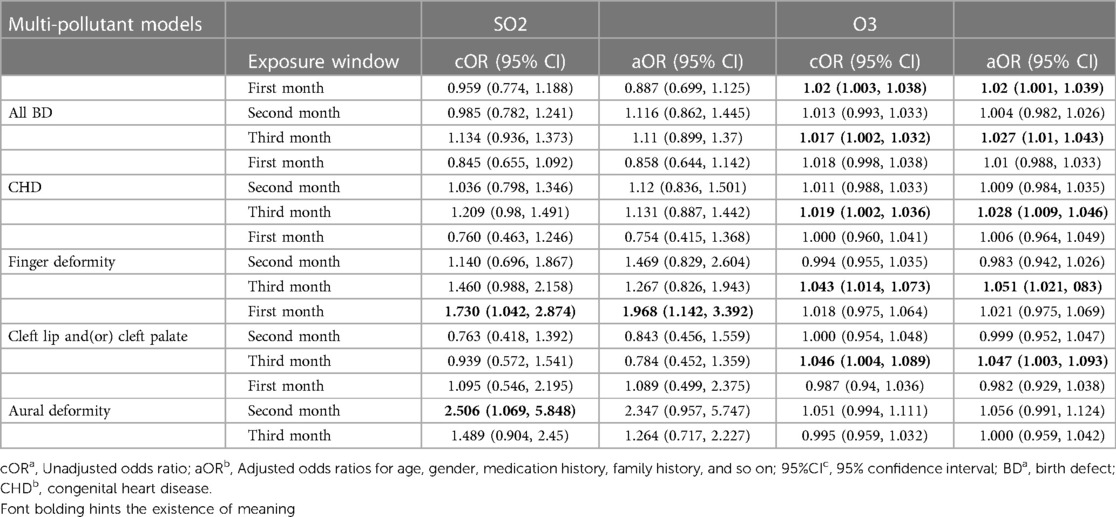
Table 9. Multi-pollutant model of air pollutants and birth defects.
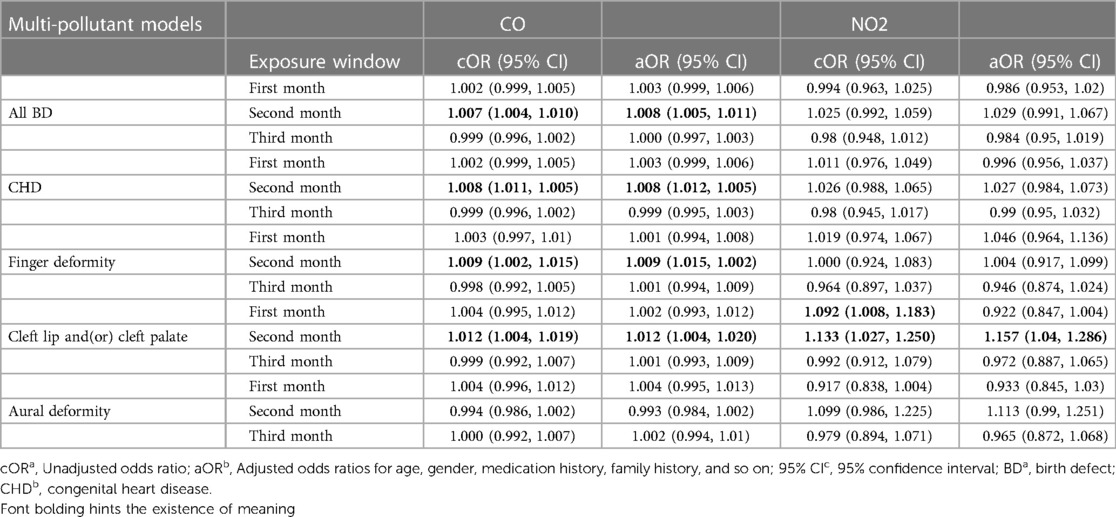
Table 10. Multi-pollutant model of air pollutants and birth defects.
The occurrence of birth defects is affected by many factors, such as advanced maternal age, diabetes during pregnancy, or the use of pregnancy-related drugs, which may lead to an increase in the incidence of birth defects (17, 18). Early in pregnancy, especially at 1–10 weeks of gestation is a critical period of embryonic differentiation (19). Therefore, we chose the first three months of pregnancy to study air pollution and birth defects. This study shows that common air pollutants can lead to an increase in the incidence of birth defects during this period, especially SO2 is a high-risk factor leading to an increase in the incidence of common birth defects. In 2016, the results of the global death factor survey showed that air pollutants were the sixth leading cause of death, and 7.5% of global deaths were attributed to ambient air pollution. The countries with higher deaths included China and India (20).
By comparing the particle pollution levels on both sides of the placenta under different particle pollutant exposure levels of pregnant women, it was found that particle pollutants could accumulate on the side of the fetus through the placenta (21). Related mouse embryo experiments show that air pollutants can affect long non-coding RNAs (lncRNAs) expression, mitosis, cell respiration, glycolic acid metabolism and proteasome and other biological processes, leading to congenital spinal cord defects (22, 23). There are also related clinical trials found that air pollutants and ABCC2, CYP1A1, CYP2B6, CYP2C19 and other genes between the gene-environment interaction effect, or by up-regulating miRNA to reduce cardiovascular-related gene expression, leading to abnormal expression of related genes, leading to the occurrence of congenital heart disease (24, 25).
Associated mate analyzed the relationship between air pollution and congenital heart disease and found that the more polluted countries have a higher percentage of methylenetetrahydrofolate (MTHFR) gene polymorphisms, the higher the risk of congenital heart disease (26). Ahmed Karoui et al. studied mice exposed to NO2 and found that NO2 exposure impairs mitochondrial function in the heart, which in turn leads to endothelial dysfunction in the coronary arteries and, ultimately, myocardial ischemia (27). A clinical cohort study in Henan Province, China, showed that air pollutants may increase the methylation level of the superoxide dismutase 2 (SOD2) promoter in umbilical cord blood, leading to adverse pregnancy outcomes (28).
The results of a case-control study in Liaoning Province of China showed that exposure to SO2 increased the incidence of cleft lip and/or cleft palate in the first three months of pregnancy and the first month of pregnancy. The cOR = 1.63,95% CI = (1.38,1.93) of cleft lip and (or) cleft palate in the first month of pregnancy was the same as our results (29). A case-control study in Texas, the United States, showed that PM2.5 and SO2 increased the incidence of congenital heart disease during the third to eighth weeks of pregnancy, which is the same as our findings in the second month of pregnancy (30). Shuang Zhang et al. used logistic regression to analyze the relationship between SO2 and hypospadias. The results showed that SO2 increased the risk of hypospadias in the multi-pollutant model in the first month of pregnancy (31). Wang ling ling et al. used the generalized additive model to study the relationship between common air pollutants and birth defects. The results showed that NO2 had an impact on all birth defects in the first three months of pregnancy, and the third month of pregnancy had the greatest impact. For every 10 μg/m3 increase in NO2 concentration, the risk of birth defects increased by 10.3%, which was the same as our conclusion (32).
Ying Zhou et al., conducted a retrospective case-control study on birth defects data in four states of the United States. The results showed that for each quartile increase in NO2 concentration, the aOR and 95%CI was 1.15 (1.00,1.32), while O3 did not have this relationship (33). Mariam S. Girguis et al. used the generalized additive linear model to study the relationship between traffic-related pollutants and cleft lip and palate, congenital heart disease, and neural tube defects. The results showed that PM2.5 was positively correlated with various subtypes of congenital heart disease and negatively correlated with cleft lip and palate. Our results are different from that, considering the different exposure methods of early air pollution (34). A retrospective control study in Ohio, the United States, showed that in the first month of pregnancy, for every 10 μg/m3 increase in PM2.5 concentration, the aOR and 95% confidence interval of birth defect disease were 1.09 (1.01,1.18), which was the same as our conclusion (35).
Many scientists have studied whether the change of address during pregnancy affects the accuracy of the results. A study of more than 9,000 pregnant women in Connecticut showed that about 11% of pregnant women moved during pregnancy, but the difference in exposure to pollutants was not statistically significant (36). A New York State cohort study similarly showed that a mother’s address at birth can be a good substitute for a mother’s address during pregnancy, with a higher level of consistency observed (37). But a cohort study in China’s Gansu province found that those who moved were less likely to have adverse birth consequences than those who did not, possibly related to reducing environmental harm. Residential mobility should be considered in future environmental exposure assessment studies, as well as the impact of exposure misclassifications and differences among different populations, depending on where you live at birth (38). A mate analysis of environmental exposure during pregnancy and residential mobility during pregnancy showed that mobility was the highest in the second trimester of pregnancy, and mobility usually decreased with age and socioeconomic status, but there were differences among different races and customs. Thus, there may be misclassifications in the environmental exposure estimated from incomplete residential information, but most of the shifts are short-distance, so limited residential data can be used to estimate environmental exposure during pregnancy (39).
For how to reduce the occurrence of birth defect diseases, it is necessary to professionalize birth defect diseases, train specialized nurses to inquire about prenatal exposure factors, and use relevant scales by professional doctors to conduct preliminary classification of diseases, reclassification of disease severity, and research and evaluation of each different phenotype (40, 41).
First of all, this study was diagnosed and classified by professional medical staff according to strict standards, and examined and analyzed by relevant statisticians. Second, this study has a large sample size and a wide coverage area, covering most birth defect diseases, including all cases of live births and stillbirths. It is conducive to the evaluation of risk factors and improves the reliability and representativeness of this study. Thirdly, taking the past history, medication history and family history of the mother and the child as covariates, the adjustment was made to reduce the influence of interference factors. Fourth, there are many air-quality monitoring stations (AQMS) in this paper, the monitoring time is long, and the coverage area is wide, which provides the accuracy of the air pollution value exposed by the children. Fifth, this study covers the relationship between multiple pollutants and multiple birth defects. Finally, during the novel coronavirus epidemic in this study, according to the regional isolation measures, pregnant women spend most of their time resting at home and are forced to wear masks in public places, which increases the rationality of the location exposure matching of air pollution data in this paper (42, 43).
Our study is based on data from monitoring sites, but most of the time maternal rest at home, studies have shown that indoor air pollutants such as smoking, coal, mold exposure can also increase the risk of birth defects, premature birth, low birth weight, which will affect the accuracy of the results (44–47). The main ethnic group in southern China is East Asian yellow people, and the vast majority of pregnant women are Han nationality. There is a lack of assessment of ethnic minority risk factors and different ethnic groups. Finally, this study is a retrospective study, there is a certain memory bias.
The raw data supporting the conclusions of this article will be made available by the authors, without undue reservation.
The studies involving human participants were reviewed and approved by Women and Children's Hospital, School of Medicine, Xiamen University. Written informed consent for participation was not required for this study in accordance with the national legislation and the institutional requirements.
ZH and JW proposed the study and wrote the first draft. JQ and XM analyzed the data. QC collected the data. YQ contributed to the design. All authors contributed to the article and approved the submitted version.
This work was supported by the development and construction of regional maternal and child intelligent information collaborative platform based on privacy computing (project number: 3502Z20221021).
The authors declare that the research was conducted in the absence of any commercial or financial relationships that could be construed as a potential conflict of interest.
All claims expressed in this article are solely those of the authors and do not necessarily represent those of their affiliated organizations, or those of the publisher, the editors and the reviewers. Any product that may be evaluated in this article, or claim that may be made by its manufacturer, is not guaranteed or endorsed by the publisher.
1. Lewanda AF. Birth defects. In: Benson JB, editor. Encyclopedia of infant and early childhood development (2nd edn). Oxford: Elsevier; 2020. p. 165–76.
2. Simioni AT, Llanos O, Romero M, Ramos S, Brizuela V, Abalos E. (Regionalization of perinatal health care in the province of Santa fe, Argentina). Rev Panam Salud Publica. (2017) 41:e38. doi: 10.1016/bs.ctdb.20112.10.001
3. Paudel P, Sunny AK, Gurung R, Gurung A, Malla H, Rana NB, et al. Burden and consequence of birth defects in Nepal-evidence from prospective cohort study. BMC Pediatr. (2021) 21(1):81. doi: 10.1186/s12887-021-02525-2
4. Almli LM, Alter CC, Russell RB, Tinker SC, Howards PP, Cragan J, et al. Association between infant mortality attributable to birth defects and payment source for delivery—united States, 2011–2013. MMWR Morb Mortal Wkly Rep. (2017) 66(3):84–7. doi: 10.15585/mmwr.mm6603a4
5. Ministry of Health Releases “China Birth Defect Prevention Report (2012)”. Chin Med News. (2012) 112(18):7. (in Chinese).
6. Harris BS, Bishop KC, Kemeny HR, Walker JS, Rhee E, Kuller JA. Risk factors for birth defects. Obstet Gynecol Surv. (2017) 72(2):123–35. doi: 10.1097/ogx.0000000000000405
7. Orru H, Ebi KL, Forsberg B. The interplay of climate change and air pollution on health. Curr Environ Health Rep. (2017) 4(4):504–13. doi: 10.1007/s40572-017-0168-6
8. Song J, Kang J, Lin B, Li J, Zhu Y, Du J, et al. Mediating role of TRPV1 Ion channels in the co-exposure to PM2.5 and formaldehyde of balb/c mice asthma model. Sci Rep. (2017) 7(1):11926. doi: 10.1038/s41598-017-11833-6
9. Gilboa SM, Mendola P, Fau-Olshan AF, Olshan A, Fau-Langlois PH, Langlois PH, et al. Relation between ambient air quality and selected birth defects, seven county study, Texas, 1997–2000. Am J Epidemiol. (2005) 162(3):238. doi: 10.1093/aje/kwi189
10. Yao C, Chen Y, Zhu X, Liu Y, Zhang J, Hou L, et al. Air pollution and the risk of birth defects in anqing city, China. J Occup Environ Med. (2016) 58(4):e124–7. doi: 10.1097/JOM.0000000000000676
11. Hwang BF, Lee YL, Jaakkola JJ. Air pollution and the risk of cardiac defects: a population-based case-control study. Medicine (Baltimore). (2015) 94(44):e1883. doi: 10.1097/MD.0000000000001883
12. Jiang W, Xie W, Ni B, Zhou H, Liu Z, Li X. First trimester exposure to ambient gaseous air pollutants and risk of orofacial clefts: a case-control study in Changsha, China. BMC Oral Health. (2021) 21(1):530. doi: 10.1186/s12903-021-01876-7
13. Sun Y, Yang T, Gui H, Li X, Wang W, Duan J, et al. Atmospheric environment monitoring technology and equipment in China: a review and outlook. J Environ Sci. (2023) 123:41–53(1001-0742). doi: 10.1016/j.jes.2022.01.014
14. Zhang JY, Wu QJ, Huang YH, Li J, Liu S, Chen YL, et al. Association between maternal exposure to ambient PM(10) and neural tube defects: a case-control study in Liaoning province, China. Int J Hyg Environ Health. (2020) 225:113453(1618-131X). doi: 10.1016/j.ijheh.2020.113453
15. Paramasivam CR, Venkatramanan S. An introduction to various spatial analysis techniques. In: Venkatramanan S, Viswanathan PM, Chung SY (Eds.), GIS and geostatistical techniques for groundwater science. Elsevier, Amsterdam. (2019); pp. 23–30.
16. de Smith MJ, Goodchild MF, Longley PA. Geospatial analysis: a comprehensive guide to principles, techniques, and software tools, sixth. In: 2020 Update. The Winchelsea Press, Drumlin Security Ltd, Edinburgh. (2020) 36(12):1535–8.
17. Lean SC, Derricott H, Jones RL, Heazell AEP. Advanced maternal age and adverse pregnancy outcomes: a systematic review and meta-analysis. PLoS One. (2017) 12(10):e0186287. doi: 10.1371/journal.pone.0186287
18. Ludvigsson JF, Neovius M, Soderling J, Gudbjornsdottir S, Svensson AM, Franzen S, et al. Periconception glycaemic control in women with type 1 diabetes and risk of major birth defects: population based cohort study in Sweden. Br Med J. (2018) 362:k2638. doi: 10.1136/bmj.k2638
19. Sherbet GV, Lakshmi MS. Structural organization and embryonic differentiation. Int Rev Cytol. (1967) 22:147–70. doi: 10.1016/s0074-7696(08)61834-3
20. Collaborators GBDRF. Global, regional, and national comparative risk assessment of 84 behavioural, environmental and occupational, and metabolic risks or clusters of risks for 195 countries and territories, 1990−2017: a systematic analysis for the global burden of disease study 2017. Lancet. (2018) 392(10159):1923–94. doi: 10.1016/S0140-6736(18)32225-6
21. Bove H, Bongaerts E, Slenders E, Bijnens EM, Saenen ND, Gyselaers W, et al. Ambient black carbon particles reach the fetal side of human placenta. Nat Commun. (2019) 10(1):3866. doi: 10.1038/s41467-019-11654-3
22. Li Z, Ma J, Bi J, Guo H, Chan MTV, Wu WKK, et al. MicroRNA signature of air pollution exposure-induced congenital defects. J Cell Physiol. (2019) 234(10):17896–904. doi: 10.1002/jcp.28422
23. Li Z, Ma J, Li X, Chan MTV, Wu WKK, Wu Z, et al. Aberrantly expressed long non-coding RNAs in air pollution-induced congenital defects. J Cell Mol Med. (2019) 23(11):7717–25. doi: 10.1111/jcmm.14645
24. Padula AM, Yang W, Schultz K, Lurmann F, Hammond SK, Shaw GM. Genetic variation in biotransformation enzymes, air pollution exposures, and risk of spina bifida. Am J Med Genet A. (2018) 176(5):1055–90. doi: 10.1002/ajmg.a.38661
25. He X, Chen Y, Zhang C, Gong W, Zhang X, Nie S. Polycyclic aromatic hydrocarbons from particulate matter 2.5 (PM2.5) in polluted air changes miRNA profile related to cardiovascular disease. Med Sci Monit. (2018) 24:5925–34. doi: 10.12659/MSM.908106
26. Yang HL, Yang YL, Yu CH, Shiao SPK. Meta-Prediction of MTHFR gene polymorphism and air pollution on the risks of congenital heart defects worldwide: a transgenerational analysis. Int J Environ Res Public Health. (2018) 15(8):1660. doi: 10.3390/ijerph15081660
27. Karoui A, Crochemore C, Harouki N, Corbiere C, Preterre D, Vendeville C, et al. Nitrogen dioxide inhalation exposures induce cardiac mitochondrial reactive oxygen Species production, impair mitochondrial function and promote coronary endothelial dysfunction. Int J Environ Res Public Health. (2020) 17(15):5526. doi: 10.3390/ijerph17155526
28. Zhou G, He T, Huang H, Feng F, Liu X, Li Z, et al. Prenatal ambient air pollution exposure and SOD2 promoter methylation in maternal and cord blood. Ecotoxicol Environ Saf. (2019) 181:428–34. doi: 10.1016/j.ecoenv.2019.06.039
29. Liu FH, Xing Z, Gong TT, Zhang JY, Huang YH, Li J, et al. Maternal exposure to sulfur dioxide and the risk of oral clefts in Liaoning province, China: a population-based case-control study. Environ Sci Pollut Res Int. (2021) 28(29):39101–9. doi: 10.1007/s11356-021-13461-0
30. Hansen CA, Barnett AG, Jalaludin BB, Morgan GG. Ambient air pollution and birth defects in Brisbane, Australia. PLoS One. (2009) 4(4):e5408. doi: 10.1371/journal.pone.0005408
31. Zhang S, Yue DM, Zhang JY, Huang YH, Li J, Liu S, et al. Maternal exposure to sulfur dioxide before and after conception and the risk of hypospadias in offspring. Ann N Y Acad Sci. (2021) 1502(1):99–109. doi: 10.1111/nyas.14624
32. Wang L, Xiang X, Mi B, Song H, Dong M, Zhang S, et al. Association between early prenatal exposure to ambient air pollution and birth defects: evidence from newborns in Xi'an, China. J Public Health (Bangkok). (2019) 41(3):494–501. doi: 10.1093/pubmed/fdy137
33. Zhou Y, Gilboa SM, Herdt ML, Lupo PJ, Flanders WD, Liu Y, et al. Maternal exposure to ozone and PM(2.5) and the prevalence of orofacial clefts in four U. S. States. Environ Res. (2017) 153:35–40. doi: 10.1016/j.envres.2016.11.007
34. Girguis MS, Strickland MJ, Hu X, Liu Y, Bartell SM, Vieira VM. Maternal exposure to traffic-related air pollution and birth defects in Massachusetts. Environ Res. (2016) 146:1–9. doi: 10.1016/j.envres.2015.12.010
35. Ren S, Haynes E, Hall E, Hossain M, Chen A, Muglia L, et al. Periconception exposure to air pollution and risk of congenital malformations. J Pediatr. (2018) 193:76–84.e6. doi: 10.1016/j.jpeds.2017.09.076
36. Pereira G, Bracken MB, Bell ML. Particulate air pollution, fetal growth and gestational length: the influence of residential mobility in pregnancy. Environ Res. (2016) 147:269–74. doi: 10.1016/j.envres.2016.02.001
37. Chen L, Bell EM, Caton AR, Druschel CM, Lin S. Residential mobility during pregnancy and the potential for ambient air pollution exposure misclassification. Environ Res. (2010) 110(2):162–8. doi: 10.1016/j.envres.2009.11.001
38. Tang Z, Zhang H, Bai H, Chen Y, Zhao N, Zhou M, et al. Residential mobility during pregnancy in urban gansu, China. Health Place. (2018) 53:258–63. doi: 10.1016/j.healthplace.2018.08.021
39. Bell ML, Belanger K. Review of research on residential mobility during pregnancy: consequences for assessment of prenatal environmental exposures. J Expo Sci Environ Epidemiol. (2012) 22(5):429–38. doi: 10.1038/jes.2012.42
40. Khokha MK, Mitchell LE, Wallingford JB. An opportunity to address the genetic causes of birth defects. Pediatr Res. (2017) 81(2):282–5. doi: 10.1038/pr.2016.229
41. Matas JL, Agana DFG, Germanos GJ, Hansen MA, Modak S, Tanner JP, et al. Exploring classification of birth defects severity in national hospital discharge databases compared to an active surveillance program. Birth Defects Res. (2019) 111(18):1343–55. doi: 10.1002/bdr2.1539
42. Albayati N, Waisi B, Al-Furaiji M, Kadhom M, Alalwan H. Effect of COVID-19 on air quality and pollution in different countries. J Transp Health. (2021) 21(2):101061. doi: 10.1016/j.jth.2021.101061
43. Feng H, Gan CCR, Leiva D, Zhang BL, Davies SE. COVID-19, sex, and gender in China: a scoping review. Global Health. (2022) 18(1):9. doi: 10.1186/s12992-022-00804-w
44. Sun J, Wang J, Yang J, Shi X, Li S, Cheng J, et al. Association between maternal exposure to indoor air pollution and offspring congenital heart disease: a case-control study in east China. BMC Public Health. (2022) 22(1):767. doi: 10.1186/s12889-022-13174-0
45. Liu X, Nie Z, Chen J, Guo X, Ou Y, Chen G, et al. Does maternal environmental tobacco smoke interact with social-demographics and environmental factors on congenital heart defects? Environ Pollut. (2018) 234:214–22. doi: 10.1016/j.envpol.2017.11.023
46. Lu C, Zhang W, Zheng X. Combined effects of ambient air pollution and home environmental factors on low birth weight. Chemosphere. (2019) 240:124836. doi: 10.1016/j.chemosphere.2019.124836
Keywords: birth defects, air pollution, etiology, China, congenital heart disease
Citation: Huang Z, Qiu Y, Qi J, Ma X, Cheng Q and Wu J (2023) Association between air pollutants and birth defects in Xiamen, China. Front. Pediatr. 11:1132885. doi: 10.3389/fped.2023.1132885
Received: 28 December 2022; Accepted: 11 May 2023;
Published: 25 May 2023.
Edited by:
Jing Chen, Cincinnati Children's Hospital Medical Center, United StatesReviewed by:
Zhang Ruizhong, Guangzhou Medical University, China© 2023 Huang, Qiu, Qi, Ma, Cheng and Wu. This is an open-access article distributed under the terms of the Creative Commons Attribution License (CC BY). The use, distribution or reproduction in other forums is permitted, provided the original author(s) and the copyright owner(s) are credited and that the original publication in this journal is cited, in accordance with accepted academic practice. No use, distribution or reproduction is permitted which does not comply with these terms.
*Correspondence: Jinzhun Wu MTkyMzczMTIwMUBxcS5jb20=
Disclaimer: All claims expressed in this article are solely those of the authors and do not necessarily represent those of their affiliated organizations, or those of the publisher, the editors and the reviewers. Any product that may be evaluated in this article or claim that may be made by its manufacturer is not guaranteed or endorsed by the publisher.
Research integrity at Frontiers
Learn more about the work of our research integrity team to safeguard the quality of each article we publish.