
94% of researchers rate our articles as excellent or good
Learn more about the work of our research integrity team to safeguard the quality of each article we publish.
Find out more
ORIGINAL RESEARCH article
Front. Pediatr. , 18 August 2022
Sec. Pediatric Gastroenterology, Hepatology and Nutrition
Volume 10 - 2022 | https://doi.org/10.3389/fped.2022.913850
 Way Seah Lee1,2*
 Muhammad Yazid Jalaludin1
 Kim Mun Khoh3
 Juan Loong Kok4Thiyagar Nadarajaw5Anna Padmavathy Soosai6
 Firdaus Mukhtar7Yong Junina Fadzil8
 Azriyanti Anuar Zaini1Siti Hawa Mohd-Taib9
 Rozanna M. Rosly10An Jo Khoo11
 Hon Kit Cheang12
Introduction: Undernutrition in young children is a significant public health problem globally. We determined the prevalence of and factors predisposing to stunting and underweight in children aged 1 to 5 years in Malaysia.
Materials and methods: Data were extracted from a cross-sectional nationwide campaign involving healthy children aged 1–5 years conducted over a 4-month period in 2019. We obtained information on demography, parental height and risk factors of undernutrition and anthropometric measurements (height and weight) of children enrolled. Age and sex-specific z-score for length/height-for-age (HAZ), weight-for-age (WAZ), body mass index (BMI) z-score (BAZ) and weight-for-height/length (WFH) z-score (WFHZ) were obtained using World Health Organization growth standards. The following definitions were used: (a) HAZ < −2 SD as stunted and −2 to −1 SD as at risk of stunting; (b) WFHZ < −3 SD as severe, −3 to < −2 SD as moderate wasting, and −2 to < +1 SD as normal; (c) WAZ −2 to −1 as at risk of underweight; (d) BAZ +1 to < +2 SD as at risk of and > +2 SD as overweight.
Results: Of the 15,331 children surveyed, prevalence of stunting and at risk of stunting were 16.1 and 20.0%, severe and moderate wasting were 4.0 and 6.1%, while 21.1% was at risk of underweight. Prevalence of at risk of and overweight 14.2 and 7.3%, respectively. One in fifth (25.0%) children had at least one form of undernutrition (stunting and/or underweight/wasting). Of the 1,412 (13.2%) children reported to have risk factors of undernutrition, 47.2% had feeding difficulties, 44.8% had poor dietary intake and 8.0% had both. Boys, paternal height < 156 cm and poor dietary intake were significantly associated with stunting and/or wasting. Compared with children with no risk factors, children with feeding difficulties were more likely to be wasted (AOR: 1.48, 95% CI: 1.18–1.85), and had at least one form of undernutrition (AOR: 1.45, 95% CI: 1.25–1.69).
Conclusions: In Malaysian children aged 1 to 5 years, dual burden of under- and overnutrition are common. Poor dietary intake and feeding difficulties were risk factors for undernutrition.
In 2020, it was estimated that 150 million and 45 million children under 5 years of age the world over were stunted and wasted, respectively, while 40 million or 5.7% of children of the same age group were overweight (1). The dual burden of undernutrition and overweight/obesity in children is also seen in Malaysia (2, 3). The proportion of children under 5 years in Malaysia who were underweight and stunted increased from 11.6 and 16.6%, respectively in 2011 to 14.1 and 21.8%, respectively in 2019 while the proportion of children who were overweight/obesity was 6.4% in 2016 and 5.6 % in 2019, respectively (2, 3).
The occurrence of dual burden of over- and undernutrition simultaneously has become a “new normal” (4, 5). Both over- and undernutrition can co-exist in the same individual, the same household, and the same population (5). At the individual level, for instance, an overweight child may be stunted or have micronutrient deficiency. In addition, over- and undernutrition can manifest in different stages over the lifetime of a person. A child may be undernourished in early childhood, followed by a rapid weight gain in late childhood and adolescence, and subsequently became overweight in adulthood with increased risk of non-communicable diseases (6, 7). This can even be passed across generations (8).
In addition, growth faltering in early life has been associated with increased risk of infection, impaired cognitive development and reduced educational performance in childhood and adolescence (9). This may eventually result in decreased economic productivity and an increased risk of non-communicable diseases in adulthood (10–14). Studies from low- and medium-income countries showed that a significant proportion of infants experienced growth faltering during the first 2 years of life (15, 16). Data from 51 national surveys from low- and middle-income countries also revealed that although linear growth deficit persisted between 18 months and 5 years, 70% of the absolute height deficits observed at 5 years of age occurred before age 2 years (17).
One of the most important cause of growth faltering in the first few years of life is food insecurity leading to inadequate energy and nutrient intake (18). Physical growth is also frequently restricted in children with malabsorption, food allergy or feeding problems (19–21). Knowledge on nutritional status in children and affecting factors is useful for both policymakers and healthcare providers of children in planning appropriate preventive and interventional measures. The aim of the present study was to determine the prevalence of stunting and underweight among children aged 1 to 5 years as well as factors associated with undernutrition in Malaysian children aged 1–5 years.
Data were extracted from a childhood screening and counseling campaign, a cross-sectional nationwide survey conducted over a 4-month period (April-August) in 2019 covering 11 states and one territory in Malaysia. The current study was approved by the ethical committee of University Malaya Medical Center, Kuala Lumpur, Malaysia (MREC 202069-8734).
The sampling method employed was convenient, universal sampling. Parents of all children seeking healthcare service (i.e., vaccination or minor ailments) from the participating healthcare facilities during the campaign period who also fulfilled the study criteria were invited to take in the study. This was to avoid any potential misunderstanding among other parents that their children received different standard of care.
Healthy children aged 1 to 5 years with no significant congenital abnormalities or health issues, or major intercurrent illnesses were eligible to take part. Verbal informed consent from accompanying parent(s) was obtained before the interview. Fathers, mothers, or both provided the consent of their children.
Information on gender, age, parental height, and factors affecting nutritional status (feeding issues, and dietary intake) were obtained via interviewer-administered questionnaire. Anthropometric measurements (weight and height) of children were taken by healthcare practitioners using standard procedures. For children aged 2 to 5 years, the height was measured to the nearest 0.1 cm using a stadiometer, and weight was measured to the nearest 0.1 kg using a digital weighing scale. Recumbent length was measured for children aged < 2 years using a length board, to the nearest 0.1 cm. Each measurement was performed twice, and the average was used in the analysis. Only children with complete anthropometric data were included in the analysis.
Anthropometric data for parents accompanying their child were obtained using methods described above for older children. Similarly, only parents with complete anthropometric data were included in the analysis.
Questionnaire on feeding issues and food intake were modified from Kerzner et al. (22). Parents were asked the following questions: (a) if their child had feeding issues (easily distracted during mealtime by electronic gadgets, television, etc., being picky with food, limited variety of food, taking longer to finish their meal); and (b) if they were concerned about poor dietary intake (consuming limited choice and/or amount of food) in their child. Presence of one or more feeding issues listed in (a) was considered having feeding issues (22).
Age and gender-specific z-score for length/height-for-age z-score (HAZ), weight-for-age z-score (WAZ), body mass index (BMI) z-score (BAZ) and weight-for-height/length (WFH) z-score (WFHZ) were used to assess the nutritional status of children aged 1 to 5 years and were analyzed using World Health Organization (WHO) Anthro software (version 3.2.2, 2011) (23). Children were classified according to HAZ as being stunted [< −2 standard deviations (SD)], at risk of stunting (−2 to −1 SD), and tall (≥ +2 SD), respectively (24). BAZ was used to classify overweight/obesity; at risk of overweight as BAZ +1 to < +2 SD and overweight as BAZ > +2 SD. Presence of and degree of wasting was classified using WFHZ; severely wasted (< −3 SD), moderately wasted (−3 to <-2 SD), and normal (−2 to < +1 SD). Finally, at risk of underweight was defined using WAZ as < −2 to −1.
Parental height was classified as short stature if the father's height was < 156 cm and the mother's height was < 145 cm, respectively (25).
For the ease of understanding, we stratify different combination of severity and forms of nutritional status into three categories: (a) “at least one form of undernutrition” includes children who were both underweight and stunted, underweight with any degree of height status, or stunted with any degree of weight status; (b) “at risk of one form of undernutrition” includes children who had WAZ of between −2 and −1 SD and not stunted (HAZ > −2 SD) and or HAZ of between −2 and −1 SD and not underweight (WAZ > −2 SD); and (c) “not at risk of any form of undernutrition” includes children who have both WAZ and HAZ > −1.
Data were analyzed using the IBM SPSS Statistics 20.0 (IBM Corporation, New York, USA) and were cleaned and checked prior to statistical analysis. All variables [demographic features, nutritional status, parental height, and presence of risk factor(s)] were presented as mean ± SD for continuous variables, and frequency and percentage for categorical variables. Analysis were divided into two parts; (a) children with complete data on age, gender and anthropometric measurements were included in the analysis of growth status, (b) respondents with complete data on gender, age, anthropometric data, parental height, and factors affecting nutritional status were included in the analysis of risk factors for growth status.
Preliminary analyses including independent t-test for continuous variables and chi-square test for categorical variables were performed to compare the nutritional status of children aged 1 to 5 years by parental height and presence of risk factor. Pearson χ2 was used to determine the distribution of stunting and underweight by age groups while linear-by-linear association in χ2 was used to determine the trend of stunting/underweight across age group. Bonferroni test was used for post hoc analysis on the differences in parental height by child's height status, a significance level was set at 0.05.
Binary logistic regression analysis was employed to determine risk factors for stunting, underweight and presence of at least one form of undernutrition. Presence or absence of stunting or/and underweight were expressed as a dichotomous variable, category 0 as “not stunted (include at risk of stunting, normal and tall),” “not underweight (include at risk of underweight, normal, and overweight)” and category one as “stunted (<-2 SD)”, “underweight (<-2 SD)”. Variables on univariate analysis with a p < 0.25 or which were considered conceptually relevant were entered concurrently into the binary logistic regression model to assess its adjusted effect on the outcome, with years of data collection as covariates. Results were presented as adjusted odds ratios (AOR) with a 95% confidence interval (CI). Statistical significance was set at p < 0.05.
Complete data on gender, age and anthropometric measurements were available in 15,331 (54% boys) children aged 1 to 5 years (Figure 1; Tables 1, 2), while 70% (n = 10,728) of the parents completed the questionnaire on feedings issues and dietary intake (Tables 3, 4). Parental height was available in 10,454 (68%) of the respondents (Figure 1). The mean (± SD) age of the 15,331 children at interview was 34.0 ± 13.7 months.
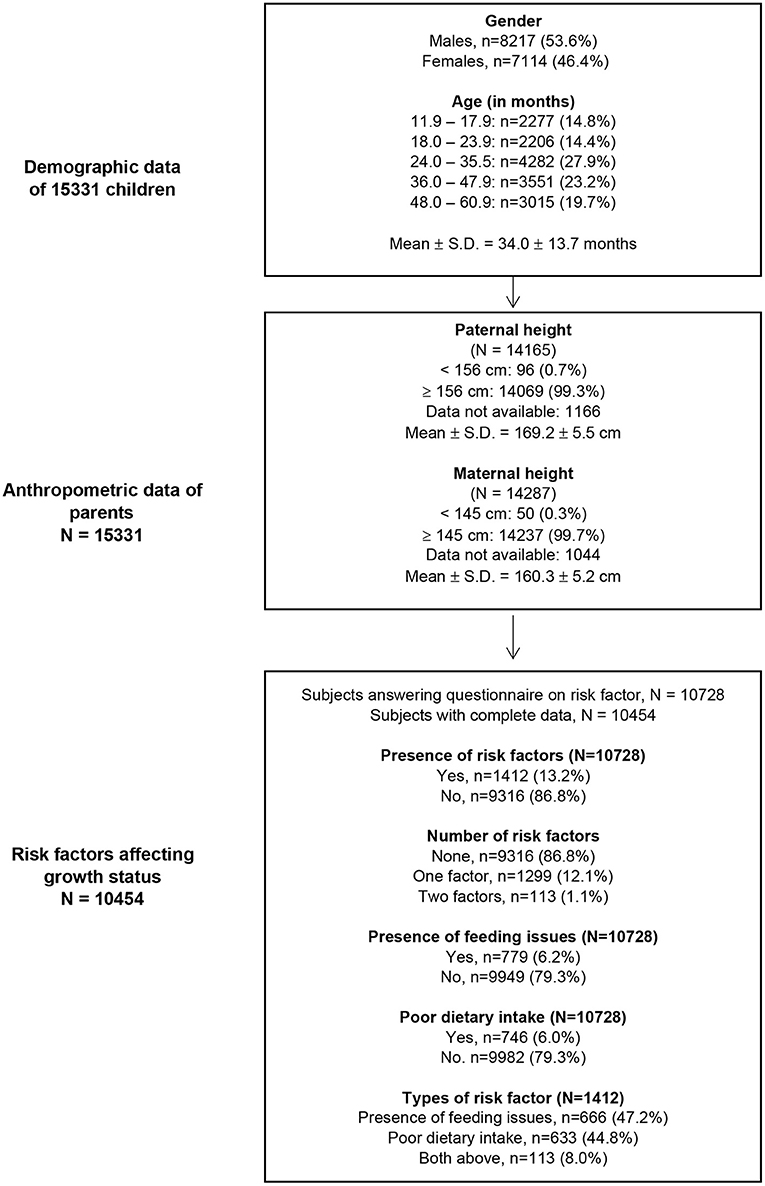
Figure 1. Demography, anthropometric data, and risk factors affecting growth status in Malaysian children aged 1 to 5 years.
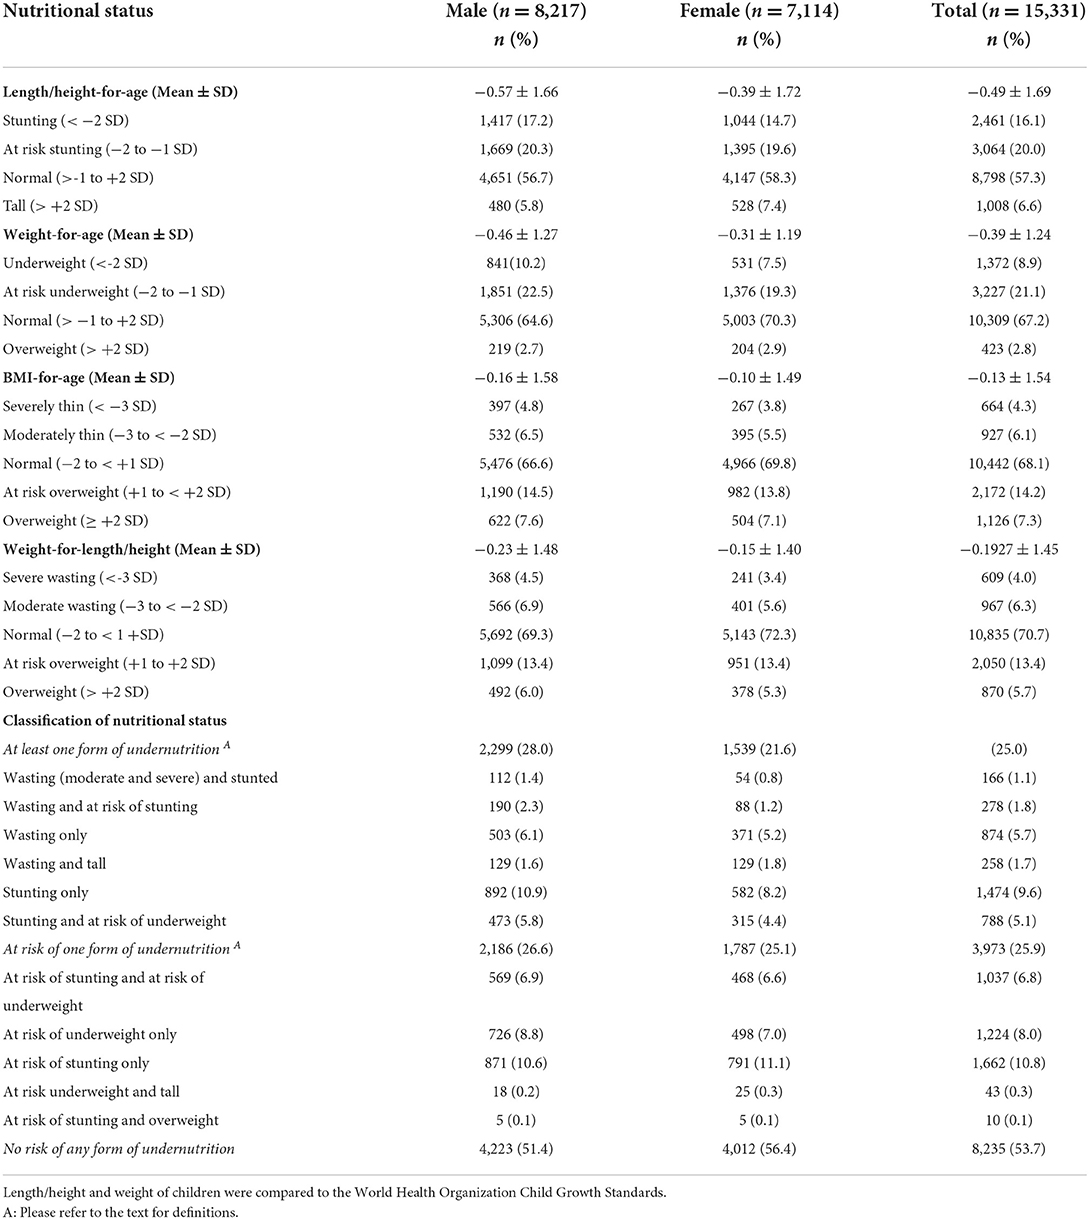
Table 1. Classification of growth status of 15,331 Malaysian children aged 1 to 5 years.
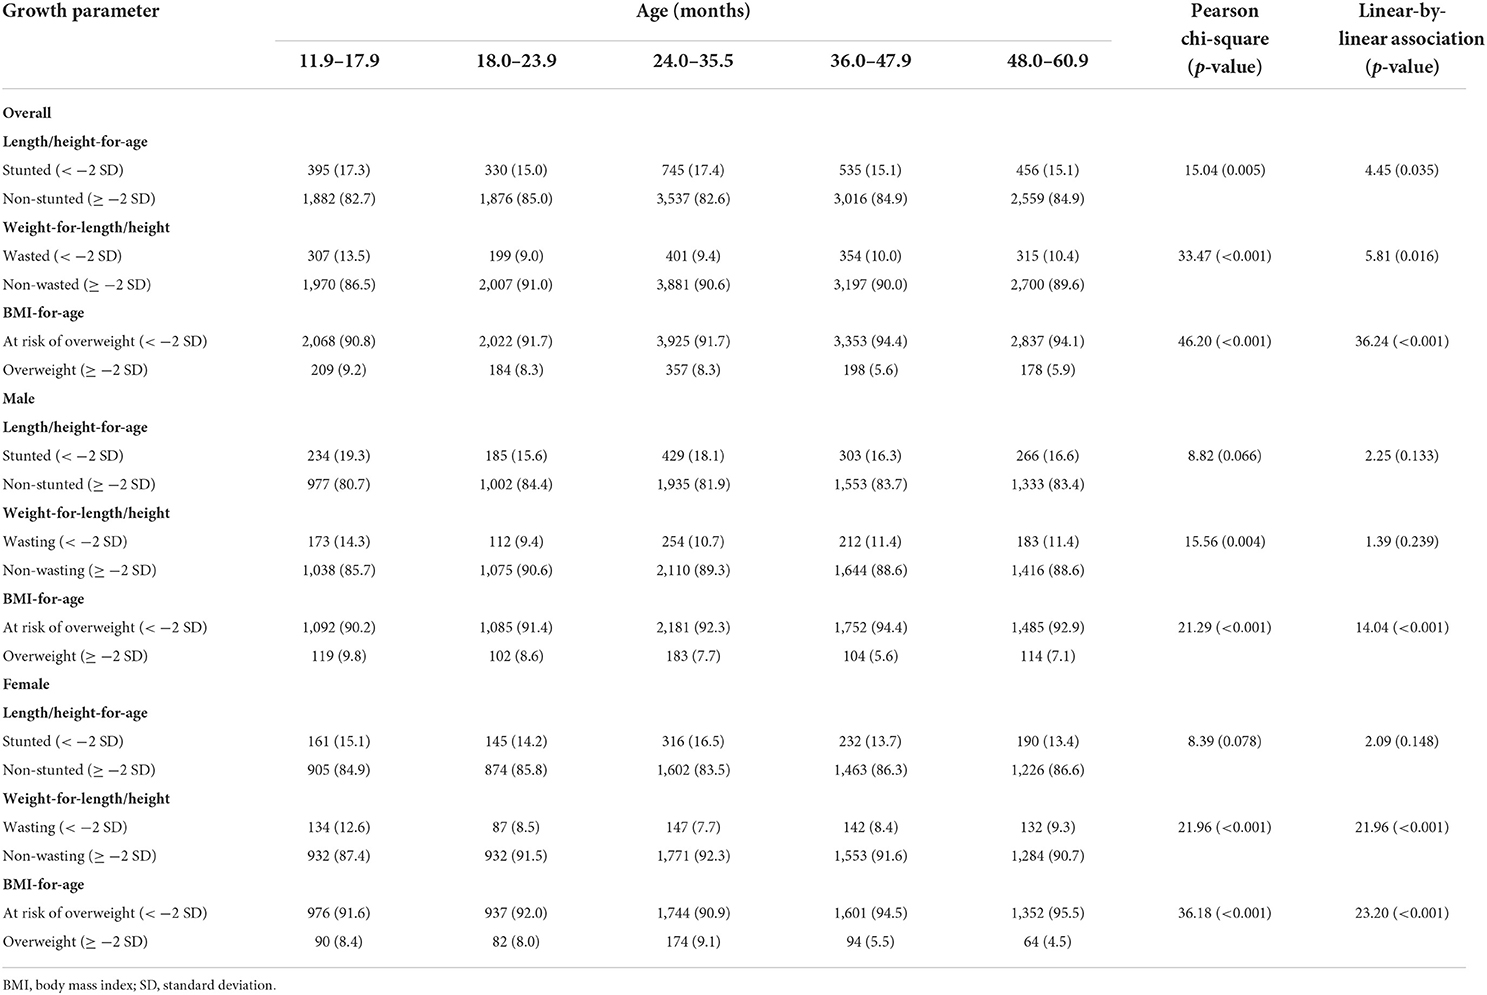
Table 2. Growth status of 15,331 children by age group and gender.
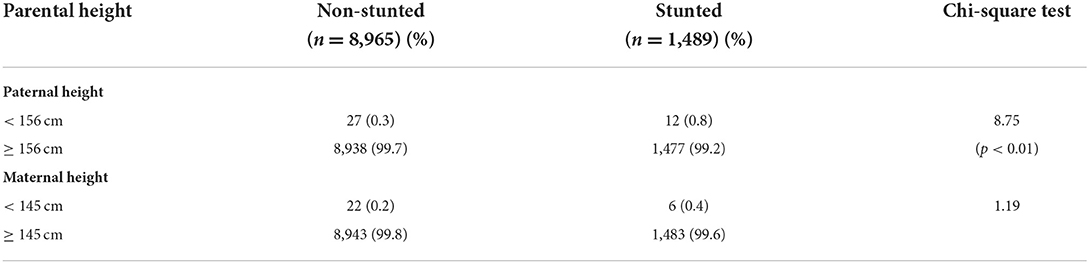
Table 3. Comparison between children who were stunted and non-stunted by parental height (N = 10,454).
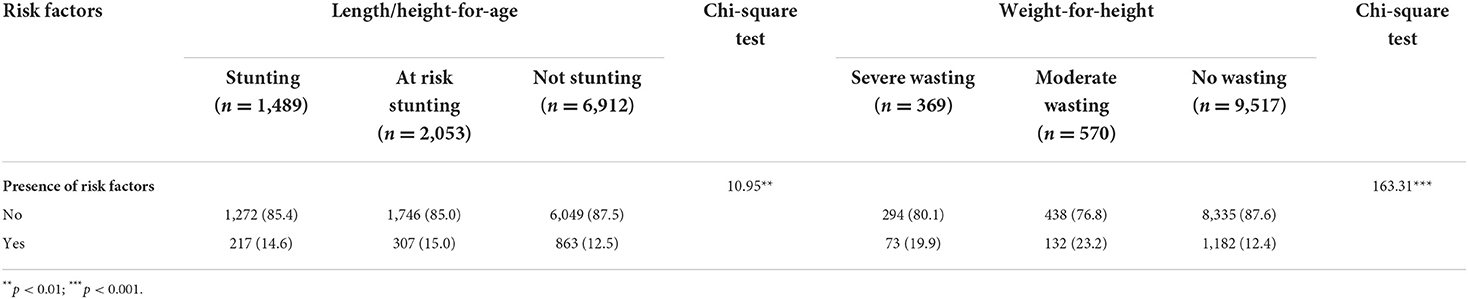
Table 4. Association between growth status and the presence of risk factors for feeding or nutritional intake (N = 10,454).
Approximately six in 10 (57%) of the children surveyed had normal length/height-for-age while two thirds (67%) had normal weight-for-age. The proportion of children who were stunted and at risk of stunting were 16 and 20.0%, respectively while proportion of children who were underweight and at risk of underweight were 8.9 and 21%, respectively (Table 1). As compared to girls, boys were more likely to be stunted (17% vs. 15%, p < 0.001) and underweight (10 vs. 7.5%; p < 0.001). Using WFH to classify degree of wasting, 10.3% of the children were either severely (4.0%) or moderately wasted (6.3%, Table 1).
Approximately 70% of the children had normal BAZ, 14.2% were at risk overweight (BAZ 1 to < +2 SD) and 7.3% were overweight (BAZ ≥ 2 +SD; Table 1). In total, 21.5% were either at risk of overweight or overweight.
The percentage of children who had at least one form of undernutrition was 20.3% (Table 1). Of these, 4.6% were both underweight and stunted. Another 25.9% had at risk of one form of undernutrition. Only 53.7% did not have any form of undernutrition.
Table 2 shows the distribution of height, BMI and WFH by age group. There were significant differences in the proportion of children who were stunted (p = 0.005) and wasting (p < 0.001) across age groups. There was a reduction in the proportion of children who were stunted across age groups, children in the age group of 11.9–17.9 months (17.3%) and 24.0–35.5 months (17.4%) were more likely to be stunted than the other age groups (linear-by-linear association χ2 = 4.45, p = 0.035; Table 2).
Children in the age group of 11.9–17.9 months (13.5%) were significantly more likely to have wasting than children in other age groups (linear-by-linear association χ2 = 5.81, p < 0.001; Table 2). No gender difference was observed in the proportion of children who were stunted across different age groups. For wasting, the proportion of boys (p < 0.001) and girls (p < 0.001) who were wasted at 11.9–17.9 months was significantly higher compared to children in other age groups (Table 2).
There were significant differences in proportion of children who were at risk of overweight and being overweight (χ2 = 46.20; p < 0.001) (Table 2). Children in the age group of 11.9–17.9 months were more likely to be overweight than the other age groups. Similar significant differences in the proportion of children who were overweight were also observed according to gender across different age groups.
There is a significant reduction in the proportion of children who were overweight across age groups (Table 2). Children in the younger age groups were more likely to be overweight as compared to children in the older age group. Similar trend was observed in the proportion of children being overweight for both genders across age groups (Table 2).
The mean (± SD) paternal height was 169.22 ± 5.54 cm with a great majority (99%) had a height ≥ 156 cm (Figure 1). The mean maternal (± SD) height was 160.27 ± 5.18 cm with a majority (99%) had a height ≥ 145 cm. There was a small but significant difference in the mean paternal height between stunted and non-stunted children.
Table 3 shows the relationship between presence of stunting and paternal and maternal height status. As compared to children who were not stunted, children who were stunted were significantly more likely to have a father who were short (p < 0.01; Table 3). However, no significant association were observed between presence of maternal short stature and stunting in children.
Of the 10,728 (70% of 15,331) parents who responded to the questionnaire on feeding issues, 13.2% (n = 1412) reported presence of concerns on feeding and/or dietary intake of their child (Figure 1). Feeding issues and poor dietary intake were equally common, being reported in 7.3% (n = 779) and 7.0% (n = 746) children, respectively. Only 1.1% (n = 113) of the children were reported to have both feeding issues and poor dietary intake.
Children who were stunted (14.6%) or at risk of stunting (15.0%) were more likely to have feeding issues and/or poor dietary intake than children who were not stunted (12.5%; p < 0.01; Table 4). Similarly, children who were severely wasted (19.9%) or moderately wasted (23.2%) were more likely to have feeding issues and/or poor dietary intake than children who were not wasted (12.4%; p < 0.001; Table 4).
Factors associated with stunting, wasting as well as presence of at least one form of undernutrition are shown in Table 5, respectively. Male gender, paternal height ≤ 156 cm, as well as presence of feeding issues and poor dietary intake were all significantly associated with stunting and wasting (Table 5). Similarly, male gender, paternal height ≤ 156 cm, and poor dietary intake were significantly associated with children who have at least one form of undernutrition (Table 5).
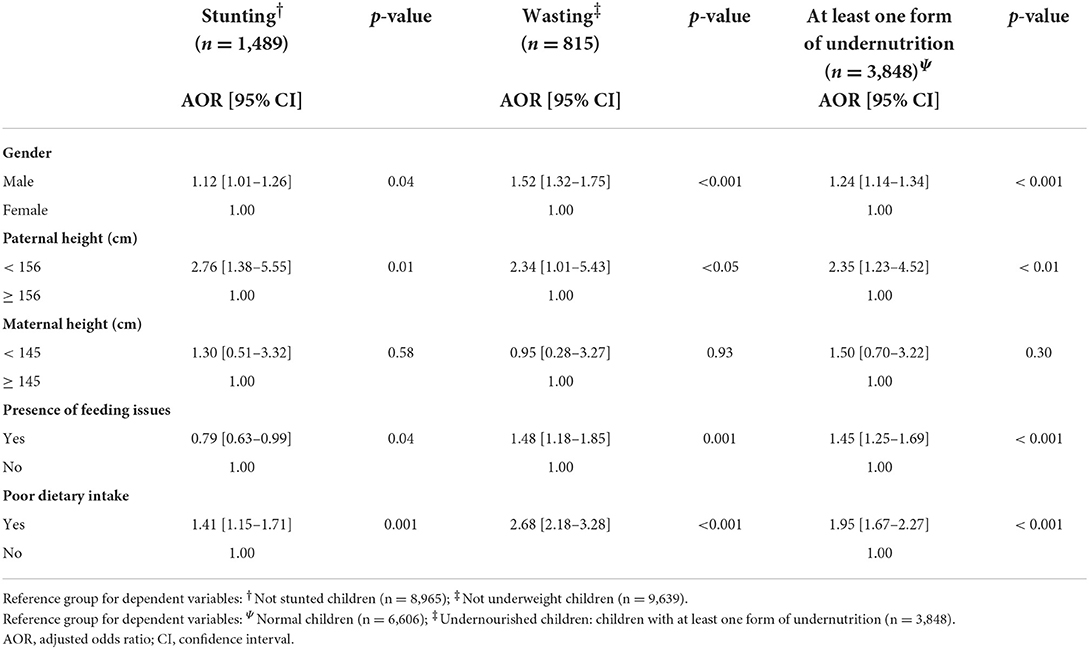
Table 5. Factors affecting nutritional status of 10,454 Malaysian children aged 1–5 years.
In the current study on 15,331 Malaysian children younger than 5 years of age, the rate of stunting and wasting was 16.1 and 10.4%, respectively while 1.1% were both stunted and wasted. Almost one in three young Malaysian children were found to be either stunted or at risk of stunting while three in 10 children were either underweight or at risk of underweight. The present study confirms the findings of the Malaysian National Health and Morbidity Survey (NHMS) in 2019 where the stunting rate of 21.8% and an underweight rate of 14.1% were noted in children under 5 years (3). Both studies confirmed the significant magnitude of undernutrition in young Malaysian children.
In addition to the data by NHMS the current study showed 20% of young Malaysian children were at risk of stunting and 21% were at risk of underweight. It is important to detect both underweight and stunting at an earlier stage before growth status deteriorated further. It has been shown that when appropriate measures were taken in children who were at risk of undernutrition, the growth parameters can be reversed (26).
Our observation that undernutrition in children under five is more likely to affect boys than girls is consistent with the findings of a meta-analysis on gender differences in undernutrition which also showed boys had higher odds of stunting and being wasted than girls (27). At present, there is no satisfactory explanation for this observed gender difference but there may be implications for nutrition policy and practice (27).
Another systematic analysis showed that although male disadvantage in linear growth is most evident in the first years, the gender gap has largely disappeared by the age of 4 years and in some countries, the gap has been reversed (28). The result of our study is somewhat different. We observed a reduction in the proportion of children who were stunted in both gender across age groups.
We also found that poor dietary intake was a risk factor for underweight and/or stunting in children. This is not surprising as poor dietary intake may impede the process of catch-up growth, which in turn leads to underweight, stunting or both (1). Similarly, a study in urban Malaysian children found that stunting was associated with a diet with higher energy density, whereby a higher dietary energy density was associated with lower carbohydrate, sugar, vitamins C and D, and calcium intakes but higher in fat, fiber, iron, and folate intakes (29). Thus, in addition to increasing energy intake, it is also important to attain minimal meal frequency and minimum dietary diversity. High energy intake alone does not necessarily guarantee good bone growth and good gain in height. In setting where food intake is adequate, optimum dietary diversity which include optimum substrate for bone growth, including adequate vitamin D, calcium, and phosphate intake is important.
The present study also noted that children who had feeding issues were more likely to being underweight and stunted, albeit less significant for stunting. Persistent feeding difficulties may result in an imbalanced diet or insufficient nutrients intake, leading to weight loss (30). However, we did not analyse whether having just one or both factors affected the child's height status as number of children reported to have both factors were small. A study of healthy children (12–36 months) by Lee et al. showed that children who had food refusal were more likely to have growth faltering, while children with limited variety of food intake were less likely to have short stature (31).
Surprisingly, we found that although short paternal stature was a significant risk factor for undernutrition in children aged 1 to 5 years, no significant association was noted between maternal height and child undernutrition. In this study, children were 2.35–2.76 times more likely to being stunted and/or underweight if having a father who was short. This could be due to the cumulative effect of the interaction between genetic and early-life environmental factors (i.e., nutrition and disease occurrence), which first affect fathers, and then further affect the growth of their children (32). This association may indicate an intergenerational transmission of stunting from fathers to children. However, our results are inconsistent with the findings of previous cross-sectional and longitudinal studies (16, 32–34). A recent meta-analysis of Demographic and Health Surveys (2007–2018) in 35 low- and middle-income countries showed that parental stature was protective against child undernutrition, and maternal short stature had a stronger association with child undernutrition as compared to paternal short stature (32). Our finding of a lack of association between maternal short stature and the child's height was surprising. Recently, however, other maternal factors including interpregnancy interval and maternal anemia have also been found to be important determinants of child's nutritional status and height (35). Further studies which include maternal parity and interpregnancy internal in addition to maternal height status are needed to clarify the effect on child's height status may help to explain the finding of our study.
The present study also confirms the Malaysian NHMS 2019 study where 21.5% of children were either at risk of overweight or overweight (2, 3). This finding reaffirms similar findings in many countries where dual burden of under- and overnutrition in children are common (4, 5).
The strength of this study is it was a nationwide survey with a large sample size. The anthropometric measurements of the children were collected by trained personnel. Secondly, the findings of this study ascertain the current gaps in knowledge on childhood nutritional problems and the risk factors of poor dietary intake and feeding issues. However, a cause-and-effect relationship between the presence of risk factors and childhood undernutrition cannot be established as it was a cross-sectional study.
There are several shortcomings in the present study. Firstly, this study did not fully account for socioeconomic factors, such as household income and parental education. Future studies are needed to improve the understanding on the underlying mechanisms of childhood undernutrition and the potential context-specific interactions. In addition, the data on risk factors of undernutrition were based on parental self-report which may have potential response biases. The definition of feeding difficulty and inadequate intake were not precise enough. This was decided after considering the diverse nature of the interviewees with different educational level and cultural background. Future study should attempt to address this limitation.
In conclusion, undernutrition among children aged ≤ 5 years is of major concern in Malaysia. About one in five children in this study reported having at least one form of undernutrition (stunting and/or underweight). Preventive measures such as promotion of breastfeeding and appropriate feeding practices in early childhood are essential in shaping healthy dietary intake to attain and maintain optimal growth. Nutritional intervention strategies emphasizing healthy diets and appropriate feeding practices would help to promote optimal early childhood growth. In addition, regular monitoring of the child's growth status, diets and feeding is recommended as part of the child's routine care and anticipatory guidance.
The raw data supporting the conclusions of this article will be made available by the authors, without undue reservation.
The studies involving human participants were reviewed and approved by Medical Research Committee, University Malaya Medical Center, Kuala Lumpur, Malaysia. Written informed consent to participate in this study was provided by the participants' legal guardian/next of kin.
WL, MJ, KK, JK, TN, AS, YF, AZ, and HC conceived the research idea and designed the data collection. WL and HC supervised the cleaning and analysis of the data. WL interpreted the data and wrote the first draft of the manuscript. MJ and HC gave critical input to the manuscript. All authors read and agreed to the final version of the manuscript.
The present work was made possible by an unrestricted educational grant from Abbott Nutrition Malaysia. None of the staffs from Abbott Nutrition Malaysia were involved in inception, planning, data collection and analysis, and manuscript preparation. None of the authors received any honorarium for the purpose of the project from the sponsor.
The authors would like to thank all the children and their families who participated in the nationwide screening campaign.
The authors declare that the research was conducted in the absence of any commercial or financial relationships that could be construed as a potential conflict of interest.
All claims expressed in this article are solely those of the authors and do not necessarily represent those of their affiliated organizations, or those of the publisher, the editors and the reviewers. Any product that may be evaluated in this article, or claim that may be made by its manufacturer, is not guaranteed or endorsed by the publisher.
1. United Nations Children's Fund (UNICEF) World Health Organization International International Bank for Reconstruction and Development/The World Bank. Levels and trends in child malnutrition: key findings of the 2021 edition of the joint child malnutrition estimates. Geneva: World Health Organization (2021).
2. Institute for Public Health (IPH) National National Institutes of Health Ministry Ministry of Health Malaysia. National Health and Morbidity Survey (NHMS) 2016: Maternal and Child Health. Vol. II: Findings. Kuala Lumpur: Ministry of Health Malaysia (2016). p. 272.
3. Institute for Public Health (IPH) National National Institutes of Health Ministry Ministry of Health Malaysia. National Health and Morbidity Survey (NHMS) 2019: Vol. I: NCDs–Non-Communicable Diseases: Risk Factors and other Health Problems. Selangor: Ministry of Health Malaysia (2020).
4. World Health Organization. The Double Burden of Malnutrition: Policy Brief. (2017). Available online at: https://www.who.int/publications/i/item/WHO-NMH-NHD-17.3 (accessed April 21, 2021).
5. International Food Policy Research Institute (IFPRI). 2014 The coexistence of different forms of malnutrition is the “new normal”. in Global nutrition report 2014: Actions and accountability to accelerate the world's progress on nutrition. Chapter 4 Washington, D.C.: International Food Policy Research Institute (IFPRI) (1998). p. 22–8.
6. Wells JC, Sawaya AL, Wibaek R, Mwangome M, Poullas MS, Yajnik CS, et al. The double burden of malnutrition: aetiological pathways and consequences for health. Lancet. (2020) 395:75–88. doi: 10.1016/S0140-6736(19)32472-9
7. Victora CG, Adair L, Fall C, Hallal PC, Martorell R, Richter L, et al. Maternal and child undernutrition: consequences for adult health and human capital. Lancet. (2008) 371:0–357. doi: 10.1016/s0140-6736(07)61692-4
8. Kosti RI, Panagiotakos DB, Tountas Y, Mihas CC, Alevizos A, Mariolis T, et al. Parental Body Mass Index in association with the prevalence of overweight/obesity among adolescents in Greece; dietary and lifestyle habits in the context of the family environment: the Vyronas study. Appetite. (2008) 51:218–22. doi: 10.1016/j.appet.2008.02.001
9. Xie W, Jensen SKG, Wade M, Kumar S, Westerlund A, Kakon SH, et al. Growth faltering is associated with altered brain functional connectivity and cognitive outcomes in urban Bangladeshi children exposed to early adversity. BMC Med. (2019) 17:199. doi: 10.1186/s12916-019-1431-5
10. Prendergast AJ, Humphrey JH. The stunting syndrome in developing countries. Paediatr Int Child Health. (2014) 34:250–65. doi: 10.1179/2046905514y.0000000158
11. Adair LS, Fall CH, Osmond C, Stein AD, Martorell R, Ramirez-Zea M, et al. Associations of linear growth and relative weight gain during early life with adult health and human capital in countries of low and middle income: findings from five birth cohort studies. Lancet. (2013) 382:525–34. doi: 10.1016/S0140-6736(13)60103-8
12. Black RE, Victora CG, Walker SP, Bhutta ZA, Christian P, de Onis M, et al. Maternal and child undernutrition and overweight in low-income and middle-income countries. Lancet. (2013) 382:427–51. doi: 10.1016/S0140-6736(13)60937-X
13. McDonald CM, Olofin I, Flaxman S, Fawzi WW, Spiegelman D, Caulfield LE, et al. The effect of multiple anthropometric deficits on child mortality: meta-analysis of individual data in 10 prospective studies from developing countries. Am J Clin Nutr. (2013) 97:896–901. doi: 10.3945/ajcn.112.047639
14. Olofin I, McDonald CM, Ezzati M, Flaxman S, Black RE, Fawzi WW, et al. Associations of suboptimal growth with all-cause and cause-specific mortality in children under five years: A pooled analysis of ten prospective studies. PLoS ONE. (2013) 8:e64636. doi: 10.1371/journal.pone.0064636
15. Utami N, Rachmalina R, Irawati A, Sari K, Rosha BC, Amaliah N, et al. Short birth length, low birth weight and maternal short stature are dominant risks of stunting among children aged 0-23 months: evidence from Bogor longitudinal study on child growth and development, Indonesia. Mal J Nutr. (2018) 24:11–23.
16. Lundeen EA, Stein AD, Adair LS, Behrman JR, Bhargava SK, Dearen KA, et al. Height-for-age z scores increase despite increasing height deficits among 180 children in 5 developing countries. Am J Clin Nutr. (2014) 100:821–5. doi: 10.3945/ajcn.114.084368
17. Leroy JL, Ruel M, Habicht JP, Frongillo EA. Linear growth deficit continues to accumulate beyond the first 1000 days in low- and middle-income countries: global evidence from 51 national surveys. J Nutr. (2014) 144:1460–6. doi: 10.3945/jn.114.191981
18. FAO IFAD UNICEF WFP and WHO. The State of Food Security and Nutrition in the World 2020. Transforming Food Systems For Affordable Healthy Diets. Rome: FAO (2020).
19. Millward DJ. Nutrition, infection and stunting: the roles of deficiencies of individual nutrients and foods, and of inflammation, as determinants of reduced linear growth of children. Nutr Res Rev. (2017) 30:1–23. doi: 10.1017/S0954422416000238
20. Chehade M, Meyer R, Beauregard A. Feeding difficulties in children with non-IgE mediated food allergic gastrointestinal disorders. Ann Allergy Asthma Immunol. (2019) 122:603–9. doi: 10.1016/j.anai.2019.03.020
21. Mehta H, Groetch M, Wang J. Growth and nutritional concerns in children with food allergy. Curr Opin Allergy Clin Immunol. (2013) 13:275–9. doi: 10.1097/aci.0b013e328360949d
22. Kerzner B, Milano K, MacLean Jr WC, Berall G, Stuart S, Chatoor I, et al. practical approach to classifying and managing feeding difficulties. Pediatrics. (2015) 135:344–253. doi: 10.1542/peds.2014-1630
23. WHO Anthro for personal computers, version, 3,.2.2, 2011: Software for assessing growth development of the world's children. Geneva: WHO (2010). Available online at: http://www.who.int/childgrowth/software/en/ (accessed April 5, 2022).
24. WHO Multicentre Growth Reference Study Group. WHO Child Growth Standards: length/height-for-age, weight-forage, weight-for-length and body mass index-for-age: Methods and Development. Geneva: WHO (2006).
25. Institute for Medical Research. Development of growth charts for Malaysian children: Technical report. Kuala Lumpur: Ministry of Health, Malaysia (2015).
26. Keats EC, Das JK, Salam RA, Lassi ZS, Imdad A, Black RE, et al. Effective interventions to address maternal and child malnutrition: an update of the evidence. Lancet Child Adolesc Health. (2021) 5:367–84. doi: 10.1016/S2352-4642(20)30274-1
27. Thurstans S, Opondo C, Seal A, Wells J, Khara T, Dolan C, et al. Boys are more likely to be undernourished than girls: a systematic review and meta-analysis of sex differences in undernutrition. BMJ Glob Health. (2020) 5:e004030. doi: 10.1136/bmjgh-2020-004030
28. Costa JC, Blumenberg C, Victora C. Growth patterns by sex and age among under-5 children from 87 low-income and middle-income countries. BMJ Glob Health. (2021) 6:e007152. doi: 10.1136/bmjgh-2021-007152
29. Shariff ZM, Lin KG, Sariman S, Siew CY, Yusof BNM, Mun CY, et al. Higher dietary energy density is associated with stunting but not overweight and obesity in a sample of urban Malaysian children. Ecol Food Nutr. (2016) 55:378–89. doi: 10.1080/03670244.2016.1181065
30. Dipasquale V, Cucinotta U, Romano C. Acute malnutrition in children: pathophysiology, clinical effects and treatment. Nutrients. (2020) 12:2413. doi: 10.3390/nu12082413
31. Lee WS, Tee CW, Tan AGS, Wong SY, Chew KS, Cheang HK, et al. Parental concern of feeding difficulty predicts poor growth status in their child. Pediatr Neonatol. (2019) 60:676–83. doi: 10.1016/j.pedneo.2019.04.004
32. Li Z, Kim R, Vollmer S. Subramanian SV. Factors associated with child stunting, wasting, and underweight in 35 low- and middle-income countries. JAMA Netw Open. (2020) 3:e203386. doi: 10.1001/jamanetworkopen.2020.3386
33. Addo OY, Stein AD, Fall CH, Gigante DP, Guntupalli AM, Horta BL, et al. Maternal height and child growth patterns. J Pediatr. (2013) 163:549–54.e1. doi: 10.1016/j.jpeds.2013.02.002
34. Wong CY, Zalilah MS, Siti Nur'Asyura A, Norhasmah S, Chin YS. Weight and height faltering in the indigenous children (Orang Asli) of Peninsular Malaysia during the first 2 years of life. Asia Pac J Clin Nutr. (2019) 27:886–92. doi: 10.6133/apjcn.072017.02
Keywords: prevalence, risk factors, young children, at risk of undernutrition, undernutrition, stunting, wasting
Citation: Lee WS, Jalaludin MY, Khoh KM, Kok JL, Nadarajaw T, Soosai AP, Mukhtar F, Fadzil YJ, Anuar Zaini A, Mohd-Taib SH, Rosly RM, Khoo AJ and Cheang HK (2022) Prevalence of undernutrition and associated factors in young children in Malaysia: A nationwide survey. Front. Pediatr. 10:913850. doi: 10.3389/fped.2022.913850
Received: 06 April 2022; Accepted: 26 July 2022;
Published: 18 August 2022.
Edited by:
Jonathan Richard Bishop, Starship Children's Health, New ZealandReviewed by:
Rajesh Kulkarni, Post Graduate Institute Yashwantrao Chavan Memorial Hospital, IndiaCopyright © 2022 Lee, Jalaludin, Khoh, Kok, Nadarajaw, Soosai, Mukhtar, Fadzil, Anuar Zaini, Mohd-Taib, Rosly, Khoo and Cheang. This is an open-access article distributed under the terms of the Creative Commons Attribution License (CC BY). The use, distribution or reproduction in other forums is permitted, provided the original author(s) and the copyright owner(s) are credited and that the original publication in this journal is cited, in accordance with accepted academic practice. No use, distribution or reproduction is permitted which does not comply with these terms.
*Correspondence: Way Seah Lee, bGVld2F5c2VhaEB1dGFyLmVkdS5teQ==
Disclaimer: All claims expressed in this article are solely those of the authors and do not necessarily represent those of their affiliated organizations, or those of the publisher, the editors and the reviewers. Any product that may be evaluated in this article or claim that may be made by its manufacturer is not guaranteed or endorsed by the publisher.
Research integrity at Frontiers
Learn more about the work of our research integrity team to safeguard the quality of each article we publish.