 Li Zhang
 Xingwang Peng
 Lianguo Fu
95% of researchers rate our articles as excellent or good
Learn more about the work of our research integrity team to safeguard the quality of each article we publish.
Find out more
ORIGINAL RESEARCH article
Front. Pediatr. , 15 April 2022
Sec. Pediatric Endocrinology
Volume 10 - 2022 | https://doi.org/10.3389/fped.2022.823424
Objective: The present research aimed to study the relationship between body mass index (BMI), sex hormones, leptin, and irisin in children and adolescents with different body types.
Methods: In this study, a stratified cluster random sampling method was used to select students aged 8-15 years from two 9-year schools as the research subjects. Based on a case-control study, 183 overweight/obese students were selected. After using sex and age matching to create a matched sample of normal-weighted students, a total of 366 students, including 214 boys (58.5%) and 152 girls (41.5%) were included. We measured their height and weight and calculated their body mass index BMI. Afterward, their concentrations of leptin, irisin, oestradiol (E2), and testosterone (T) in the serum were detected.
Results: There were significant differences in T, E2, leptin, and irisin between normal-weighted boys and girls (p < 0.05). There were statistically significant differences in T, E2, and irisin between overweight/obese boys and girls (p < 0.05). Overweight/obese students had higher concentrations of irisin and leptin than normal-weight students (p < 0.05). The direct effect of BMI on irisin was not statistically significant in either normal or overweight/obese students, but their indirect effects via leptin were statistically significant (for normal-weight boys and girls, standardized indirect effect coefficient: 0.29 and 0.38, respectively; for overweight/obese boys and girls, standardized indirect effect coefficient: 0.36 and 0.34, respectively). There was a negative pathway of E2 → leptin → irisin in normal-weight boys (standardized indirect effect coefficient: −0.24) and a negative pathway of T → leptin → irisin in overweight/obese boys (standardized indirect effect coefficient: −0.27).
Conclusion: The indirect effects of BMI on irisin via leptin exist in children and adolescents of different body types. E2 was negatively correlated with leptin in normal-weight boys, whereas T was negatively correlated with leptin in overweight/obese boys.
In children and adolescents, obesity has become an important public health problem that affects their health into adulthood. It is associated with an increased risk of type 2 diabetes mellitus (T2DM), metabolic syndrome (MS), cardiovascular disease (CVD), and different cancers (1, 2).
Irisin was first discovered by Boström et al. (3) in 2012. It is a factor secreted by muscle and fat and one of the most studied motion-induced peptides in recent years. It acts on both fat and muscle tissue and belongs to the adiponectin group. Serum irisin can reflect the metabolic status (4). In addition, it has been demonstrated that serum-circulating irisin levels are associated with significantly increased fibronectin type III domain protein 5 (FNDC5) gene expression in adipose tissue (5, 6). The expression of FNDC5 in fat is approximately 1/100 of that in muscle (7). The FNDC5 is a widely distributed transmembrane glycoprotein that can be proteolytically cleaved as irisin. The FNDC5 and irisin are reported to play critical roles in regulating inflammation, oxidative stress, autophagy, apoptosis, and pathophysiological processes that cause mitochondrial disruption (8). Irisin is mainly released by white subcutaneous adipose tissue (SAT) (9). It plays a key regulatory role in the conversion of white fat to brown fat, and is a thermogenic protein that promotes energy expenditure through the browning of white fat, suggesting its potential role in inhibiting fat storage and obesity and improving metabolic status (10). Recent reports have indicated that irisin is associated with metabolic disorders, such as obesity (11), insulin resistance (IR) (12), musculoskeletal health (13), type 1 diabetes mellitus (T1DM) (14), and T2DM (15). However, there have been few studies on the mechanism of interaction between BMI and serum irisin concentration in children and adolescents.
Leptin is a product of the obesity gene secreted by fat cells and is thought to play a central role in regulating appetite and energy expenditure. It leads to weight loss by influencing food intake and increasing energy expenditure, and is thought to control food intake at least in part through neuropeptide Y (NPY). Leptin is not only a molecule that reflects energy storage in the body, but is also an important cytokine involved in many physiological functions, such as the inflammatory response, insulin sensitivity, bone metabolism, immunity, and, most importantly, reproductive function (16). High leptin levels are an important manifestation of obesity, and children and adolescents show increased leptin levels with increasing body fat mass (17). Studies have shown that leptin increases the expression of the FNDC5 gene through the activation of nitric oxide synthase (NOS) (18). Leptin also triggers mRNA expression of PRDM16, a protein that regulates muscle fat metabolism and controls the expression of genes specific to the transformation process between skeletal muscle and brown fat cells, which is necessary for browning white fat (19).
The levels of sex hormone secretion in obese children change significantly compared with those in normal children. The testosterone (T) level in obese boys decreased and the oestradiol (E2) level increased, whereas the T and E2 level in obese girls increased (20–22). Studies have found that sex differences in the regulation of leptin synthesis are mediated by steroid hormones (23). Particularly, T inhibits leptin secretion and leptin mRNA production in adipocytes, while E2 positively regulates obese gene expression and leptin secretion in female adipocytes (24). Tanaka et al. (25) showed that E2 increased serum leptin concentrations and leptin mRNA expression in adipose tissue of immature rats. Ulker et al. (26) demonstrated that chronic irisin administration had different effects on pubertal maturation and reproductive system in male and female rats. Luo et al. (27) indicated that the circulating irisin level in serum controls the expression of gonadotropin-releasing hormone (GnRH) in the hypothalamus and regulates the secretion of follicle-stimulating hormone (FSH) and luteinizing hormone (LH). The FSH and LH stimulate the secretion of E2 by follicular granulosa cells and T by Leydig cells, respectively. The E2 can directly induce irisin secretion or act through the anabolic pathway to increase female skeletal muscle mass and promote irisin secretion (28). Irisin levels are higher in obese men than in women, suggesting that the physiological effects of irisin may vary by sex. In animal models, circulating irisin and body weight increased significantly in ovariectomized female rats but not in orchiectomized male rats (29). Therefore, BMI, E2, T, leptin, and irisin may correlate with each other. However, their path associations are still unclear in different body types. The present study aimed to study the relationship between BMI, sex hormones, leptin, and irisin in children and adolescents with different body types. Understanding these issues may help to better clarify the metabolic mechanisms in pediatric obesity.
In this study, a stratified cluster random sampling method was used to select students aged 8-15 years among two 9-year schools as the research subjects. Based on the case-control study, 183 overweight/obese children were selected. After gender and age matching to create a matched sample of children of normal-weighted, a total of 366 students, including 214 boys (58.5%) and 152 girls (41.5%), were selected. This study was approved by the Medical Ethics Committee of the Bengbu Medical College [(2015) No. 003] and was conducted in accordance with the Declaration of Helsinki. The participants' guardians signed informed consent forms.
All morphological variables were measured by staff trained in standardization after children and adolescents had removed their shoes and heavy clothing and were at ease with an empty stomach. Body height was measured to the nearest 0.1 cm using a mechanical scale with a height meter, and a digital body scale was used to measure the body weight to the nearest 0.1 kg.
Body mass index was calculated as weight (kg)/height (m)2, and overweight/obese was determined according to the Health industry Standard of the People's Republic of China (WS/T 586-2018). Screening of overweight and obesity in school-age children and adolescents (30).
Venous blood samples of the subjects (~3 ml) after at least 8 h of overnight fasting were collected by medical staff, who had received standardized training, and serum concentrations of irisin and leptin were detected by double-antibody sandwich ELISA. A Human Irisin ELISA Kit and Human Leptin (LEP) ELISA Kit were obtained from Wuhan Huamei Biological Engineering Company. The serum circulating T and E2 levels were assayed using the radioimmunoassay method with a Testosterone Radioimmunoassay Kit and Oestradiol Radioimmunoassay Kit provided by the DIA Company in Shanghai.
Statistical Package for the Social Sciences (SPSS) 23.0 software was used for the analysis of the data. The abnormal data were analyzed after natural logarithmic transformation to normalize the distribution of all subsequent statistical analyses, including structural equation modeling. The quantitative data were described as the mean ± SD, and a t-test was used to investigate the role of E2, T, leptin, and irisin in different body types and their differences between boys and girls. Pearson correlation was used to analyze the correlation between each index. The AMOS 24.0 was used to construct the structural equation model, and the bootstrap program was used to test the indirect effect. The p < 0.05 was considered a statistically significant difference.
A total of 366 students were enrolled in this study, including 214 boys (58.5%) and 152 girls (41.5%). The concentration of E2, T, leptin, and irisin between boys and girls (overweight/obese and normal weight) was significantly different. However, there were some overweight or obese boys and girls, in whom the leptin concentration was not significantly different. Data are shown in Table 1.
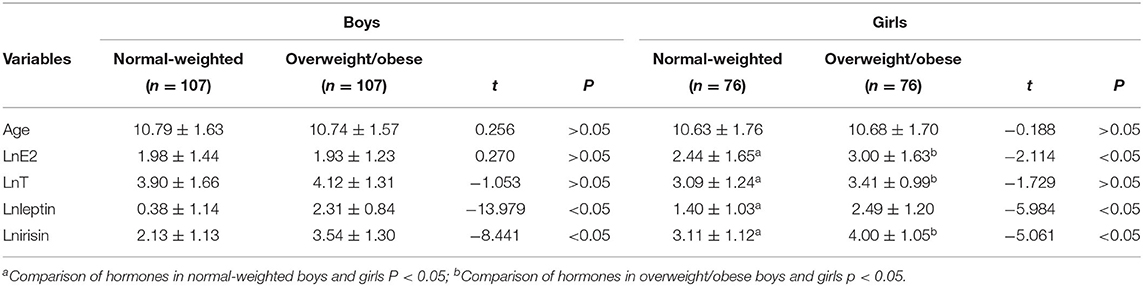
Table 1. General situational analysis of research objects (Mean ± SD).
A slight correlation was found between BMI and E2, T, leptin, and irisin participants of all groups. Leptin and irisin were highly correlated in all groups. A slight correlation was found between BMI and E2, T, leptin, and irisin participants of all groups, with the exception of boys and girls with overweight or obese. Leptin and irisin were highly correlated in all groups. A slight correlation was also found between E2 and leptin in boys and girls with normal-weighted, T and leptin in boys and girls with overweight or obese and between E2 and irisin in girls with normal-weighted. The T was significantly associated with leptin in overweight/obese boys and girls. Data are shown in Table 2.
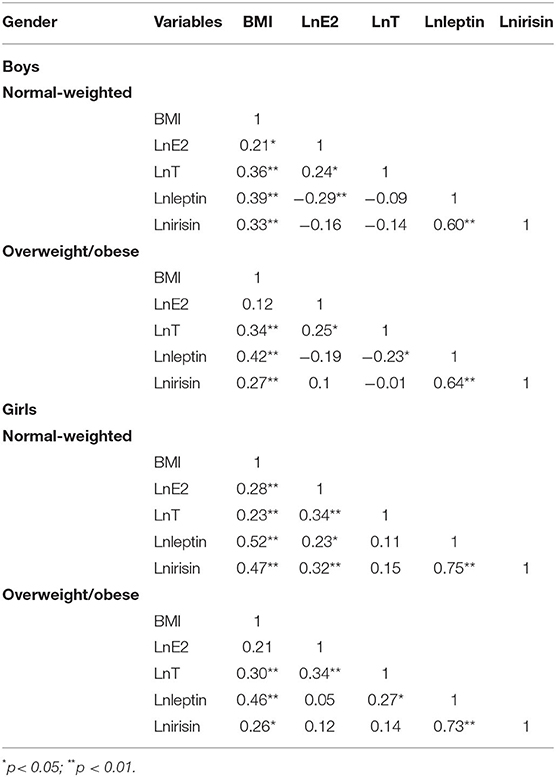
Table 2. Correlation coefficient between body mass index (BMI), testosterone (T), oestradiol (E2), leptin, and irisin in children and adolescents with different body types.
Multiple linear regression analysis was conducted with irisin, leptin, E2, and T as dependent variables. Figure 1 shows that leptin was an independent predictor of irisin, and that BMI was an independent predictor of leptin in all boys and girls. In normal-weight boys, E2 was an independent predictor of leptin. In overweight/obese boys, T was an independent predictor of leptin.
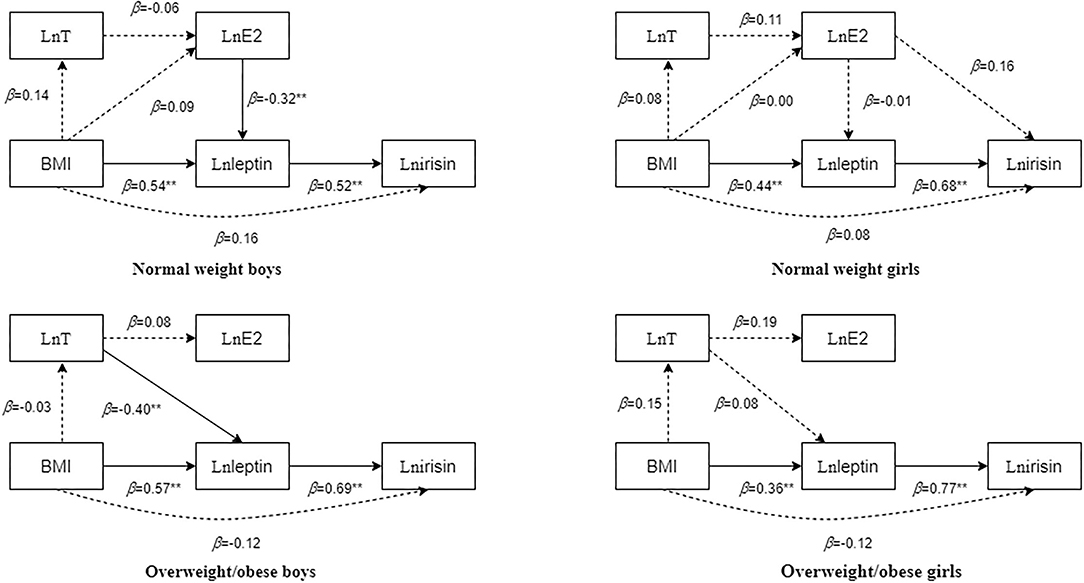
Figure 1. Multifactor regression results of body mass index (BMI), testosterone (T), oestradiol (E2), leptin, and irisin in children and adolescents with different body types after adjusting for age. The dotted line in the figure indicates that the regression result is not statistically significant, whereas the solid line indicates that the regression result is statistically significant. The numbers beside the arrows show the standardized regression coefficients; **p < 0.01.
Based on the correlation and regression results, path structural equation models of BMI, T, E2, leptin, and irisin in children and adolescents with different body types were constructed (Figure 2).
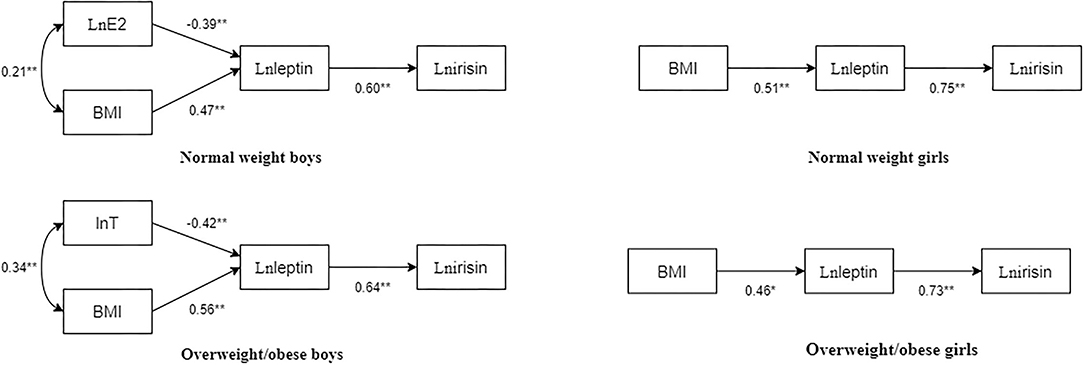
Figure 2. Path diagram of BMI, T, E2, leptin, and irisin in children and adolescents with different body types. The numbers beside the arrows show the standardized path coefficients; *p < 0.05; **p < 0.01.
In normal-weight boys, the fit indices of the model were as follows: χ2/df = 0.845, normed fit index (NFI) = 0.982, incremental fit index (IFI) = 1.003, Tucker-Lewis index (TLI) = 1.011, comparative fit index (CFI) = 1, goodness-of-fit index (GFI) = 0.992, stangardized root mean square residual (SRMR) = 0.03, p = 0.430. Particularly, E2 had a significant negative predictive effect on leptin (standardized path coefficient β = −0.39, p < 0.01), BMI had a significant positive predictive effect on leptin (standardized path coefficient β = 0.47, p < 0.01), and leptin significantly and positively predicted irisin (standardized path coefficient β = 0.60, p < 0.01).
In overweight/obese boys, the fit indices of the model were χ2/df = 2.562, NFI = 0.956, IFI = 0.973, TLI = 0.915, CFI = 0.972, GFI = 0.977, SRMR = 0.04, and p = 0.077. Particularly, T had a significant negative predictive effect on leptin (standardized path coefficient β = −0.42, p < 0.01), BMI had a significant positive predictive effect on leptin (standardized path coefficient β = 0.56, p < 0.01), and leptin significantly and positively predicted irisin (standardized path coefficient β = 0.64, p < 0.01).
In normal-weight girls, the fit indices of the model were χ2/df = 1.545, NFI = 0.982, IFI = 0.994, TLI = 0.981, CFI = 0.994, GFI = 0.987, SRMR = 0.03, p = 0.214. Particularly, BMI had a significant positive predictive effect on leptin (standardized path coefficient β = 0.51, p < 0.01), and leptin positively predicted irisin (standardized path coefficient β = 0.75, p < 0.01).
In overweight/obese girls, the fit indices of the model were χ2/df = 1.316, NFI = 0.983, IFI = 0.996, TLI = 0.987, CFI = 0.996, GFI = 0.989, SRMR = 0.03, and p = 0.251. Particularly, BMI had a significant positive predictive effect on leptin (standardized path coefficient β = 0.46, p < 0.01), and leptin significantly positively predicted irisin (standardized path coefficient β = 0.73, p < 0.01).
The bootstrap method with bias correction percentile was used to repeatedly sample 5,000 times to test the above paths. The results in Table 3 showed that the above paths have significant indirect effects. In normal-weight boys, the indirect paths from E2 to irisin and the indirect paths from BMI to irisin were statistically significant [standardized indirect effect coefficient: −0.24 (p < 0.01) and 0.29 (p < 0.01), respectively]. In overweight/obese boys, the indirect paths from T to irisin and the indirect paths from BMI to irisin were statistically significant [standardized indirect effect coefficient: −0.27 (p < 0.01) and 0.36 (p < 0.01), respectively]. In normal-weight girls, the indirect paths from BMI to irisin were statistically significant [standardized indirect effect coefficient: 0.38 (p < 0.01)]. In overweight/obese girls, the indirect paths from BMI to irisin were statistically significant [standardized indirect effect coefficient: = 0.34 (p < 0.01)].
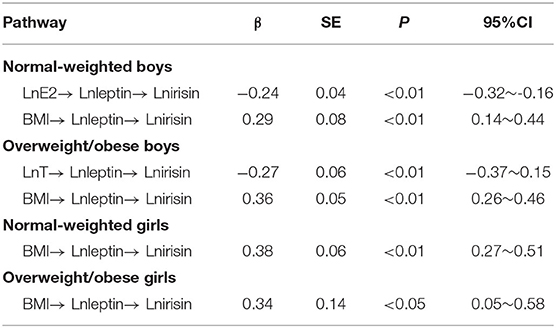
Table 3. Bootstrap analysis of significance test of indirect effect.
In recent decades, obesity in children and adolescents has become a serious health problem worldwide, leading to lifelong clinical and psychosocial consequences and other comorbidities, such as impaired glucose tolerance (31) and abnormalities associated with growth and puberty (32). The relationships between adipokines in pediatric obesity are still not very clear. Our study indicated that serum leptin and irisin concentrations in girls were significantly higher than those in boys. Leptin and irisin concentrations in overweight/obese children and adolescents were significantly higher than those in normal-weight children and adolescents. Serum leptin levels in children and adolescents play a mediating role in the relationship between BMI and irisin. The E2 was negatively correlated with leptin in normal-weight boys, whereas T was negatively correlated with leptin in overweight/obese boys.
Leptin levels have been shown to exponentially increase with adipose tissue mass (33), while increased leptin levels in obese people can directly downregulate leptin receptor levels or block post-receptor signal transduction, leading to leptin resistance and promoting leptin secretion, which causes hyperleptinemia. Therefore, obesity in humans may represent a state of leptin resistance (34), which can cause IR through a variety of pathways. Hence, leptin is a recognized indicator of IR (35). Stengel et al. (11) found that irisin was positively correlated with body fat percentage and BMI with abdominal obesity. However, some studies have shown that the serum irisin level of overweight and obese people is lower than that of normal-weight people and that irisin is negatively correlated with overweight and obesity (5), but other studies have shown no clear link (36, 37). Therefore, the relationship between BMI and serum irisin concentration is highly controversial. The total concentration of irisin is higher in obese people at rest than in lean people, suggesting that the elevated levels of irisin in obese people are chronically elevated due to changes in metabolic signals associated with obesity (29).
This study showed that there was sexual dimorphism in serum leptin concentration in normal-weight children and adolescents, with girls having a higher concentration than boys, consistent with the results of relevant studies (38, 39). The higher levels of leptin in girls are attributed to the higher fat content in girls than in boys. In addition, sex hormones may play a role in leptin synthesis and/or release. Irisin also has sexual dimorphism in both normal-weight and overweight/obese children and adolescents, with girls' irisin levels higher than boys'. One study found that resting girls have higher levels of irisin than boys (40). Irisin is a factor acting in and secreted by muscles and fat. Hence, sexual dimorphism of irisin may be related to the different distribution of skeletal muscle, fat, and other body components in boys and girls (41).
Through path analysis, this study found that BMI was a positive and significant predictor of leptin in children and adolescents with different body types. The BMI was not a direct predictor of irisin, but leptin had a certain mediating effect on the relationship between BMI and irisin. Studies have confirmed that leptin concentration in obese people is significantly increased, leptin concentration is positively correlated with IR, irisin concentration is positively correlated with IR (42), and leptin regulates FNDC5 expression and/or irisin production (43, 44). Therefore, the association between BMI and irisin concentration may be due to leptin mediation. In normal-weight boys, in addition to the BM → leptin → irisin pathway, there is also a negative E2 → leptin → irisin pathway, wherein E2 is negatively correlated with leptin different from the results of Lou et al. (45). This may be because E2 in boys is mainly transformed from T through aromatization. Hence, boys of normal weight have a higher T level and a corresponding increase in E2 level. Therefore, the inhibition of leptin secretion is not reflected in the T level but in the E2 level. In overweight/obese boys, in addition to the BMI → leptin → irisin pathway, there was also a negative T → leptin → irisin pathway, in which T was negatively correlated with leptin. Existing studies have also confirmed that T inhibits the secretion of leptin, and serum irisin is negatively correlated with T (46, 47). In vitro studies of cultured human adipocytes also revealed the inhibitory effect of T and dihydrotestosterone (DHT) on leptin. The serum T levels of obese boys decreased, and the inhibitory effect on leptin was weakened, leading to a significant increase in leptin level (48). Moreover, there was no significant inhibitory effect of E2/T on leptin in normal-weight and overweight/obese girls. Li et al. (49) found that there was no correlation between serum leptin levels, E2, and T in girls during pubertal development. In addition, compared with boys, girls had lower T levels, which may not be enough to inhibit leptin. Existing studies have reported an inconsistent relationship between E2 and leptin in women. A large number of studies have found a positive (50, 51) or negative correlation (52), while some have found no correlation between E2 and leptin (53, 54), which seems to be a complicated issue. The path association may be related to genetic and epigenetic factors. Studies reported that the expression level of fat mass and obesity associated gene (FTO) and pleomorphic adenoma gene 1 (PLAG1) genes associated with obesity was significantly related to the concentration of leptin (55, 56).
This study found that there may be a negative feedback effect of sex hormones on leptin and irisin in boys. Leptin and irisin are thought to play a role in the connection between body fat storage and the hypothalamic-pituitary-gonad (HPG). Leptin controls the normal physiology of the reproductive system and interacts with the HPG axis through a complex mechanism that links energy homeostasis to reproduction (16), while irisin stimulates gonadotropin gene expression in pituitary cells (57). This may indicate that the relationship between leptin, irisin, and sex hormones is governed by a complex feedback loop, rather than a simple one-way relationship. The existing data showed that irisin has positive effects on pituitary functions as chronic exposure to irisin produced significant increases in serum LH and T levels in male rats (26). In vivo, irisin could promote the secretion of FSH and LH in female rats (58). In addition, in vitro, irisin treatment increased the expression of FSH and LH in the pituitary cells by improving the stability of transcription. Hence, irisin may play a GnRH-like role in the HPG axis (57). Therefore, irisin levels in circulation change significantly during adolescence, pregnancy, and postpartum when the functions of the HPG axis are active. However, the mechanism by which leptin and irisin into with sex hormones are largely unknown.
There are some limitations in the study that should be noted. First, this is a cross-sectional study, and it cannot explain the causal relationship between hormones. Second, the body shape of children and adolescents can be influenced by other confounding factors, such as diet and exercise, which this study did not take into consideration. Third, the research population only included Chinese children and adolescents, which prevents explanation of the situation of children and adolescents in other countries. The research results need to be verified by further studies.
This study indicated that the leptin and irisin concentrations of overweight/obese boys and girls were significantly higher than those with normal weight. In addition, there was sexual dimorphism in serum irisin concentration in both normal or overweight/obese children and adolescents, with girls having a higher concentration than boys. The indirect effects of BMI on irisin via leptin exist in children and adolescents of different body types both in boys and girls. The E2 was negatively correlated with leptin in normal-weight boys, whereas T was negatively correlated with leptin in overweight/obese boys.
The original contributions presented in the study are included in the article/supplementary files, further inquiries can be directed to the corresponding author/s.
The studies involving human participants were reviewed and approved by Medical Ethics Committee of the Bengbu Medical College ([2015] No. 003). Written informed consent to participate in this study was provided by the participants' legal guardian/next of kin.
LZ conceptualized and designed the study, analyzed and interpreted the data, drafted the initial manuscript, and reviewed and revised the manuscript. XP, YW, RC, and ZZ collected data and revised the manuscript. LF conceptualized and designed the study, coordinated and supervised data collection, and critically reviewed the manuscript for important intellectual content. All authors contributed to the study conception and design and read and approved the final manuscript.
This project was supported by grants from the National Natural Science Foundation of China (81502823), 512 Talent Cultivation Plan of Bengbu Medical College (by51201204), and the Scientific Research and Innovation Team Project of Bengbu Medical College (BYKC201901).
The authors declare that the research was conducted in the absence of any commercial or financial relationships that could be construed as a potential conflict of interest.
All claims expressed in this article are solely those of the authors and do not necessarily represent those of their affiliated organizations, or those of the publisher, the editors and the reviewers. Any product that may be evaluated in this article, or claim that may be made by its manufacturer, is not guaranteed or endorsed by the publisher.
We would like to thank the students and teachers who participated in the current study and Weige Jiang for assisting with student recruitment.
1. Chang CJ, Jian DY, Lin MW, Zhao JZ, Ho LT, Juan CC. Evidence in obese children: contribution of hyperlipidemia, obesity inflammation, and insulin sensitivity. PLoS One. (2015) 10:e0125935. doi: 10.1371/journal.pone.0125935
2. Dietz WH, Economos CD. Progress in the control of childhood obesity. Pediatrics. (2015) 135:e559-61. doi: 10.1542/peds.2014-2972
3. Boström P, Wu J, Jedrychowski MP, Korde A, Ye L, Lo JC, et al. A PGC1-α-dependent myokine that drives brown-fat-like development of white fat and thermogenesis. Nature. (2012) 481:463-8. doi: 10.1038/nature10777
4. Sanchis-Gomar F, Perez-Quilis C. Irisinemia: a novel concept to coin in clinical medicine? Annals Nutr Metab. (2013) 63:60-1. doi: 10.1159/000354090
5. Moreno-Navarrete JM, Ortega F, Serrano M, Guerra E, Pardo G, Tinahones F, et al. Irisin is expressed and produced by human muscle and adipose tissue in association with obesity and insulin resistance. J Clin Endocrinol Metab. (2013) 98:E769-78. doi: 10.1210/jc.2012-2749
6. Lopez-Legarrea P, de la Iglesia R, Crujeiras AB, Pardo M, Casanueva FF, Zulet MA, et al. Higher baseline irisin concentrations are associated with greater reductions in glycemia and insulinemia after weight loss in obese subjects. Nutr Diab. (2014) 4:e110. doi: 10.1038/nutd.2014.7
7. Huh JY, Panagiotou G, Mougios V, Brinkoetter M, Vamvini MT, Schneider BE, et al. FNDC5 and irisin in humans: I. Predictors of circulating concentrations in serum and plasma and II. mRNA expression and circulating concentrations in response to weight loss and exercise. Metab Clin Exp. (2012) 61:1725-38. doi: 10.1016/j.metabol.2012.09.002
8. Zhang X, Hu C, Yuan YP, Ma ZG, Tang QZ. A brief overview about the physiology of fibronectin type III domain-containing 5. Cell Signal. (2020) 76:109805. doi: 10.1016/j.cellsig.2020.109805
9. Roca-Rivada A, Castelao C, Senin LL, Landrove MO, Baltar J, Belén Crujeiras A, et al. FNDC5/irisin is not only a myokine but also an adipokine. PLoS ONE. (2013) 8:e60563. doi: 10.1371/journal.pone.0060563
10. Arhire LI, Mihalache L, Covasa M. Irisin: a hope in understanding and managing obesity and metabolic syndrome. Front Endocrinol. (2019) 10:524. doi: 10.3389/fendo.2019.00524
11. Stengel A, Hofmann T, Goebel-Stengel M, Elbelt U, Kobelt P, Klapp BF. Circulating levels of irisin in patients with anorexia nervosa and different stages of obesity–correlation with body mass index. Peptides. (2013) 39:125-30. doi: 10.1016/j.peptides.2012.11.014
12. Staiger H, Böhm A, Scheler M, Berti L, Machann J, Schick F, et al. Common genetic variation in the human FNDC5 locus, encoding the novel muscle-derived “browning” factor irisin, determines insulin sensitivity. PLoS ONE. (2013) 8:e61903. doi: 10.1371/journal.pone.0061903
13. Colaianni G, Faienza MF, Sanesi L, Brunetti G, Pignataro P, Lippo L, et al. Irisin serum levels are positively correlated with bone mineral status in a population of healthy children. Pediatr Res. (2019) 85:484-8. doi: 10.1038/s41390-019-0278-y
14. Faienza MF, Brunetti G, Sanesi L, Colaianni G, Celi M, Piacente L, et al. High irisin levels are associated with better glycemic control and bone health in children with Type 1 diabetes. Diab Res Clin Pract. (2018) 141:10-7. doi: 10.1016/j.diabres.2018.03.046
15. Khidr EG, Ali SS, Elshafey MM, Fawzy OA. Association of irisin and FNDC5 rs16835198 G>T gene polymorphism with type 2 diabetes mellitus and diabetic nephropathy. An Egyptian pilot study. Gene. (2017) 626:26-31. doi: 10.1016/j.gene.2017.05.010
16. Salem AM. Variation of leptin during menstrual cycle and its relation to the hypothalamic-pituitary-gonadal (HPG) axis: a systematic review. Int J Womens Health. (2021) 13:445-58. doi: 10.2147/IJWH.S309299
17. Frühbeck G, Gómez-Ambrosi J, Muruzábal FJ, Burrell MA. The adipocyte: a model for integration of endocrine and metabolic signaling in energy metabolism regulation. Am J Physiol Endocrinol Metab. (2001) 280:E827-47. doi: 10.1152/ajpendo.2001.280.6.E827
18. Rodríguez A, Becerril S, Méndez-Giménez L, Ramírez B, Sáinz N, Catalán V, et al. Leptin administration activates irisin-induced myogenesis via nitric oxide-dependent mechanisms, but reduces its effect on subcutaneous fat browning in mice. Int J Obes. (2015) 39:397-407. doi: 10.1038/ijo.2014.166
19. Cohen P, Levy JD, Zhang Y, Frontini A, Kolodin DP, Svensson KJ, et al. Ablation of PRDM16 and beige adipose causes metabolic dysfunction and a subcutaneous to visceral fat switch. Cell. (2014) 156:304-16. doi: 10.1016/j.cell.2013.12.021
20. Mauras N, Santen RJ, Colón-Otero G, Hossain J, Wang Q, Mesaros C, et al. Estrogens and their genotoxic metabolites are increased in obese prepubertal girls. J Clin Endocrinol Metab. (2015) 100:2322-8. doi: 10.1210/jc.2015-1495
21. Reinehr T, Roth CL. Is there a causal relationship between obesity and puberty? Lancet Child Adolesc Health. (2019) 3:44-54. doi: 10.1016/S2352-4642(18)30306-7
22. Nokoff N, Thurston J, Hilkin A, Pyle L, Zeitler PS, Nadeau KJ, et al. Sex differences in effects of obesity on reproductive hormones and glucose metabolism in early puberty. J Clin Endocrinol Metab. (2019) 104:4390-7. doi: 10.1210/jc.2018-02747
23. Popovic V, Casanueva FF. Leptin, nutrition and reproduction: new insights. Hormones. (2002) 1:204-17. doi: 10.14310/horm.2002.1169
24. Jockenhövel F, Blum WF, Vogel E, Englaro P, Müller-Wieland D, Reinwein D, et al. Testosterone substitution normalizes elevated serum leptin levels in hypogonadal men. J Clin Endocrinol Metab. (1997) 82:2510-3. doi: 10.1210/jcem.82.8.4174
25. Tanaka M, Nakaya S, Kumai T, Watanabe M, Tateishi T, Shimizu H, et al. Effects of estrogen on serum leptin levels and leptin mRNA expression in adipose tissue in rats. Hormone Res. (2001) 56:98-104. doi: 10.1159/000048099
26. Ulker N, Yardimci A, Kaya Tektemur N, Bulmus O, Ozer Kaya S, Gulcu Bulmus F, et al. Irisin may have a role in pubertal development and regulation of reproductive function in rats. Reproduction. (2020) 160:281-92. doi: 10.1530/REP-20-0072
27. Luo Y, Qiao X, Xu L, Huang G. Irisin: circulating levels in serum and its relation to gonadal axis. Endocrine. (2022) 75:663-71. doi: 10.1007/s12020-022-02981-5
28. Brown M. Skeletal muscle and bone: effect of sex steroids and aging. Adv Physiol Educ. (2008) 32:120-6. doi: 10.1152/advan.90111.2008
29. Zügel M, Qiu S, Laszlo R, Bosnyák E, Weigt C, Müller D, et al. The role of sex, adiposity, and gonadectomy in the regulation of irisin secretion. Endocrine. (2016) 54:101-10. doi: 10.1007/s12020-016-0913-x
30. National Health Commission of the People's Republic of China. Screening of Overweight and Obesity in School-Age Children and Adolescents. People's Republic of China: National Health Commission of the People's Republic of China (2018).
31. Lee EY, Yoon KH. Epidemic obesity in children and adolescents: risk factors and prevention. Front Med. (2018) 12:658-66. doi: 10.1007/s11684-018-0640-1
32. Bradwisch SA, Smith EM, Mooney C, Scaccia D. Obesity in children and adolescents: an overview. Nursing. (2020) 50:60-6. doi: 10.1097/01.NURSE.0000718908.20119.01
33. Zhang Y, Chua S Jr. Leptin function and regulation. Compreh Physiol. (2017) 8:351-69. doi: 10.1002/cphy.c160041
34. Liu J, Yang X, Yu S, Zheng R. The leptin resistance. Adv Exp Med Biol. (2018) 1090:145-63. doi: 10.1007/978-981-13-1286-1_8
35. Nasrat H, Patra SK, Goswami B, Jain A, Raghunandan C. Study of association of leptin and insulin resistance markers in patients of PCOS. Indian J Clin Biochem IJCB. (2016) 31:104-7. doi: 10.1007/s12291-015-0499-8
36. Timmons JA, Baar K, Davidsen PK, Atherton PJ. Is irisin a human exercise gene? Nature. (2012) 488:E9-10; discussion E10-11. doi: 10.1038/nature11364
37. Sanchis-Gomar F, Alis R, Pareja-Galeano H, Sola E, Victor VM, Rocha M, et al. Circulating irisin levels are not correlated with BMI, age, and other biological parameters in obese and diabetic patients. Endocrine. (2014) 46:674-7. doi: 10.1007/s12020-014-0170-9
38. Watanobe H, Habu S. Manipulation of neonatal gonadal steroid milieu and leptin secretion in later life in male and female rats. Regul Peptides. (2003) 110:219-24. doi: 10.1016/S0167-0115(02)00215-X
39. Antunes H, Santos C, Carvalho S. Serum leptin levels in overweight children and adolescents. Br J Nutr. (2009) 101:1262-6. doi: 10.1017/S0007114508055682
40. Al-Daghri NM, Alkharfy KM, Rahman S, Amer OE, Vinodson B, Sabico S, et al. Irisin as a predictor of glucose metabolism in children: sexually dimorphic effects. Eur J Clin Invest. (2014) 44:119-24. doi: 10.1111/eci.12196
41. Staiano AE, Katzmarzyk PT. Ethnic and sex differences in body fat and visceral and subcutaneous adiposity in children and adolescents. Int J Obes. (2012) 36:1261-9. doi: 10.1038/ijo.2012.95
42. Reinehr T, Elfers C, Lass N, Roth CL. Irisin and its relation to insulin resistance and puberty in obese children: a longitudinal analysis. J Clin Endocrinol Metab. (2015) 100:2123-30. doi: 10.1210/jc.2015-1208
43. Rodríguez A, Becerril S, Ezquerro S, Méndez-Giménez L, Frühbeck G. Crosstalk between adipokines and myokines in fat browning. Acta Physiol. (2017) 219:362-81. doi: 10.1111/apha.12686
44. Gutierrez-Repiso C, Garcia-Serrano S, Rodriguez-Pacheco F, Garcia-Escobar E, Haro-Mora JJ, Garcia-Arnes J, et al. FNDC5 could be regulated by leptin in adipose tissue. Eur J Clin Invest. (2014) 44:918-25. doi: 10.1111/eci.12324
45. Lou XM, Duan GC, Chen J, Zhou Y. [Study on the level changes of obesity-associated factors and puberty-associated hormones and their relationship between obese and normal 13 years old children]. Wei sheng yan jiu = J Hygiene Res. (2006) 35:468-71. doi: 10.3969/j.issn.1000-8020.2006.04.025
46. Kamenov Z, Assyov Y, Angelova P, Gateva A, Tsakova A. Irisin and testosterone in men with metabolic syndrome. Hormone Metab Res = Hormon- und Stoffwechselforschung = Hormones et metabolisme. (2017) 49:755-9. doi: 10.1055/s-0043-115227
47. Khodamoradi K, Parmar M, Khosravizadeh Z, Kuchakulla M, Manoharan M, Arora H. The role of leptin and obesity on male infertility. Curr Opin Urol. (2020) 30:334-9. doi: 10.1097/MOU.0000000000000762
48. Shi LM, Gong JJJoWMC. Analysis of serum leptin, insulin, estradiol and testosterone in male children with simple obesity. J Wenzhou Med Coll. (2009) 39:582–84. doi: 10.13771/j.cnki.33-1386/r.2009.06.033
49. Li Y, Sun CH, Chen P, Wang X, Fan RQ. [Roles of leptin in the development during girls'puberty]. Zhonghua yu fang yi xue za zhi [Chin J Prev Med]. (2003) 37:16-9. doi: 10.3760/j:issn:0253-9624.2003.01.005
50. Puder JJ, Monaco SE, Sen Gupta S, Wang J, Ferin M, Warren MP. Estrogen and exercise may be related to body fat distribution and leptin in young women. Fertil Steril. (2006) 86:694-9. doi: 10.1016/j.fertnstert.2006.02.085
51. Ankarberg-Lindgren C, Dahlgren J, Carlsson B, Rosberg S, Carlsson L, Wikland KA, et al. Leptin levels show diurnal variation throughout puberty in healthy children, and follow a gender-specific pattern. Eur J Endocrinol. (2001) 145:43-51. doi: 10.1530/eje.0.1450043
52. Li W, Xu L, Chen Y, Mu L, Cheng M, Xu W, et al. Effect of estrodiol on leptin receptors expression in regulating fat distribution and adipocyte genesis. Gynecol Endocrinol. (2016) 32:464-8. doi: 10.3109/09513590.2015.1130810
53. Thong FS, McLean C, Graham TE. Plasma leptin in female athletes: relationship with body fat, reproductive, nutritional, and endocrine factors. J Appl Physiol. (2000) 88:2037-44. doi: 10.1152/jappl.2000.88.6.2037
54. Ludwig M, Klein HH, Diedrich K, Ortmann O. Serum leptin concentrations throughout the menstrual cycle. Arch Gynecol Obstetr. (2000) 263:99-101. doi: 10.1007/s004040050004
55. Czogała W, Czogała M, Strojny W, Wator G, Wołkow P, Wójcik M, et al. Methylation and expression of FTO and PLAG1 genes in childhood obesity: insight into anthropometric parameters and glucose-lipid metabolism. Nutrients. (2021) 13:1683. doi: 10.3390/nu13051683
56. Czogała W, Strojny W, Schab M, Grabowska A, Miklusiak K, Kowalczyk W, et al. FTO and PLAG1 genes expression and FTO methylation predict changes in circulating levels of adipokines and gastrointestinal peptides in children. Nutrients. (2021) 13:3585. doi: 10.3390/nu13103585
57. Jiang Q, Zhang Q, Lian A, Xu Y. Irisin stimulates gonadotropins gene expression in tilapia (Oreochromis niloticus) pituitary cells. Anim Reprod Sci. (2017) 185:140-7. doi: 10.1016/j.anireprosci.2017.06.018
Keywords: children and adolescents, BMI, E2, T, leptin, irisin
Citation: Zhang L, Peng X, Wang Y, Cao R, Zhang Z and Fu L (2022) What Is the Relationship Between Body Mass Index, Sex Hormones, Leptin, and Irisin in Children and Adolescents? A Path Analysis. Front. Pediatr. 10:823424. doi: 10.3389/fped.2022.823424
Received: 27 November 2021; Accepted: 17 March 2022;
Published: 15 April 2022.
Edited by:
Giuliana Valerio, University of Naples Parthenope, ItalyReviewed by:
Simonetta Bellone, University of Eastern Piedmont, ItalyCopyright © 2022 Zhang, Peng, Wang, Cao, Zhang and Fu. This is an open-access article distributed under the terms of the Creative Commons Attribution License (CC BY). The use, distribution or reproduction in other forums is permitted, provided the original author(s) and the copyright owner(s) are credited and that the original publication in this journal is cited, in accordance with accepted academic practice. No use, distribution or reproduction is permitted which does not comply with these terms.
*Correspondence: Lianguo Fu, bGlhbmd1b2Z1QDE2My5jb20=
Disclaimer: All claims expressed in this article are solely those of the authors and do not necessarily represent those of their affiliated organizations, or those of the publisher, the editors and the reviewers. Any product that may be evaluated in this article or claim that may be made by its manufacturer is not guaranteed or endorsed by the publisher.
Research integrity at Frontiers
Learn more about the work of our research integrity team to safeguard the quality of each article we publish.