 Qiong Wu1†
 Li Zhang
 Yan Li
- 1Department of Pediatrics, Child Health Care Center, The First Affiliated Hospital of Shandong, First Medical University, Jinan, China
- 2Department of Pediatrics, Shandong Maternal and Child Health Hospital, Jinan, China
Background: It is important to choose a suitable birthweight reference to assess newborns, especially those that are small for gestational age (SGA). Currently, there is no regional standard reference for the north of China or for Shandong province.
Methods: A total of 130,911 data records of singleton, live neonates born at 24–42 weeks of gestation were collected from 2016 to 2018 in Shandong province. A new birthweight-for-gestational age percentile reference was constructed based on the Generalized Additive Model for Location, Scale and Shape (GAMLSS) package in R version 3.5. The established gestational age weight curve was compared separately with the Fenton curve, INTERGROWTH−21st curve, and the Chinese Neonatal Network Standard curve of 2015.
Results: We established the reference values of birthweight by gestational age at the 3rd, 10th, 25th, 50th, 75th, 90th, and 97th percentiles. Newborns had much heavier birthweights than those in the INTERGROWTH-21st and Fenton curves at most gestational ages. Although the newborns' birthweight references were closer to the Chinese Neonatal Network Standard except a few for gestational age, this study and INTERGROWTH-21st had similar birthweight curve shapes.
Conclusions: There are obvious differences among the criteria for newborn birthweights. Therefore, it is more accurate to assess newborns using the local birthweight reference.
Introduction
As a traditional index, birthweight has been used to evaluate intrauterine fetal growth and nutritional status (1). Small for gestational age (SGA), which are newborns whose birthweight falls below the 10th percentile of the reference population, has been identified as the strongest predictor of neonatal morbidity and mortality by pediatricians (2). Many countries have built their own birthweight standard. Current studies on birthweight standards have focused primarily on developed countries (1, 3–11) with limited research from developing and less developed countries (12–15). In 2008, the International Fetal and Newborn Growth Consortium for the Twenty-first Century (INTERGROWTH-21st) (16) developed guidelines for fetal growth and newborn size. The Fenton growth chart for preterm newborns, a meta-analysis based on six related studies, was updated in 2013 and has been widely used in the United States, Britain, Australia, and many other countries to evaluate the intrauterine growth of newborns (17, 18).
In 1986, the birthweight of newborns with gestational ages from 28 to 44 weeks from 15 cities of China was collected and analyzed. Then, the first Chinese newborns' birthweight percentile reference curve was drawn (19). However, the curve did not distinguish between genders and the method used to analyze the data was relatively simple. In 2015, the Chinese Neonatal Network established the newest nationwide neonatal birthweight reference curve with Generalized Additive Model for Location, Scale, and Shape (GAMLSS) method, which has been used in China (20). Subsequently, other provinces in China also successively carried out relevant research (21, 22).
Birthweight can be affected by factors such as ethnicity (23), socioeconomic status, living conditions and natural environment (24, 25), the level of maternal nutrition, and many other factors (26–28). However, limited by sample choice and study design, there is yet to be a consensus on which reference should be adopted for clinical work. Large differences in socioeconomic status, living conditions, and natural environment between the north and south of China make it inappropriate to use the same birthweight reference. It is necessary to establish different birthweight references for different areas. Shandong Province is in the north of China, with a population of 100 million and annual births more than 1.3 million. Therefore, it is essential to establish a local standard for Shandong province. In our study, we aimed to produce a standard growth curve of gestational-age-specific birthweight based on data from the Shandong province and compare the reference from Shandong with international standards.
Methods
Study Design and Participants
From each city in the Shandong province of China one hospital was randomly selected from the secondary and tertiary public hospitals to participate in this research. For cities with a resident population of more than eight million, two hospitals were randomly selected. A total of 12 cities and 17 hospitals were included in the study. The data on live-born newborns admitted to the selected hospitals were collected from September 1, 2016, to August 31, 2018, and newborns born at 24–42 weeks of gestation were chosen for the study.
The inclusion criteria for newborns in this study were gestational age ≥24 weeks and ≤42 weeks based on the last menstrual period (LMP) or early pregnancy ultrasound examination (e.g., 40 weeks + 0 day −40 weeks + 6 days) and singleton birth. Exclusion criteria were any congenital malformations or syndromes. The flowchart for sampling of study participants grouped by gestational age is shown in Supplementary Figure 1. Eventually, a total of 130,212 newborns with gestational age of 24–42 weeks were included in the birth data and remained in the data analysis.
Ethical approval was obtained from the Medical Ethics Committee of the First Affiliated Hospital of Shandong First Medical University. Informed consent was obtained from the parents of study participants.
Weight Measurements and Data Collection
The birthweight (kg) was measured by an electronic weighing scale, accurate to 10 g, after the umbilical cord was cut. The newborns were weighed twice before the weight was recorded. The data collected were gestational age, sex, birthweight, parity, and mode of delivery.
Data Analysis and Construction of Growth Charts
After removing outliers from the data, we constructed the birthweight curves with the Generalized Additive Models for Location, Scale and Shape (GAMLSS) model proposed by Rigby and Stasinopoulos (29). The box-plot (30) method was used in this study to eliminate the interference with the extreme values of curve fitting. We described six parameters and arranged them in order of size by box-plot, followed by calculation of the upper and lower limits, quartiles, median, and outliers. The critical value was set at two.
The upper and lower limits of birthweight at each gestational age were exported and data outside that scope was deleted. Growth curves for the 3rd, 10th, 25th, 50th, 75th, 90th, and 97th percentiles of birthweight were constructed and stratified by sex, with the variables gestational age, birthweight, and gender by using the R software (R version 3.5) GAMLSS package (29, 31). The selection of the GAMLSS model for newborn birthweight stratified by sex can be based on the Akaike information criterion (AIC) (32), the Bayesian information criterion (BIC), or Schwarz Bayesian criterion (SBC) (33). Because of the sample size, we chose the SBC, since it can draw smoother curves with more accurate predictions (Supplementary Table 1). The worm plot (34) and Q–Q plot (35) were selected to detect and fit the residual map of the model.
Comparisons
The established gestational age birthweight curve was compared separately with the Fenton curve (a meta-analysis based on intrauterine growth curves from several developed countries), INTERGROWTH-21st curve (growth curves based on a multi-ethnic prospective study), and the Chinese Neonatal Network Standard (CNNS) curves of 2015 (growth curves based on Chinese native population prospective study).
Results
The study participants included 68,962 male (53%) and 61,250 female (47%) newborns (male-to female-ratio 1.13:1).
Table 1 shows the birthweight percentiles (3rd, 10th, 25th, 50th, 75th, 90th, 97th) for newborns by gestational age. All the male newborns were heavier than female newborns at birth except some in the 3rd percentile.
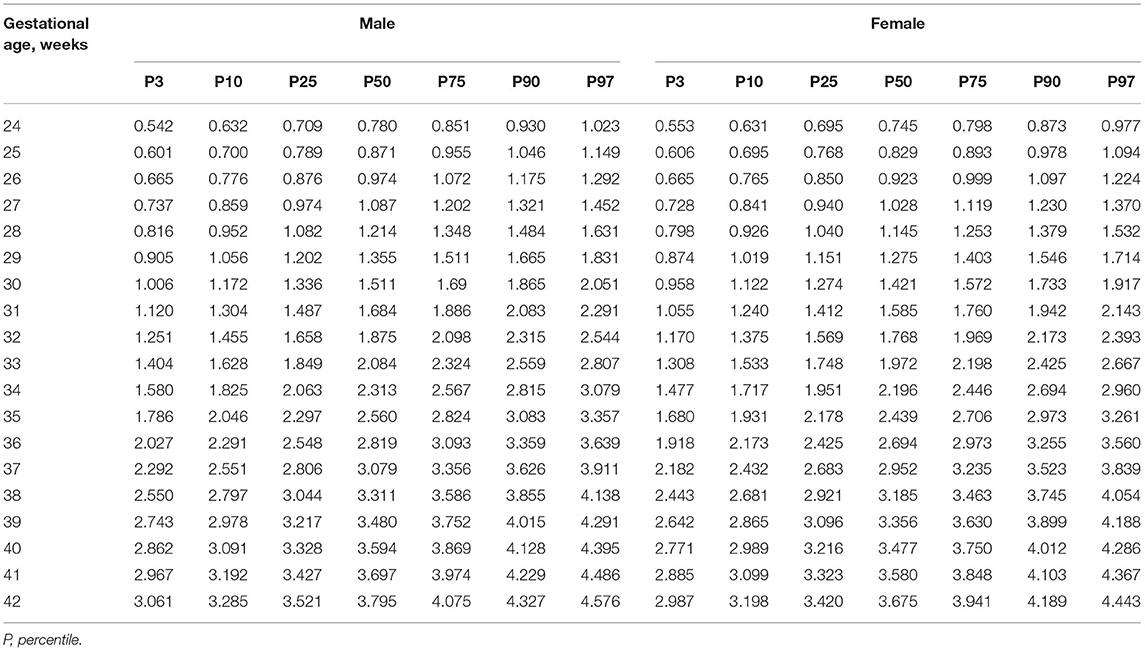
Table 1. Birthweight (kg) percentiles by gestational age.
Figures 1, 2 shows newborn birthweight at the 10th, 50th, and 90th percentiles by gestational age based on CNNS and INTERGROWTH-21st. The birthweight curves show similar shapes, although some differences exist for both sexes. As shown, birthweight increased faster in CNNS before 37 weeks of gestation, then flattened out. In the 10th and 50th percentiles, newborns with gestational age from 28–37 weeks had similar birthweights compared to the CNNS curve, but after 37 weeks birthweights gradually increased in our study. In the 10th and 50th percentiles, before 28 weeks of gestation, newborn birthweights in CNNS gradually decreased with decreasing gestational age. In contrast to CNNS, the present study and INTERGROWTH-21st have similar birthweight curve shapes, with slow weight gain before 28 weeks of gestation and a good rate or weight gain after 37 weeks of gestation. However, in the present study, boys were much heavier than in INTERGROWTH-21st.
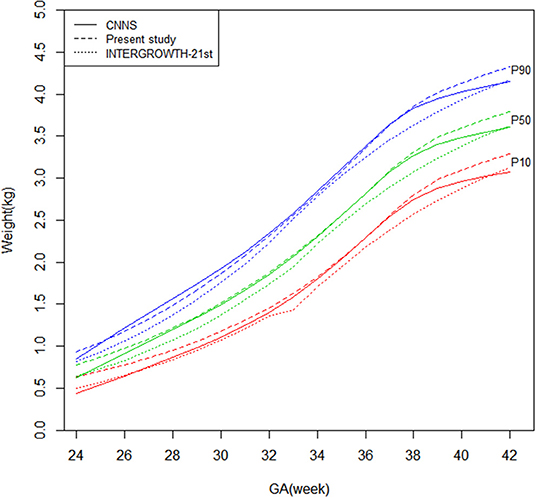
Figure 1. Comparison of birthweight (kg) curves by gestational age among the present study, CNNS and INTERGROWTH-21st Newborns Size Standards/ References (male).
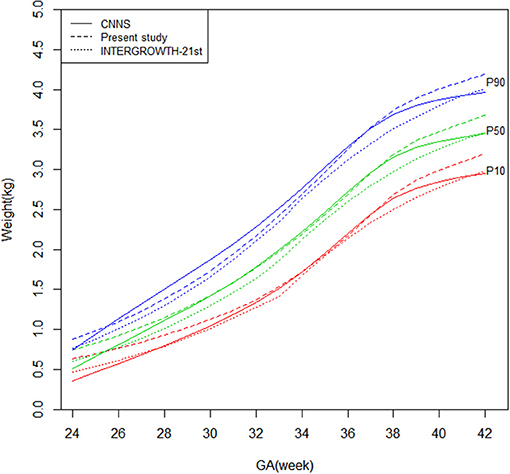
Figure 2. Comparison of birthweight (kg) curves by gestational age among the present study, CNNS and INTERGROWTH-21st Newborns Size Standards/ References (female).
Figure 3 shows that the male newborns' birthweight curves in present study are higher than Fenton curves before 39 weeks gestational age and gradually be exceeded after that.
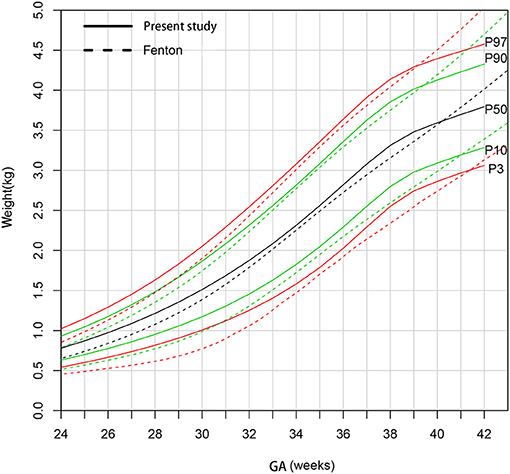
Figure 3. Comparison of birthweight (kg) curves by gestational age between the present study and Fenton curve (male).
Figure 4 shows that the 90th and 97th birthweight curves of female newborns were consistent from 31 to 38 weeks gestational age compared to the Fenton curves. The 50th curve was higher than Fenton curves before 40 weeks gestational age. The 3rd and 10th curves were much heavier than Fenton curves.
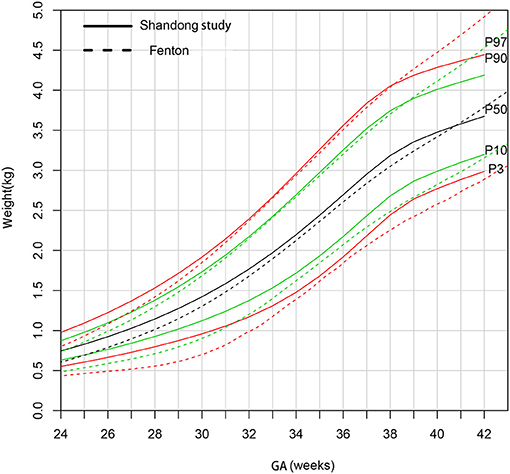
Figure 4. Comparison of birthweight (kg) curves by gestational age between the present study and Fenton curve (female).
Discussion
It is essential to choose an effective birthweight reference curve to estimate birth outcomes in clinical practice (36–38). Using an outdated standard to screen high-risk neonates may lead to a classification error and thereby mislead the doctors who must decide on clinical diagnosis, treatment, and health resource allocation. Shandong and the other provinces in north China have not yet formulated their local standards. Although the population sample of this study is from 12 cities in Shandong Province, most of the northern China provinces, specifically Liaoning, Jilin, Hebei, and Henan, are mainly Han population and have similar local economic conditions and population migration background. Therefore, in addition to representing Shandong, these data can also represent northern China.
After the Two-Child Policy was implemented in China, many couples tried to have a second baby later in life. This was associated with a greater number of older mothers and assisted fertility methods, both of which increase the risk of low birthweight premature babies (39–41). Premature infants generally have a different pattern of early growth than term infants (42). Assessing these babies properly will improve their prognosis. In China, newborns with gestational age of ≤37 weeks are defined as premature infants.
There are three methods commonly used to construct child growth reference curves: cubic splint function (43); locally-weighted regression and smoothing scatterplots; and coefficient of skewness-median-coefficient of variation, LMS (44). In recent years, LMS, a relatively established method, was widely used in calculating age-related growth references for children and adolescents, such as height, weight, head circumference, and sex development. GAMLSS is an emerging method to construct reference curves for child development. When modeling the variables like gestational age and sex, GAMLSS can use all data in the model; therefore, the distribution curve tends to be stable, even if the sample size is small. In this study, the percentile reference standard of birthweight for Shandong province at a gestational age of 24–42 weeks was created by using the GAMLSS method. The reasons that we chose GAMLSS were the more accurate prediction, smoother curve, and successful use in China and overseas (45, 46). Verified by Q–Q plot, worm plot, and residual plot, our reference standard shows that the data distribution is well-fitted.
Our study corroborates those of the CNNS, showing that newborns in north China are much heavier than those in the Fenton curve and INTERGROWTH-21st. This difference has also been shown in other studies, where Chinese newborns were found to be heavier than those in Europe and the United States (42, 47). There are economic and hereditary reasons to be considered concerning this phenomenon. Comparing recent research data on Chinese birthweights and back to 1986 (19), we found that with improvement in economic levels, the birthweights of term infants were significantly higher than 30 years ago. In addition, pregnant women in China have improved their nutrition during pregnancy, which results in increased weight gain during pregnancy and a heavier baby. On the other hand, gaining too much weight during pregnancy has an adverse effect on blood glucose, which will severely affect birthweight (48–51). The newborns in our study >40 weeks of gestation become much lighter than those in the Fenton reference because our curves were based on intrauterine growth data, while the Fenton reference was based on extrauterine growth data.
In the 10th percentile, most of the gestational ages show much heavier birthweights in our study than those in the CNNS, which might result from genetic, economic, and geographic factors. Most importantly, there will be a more accurate assessment for SGA newborns in north China if we use the birthweight reference from Shandong.
Our research has several limitations. First, because of the different medical treatment levels in different regions, higher birthweights are associated with higher chances of survival. Our data comes from level II or level III public hospitals and the medical treatment level at these hospitals is relatively high. Although we can collect more data on SGA newborns, this can cause sampling error, so that birthweight in our study is slightly high, especially for newborns with gestational age <28 weeks. Second, our study is a cross-sectional study, and more follow-up is needed to observe weight fluctuations. In future studies, we can establish an array of research including local newborns with larger sample size, complete sets of growth measurements like birth height and birth head circumference, and long-term follow-up, and construct a more reliable growth curve for newborns especially for newborns with gestational age <28 weeks.
Conclusions
It is important to choose suitable criteria to assess newborn birthweight. We established the first birthweight references from Shandong Province. Our birthweight references are higher than those of Fenton and INTERGROWTH-21st and are somewhat higher than those of the CNNS. Although the reason for this needs to be further clarified, it might indicate possible economic and hereditary differences and creates concern over the appropriateness of Fenton, INTERGROWTH−21st, and the CNNS in assessing the local newborn population. Therefore, it is necessary to construct and use regional birthweight standards for newborns from northern China.
Data Availability Statement
The original contributions presented in the study are included in the article/Supplementary Material, further inquiries can be directed to the corresponding author.
Author Contributions
YL and QW designed the study. YL and LZ revised the manuscript. QW and H-YZ constructed growth charts and wrote the manuscript. LZ, Y-QX, and JS data collection and organization. N-NG and X-YQ data analyses. YL had primary responsibility for final content. All the authors guided and give many useful suggestion for this research, they both read and approved the final manuscript.
Conflict of Interest
The authors declare that the research was conducted in the absence of any commercial or financial relationships that could be construed as a potential conflict of interest.
Publisher's Note
All claims expressed in this article are solely those of the authors and do not necessarily represent those of their affiliated organizations, or those of the publisher, the editors and the reviewers. Any product that may be evaluated in this article, or claim that may be made by its manufacturer, is not guaranteed or endorsed by the publisher.
Supplementary Material
The Supplementary Material for this article can be found online at: https://www.frontiersin.org/articles/10.3389/fped.2022.810203/full#supplementary-material
References
1. Seaton SE, Yadav KD, Field DJ, Khunti K, Manktelow BN. Birthweight centile charts for South Asian infants born in the UK. Neonatology. (2011) 100:398–403. doi: 10.1159/000325916
2. Romero R, Tarca AL. Fetal size standards to diagnose a small- or a large-for-gestational-age fetus. Am J Obstet Gynecol. (2018) 218:S605–7. doi: 10.1016/j.ajog.2017.12.217
3. Olsen IE, Groveman SA, Lawson ML, Clark RH, Zemel BS. New intrauterine growth curves based on United States data. Pediatrics. (2010) 125:e214–24. doi: 10.1542/peds.2009-0913
4. Callaghan WM, Dietz PM. Differences in birth weight for gestational age distributions according to the measures used to assign gestational age. Am J Epidemiol. (2010) 171:826–36. doi: 10.1093/aje/kwp468
5. Oken E, Kleinman KP, Rich-Edwards J, Gillman MW, A nearly continuous measure of birth weight for gestational age using a United States national reference. BMC Pediatr. (2003) 3:6. doi: 10.1186/1471-2431-3-6
6. Seeds JW, Peng T. Impaired growth and risk of fetal death: is the tenth percentile the appropriate standard? Am J Obstet Gynecol. (1998) 178:658–69. doi: 10.1016/s0002-9378(98)70475-2
7. Cole TJ, Williams AF, Wright CM. Royal college of paediatrics and child health (RCPCH) growth chart expert group. Revised birth centiles for weight, length and head circumference in the UK-WHO growth charts. Ann Hum Biol. (2011) 38:7–11. doi: 10.3109/03014460.2011.544139
8. Cole TJ, Wright CM, Williams AF. RCPCH growth chart expert group. Designing the new UK-WHO growth charts to enhance assessment of growth around birth. Arch Dis Child Fetal Neonatal. (2012) 97:F219–22. doi: 10.1136/adc.2010.205864
9. Uehara R, Miura F, Itabashi K, Fujimura M, Nakamura Y. Distribution of birth weight for gestational age in Japanese infants delivered by cesarean section. J Epidemiol. (2011) 21:217–22. doi: 10.2188/jea.je20100123
10. Nishida H, Sakamoto S, Sakanoue M. New fetal growth curves for Japanese. Acta Paediatr Scand Suppl. (1985) 319:62–7. doi: 10.1111/j.1651-2227.1985.tb10111.x
11. Dobbins TA, Sullivan EA, Roberts CL, Simpson JM. Australian national birthweight percentiles by sex and gestational age, 1998–2007. Med J Aust. (2012) 5:291–4. doi: 10.5694/mja11.11331
12. Kandraju H, Agrawal S, Geetha K, Sujatha L, Subramanian S, Murki S. Gestational age-specific centile charts for anthropometry at birth for South Indian infants. Indian Pediatr. (2012) 49:199–202. doi: 10.1007/s13312-012-0060-2
13. Aryal DR, Gurung R, Misra S, Khanal P, Pradhan A, Gurubacharya SM. Intrauterine growth curves for singleton live babies in Paropakar maternity and Women's hospital in Nepal. J Nepal Health Res Counc. (2012) 10:160–6.
14. Kurto160Health Res Counca S, Khanal P, Pradhan A, Gurubacharya SM., et al. Body weight, length and head circumference at birth in a cohort of Turkish newborns. J Clin Res Pediatr Endocrinol. (2012) 4:132–9. doi: 10.4274/jcrpe.693
15. Yunis KA, Khawaja M, Beydoun H, Nassif Y, Khogali M, Tamim H. National collaborative perinatal neonatal network (NCPNN). Intrauterine growth standards in a developing country: a study of singleton livebirths at 28–42 weeks'eeksuterin. Paediatr Perinat Epidemiol. (2007) 21:387–96. doi: 10.1111/j.1365-3016.2007.00827.x
16. Villar J, Ismail CL, Victora CG, Ohuma EO, Bertino E, Altman DG, et al. International standards for newborn weight, length, and head circumference by gestational age and sex: the newborn cross-sectional study of the INTERGROWTH-21st project. Lancet. (2014) 384:857–68. doi: 10.1016/S0140-6736(14)60932-6
17. Fenton TR, Nasser R, Eliasziw M, Kim JH, Bilan D, Sauve R. Validating the weight gain of preterm infants between the reference growth curve of the fetus and the term infant. BMC Pediatr. (2013) 13:92. doi: 10.1186/1471-2431-13-92
18. Fenton TR, Kim JH, A. systematic review and meta-analysis to revise the Fenton growth chart for preterm infants. BMC Pediatr. (2013) 13:59. doi: 10.1186/1471-2431-13-59
19. Zhang BL. Physical development of newborns of different gestational ages in China. Lin Chuang Er Ke Za Zhi. (1991) 2:72–7.
20. Zhu L, Zhang R, Zhang S, Shi W, Yan W, Wang X, et al. Chinese neonatal birth weight curve for different gestational age. Zhonghua Er Ke Za Zhi. (2015) 53:97–103. doi: 10.3760/cma.j.issn.0578-1310.2015.02.007
21. Liu Z, Zhang J, Zhao B, Xue X, Xu L, Wang F, et al. Population-based reference for birth weight for gestational age in northern China. Early Hum Dev. (2014) 90:177–87. doi: 10.1016/j.earlhumdev.2014.01.007
22. Zhao X, Xia Y, Zhang H, Baker PN, Norris T. Birth weight charts for a Chinese population: an observational study of routine newborn weight data from Chongqing. BMC Pediatr. (2019) 19:426. doi: 10.1186/s12887-019-1816-9
23. Grantz KL, Hediger ML, Liu D, Buck Louis GM. Fetal growth standards: the NICHD fetal growth study approach in context with INTERGROWTH-21st and the world health organization multicentre growth reference study. Am J Obstet Gynecol. (2018) 218:S641–55.e28. doi: 10.1016/j.ajog.2017.11.593
24. Hyder A, Lee HJ, Ebisu K, Koutrakis P, Belanger K. Bell ML. PM25 exposure and birth outcomes: use of satellite- and monitor-based data. Epidemiology. (2014) 25:58–67. doi: 10.1097/EDE.0000000000000027
25. Arroyo V, Díaz J, Salvador P, Linares C. Impact of air pollution on low birth weight in Spain: an approach to a national level study. Environ Res. (2019) 171:69–79. doi: 10.1016/j.envres.2019.01.030
26. Rohatgi KW, Tinius RA, Cade WT, Steele EM, Cahill AG, Parra DC. Relationships between consumption of ultra-processed foods, gestational weight gain, and neonatal outcomes in a sample of US pregnant women. PeerJ. (2017) 5:e4091. doi: 10.7717/peerj.4091
27. Yuan X, Hu H, Zhang M, Long W, Liu J, Jiang J, et al. Iron deficiency in late pregnancy and its associations with birth outcomes in Chinese pregnant women: a retrospective cohort study. Nutr Metab. (2019) 16:30. doi: 10.1186/s12986-019-0360-9
28. Chen B, Carrion P, Grewal R, Inglis A, Hippman C, Morris E. Short inter-pregnancy intervals, maternal folate levels, and infants born small for gestational age: a preliminary study in a Canadian supplement-using population. Appl Physiol Nutr Metab. (2017) 42:1092–6. doi: 10.1139/apnm
29. Rigby RA, Stasinopoulos DM. Generalized additive models for location, scale and shape. J R Stat Soc Ser C Appl Stat. (2005) 54:507–44. doi: 10.1111/j.1467-9876.2005.00510.x
30. Yu CH. Exploratory data analysis[J]. Methods. (1977) 2:131–60. doi: 10.1007/978-3-319-43742-2_15
31. Stasinopoulos DM, Rigby RA, Heller GZ, Voudouris V, Bastiani FD. VI applications In: Chambers JM, Hothorn T, Lang DT, Wickham H, editors. Flexible Regression and Smoothing Using GAMLSS in R: Boca Raton, FL: CRC Press (2017). p. 447–96.
33. Schwarz GE. Estimating the dimension of a model. Ann Stat. (1978) 6:461–4. doi: 10.1214/aos/1176344136
34. van Buuren S, Fredriks M. Worm plot: a simple diagnostic device for modelling growth reference curves. Stat Med. (2001) 20:1259–77. doi: 10.1002/sim.746
35. Pan H, Cole TJ, A. comparison of goodness of fit tests for age-related reference ranges. Stat Med. (2004) 23:1749–65. doi: 10.1002/sim.1692
36. Kong X, Xu F, Wu R, Wu H, Ju R, Zhao X, et al. Neonatal mortality and morbidity among infants between 24 and 31 complete weeks: a multicenter survey in China from 2013 to 2014. BMC Pediatr. (2016) 16:174. doi: 10.1186/s12887-016-0716-5
37. Sweet DG, Carnielli V, Greisen G, Hallman M, Ozek E, Plavka R, et al. European consensus guidelines on the management of respiratory distress syndrome - 2016 update. Neonatology. (2017) 111: 107–25. doi: 10.1159/000448985
38. Araújo de França GV, De Lucia Rolfe E, Horta BL, Gigante DP, Yudkin JS, Ong KK, et al. Associations of birthweight, linear growth and relative weight gain throughout life with abdominal fat depots in adulthood: the 1982 Pelotas (Brazil) birth cohort study. Int J Obes. (2016) 40:14–21. doi: 10.1038/ijo.2015.192
39. Kalra SK, Ratcliffe SJ, Coutifaris C, Molinaro T, Barnhart KT. Ovarian stimulation and low birthweight in newborns conceived through in vitro fertilization. Obstet Gynecol. (2011) 118:863–71. doi: 10.1097/AOG.0b013e31822be65f
40. Kenny LC, Lavender T, McNamee R, O'Neill SM, Mills T, Khashan AS. Advanced maternal age and adverse pregnancy outcome: evidence from a large contemporary cohort. PLoS ONE. (2013) 8:e56583. doi: 10.1371/journal.pone.0056583
41. Laopaiboon M, Lumbiganon P, Intarut N, Mori R, Ganchimeg T, Vogel JP. Advanced maternal age and pregnancy outcomes: a multi country assessment. BJOG. (2014) 121:49–56. doi: 10.1111/1471-0528.12659
42. Zhang L, Li Y, Liang S, Liu XJ, Kang FL Li GM. Postnatal length and weight growth velocities according to Fenton reference and their associated perinatal factors in healthy late preterm infants during birth to term-corrected age: an observational study. Ital J Pediatr. (2019) 5:1. doi: 10.1186/s13052-018-0596-4
43. Bonellie S, Chalmers J, Gray R, Greer I, Jarvis S, Williams C. Centile charts for birthweight for gestational age for Scottish singleton births. BMC Pregnancy Childbirth. (2008) 8:5. doi: 10.1186/1471-2393-8-5
44. Cole TJ, Green PJ. Smoothing reference centile curves: the LMS method and penalized likelihood. Stat Med. (1992) 11:1305–305:doi: 10.1002/sim.4780111005
45. Neuhauser HK, Thamm M, Ellert U, Hense HW, Rosario AS. Blood pressure percentiles by age and height from non-overweight children and adolescents in Germany. Pediatrics. (2011) 127:e978–8. doi: 10.1542/peds.2010-1290
46. Yao F, Miao H, Li B, Wu Y, Zhao Q. New birthweight percentiles by sex and gestational age in Southern China and its comparison with the INTERGROWTH-21st standard. Sci Rep. (2018) 8:7567. doi: 10.1038/s41598-018-25744-7
47. Li H, Ji CY, Zong XN, Zhang YQ. Height and weight standardized growth charts for Chinese children and adolescents aged 0 to 18 years. Zhonghua Er Ke Za Zhi. (2009) 47:487–92. doi: 10.3760/cma.j.issn.0578-1310.2009.07.003
48. Cundy T, Holt RI. Gestational diabetes: paradigm lost?. Diabet Med. (2017) 34:8–13. doi: 10.1111/dme.13200
49. Ludwig DS, Currie J. The association between pregnancy weight gain and birthweight: a within-family comparison. Lancet. (2010) 376:984–90. doi: 10.1016/S0140-6736(10)60751-9
50. Dai RX, He XJ, Hu CL. Maternal pre-pregnancy obesity and the risk of macrosomia: a meta-analysis. Arch Gynecol Obstet. (2018) 297:139–45. doi: 10.1007/s00404-017-4573-8
Keywords: child public health, growth chart, birthweight, early growth, gestational age
Citation: Wu Q, Zhang H-Y, Zhang L, Xu Y-Q, Sun J, Gao N-N, Qiao X-Y and Li Y (2022) A New Birthweight Reference by Gestational Age: A Population Study Based on the Generalized Additive Model for Location, Scale, and Shape Method. Front. Pediatr. 10:810203. doi: 10.3389/fped.2022.810203
Received: 06 November 2021; Accepted: 19 January 2022;
Published: 21 March 2022.
Edited by:
Bhaskar Thakur, University of Texas Southwestern Medical Center, United StatesReviewed by:
Ram Bajpai, Keele University, United KingdomGyan Chandra Kashyap, IIHMR University, India
Copyright © 2022 Wu, Zhang, Zhang, Xu, Sun, Gao, Qiao and Li. This is an open-access article distributed under the terms of the Creative Commons Attribution License (CC BY). The use, distribution or reproduction in other forums is permitted, provided the original author(s) and the copyright owner(s) are credited and that the original publication in this journal is cited, in accordance with accepted academic practice. No use, distribution or reproduction is permitted which does not comply with these terms.
*Correspondence: Yan Li, bGl5YW54akBzaW5hLmNvbQ==
†These authors have contributed equally to this work and share first authorship