 Michael A. Pienaar
 Joseph B. Sempa
 Nicolaas Luwes
 Elizabeth C. George4
- 1Paediatric Critical Care Unit, Department of Paediatrics and Child Health, University of the Free State, Bloemfontein, South Africa
- 2Department of Biostatistics, Faculty of Health Sciences, University of the Free State, Bloemfontein, South Africa
- 3Department of Electrical, Electronic and Computer Engineering, Faculty of Engineering, Built Environment and Information Technology, Central University of Technology, Bloemfontein, South Africa
- 4Medical Research Council Clinical Trials Unit, University College London, London, United Kingdom
- 5Paediatric Cardiology Unit, Department of Paediatrics and Child Health, University of the Free State, Bloemfontein, South Africa
Objectives: Failures in identification, resuscitation and appropriate referral have been identified as significant contributors to avoidable severity of illness and mortality in South African children. In this study, artificial neural network models were developed to predict a composite outcome of death before discharge from hospital or admission to the PICU. These models were compared to logistic regression and XGBoost models developed on the same data in cross-validation.
Design: Prospective, analytical cohort study.
Setting: A single centre tertiary hospital in South Africa providing acute paediatric services.
Patients: Children, under the age of 13 years presenting to the Paediatric Referral Area for acute consultations.
Outcomes: Predictive models for a composite outcome of death before discharge from hospital or admission to the PICU.
Interventions: None.
Measurements and main results: 765 patients were included in the data set with 116 instances (15.2%) of the study outcome. Models were developed on three sets of features. Two derived from sequential floating feature selection (one inclusive, one parsimonious) and one from the Akaike information criterion to yield 9 models. All developed models demonstrated good discrimination on cross-validation with mean ROC AUCs greater than 0.8 and mean PRC AUCs greater than 0.53. ANN1, developed on the inclusive feature-et demonstrated the best discrimination with a ROC AUC of 0.84 and a PRC AUC of 0.64 Model calibration was variable, with most models demonstrating weak calibration. Decision curve analysis demonstrated that all models were superior to baseline strategies, with ANN1 demonstrating the highest net benefit.
Conclusions: All models demonstrated satisfactory performance, with the best performing model in cross-validation being an ANN model. Given the good performance of less complex models, however, these models should also be considered, given their advantage in ease of implementation in practice. An internal validation study is now being conducted to further assess performance with a view to external validation.
Introduction
The reduction of avoidable childhood mortality and morbidity is a key healthcare priority worldwide. Steps to address failures in acute care and critical care processes are an important aspect of strategies for improving care for critically ill or injured children (1). One such failure is within triage and identification systems needed to detect children in need of life-saving care (2). In South Africa, Hodkinson et al. found that patients with critical illness follow complex pathways to appropriate care and that failures in identification, accurate assessment of the severity of illness, early resuscitation, and timely referral to higher levels of care were responsible for significant avoidable severity of illness and mortality (3). This serves as the rationale for conducting research in this area and developing clinically implementable tools for the identification of critically ill children that are appropriate to the South African setting.
Triage scores are directed at sorting patients into categories of urgency based on a combination of clinical characteristics (history and clinical discriminators) and physiological variables (4, 5). The purpose of these systems is to optimise patient waiting times and ensure patients receive appropriate and timeous treatment. Several triage systems have been implemented in South Africa, although, in some regions, no formal triage is applied (6). These include the South African Triage Scale (SATS), Early Triage Assessment and Treatment (ETAT) program and the Integrated Management of Childhood Illness (IMCI) program (5–9). These systems are implemented by a variety of healthcare workers, but nurse-based triage is frequently the arrangement in South Africa (5). Despite the presence of triage systems in South Africa, the findings of Hodkinson et al., illustrate that the identification of patients requiring referral to centralised services remains a key contributor to avoidable death and severity of illness (3).
The role of applied machine learning in medicine and, more specifically in paediatrics and child health has, as Lonsdale and Rajkomar point out, not been fully explored in the literature (10, 11). Machine learning offers a wide range of possible use-cases in the clinical setting, including diagnosis, prognosis, workflow and improving patient access to services (11).
The use of machine learning in triage and mortality prediction has been described in high-income countries. Goto et al. and Hwang and Lee have described the use of machine learning to predict paediatric intensive care unit (PICU) admission and hospitalisation in the Emergency Department setting and critical illness respectively (12, 13). Aczon et al. and Kim et al. have described models for the prediction of mortality in PICU. Notably, these models represent significant progress compared to existing models in their ability to make dynamic or continuous assessments of mortality risk over time (14, 15). Our unit has recently published the development of an artificial neural network(ANN) model for PICU mortality risk prediction with comparable performance to a range of logistic regression models (16). With this rationale, the development of an ANN model designed to identify children at risk of severe illness requiring urgent intervention or escalation of care to a PICU was undertaken. Several distinctions exist between this study and our prior work. Our PICU mortality risk prediction model was designed to evaluate quality of care against model predictions of mortality, whereas the models developed in this study are intended to improve identification of children with or at risk of critical illness at the time of presentation. The models developed in this study are intended to augment the ability of clinicians with limited experience and expertise in paediatric critical illness in resource constrained settings. As such, the variables selected for use in these models were identified using a dedicated domain knowledge elicitation process including a Delphi procedure and systematic literature search (17). The variables identified were selected on the grounds that they represented a compromise between comprehensiveness and ease of use and specifically excluded radiological and laboratory variables except point of care glucose testing. This contrasts with the variables included in PICU mortality prediction models, where more extensive and advanced data is typically available or acquired at the time of admission to PICU.
ANNs are computational structures that broadly simulate the learning process and organisation of biological neurons (18). The network architecture is made up of interconnected input, hidden and output layers. The strength or intensity of each connection is represented by a numerical value, the weight, and each neuron has a threshold term for activation. Outputs of neurons are determined by a mathematical function, the activation function that takes in the inputs to input neurons, weights of connections and threshold terms of each neuron (19). Learning is achieved when weights are adjusted through stochastic gradient descent (20).
This model was compared to a logistic regression (LR) model and XGBoost model developed on the same data. The primary objective was to develop an artificial neural network(ANN) model for the prediction of this outcome.
Methods and study design
The development pipeline used in this study is summarized in Figure 1.
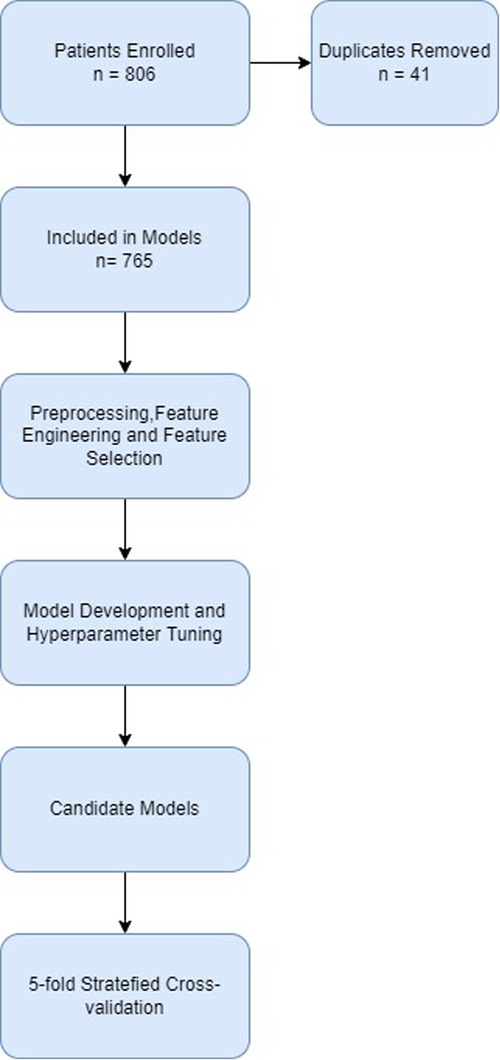
Figure 1. Consort diagram of development pipeline.
Ethical clearance
Internal review board approval was obtained from the Health Sciences Research Ethics Committee (UFS-HSD2020/2204/2505-0003) and the Free State Department of Health (FS_202102_019). Informed consent was obtained in writing from the legal guardians of children participating in the study. Assent was obtained from children capable of doing so. All data were stored on a secure server and were fully anonymised before exporting as a CSV file for analysis.
Study site
This study was conducted at Pelonomi Regional Hospital, a regional referral hospital in Mangaung in the Free State, South Africa. Data was collected in the Paediatric Referral Area. This area receives acute referrals for specialised paediatric consultations for the Southern Free State region and all patients hospitalised by the Paediatrics and Child Health service are first assessed in this area. Patients are referred from primary healthcare centres and district hospitals as well as accepting referrals from the Emergency Department. The Paediatrics and Child Health service is supported by a five-bedded PICU within Pelonomi Hospital that provides life-supporting therapies, including mechanical ventilation, cardiovascular support (excluding extracorporeal life support) and renal replacement therapy together with a full suite of invasive and non-invasive monitoring.
Study population and sampling
Data collection was conducted from April 2021 to January 2022. The inclusion criteria were as follows:
1. Children under the age of 13 years
2. Unscheduled consultations
3. Duration of illness or injury less than 7 days (including acute exacerbations of underlying chronic illness)
Children presenting dead on arrival and admitted directly referred to the PICU were excluded as the model outcome was already present. Children presenting for scheduled clinic visits and elective procedures were also excluded from the study.
The minimum required size of the sample was estimated by considering the total number of records required as well as the number of events of the study outcome in relation to the number of features that can be included in the model without overfitting. The minimum sample size was determined by the rule of thumb of 500 and n = 100 + 50i. n refers to sample size and i to the number of features included in each model (21). The minimum number of events required per feature was set at 10 (22). For a model with ten features, a development sample of at least 600 samples was required with 100 events.
Data collection
The process of determining which features (predictors or independent variables) were to be collected was determined by a domain knowledge elicitation process and described previously (17). The included features are presented in Supplementary Table S1.
Data collection was conducted prospectively at the bedside by the primary physician of each patient during initial assessment. Data collection made use of a REDCap® survey completed by the treating physician on their smartphone. Enrolled patients were monitored by the principal researcher until discharge from hospital or death and the outcome was entered into the research record.
Data preprocessing
Data preprocessing was conducted before model development, training and testing. The first step was the removal of duplicate entries, followed by manual deletion of impossible values, e.g., systolic blood pressures lower than diastolic blood pressure. Anthropometric values, pulse rate, respiratory rate, systolic blood pressure and mean blood pressure (calculated from systolic and diastolic blood pressure) were normalised to available age-related norms as Z-scores and standard deviations and then converted to their absolute(positive) values (23–26). Further preprocessing was conducted within cross-validation to prevent information leakage from the test folds into training folds. Missing values were imputed by multiple imputation through chained equations (MICE) (27).
Feature selection
Features were selected for inclusion in model training by sequential forward floating feature selection, using an ANN model as estimator (28) and Akaike Information Criterion (AIC) (29). Selected features are presented in Table 1. Features were considered by the researcher in terms of ambiguity and clinical relevance as well as the degree of correlation with the study outcome evaluated by correlation matrix visualisation. For this reason, the HIV status variable was removed from the set initially selected by sequential feature selection.
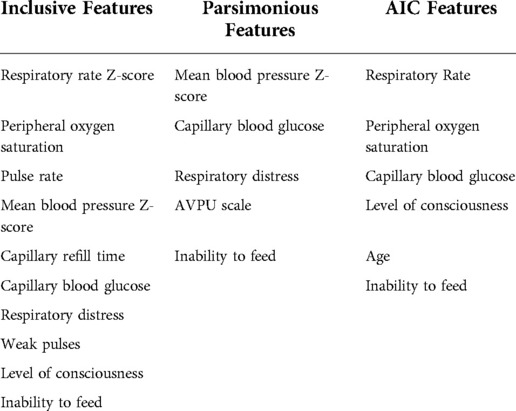
Table 1. Lists of features selected for inclusion in candidate models.
Feature engineering
Features were further optimised for model training. Some features represent clinical abnormalities above and below their normal values or in positive and negative ranges. Respiratory rate and mean blood pressure Z-scores were converted to their absolute (positive) values. Capillary blood glucose was separated into hyper- and hypoglycaemia features as continuous values greater than a threshold of abnormality. For level of consciousness and AVPU scale, because of the small number of records in some categories, the feature was reduced to a binary feature. Features were then scaled by standard scaling. Engineered features are presented in Table 2.
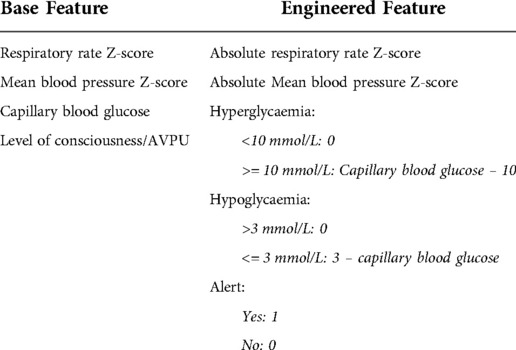
Table 2. Feature engineering.
Class imbalance
In the presence of imbalanced data sets, models will tend to be biased towards the majority class (30–33). For the neural network models, class imbalance was addressed by employing focal loss as the loss parameter for training, whereby a focusing parameter(γ) reduces the loss from easy examples and a weighting factor(α) for each class (33). For the comparator models, sample weighting was employed to address class imbalance. These parameters were tuned during hyperparameter tuning.
Model development
Model development was conducted within 5-fold stratified cross-validation. For each of the three feature-sets, an ANN model, LR model and XGBoost model were developed. This resulted in a total of 9 candidate models. The models were developed in Python 3 on the Jupyter Notebooks environment (34). The following libraries were used during the process: Pandas, Numpy, SciKit Learn, Mlxtend, Tensorflow, XGBoost, Statsmodels and Matplotlib (28, 35–41). An ANN, LR and XGBoost model was developed on each feature-set for comparison. Hyperparameters of the machine learning models were tuned by iteratively and by randomized grid search. Models were trained in five-fold stratified cross validation with a resultant 80:20 train-test split on each fold. Models were all trained with the same train-test splits.
Model performance measurement
Model performance was assessed as mean performance in cross-validation. Discrimination was assessed in terms of the receiver operating characteristic (ROC) curve and the area under the curve (AUC) together with the precision-recall curve (PRC) with its AUC. Where the ROC curve relates recall or sensitivity to the false positive rate (1 − specificity), PRC relates precision (also called positive predictive value [True Positives/(True Positives + False Positives)] and recall [True Positives/(True Positives + False Negatives)] and provides a model-wide evaluation of performance. The AUC of the ROC and PRC allow comparisons between models. As opposed to the ROC AUC, where the baseline value for random classifiers is 0.5, the value for random classifiers in the case of the PRC AUC is not fixed, but rather corresponds to the proportion of positive class [Positive/(Positive + Negative)]. The PRC AUC of a perfect classifier is 1.0 (32). AUC 95% confidence intervals were calculated by a non-parametric bootstrap procedure for both PRC and ROC (42). Calibration was assessed by the means of the expected calibration error(ECE) for each model (43) together with the calibration hierarchy published by Van Calster et al. (44) – flexible calibration curves were plotted and inspected, and the slope and intercept of these curves were calculated.
The likely clinical utility of models was compared using decision curve analysis. Decision curve analysis was first described by Vickers and Elkin in 2006 (45). Decision curve analysis evaluates the “net benefit” of a predictive model or diagnostic test over a range of threshold probabilities and compares it to baseline strategies of responding in all cases or none. Net benefit is calculated as:
where w is the odds at the threshold probability (46).
Results
Data set
After duplicated records were removed, 765 records remained. 116 (15.2%) patients had the study outcome of death before discharge from hospital or admission to the PICU. The descriptive analysis of the collected data, together with the frequency of missing data is presented in Table 3. Continuous features are represented as means with standard deviations (SD) and categorical features are presented as frequencies and percentages.
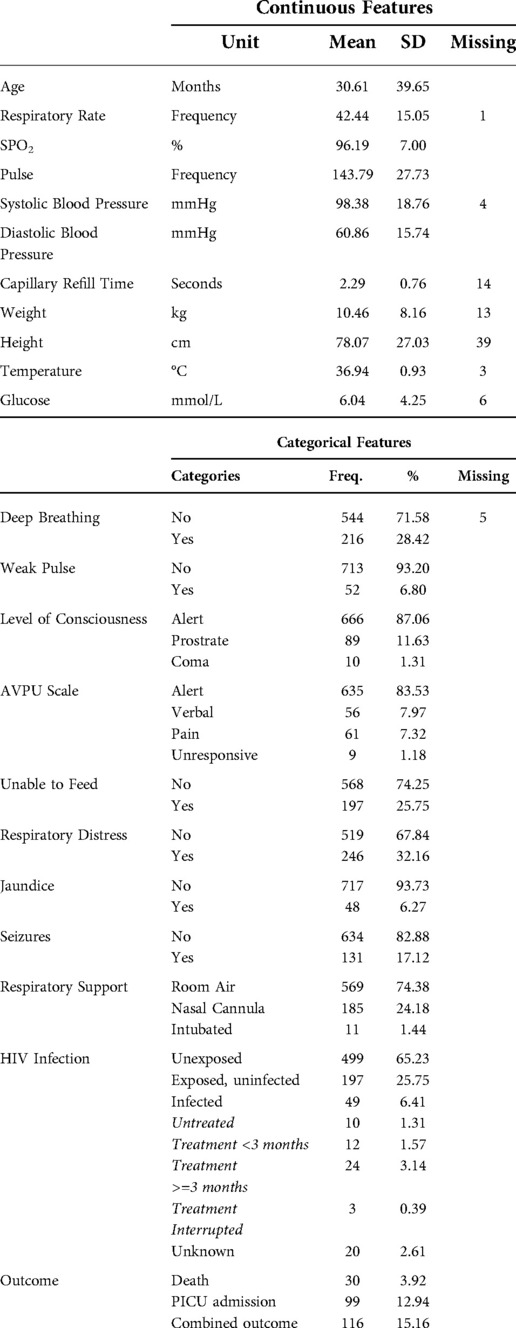
Table 3. Descriptive analysis of data Set.
Models
The optimised ANN architectures for each of the candidate neural networks are presented in Figure 2. All three models were simple feed-forward perceptrons with a single hidden layer. Batch normalisation was not used, in keeping with the observation that it negatively influences model calibration (47), and training epochs were set at 15 for all models. The tuned hyperparameters for the machine learning models are presented in Table 4.
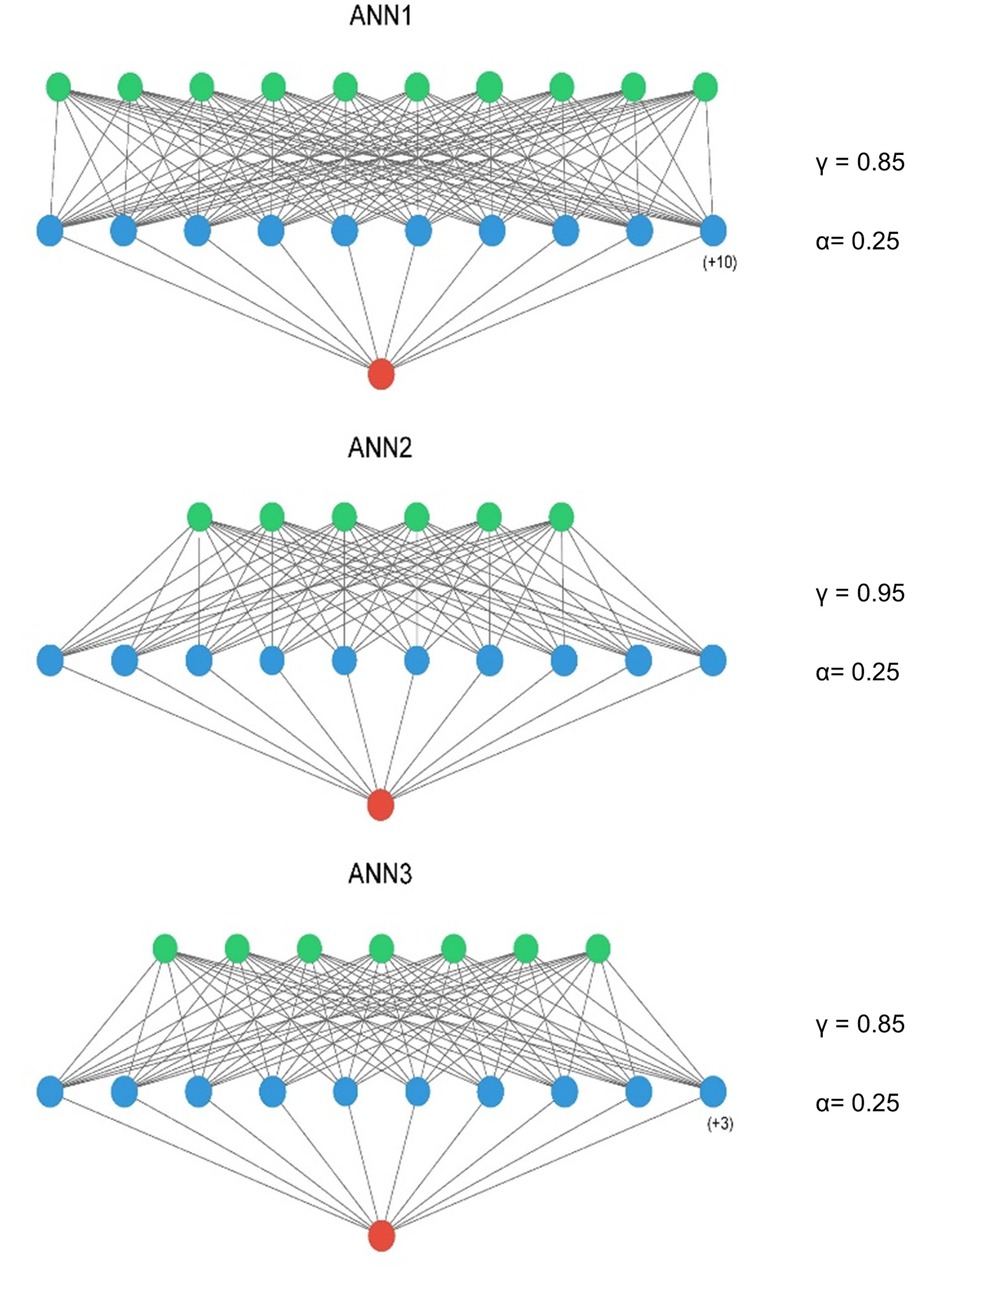
Figure 2. ANN model architectures – input layer = green, hidden layer = blue, output layer = red. A ReLu activation was used in the input and hidden layers and a sigmoid activation function in the output layer. ANN1 – Inclusive Model. ANN2 – Parsimonious Model, ANN3 – AIC Model. Figure compiled using ann_visualizer (51).
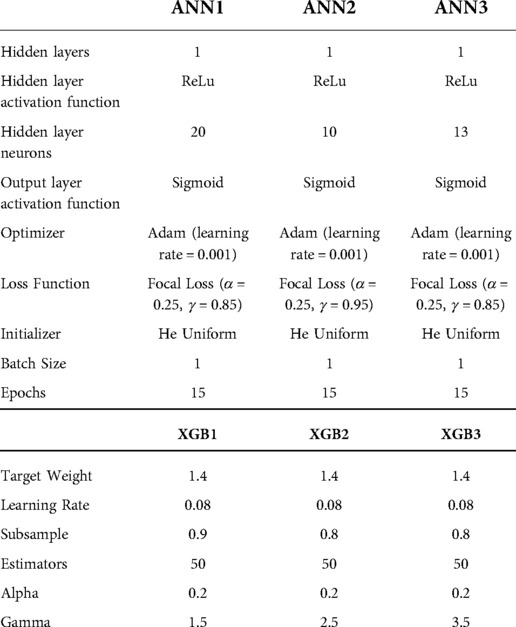
Table 4. Tuned hyperparameters.
The logistic regression models for each feature-set are presented in Table 5.
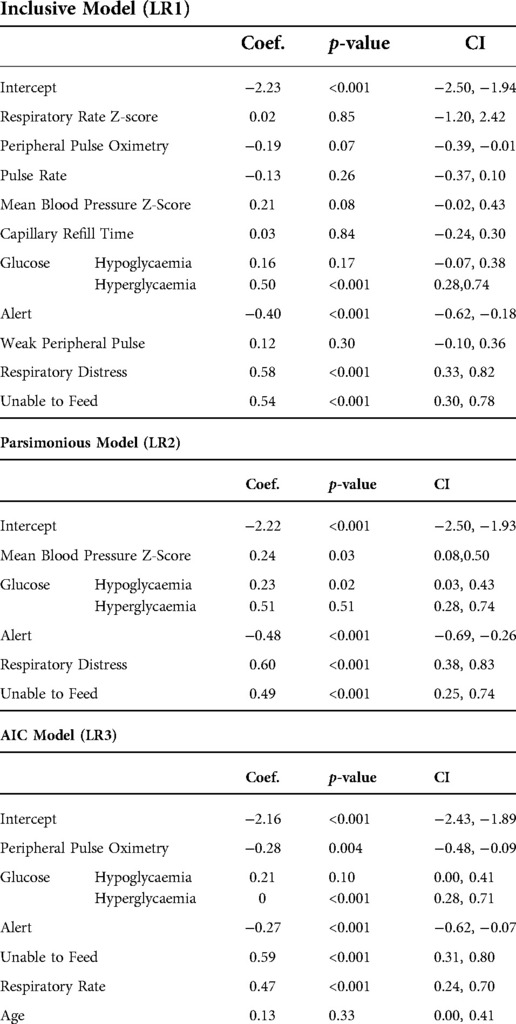
Table 5. Logistic regression models.
Main results
The ROC and PRC of the best performing models for each method are presented in Figure 3. The best performing model was ANN1, derived from the inclusive data set, with the highest ROC AUC and PRC AUC. All models had ROC AUCs of at least 0.8, indicating excellent discrimination (48). All models had PRC AUCs above 0.53, above the threshold for a random classifier (0.15). The curves for all models are presented in Supplementary Figure S1.
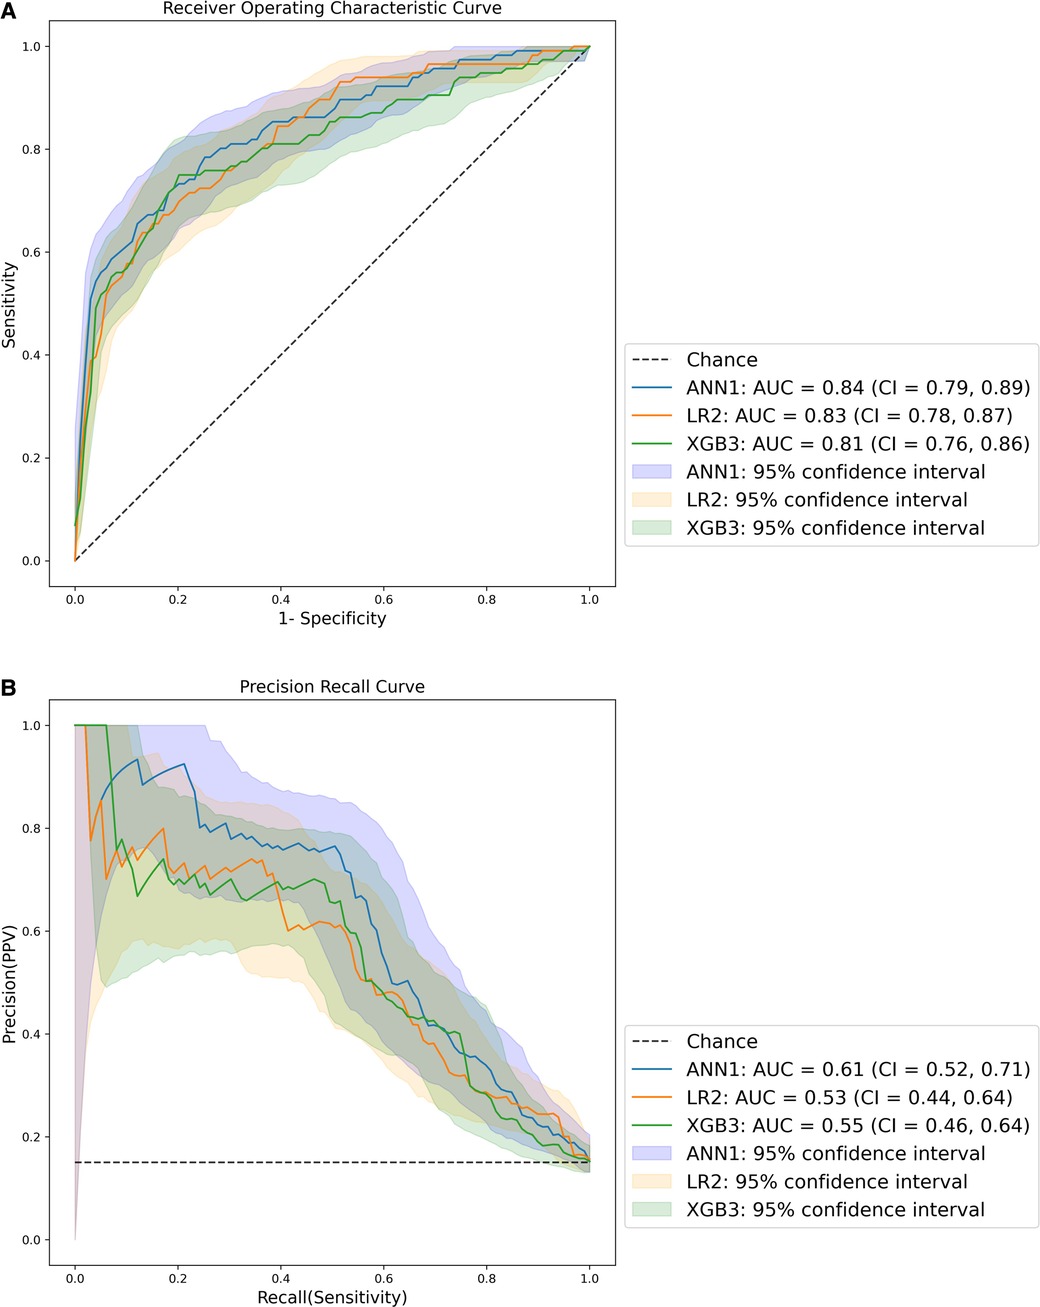
Figure 3. ROC (A) and PR (B) curves – AUC = area under the curve, CI = 95% confidence interval.
Calibration was variable across the models. Model-wide calibration was similar as assessed by ECE (see Table 6). Most models were weakly calibrated with calibration slopes close to 1 and intercepts close to 0. Inspection of the flexible calibration curves, however, suggests that models were generally not close to the perfect calibration line (Figure 4).
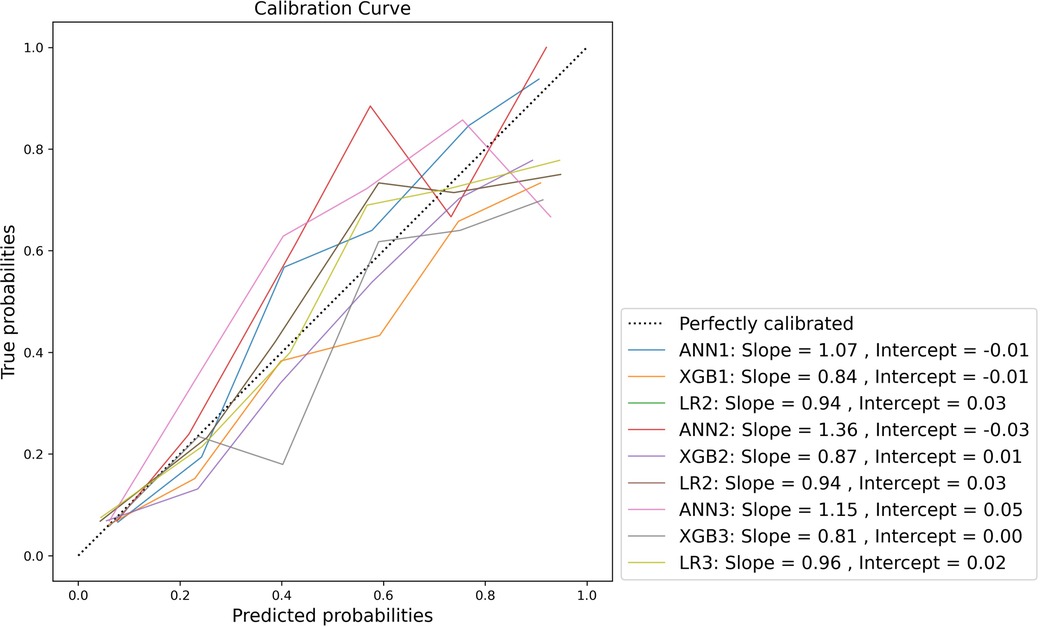
Figure 4. Normalised flexible calibration curve.
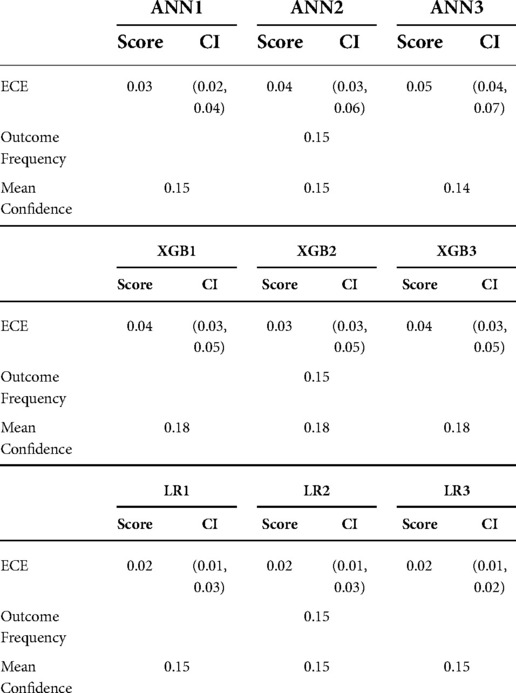
Table 6. Expected calibration error(ECE) and mean confidences.
The decision curve analysis is presented in Figure 5. The net benefit of all models was significantly better than a strategy of intervening in all or no patients, but overall the decision curve analysis favoured ANN1 with a more optimal curve.
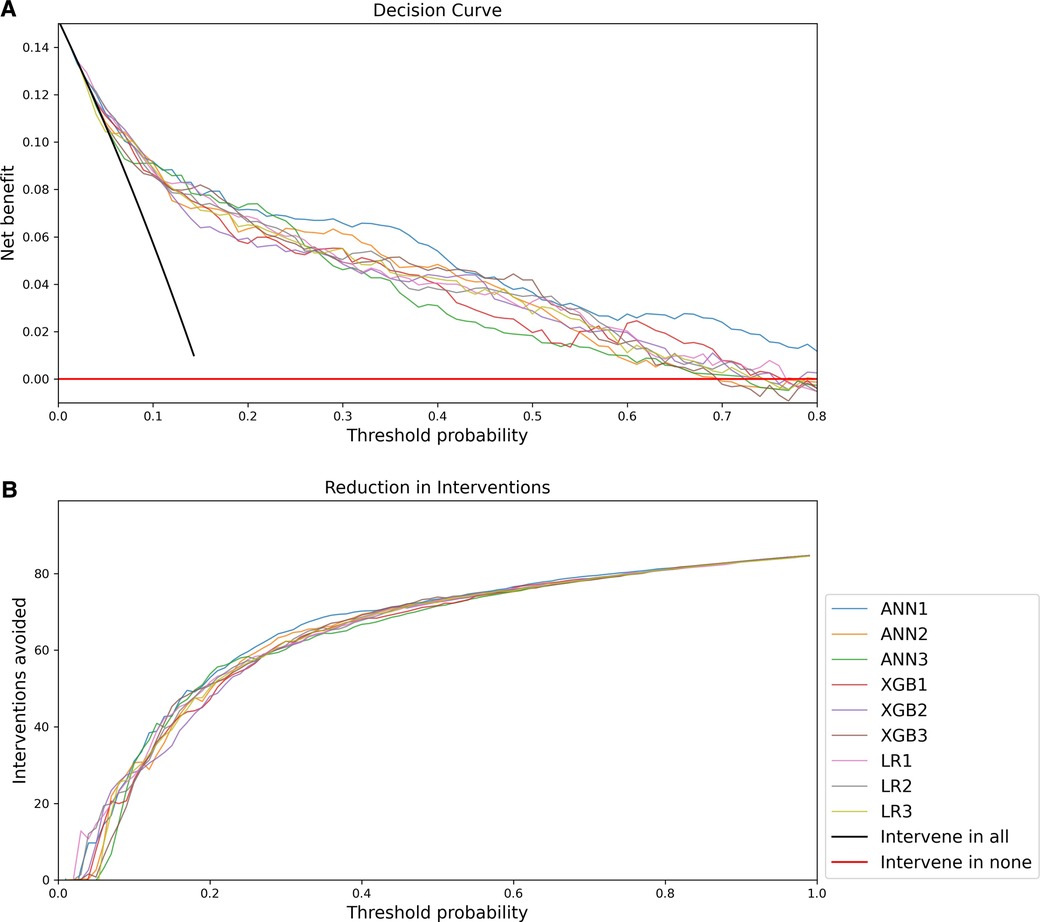
Figure 5. Decision Curve Analysis: (A) Net benefit compared to threshold probability; (B) Interventions avoided compared to threshold probability.
Discussion
This study aimed to develop an artificial neural network model for the prediction of paediatric critical illness (represented by a composite outcome of death before hospital discharge or admission to the PICU) to address avoidable severity of illness and mortality in South African children with a critical illness. In practice, such a model could trigger a range of responses, such as increasing urgency of healthcare worker response, heightened vigilance, further triage and resuscitation, early involvement of senior personnel in case management, or early decision making in the disposition of patients to higher levels of care or centralised hospitals. This engages directly with the challenges identified by Hodkinson et al. in the South African setting (3). The possible integration of such a predictive model within a mobile health (mHealth) platform also offers the potential to create real-time links between the point of care and advanced clinical and digital infrastructure in centralised facilities using simple devices in more resource-constrained settings such as primary healthcare (49).
Methodologically, the development process differed from other applied machine learning studies in this area, such as Aczon et al. (14), Kim et al. (15) and Goto et al. (12), in that these models made use of existing electronic data sets. The lack of such existing data necessitated a dedicated prospective data collection in this study. While the need for a prospective data collection process increased the labour-intensiveness of the study and demand for resources, it also provided an opportunity to integrate clinical domain knowledge within a novel process of documented literature search and Delphi procedure, which allowed tailoring of the data collection process to the specific clinical setting and an explicit description of this process (17). Applications for machine learning research of this nature, invite close interdisciplinary collaboration that allows the integration of machine learning knowledge with clinical domain knowledge, not only of biomedicine but also of clinical context in a fashion that enhances the relevance and applicability of these new methods. The documentation of these processes can be seen to be an important aspect of rigour when publishing reports of such models and demands the investigation of this agenda (50).
All developed models demonstrated satisfactory discrimination. Calibration was variable, with most models demonstrating weak calibration. Given the relative similarity of performance of candidate models, there is likely a significant practical advantage in implementing a parsimonious model in the clinical setting as this would simplify its application, with relatively little loss of clinical benefit.
Decision curve analysis favours the ANN1 over other models. Decision curve analysis also allows incorporation of clinical priorities into the consideration of model performance. In this application, a response such as triggering urgent assessment and resuscitation, involving senior clinical personnel, referral to a higher level of care, or notification and consultation of centralised PICU and emergency medicine services may be directed by such a model. The practical implications and costs of such responses must be weighed against the costs of failing to identify critically ill children timeously. Decision curve analysis in this case suggests that increasing the threshold probability above 0.4 brings about diminished gains in terms of avoided interventions. Given the dire consequences of failure to identify critically ill children and the possible increased costs of healthcare associated with avoidable severity of illness, it may be pragmatic to consider a lower threshold probability for activating such responses.
Given the favourable findings of model performance in cross-validation, an internal validation study is now being undertaken with a view to external validation thereafter. Paediatric research of this nature is novel in the South African setting, with one similar publication from this centre to date (16). This study furthers the research agenda for machine learning research and applied machine learning in South African healthcare.
Conclusion
All 9 models demonstrated satisfactory discrimination and weak calibration in cross-validation. Overall assessment, including decision curve analysis, however, favours the ANN1 over other models. Decision curve analysis provides useful insights into how such a model may be implemented at different probability thresholds considering clinical preference and judgement. While ANN1 demonstrated the best performance in this data, other data sets using fewer features also provided adequate performance. This has important practical implications for implementation in clinical settings.
There is still a significant need to investigate machine learning research and clinical application in South Africa and other similar settings. In this study, a documented domain knowledge elicitation process has been combined with machine learning methods to develop models directed at identifying critically ill children. Model performance will be further evaluated in internal and external validation studies.
Data availability statement
The original contributions presented in the study are included in the article/Supplementary Material, further inquiries can be directed to the corresponding author/s.
Ethics statement
The studies involving human participants were reviewed and approved by Health Sciences Research Ethics Committee University of the Free State. Written informed consent to participate in this study was provided by the participants’ legal guardian/next of kin.
Author contributions
MAP was the primary investigator, designed and conceptualised the research, developed and tested the machine learning models and compiled the submitted manuscript. JBS provided biostatistical oversight and analysis. ECG provided inputs in study design and execution of the study, statistical analysis and assisted with the compilation of the manuscript. NL provided inputs in study design and execution of the study, machine learning models and assisted with the compilation of the manuscript. SCB provided inputs in study design and execution of the study, and assisted with the compilation of the manuscript. All authors contributed to the article and approved the submitted version.
Funding
Dr Pienaar receives funding from the National Research Foundation of South Africa under the Thuthuka facility which funded the research study. Funding for Dr George is provided by the Medical Research Council, UK through support to the MRC CTU at UCL (MC_UU_00004/05).
Acknowledgments
The authors would like to acknowledge the National Research Foundation of South Africa, which provided funding on the Thuthuka Facility. The authors would also like to acknowledge the University of the Free State for assistance with open access publication fee. Finally, the authors acknowledge the Free State Department of Health and Pelonomi Tertiary Hospital who accommodated the conduct of this clinical research in their facility.
Conflict of interest
The authors declare that the research was conducted in the absence of any commercial or financial relationships that could be construed as a potential conflict of interest.
Publisher's note
All claims expressed in this article are solely those of the authors and do not necessarily represent those of their affiliated organizations, or those of the publisher, the editors and the reviewers. Any product that may be evaluated in this article, or claim that may be made by its manufacturer, is not guaranteed or endorsed by the publisher.
Supplementary material
The Supplementary Material for this article can be found online at: https://www.frontiersin.org/articles/10.3389/fped.2022.1008840/full#supplementary-material.
References
1. Turner EL, Nielsen KR, Jamal SM, von Saint André-von Arnim A, Musa NL. A review of pediatric critical care in resource-limited settings: a look at past, present, and future directions. Front Pediatr. (2016) 4(FEB):1–1. doi: 10.3389/fped.2016.00005
2. Nolan T, Angos P, Cunha AJ, Muhe L, Qazi S, Simoes EA, et al. Quality of hospital care for seriously ill children in less-developed countries. Lancet. (2001) 357(9250):106–10. doi: 10.1016/S0140-6736(00)03542-X
3. Hodkinson P, Argent A, Wallis L, Reid S, Perera R, Harrison S, et al. Pathways to care for critically ill or injured children: a cohort study from first presentation to healthcare services through to admission to intensive care or death. PLoS One. (2016) 11(1):1–17. doi: 10.1371/journal.pone.0145473
4. Patel M, Maconochie I. Triage in children. Trauma. (2008) 10(4):239–45. doi: 10.1177/1460408608096795
5. South African Triage Group. The South African Triage Scale Training Manual 2012. South African Triage Scale Training Manual 2012. (2012);1–34 p.
6. Cheema B, Stephen C, Westwood A. Paediatric triage in South Africa. SAJCH South African Journal of Child Health. (2013) 7(2):43–5. doi: 10.7196/sajch.585
7. Buys H, Muloiwa R, Westwood C, Richardson D, Cheema B, Westwood A. An adapted triage tool (ETAT) at red cross war memorial children’s hospital medical emergency unit, Cape Town: an evaluation. S Afr Med J. (2013) 103(3):161–5. doi: 10.7196/SAMJ.6020
8. Twomey M, Cheema B, Buys H, Cohen K, de Sa A, Louw P, et al. Vital signs for children at triage: a multicentre validation of the revised South African triage scale (SATS) for children. S Afr Med J. (2013) 103(5):304–8. doi: 10.7196/SAMJ.6877
9. Gove S, Tamburlini G, Molyneux E, Whitesell P, Campbell H. Development and technical basis of simplified guidelines for emergency triage assessment and treatment in developing countries. Arch Dis Child. (1999) 81(6):473–7. doi: 10.1136/adc.81.6.473
10. Lonsdale H, Jalali A, Ahumada L, Matava C. Machine learning and artificial intelligence in pediatric research: current state, future prospects, and examples in perioperative and critical care. J Pediatr. (2020) 221:S3–10. doi: 10.1016/j.jpeds.2020.02.039
11. Rajkomar A, Dean J, Kohane I. Machine learning in medicine. N Engl J Med. (2019) 380(14):1347–58. doi: 10.1056/NEJMra1814259
12. Goto T, Camargo Jr CA, Faridi MK, Freishtat RJ, Hasegawa K. Machine learning-based prediction of clinical outcomes for children during emergency department triage. JAMA Netw Open. (2019) 2(1):e186937. Available at: https://pubmed.ncbi.nlm.nih.gov/30646206 doi: 10.1001/jamanetworkopen.2018.6937
13. Hwang S, Lee B. Machine learning-based prediction of critical illness in children visiting the emergency department. PLoS One. (2022) 17(2):e0264184. Available at: https://journals.plos.org/plosone/article?id=10.1371/journal.pone.0264184 (cited May 5, 2022). doi: 10.1371/journal.pone.0264184
14. Aczon MD, Ledbetter DR, Laksana E, Ho LV, Wetzel RC. Continuous prediction of mortality in the PICU: a recurrent neural network model in a single-center dataset. Pediatr Crit Care Med. (2021) 22(6):519–29. Available at: https://pubmed.ncbi.nlm.nih.gov/33710076 doi: 10.1097/PCC.0000000000002682
15. Kim SY, Kim S, Cho J, Kim YS, Sol IS, Sung Y, et al. A deep learning model for real-time mortality prediction in critically ill children. Crit Care. (2019) 23(1):279. Available at: https://ccforum.biomedcentral.com/articles/10.1186/s13054-019-2561-z doi: 10.1186/s13054-019-2561-z
16. Pienaar MA, Sempa JB, Luwes N, Solomon LJ. An artificial neural network model for pediatric mortality prediction in two tertiary pediatric intensive care units in South Africa. A Development Study. Front Pediatr. (2022) 10: 1–11. Available at: https://www.frontiersin.org/articles/10.3389/fped.2022.797080/full.. doi: 10.3389/fped.2022.797080
17. Pienaar MA, Sempa JB, Luwes N, George E, Brown SC. Elicitation of Domain Knowledge for a Machine Learning Model for Paediatric Critical Illness in South Africa. Unpublished Work. (2022).
18. Graupe D. Principles of arteficial neural networks. 3rd ed. Singapore: World Scientific Publishing Company (2013).
19. Wang SC. Artificial neural network BT - interdisciplinary computing in Java programming. In: Wang SC, Boston, MA: Springer US (2003). p. 81–100.
21. Bujang MA, Sa’At N, Tg Abu Bakar Sidik TMI, Lim CJ. Sample size guidelines for logistic regression from observational studies with large population: emphasis on the accuracy between statistics and parameters based on real life clinical data. Malays J Med Sci. (2018) 25(4):122. cited Jan 15, 2022). doi: 10.21315/mjms2018.25.4.12
22. Peduzzi P, Concato J, Kemper E, Holford TR, Feinstem AR. A simulation study of the number of events per variable in logistic regression analysis. J Clin Epidemiol. (1996) 49(12):1373–9. doi: 10.1016/S0895-4356(96)00236-3
23. World Health Organisation. WHO child growth standards and the identification of severe acute malnutrition in infants and children. (2009). Available at: http://apps.who.int/iris/bitstream/10665/44129/1/9789241598163_eng.pdf?ua=1
24. Fleming S, Thompson M, Stevens R, Heneghan C, Plüddemann A, MacOnochie I, et al. Normal Ranges of heart rate and respiratory rate in children from birth to 18 years of age: a systematic review of observational studies. Lancet. (2011) 377(9770):1011–8. Available at: https://pubmed.ncbi.nlm.nih.gov/21411136/ (cited February 28, 2022). doi: 10.1016/S0140-6736(10)62226-X
25. Roberts JS, Yanay O, Barry D. Age-based percentiles of measured mean arterial pressure in pediatric patients in a hospital setting. Pediatr Crit Care Med. (2020) 21(9):E759–68. doi: 10.1097/PCC.0000000000002495
26. Haque IU, Zaritsky AL. Analysis of the evidence for the lower limit of systolic and mean arterial pressure in children. Pediatr Crit Care Med. (2007) 8(2):138–44. doi: 10.1097/01.PCC.0000257039.32593.DC
27. White IR, Royston P, Wood AM. Multiple imputation using chained equations: issues and guidance for practice. Stat Med. (2011) 30(4):377–99. Available at: https://onlinelibrary.wiley.com/doi/full/10.1002/sim.4067 (cited February 28, 2022). doi: 10.1002/sim.4067
28. Raschka S. MLxtend: providing machine learning and data science utilities and extensions to python’s scientific computing stack. J Open Source Softw. (2018) 3(24):638. Available at: https://joss.theoj.org/papers/10.21105/joss.00638 (cited February 28, 2022). doi: 10.21105/joss.00638
29. Cavanaugh JE, Neath AA, Joseph Cavanaugh CE. The akaike information criterion: background, derivation, properties, application, interpretation, and refinements. Wiley Interdiscip Rev Comput Stat. (2019) 11(3):e1460. Available at: https://onlinelibrary.wiley.com/doi/full/10.1002/wics.1460 (cited Mar 8, 2022). doi: 10.1002/wics.1460
30. Branco P, Torgo L, Ribeiro R. A Survey of Predictive Modelling under Imbalanced Distributions. (2015):1–48 p. Available at: http://arxiv.org/abs/1505.01658
31. Jeni LA, Cohn JF, La Torre FD. Facing imbalanced data–recommendations for the use of performance metrics. 2013 Humaine association conference on affective computing and intelligent interaction (2013). p. 245–51
32. Saito T, Rehmsmeier M. The precision-recall plot is more informative than the ROC plot when evaluating binary classifiers on imbalanced datasets. PLoS One. (2015) 10(3):1–21. doi: 10.1371/journal.pone.0118432
34. Kluyver T, Ragam-Kelley B, Perez F, Granger B. Jupyter notebooks – a publishing format for reproducible computational workflows. Players, Agents and Agendas: Positioning and Power in Academic Publishing (2016).
35. McKinney W. Data structures for statistical computing in python. In: van der Walt S, Millman J, editors. Proceedings of the 9th Conference on Python in Science (Scipy 2010).
36. Pedregosa F, Varoquaux G, Gramfort A, Michel V, Thirion B, Grisel O, et al. Scikit-learn: Machine Learning in Python (2012). Available at: http://arxiv.org/abs/1201.0490
37. Harris CR, Millman KJ, van der Walt SJ, Gommers R, Virtanen P, Cournapeau D, et al. Array programming with NumPy. Nature. (2020) 585(7825:357–62. doi: 10.1038/s41586-020-2649-2
38. Abadi M, Agarwal A, Barham P, Brevdo E, Chen Z, Citro C, et al. TensorFlow: Large-Scale Machine Learning on Heterogeneous Distributed Systems. Available at: www.tensorflow.org
39. Micci-Barreca D. A preprocessing scheme for high-cardinality categorical attributes in classification and prediction problems. ACM SIGKDD Explorations Newsletter. (2001) 3(1):27–32. doi: 10.1145/507533.507538
40. Chen T, Guestrin C. XGBoost: A Scalable Tree Boosting System. (2016). Available from: http://arxiv.org/abs/1603.02754
41. Seabold S, Perktold J. Statsmodels: econometric and statistical modeling with python. Proc of the 9th python in science conf. (2010). Available at: http://statsmodels.sourceforge.net/ (cited Mar 13, 2022).
42. Efron B. Bootstrap Methods: Another Look at the Jackknife. (1992):569–93. Available at: https://link.springer.com/chapter/10.1007/978-1-4612-4380-9_41 (cited September 15, 2022).
43. Guo C, Pleiss G, Sun Y, Weinberger KQ. On Calibration of Modern Neural Networks. (2017). Available at: http://arxiv.org/abs/1706.04599
44. van Calster B, Nieboer D, Vergouwe Y, de Cock B, Pencina MJ, Steyerberg EW. A calibration hierarchy for risk models was defined: from utopia to empirical data. J Clin Epidemiol. (2016) 74:167–76. doi: 10.1016/j.jclinepi.2015.12.005
45. Vickers AJ, Elkin EB. Decision curve analysis: a novel method for evaluating prediction models. Med Decis Making. (2006) 26(6):565–74. Available from: https://journals.sagepub.com/doi/10.1177/0272989X06295361 (cited March 12, 2022). doi: 10.1177/0272989X06295361
46. Vickers AJ, van Calster B, Steyerberg EW. A simple, step-by-step guide to interpreting decision curve analysis. Diagn Progn Res. (2019) 3(1):1–8. Available at: https://diagnprognres.biomedcentral.com/articles/10.1186/s41512-019-0064-7 (cited March 12, 2022). doi: 10.1186/s41512-019-0064-7
47. Guo C, Pleiss G, Sun Y, Weinberger KQ. On calibration of modern neural networks. 34th International conference on machine learning, ICML 2017 (2017) 3:2130–43. Available at: https://arxiv.org/abs/1706.04599v2
48. Mandrekar JN. Receiver operating characteristic curve in diagnostic test assessment. J Thorac Oncol. (2010) 5(9):1315–6. doi: 10.1097/JTO.0b013e3181ec173d
49. Mehl G, Labrique A. Prioritizing integrated mHealth strategies for universal health coverage. Science. (2014) 345(6202):1284–7. doi: 10.1126/science.1258926
50. Kerrigan D, Hullman J, Bertini E. A survey of domain knowledge elicitation in applied machine learning. Multimodal Technologies and Interaction. (2021) 5(12): 1–19. doi: 10.3390/mti5120073
51. ann_visualizer·PyPI. Available at: https://pypi.org/project/ann_visualizer/ (cited July 17, 2022).
Keywords: neural networks, machine learning, critical care, children, triage, severity of illness
Citation: Pienaar MA, Sempa JB, Luwes N, George EC and Brown SC (2022) Development of artificial neural network models for paediatric critical illness in South Africa. Front. Pediatr. 10:1008840. doi: 10.3389/fped.2022.1008840
Received: 1 August 2022; Accepted: 17 October 2022;
Published: 15 November 2022.
Edited by:
J. Mark Ansermino, University of British Columbia, CanadaReviewed by:
Paul Mwaniki, Kenya Medical Research Institute (KEMRI) - Wellcome Trust Research Programme, KenyaRishikesan Kamaleswaran, Emory University, United States
© 2022 Pienaar, Sempa, Luwes, George and Brown. This is an open-access article distributed under the terms of the Creative Commons Attribution License (CC BY). The use, distribution or reproduction in other forums is permitted, provided the original author(s) and the copyright owner(s) are credited and that the original publication in this journal is cited, in accordance with accepted academic practice. No use, distribution or reproduction is permitted which does not comply with these terms.
*Correspondence: Michael A. Pienaar cGllbmFhcm1hMUB1ZnMuYWMuemE=
Specialty Section: This article was submitted to Pediatric Critical Care, a section of the journal Frontiers in Pediatrics