- 1Zibo Center for Disease Control and Prevention, Zibo, China
- 2Department of Epidemiology, School of Public Health, Shandong University, Jinan, China
- 3Department of Nutrition, School of Public Health, Shandong University, Jinan, China
- 4Department of Public Health Sciences, Karolinska Institutet, Stockholm, Sweden
Background: Clinical practice guidelines recommended that hypertension in children and adolescents should be defined based on elevated blood pressure (BP) on at least three separate occasions. Therefore, in the present study, we aimed to estimate the prevalence of hypertension based on three separate visits among Chinese children and adolescents and to examine its relationship with obesity.
Methods: A school-based cross-sectional survey was performed in children and adolescents in Jinan, China between September 2012 and September 2014. A total of 7,832 children and adolescents aged 6–17 years were included. Anthropometric data and BP were measured by trained examiners. Elevated BP was defined as BP ≥ 95th percentile for age and sex based on the Chinese reference data. Participants with elevated BP at the first visit underwent a second visit 2 weeks later, and a third visit was conducted if BP was still high at the second visit. Hypertension was defined as having an elevated BP at all three visits. Obesity was defined in three ways by using body mass index, waist circumference, and waist-to-height ratio.
Results: The prevalence of elevated BP decreased substantially across three separate visits, with the prevalence of 17.2, 8.6, and 4.9%, respectively. Obesity was an independent risk factor for elevated BP during each visit. Based on the body mass index, obesity was associated with higher risk of elevated BP, with the adjusted odds ratios (ORs) and 95% confidence intervals (CIs) of 8.6 (6.8–11.0), 12.5 (9.1–17.3), and 14.0 (8.9–22.2), respectively, at the first, second and third visit. The ORs of elevated BP were similar in association with obesity defined by waist circumference or waist-to-height ratio.
Conclusions: The prevalence of hypertension based on three visits was ~5% in Chinese children and adolescents. There was a dose-response relationship between obesity and elevated BP across three visits.
Introduction
Hypertension in adults has been one of the major contributors to cardiovascular disease burden worldwide. It is estimated that nearly 10.7 million deaths and 211.8 million disability adjusted life-years were due to hypertension worldwide in 2015 (1). Notably, pediatric elevated blood pressure (BP) tends to track into adulthood (2) and it is associated with a series of early target organ damages in childhood (3), which can increase the risk of cardiovascular diseases later in life. Therefore, recognition and control of elevated BP at an early age may be an important strategy for reducing the hypertension-induced cardiovascular disease burden.
BP in children may vary a lot due to several potential reasons, such as the “white coat effects” and environmental factors (e.g., temperature and noise), which may cause transient elevated BP. Therefore, hypertension in children defined based on the BP measured at one single visit may overestimate the true prevalence. Indeed, clinical practice guidelines recommended that hypertension in children and adolescents should be defined based on elevated BP on at least three separate occasions (4–6). Up to now, several studies from western pediatric populations have assessed the prevalence of hypertension based on this recommendation (7, 8). However, few are from Chinese children and adolescents (9, 10). In addition, different populations may have different growth and development patterns and different exposures to lifestyle factors.
Adiposity has been shown to be an independent risk factor for elevated BP in children. However, most analyses were conducted using body mass index (BMI) as the indicator to assess weight status, which cannot distinguish fat distribution. Waist circumference (WC) and waist-to-height ratio (WHtR) are indicators of abdominal obesity that can better assess the distribution of the visceral adipose tissue (11).
Thus, based on a school-based, cross-sectional survey conducted in Jinan, China, we aimed to estimate the true prevalence of hypertension among Chinese children and adolescents aged 6–17 years. In addition, we examined the relationship between elevated BP and excess weight defined in three ways.
Materials and Methods
Study Population
This study was conducted in four schools in urban region of Jinan, China between September 2012 and September 2014. The four public schools, including two primary schools, one junior high school and one senior high school, were chosen using convenient cluster sampling method. All students from the selected schools were invited to participate in the survey. A standard questionnaire, including demographic information, family history of hypertension, puberty status, and lifestyle factors, was finished by the students and/or their parents. Physical examinations (i.e., height, weight, WC, and BP) were conducted by trained research staff according to a standard protocol. A total of 7,832 students were included in the present study after excluding those with missing information on age, sex, height, weight, WC, and BP. Signed informed consent was obtained from all students and their guardians. Ethical approval was obtained from the Ethics Committee of the Capital Institute of Pediatrics in Beijing, China.
BP Measurements and Definitions
BP was measured by trained examiners with a clinically validated electronic device (OMRON HEM-7012) (12). After at least 10 min of rest, BP was measured on the right arm supported at the level of heart, in a sitting position with the back supported and feet flat on the floor. The mid-arm circumference was measured and appropriate cuff size was chosen (i.e. small, normal, or large cuff for a mid-arm circumference of 13.0–21.9, 22.0–31.9, or 32.0–42.0 cm, respectively). Three consecutive BP measurements were taken with at least 1 min apart. If the difference between any two of the three BP readings was more than 5 mmHg, then a fourth BP measurement was conducted. Mean value of the last two readings was used for data analysis.
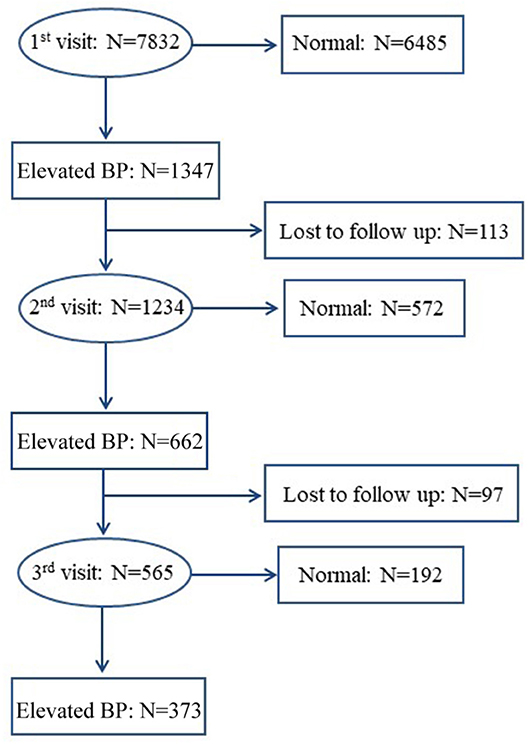
Elevated BP was defined if systolic BP (SBP) and/or diastolic BP (DBP) ≥age- and sex-specific 95th percentiles of the Chinese BP references (13). Participants with elevated BP at the first visit underwent a second visit at least 2 weeks later. If elevated BP persisted at the second visit, a third visit was conducted at least another 2 weeks later, according to the same procedures. Those with elevated BP at all the three visits were identified as hypertensive (4–6). The flow chart of the BP screening procedures is shown in Figure 1. One hundred thirteen of 1,347 children and adolescents with elevated BP at the first visit and 97 of 662 children and adolescents with sustained elevated BP at the second visit were lost to follow-up for some reasons, such as refusal, absence from school, or having a disease. We compared the baseline characteristics between followed-up participants and those lost to follow-up and we found no significant differences (data not shown).
Adiposity Measurements and Definitions
Weight was measured twice in light clothes and without shoes using an electronic scale, and was approximated to 0.1 kg. Height was also measured twice and approximated to 0.1 cm. The mean of two measures was used for analysis. BMI was calculated as the weight divided by the height squared (kg/m2). Normal weight, overweight, and obesity were defined based on the age- and sex-specific BMI cutoffs for Chinese children and adolescents (14). WC was also measured twice and approximated to 0.1 cm using a standard tape. Extend the tape around the waist in a horizontal plane at the level of 1 cm above the umbilicus. Central overweight and obesity were defined according to the age- and sex-specific WC cutoffs of Chinese children and adolescents (15). WHtR was calculated as the ratio of WC and height. WHtR ≥0.50 was used to define central obesity (16).
Covariates
The collected information includes age, sex, birth weight, puberty status, parental history of hypertension, and parental education levels. Puberty status was dichotomized based on whether they had menarche for girls or spermatorrhoea for boys. Parental history of hypertension (yes vs. no) was obtained from both father and mother using the following question: Have you ever been told by a physician to be hypertensive or taking anti-hypertensive drugs currently? Parental education levels were categorized into primary school, high school, college or university.
Statistical Analysis
Data were analyzed with SAS, version 9.3 (SAS Institute, Cary, NC, USA). Quantitative variables were presented as mean ± standard deviation (or standard error). The differences in quantitative variables between groups were compared by covariance analysis adjusted for age and sex (or BMI), and linear regression analysis was used to test trends. Categorical variables were expressed as percentages and the differences between groups were compared by chi-square test and Cochran-Armitage analysis was used for trend tests. Binary logistic regression analysis was used to assess the relationship between adiposity measures and hypertension, with adjustment of potential covariates. Odds ratios (ORs) with the corresponding 95% confidence intervals (CIs) were calculated. Two-sided p < 0.05 was considered as statistically significant.
Results
Characteristics of the Participants Across Three Different Visits
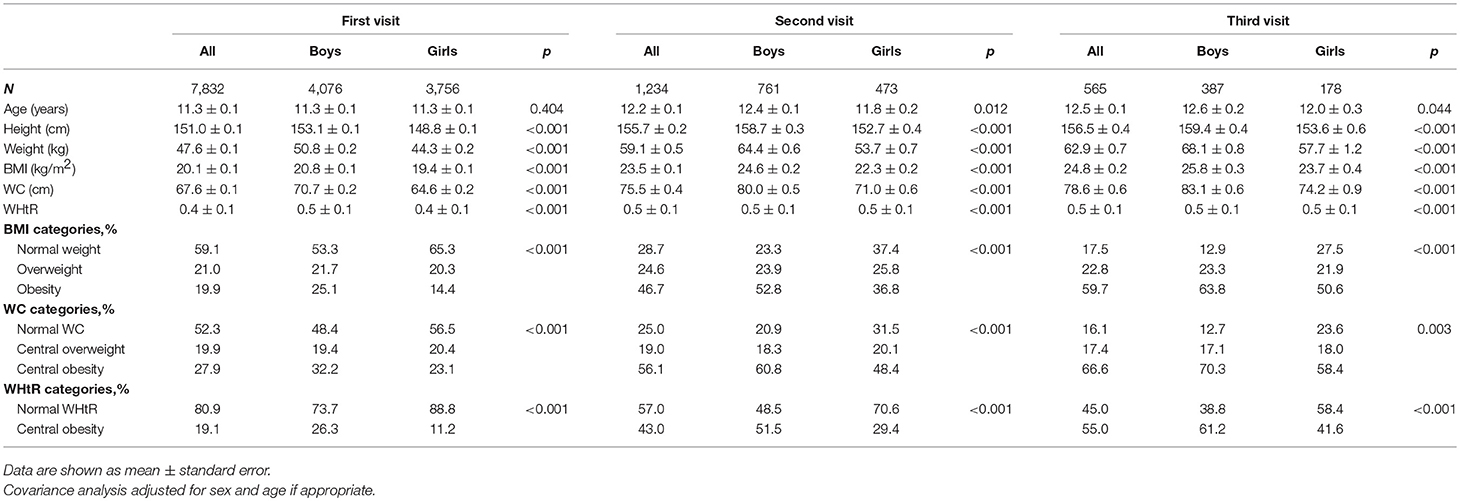
A total of 7,832 students (boys: 52.0%), aged 6–17 years, were included at the first visit, 1,234 (boys: 61.7%) at the second visit, and 565 (boys: 68.5%) at the third visit. Characteristics of the participants across the three separate visits are presented in Table 1. Boys had higher height, weight, BMI, WC, WHtR, and higher prevalence of general and central obesity than girls at each visit (all p < 0.001). Of note, the prevalence of obesity was particularly high in both genders at the third visit, with the estimates reaching 59.7, 66.6, and 55.0%, respectively, based on different adiposity measures including BMI, WC and WHtR.
Prevalence of Elevated BP Across Three Different Visits
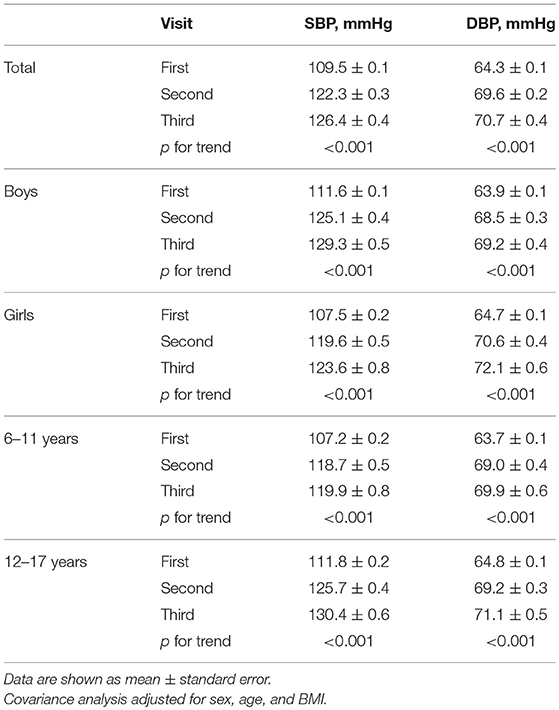
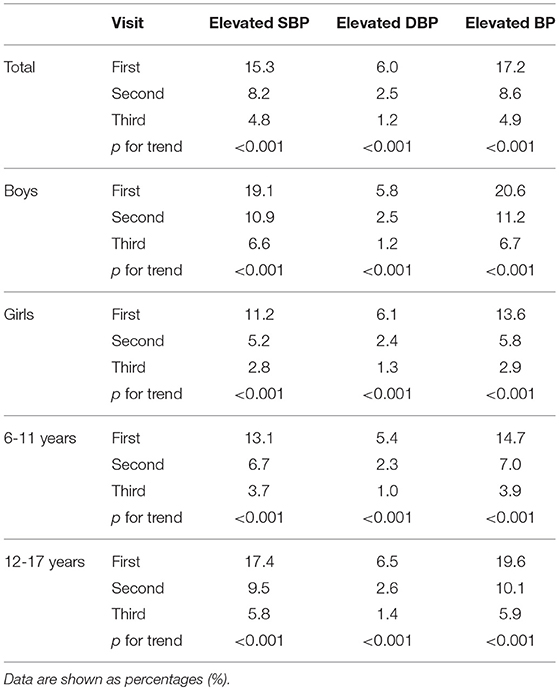
The levels of SBP and DBP increased greatly across the three separate visits, and the similar trends were found in the subgroups by sex and age (Table 2). Table 3 shows the prevalence of elevated BP across three separate occasions among Chinese children and adolescents by age and sex. The prevalence of elevated BP was 17.2, 8.6, and 4.9% at the first, second and third visit, respectively. There was a downward trend in the prevalence of elevated BP over three repeated visits (p for trend<0.001). There were similar trends in elevated SBP and DBP across three visits, with the prevalence being 15.3, 8.2, and 4.8%, respectively, for elevated SBP and 6.0, 2.5, and 1.2%, respectively, for elevated DBP.
Elevated BP was significantly more prevalent in boys than girls during each visit (first: 20.6 vs. 13.6%, second: 11.2 vs. 5.8% and third: 6.7 vs. 2.9%). Elevated BP was also more prevalent in adolescents aged 12–17 years compared with children aged 6–11 years, with the prevalence of 19.6 vs.14.7%, 10.1 vs. 7.0%, and 5.9 vs. 3.9% at the first, second and third visit, respectively (Table 3).
Associations Between Obesity and Elevated BP
Table 4 shows the associations of general and central obesity with elevated BP across three different visits. Obesity was an independent risk factor for elevated BP at each visit, irrespective of anthropometric indices used to define weight status. Based on the BMI definition, obesity was associated with higher risk of elevated BP, with the adjusted ORs (95% CIs) being 8.6 (6.8–11.0), 12.5 (9.1–17.3), and 14.0 (8.9–22.2), respectively, across the three visits. Corresponding values were 5.7 (4.6–7.2), 7.7 (5.6–10.6), and 10.9 (6.7–17.9), respectively, for the WC definition, and 4.9 (3.9–6.1), 6.3 (4.8–8.3), and 7.7 (5.3–11.1), respectively, for the WHtR definition.
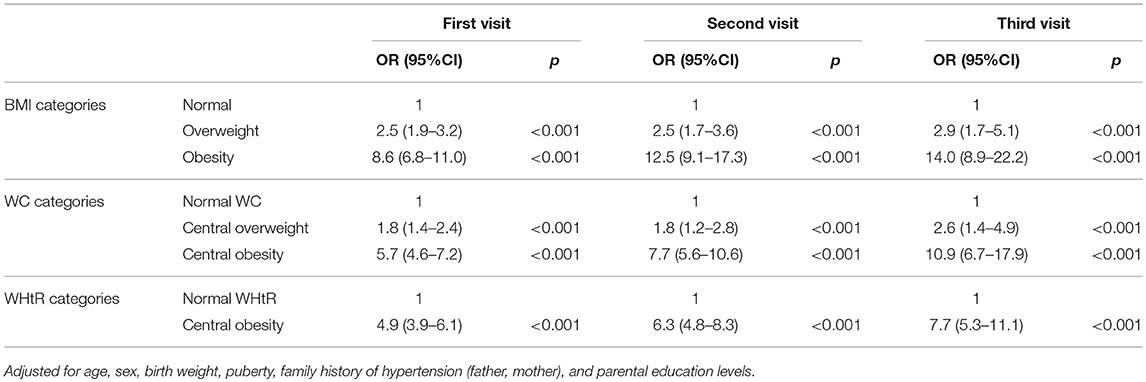
Table 4. Associations of different adiposity measures with elevated blood pressure across three different visits.
Discussion
Our study shows that the prevalence of pediatric elevated BP decreases substantially across three visits, from 17.2% at the first visit to 4.9% at the third visit. This trend might be explained by the “white-coat” effects (17, 18), or anxiety (19) that can result in increased BP levels. As children became more familiar with BP measurements from the first visit to the third visit, the BP measurements became more reliable. Thus, BP measured at the third visit might better reflect the true BP status of the children.
Previous studies have also reported substantial decreases in the prevalence of elevated BP in children across different visits. A study conducted in Switzerland showed that the prevalence of elevated BP was 11.4, 3.8, and 2.2%, respectively, at the first, second and third visit (8). Another study in Chinese pediatric population reported that the prevalence of elevated BP was more than halved between the first and third visit (18.2 vs. 3.1%) (9). A recent meta-analysis demonstrated that the prevalence of pediatric elevated BP decreased from 12.1% at the first visit to 2.7% at the third visit (7). The findings above are similar with our study. BP screening based on one occasional visit may mislabel a substantial number of children as hypertensive ones, which may lead to unnecessary stress for children/parents. Additionally, the Cardiovascular Risk in Young Study reported that repeated observations of elevated BP among children and adolescents enhanced the prediction of hypertension in adults (20). Altogether, these findings emphasized the necessity of BP measurements on at least three different occasions to estimate the true prevalence of hypertension in the pediatric population or to diagnose hypertension in clinical practice.
Boys had higher prevalence of elevated BP than girls in our study, which was similar to several previous studies (21, 22). Data from the Victorian Family Heart Study showed that estrogen receptors (ER)-alpha and ER-beta might play more important roles in the genetic regulation of BP in men, and the sex steroid-related genes may contribute to the observed sex differences in BP (23). In addition, boys were more likely to have adverse healthy behaviors [e.g., tobacco smoking (24), alcohol use (25) and sedentary behaviors (26)] than girls. Moreover, the prevalence of elevated BP was much higher in adolescents than in children, which was consistent with several previous studies (27, 28). Possible explanations for the age differences included intense hormonal changes and elevated insulin resistance during pubertal period, and a much higher prevalence of overweight and obesity in adolescents vs. children in the present study.
The study also presented that adiposity was an independent risk factor for elevated BP in children, similar with previous publications (8, 9, 29). The novelty of our study includes the use of different adiposity measures to define obesity. BMI is a widely used indicator of obesity, but it cannot distinguish fat distribution. WC and WHtR are indicators of abdominal obesity that can better assess the distribution of the visceral adipose tissue. The link between obesity and hypertension may be mediated partly by the hyperactivity of the sympathetic nervous system (SNS) (30, 31). In children, SNS can cause a hyperdynamic hemodynamic state (32), contributing to elevated BP. Obese children with elevated BP often have increased heart rate and BP variability, which also suggests a primary role of heightened SNS activity in the association between obesity and hypertension (33).
The major strengths of our study include the large sample size, a fair participation rate (first visit: 99.8%; second visit: 91.6%; third visit: 85.3%), and the well-standardized BP measurements. However, our study also has some limitations. First, BP re-assessments were only made in children who had elevated BP readings at the initial visit. Consequently, this may cause some underestimation in hypertension, especially when some children have normal BP at first visit, but may actually have an elevated BP (i.e., masked hypertension) at the subsequent visits. Second, we used the Chinese children and adolescents BP references (13) to define elevated BP across three visits, which made our results incomparable with others. Third, our data were collected using a convenient cluster sampling method in urban area of Jinan, China, thus, the generalizability of our results to the whole Chinese children might be limited. Finally, based on a cross-sectional study design, our study is unable to provide causal associations between adiposity and pediatric elevated BP, but reverse causation is unlikely.
Conclusions
The current study demonstrates that the prevalence of elevated BP decreases substantially across three different visits, and the true prevalence of hypertension is about ~5% in Chinese children and adolescents. Our findings highlight the importance of repeated BP assessments over at least three visits before making a final diagnosis of pediatric hypertension. In addition, early accurate detection and effective control of hypertension in children should be emphasized, especially among those with excess body weight.
Data Availability
The raw data supporting the conclusions of this manuscript will be made available by the authors, without undue reservation, to any qualified researcher.
Ethics Statement
All subjects gave written informed consent in accordance with the Declaration of Helsinki. Signed informed consent was obtained from all students and their guardians. Ethical approval was obtained from the Ethics Committee of the Capital Institute of Pediatrics in Beijing, China.
Author Contributions
QZ, LY, and BX conceptualized the study and drafted the article. QZ, LY, and YZ analyzed the data. YZ, MZ, YL, and BX revised the manuscript. All authors approved the final submitted and published versions.
Funding
The study was supported by the National Nature Science Foundation of China (81673195, 81302496) and the National Twelfth Five-Year Plan for Science and Technology Support Program (2012BAI03B03).
Conflict of Interest Statement
The authors declare that the research was conducted in the absence of any commercial or financial relationships that could be construed as a potential conflict of interest.
Acknowledgments
We gratefully acknowledge Dr. Jie Mi from Capital Institute of Pediatrics in Beijing, China for supporting this study. We also thank the participated students and their parents as well as the teachers from the selected schools.
Abbreviations
BMI, Body Mass Index; BP, Blood Pressure; CIs, Confidence Intervals; DBP, Diastolic Blood Pressure; ER, Estrogen Receptors; ORs, Odds Ratios; SBP, Systolic Blood Pressure; SNS, Sympathetic Nervous System; WC, Waist Circumference; WHtR, Waist-to-height Ratio.
References
1. Global regional and national comparative risk assessment of 79 behavioural environmental and occupational and metabolic risks or clusters of risks 1990-2015: a systematic analysis for the Global Burden of Disease Study 2015. Lancet. (2016) 388:1659–724. doi: 10.1016/s0140-6736(16)31679-8
2. Chen X, Wang Y. Tracking of blood pressure from childhood to adulthood: a systematic review and meta-regression analysis. Circulation. (2008) 117:3171–80. doi: 10.1161/circulationaha.107.730366
3. Kollias A, Dafni M, Poulidakis E, Ntineri A, Stergiou GS. Out-of-office blood pressure and target organ damage in children and adolescents: a systematic review and meta-analysis. J Hypertens. (2014) 32:2315–31. doi: 10.1097/hjh.0000000000000384
4. National High Blood Pressure Education Program Working Group on High Blood Pressure in Children Adolescents. The fourth report on the diagnosis, evaluation, and treatment of high blood pressure in children and adolescents. Pediatrics. (2004) 114:555–76.
5. Flynn JT, Kaelber DC, Baker-Smith CM, Blowey D, Carroll AE, Daniels SR, et al. Clinical practice guideline for screening and management of high blood pressure in children and adolescents. Pediatrics. (2017) 140:1904. doi: 10.1542/peds.2017-1904
6. Xi B, Zong X, Kelishadi R, Hong YM, Khadilkar A, Steffen LM, et al. Establishing international blood pressure references among nonoverweight children and adolescents aged 6 to 17 years. Circulation. (2016) 133:398–408. doi: 10.1161/CIRCULATIONAHA.115.017936
7. Sun J, Steffen LM, Ma C, Liang Y, Xi B. Definition of pediatric hypertension: are blood pressure measurements on three separate occasions necessary? Hypertens Res. (2017) 40:496–503. doi: 10.1038/hr.2016.179
8. Chiolero A, Cachat F, Burnier M, Paccaud F, Bovet P. Prevalence of hypertension in schoolchildren based on repeated measurements and association with overweight. J Hypertens. (2007) 25:2209–17. doi: 10.1097/HJH.0b013e3282ef48b2
9. Meng L, Liang Y, Liu J, Hu Y, Yan Y, Mi J. Prevalence and risk factors of hypertension based on repeated measurements in Chinese children and adolescents. Blood Press. (2013) 22:59–64. doi: 10.3109/08037051.2012.701790
10. Leung LC, Sung RY, So HK, Wong SN, Lee KW, Lee KP, et al. Prevalence and risk factors for hypertension in Hong Kong Chinese adolescents: waist circumference predicts hypertension, exercise decreases risk. Arch Dis Child. (2011) 96:804–9. doi: 10.1136/adc.2010.202770
11. Lo K, Wong M, Khalechelvam P, Tam W. Waist-to-height ratio, body mass index and waist circumference for screening paediatric cardio-metabolic risk factors: a meta-analysis. Obes Rev. (2016) 17:1258–75. doi: 10.1111/obr.12456
12. Meng LH, Hou DQ, Shan XY, Mi J. Accuracy evaluation of Omron HEM-7012 electronic sphygmomanometers in measuring blood pressure of children and adolescents. Chin J Hypertens. (2013) 21:158–62. doi: 10.16439/j.cnki.1673-7245.2013.02.036
13. Mi J, Wang TY, Meng LH, Zhu GJ, Han SM, Zhong Y. Development of blood pressure reference standards for Chinese children and adolescents. Chin J Evid Based Pediatr. (2010) 5:4–14. doi: 10.3969/j.issn.1673-5501.2010.01.002
14. Li H, Zong XN, Ji CY, Mi J. Body mass index cut-offs for overweight and obesity in Chinese children and adolescents aged 2-18 years. China J Epidemiol. (2010) 31:616–20. doi: 10.3760/cma.j.issn.0254-6450.2010.06.004
15. Ma G, Ji C, Ma J, Mi J, Sung RY, Xiong F, et al. Waist circumference reference values for screening cardiovascular risk factors in Chinese children and adolescents aged 7-18 years. Chin J Epidemiol. (2010) 31:609–15. doi: 10.3760/cma.j.issn.0254-6450.2010.06.003
16. Ashwell M, Gibson S. A proposal for a primary screening tool: ‘Keep your waist circumference to less than half your height’. BMC Med. (2014) 12:207. doi: 10.1186/s12916-014-0207-1
17. Gorostidi M, Vinyoles E, Banegas JR, de la Sierra A. Prevalence of white-coat and masked hypertension in national and international registries. Hypertens Res. (2015) 38:1–7. doi: 10.1038/hr.2014.149
18. Kollias A, Ntineri A, Stergiou GS. Is white-coat hypertension a harbinger of increased risk? Hypertens Res. (2014) 37:791–5. doi: 10.1038/hr.2014.35
19. Schulte W, Neus H, Thones M, von Eiff AW. Basal blood pressure variability and reactivity of blood pressure to emotional stress in essential hypertension. Basic Res Cardiol. (1984) 79:9–16. doi: 10.1007/bf01935802
20. Oikonen M, Nuotio J, Magnussen CG, Viikari JS, Taittonen L, Laitinen T, et al. Repeated blood pressure measurements in childhood in prediction of hypertension in adulthood. Hypertension. (2016) 67:41–7. doi: 10.1161/hypertensionaha.115.06395
21. de Moraes AC, Lacerda MB, Moreno LA, Horta BL, Carvalho HB. Prevalence of high blood pressure in 122,053 adolescents: a systematic review and meta-regression. Medicine. (2014) 93:e232. doi: 10.1097/MD.0000000000000232
22. Yang Y, Dong B, Wang S, Dong Y, Zou Z, Fu L, et al. Prevalence of high blood pressure subtypes and its associations with BMI in Chinese children: a national cross-sectional survey. BMC Public Health. (2017) 17:598. doi: 10.1186/s12889-017-4522-2
23. Ellis JA, Infantino T, Harrap SB. Sex-dependent association of blood pressure with oestrogen receptor genes ERalpha and ERbeta. J Hypertens. (2004) 22:1127–31. doi: 10.1097/00004872-200406000-00013
24. Sun W, Andreeva VA, Unger JB, Conti DV, Chou CP, Palmer PH, et al. Age-related smoking progression among adolescents in China. J Adolesc Health. (2006) 39:686–93. doi: 10.1016/j.jadohealth.2006.04.023
25. Donath C, Grassel E, Baier D, Pfeiffer C, Bleich S, Hillemacher T. Predictors of binge drinking in adolescents: ultimate and distal factors–a representative study. BMC Public Health. (2012) 12:263. doi: 10.1186/1471-2458-12-263
26. Rey-Lopez JP, Bel-Serrat S, Santaliestra-Pasias A, de Moraes AC, Vicente-Rodriguez G, Ruiz JR, et al. Sedentary behaviour and clustered metabolic risk in adolescents: the HELENA study. Nutr Metab Cardiovasc Dis. (2013) 23:1017–24. doi: 10.1016/j.numecd.2012.06.006
27. Xu T, Zhu G, Liu J, Han S. Gender-specific prevalence and associated risk factors of high normal blood pressure and hypertension among multi-ethnic Chinese adolescents aged 8-18 years old. Blood Press. (2015) 24:189–95. doi: 10.3109/08037051.2015.1025474
28. Moore WE, Eichner JE, Cohn EM, Thompson DM, Kobza CE, Abbott KE. Blood pressure screening of school children in a multiracial school district: the healthy kids project. Am J Hypertens. (2009) 22:351–6. doi: 10.1038/ajh.2009.13
29. Marcovecchio ML, Mohn A, Diddi G, Polidori N, Chiarelli F, Fuiano N. Longitudinal assessment of blood pressure in school-aged children: a 3-year follow-up study. Pediatr Cardiol. (2016) 37:255–61. doi: 10.1007/s00246-015-1271-9
30. Corry DB, Tuck ML. Obesity, hypertension, and sympathetic nervous system activity. Curr Hypertens Rep. (1999) 1:119–26. doi: 10.1007/s11906-999-0005-x
31. Sorof JM, Poffenbarger T, Franco K, Bernard L, Portman RJ. Isolated systolic hypertension, obesity, and hyperkinetic hemodynamic states in children. J Pediatr. (2002) 140:660–6. doi: 10.1067/mpd.2002.125228
32. Jiang X, Srinivasan SR, Urbina E, Berenson GS. Hyperdynamic circulation and cardiovascular risk in children and adolescents. The bogalusa heart study. Circulation. (1995) 91:1101–6. doi: 10.1161/01.cir.91.4.1101
Keywords: blood pressure, hypertension, obesity, children, cross-sectional, repeated measurement
Citation: Zhang Q, Yang L, Zhang Y, Zhao M, Liang Y and Xi B (2019) Hypertension Prevalence Based on Three Separate Visits and Its Association With Obesity Among Chinese Children and Adolescents. Front. Pediatr. 7:307. doi: 10.3389/fped.2019.00307
Received: 25 March 2019; Accepted: 09 July 2019;
Published: 24 July 2019.
Edited by:
Oswin Grollmuss, Université Paris-Sud, FranceReviewed by:
Yajun Chen, Sun Yat-sen University, ChinaHung-kwan So, The University of Hong Kong, Hong Kong
Copyright © 2019 Zhang, Yang, Zhang, Zhao, Liang and Xi. This is an open-access article distributed under the terms of the Creative Commons Attribution License (CC BY). The use, distribution or reproduction in other forums is permitted, provided the original author(s) and the copyright owner(s) are credited and that the original publication in this journal is cited, in accordance with accepted academic practice. No use, distribution or reproduction is permitted which does not comply with these terms.
*Correspondence: Bo Xi, eGlibzIwMDdAMTI2LmNvbQ==
 Qian Zhang1
 Lili Yang
 Yajun Liang
 Bo Xi
Bo Xi