 Linda Djune-Yemeli1,2
 Marla Hertz3
 Hugues C. Nana-Djeunga1Amy Rush4
 Petra Erdmann-Gilmore5Robert Sprung5Jean Gabin Bopda1Reid Townsend5
 Palmer Masumbe Netongo2,6Joseph Kamgno1,7
 Philip J. Budge4*
- 1Higher Institute of Scientific and Medical Research (ISM), Yaoundé, Cameroon
- 2Molecular Diagnostics Research Group, Biotechnology Centre-University of Yaoundé I (BTC-UY-I), Yaoundé, Cameroon
- 3Office of Scholarly Communication, University of Alabama at Birmingham Libraries, Birmingham, AL, United States
- 4Infectious Disease Division, Department of Medicine, Washington University in St. Louis, St. Louis, MO, United States
- 5Division of Endocrinology, Metabolism and Lipid Research, Department of Medicine, Washington University School of Medicine, St. Louis, MO, United States
- 6Departement of Biochemistry, Faculty of Sciences, University of Yaoundé I, Yaoundé, Cameroon
- 7Faculty of Medicine and Biomedical Sciences, University of Yaoundé I, Yaoundé, Cameroon
Background and methods: Circulating Loa loa antigens are often detected in individuals with heavy L. loa infections by diagnostic tests for lymphatic filariasis (LF) caused by Wuchereria bancrofti. This is a major challenge to LF mapping and elimination efforts in loiasis co-endemic areas. However, it also provides an opportunity to identify antigen biomarkers for loiasis. To determine which L. loa antigens might be promising biomarkers for distinguishing true LF from loiasis, we screened for L. loa antigens in a group of individuals with heavy L. loa infections living in the Okola Health District of Cameroon. In this longitudinal study, participants were tested for cross-reactive antigenemia by filariasis test strip (FTS), ELISA, and western blot, and were monitored for FTS status at 6, 9, 12, and 15 months post-enrollment. We then identified specific circulating L. loa antigens by liquid chromatography-tandem mass spectrometry (LC-MS/MS) from baseline and 15-month plasma samples.
Principal findings and conclusions: Among 73 FTS-positive (FTS+) and 13 FTS-negative (FTS-) participants with high L. loa microfilarial loads, 83% maintained their FTS status over the course of the study, while 17% experienced at least one FTS conversion event (from FTS+ to FTS- or vice versa). Cross-reactive antigens were detected in both FTS+ and FTS- sera by western blot, and there was poor agreement in antigen detection by FTS, western blot, and ELISA methods. One protein family, a group of Nas-14 metalloproteases, was detected by LC MS/MS in >80% of tested samples, including FTS- samples. These data identify Nas-14 as a promising loiasis biomarker potentially capable of distinguishing loiasis from lymphatic filariasis.
1 Introduction
Lymphatic filariasis (LF) is a debilitating, mosquito-borne disease characterized by chronic morbidity in the form of hydrocele, lymphedema, and elephantiasis (Herrera et al., 2011; World Health Organization, 2019). Recognizing its important socioeconomic impact, and with advances in diagnostics and treatment, the World Health Organization (WHO) launched the Global Program to Eliminate LF (GPELF) in 2000 (Ottesen, 2000). GPELF’s elimination strategy has 2 pillars: (i) interrupting parasite transmission through annual mass drug administration (MDA), and (ii) offering a basic package of care to alleviate the suffering of those affected with elephantiasis/hydrocele (World Health Organization, 2010). Although considerable progress has been made toward LF elimination, significant efforts are still needed to meet the elimination target that has now been postponed to 2030 (World Health Organization, 2021).
To achieve LF elimination, one of the critical actions recommended in WHO’s 2021-2030 roadmap is to implement MDA in all LF-endemic implementation units (NTD Modelling Consortium Lymphatic Filariasis Group, 2019; World Health Organization, 2021). However, in some settings in West and Central Africa, loiasis is an obstacle to LF elimination for two reasons. First, individuals with heavy L. loa infections are at high risk for serious adverse events if treated during MDA (Gardon et al., 1997). Second, LF mapping, the crucial first step in MDA implementation (Zouré et al., 2011; Kelly-Hope et al., 2017; Deribe et al., 2020), can be inaccurate in loiasis-endemic areas due to cross-reactive antigenemia. LF mapping mainly relies on detection of a W. bancrofti-specific circulating filarial antigen (CFA) by rapid diagnostic test (RDT), most commonly the Filariasis Test Strip (FTS) (Lindsay and Thomas, 2000; Ruberanziza et al., 2009; Rebollo and Bockarie, 2013; Mwase et al., 2014). Although LF RDTs have supported programmatic activities in West and Central Africa for decades (Rocha et al., 2009; Weil et al., 2013; Chesnais et al., 2017), there is now strong evidence that they lack specificity in loiasis co-endemic areas due to the presence of cross-reactive circulating L. loa antigens in some individuals heavily infected with loiasis (Bakajika et al., 2014; Wanji et al., 2015; Pion et al., 2016; Wanji et al., 2016; Hertz et al., 2018; Wanji et al., 2019). While loiasis cross-reactivity is more likely in individuals with high Loa loa microfilaria (Mf) counts (> 20,000 mf/mL), it is not well understood why only some heavily infected individuals test positive by FTS, or why some FTS-positive individuals may revert to a negative FTS despite maintaining high Mf loads (Hertz et al., 2018).
Thus, loiasis cross-reactivity makes it near impossible for national programs in loiasis endemic areas to determine with certainty where LF MDA is required and when it should be stopped. The prevalence of loiasis cross-reactivity can easily exceed 6% in high loiasis endemic settings (Bakajika et al., 2014), far exceeding the 1% threshold for implementing LF MDA (World Health Organization, 2019). Although potential target antigens have been described (Drame et al., 2016), no antigen detection assays for loiasis are currently available for programmatic use. The development of a rapid antigen detection test for loiasis to confirm whether positive FTS results were due to the presence of a L. loa antigen would improve mapping accuracy of both infections in co-endemic areas. The purposes of this study were to investigate the stability of loiasis cross-reactivity over time and to determine which of the hundreds of L. loa proteins previously detected in cross-reactive plasma (Hertz et al., 2018) are consistently present in cross-reactive sera and can therefore be used to distinguish LF from loiasis.
2 Materials and methods
2.1 Ethics statement
The current study received ethical approval from the Regional Ethics Committee for Human Health Research, Centre Region, Cameroun (CE № 05862/CRERSHC/2019) and the Institutional Review Board of the Washington University in Saint Louis (IRB ID #: 01909003). In addition, administrative authorization was granted by the Okola District Medical Officer. Prior to the beginning of the surveys, the objectives and schedules of the study were explained to all the participants and written informed consents obtained.
2.2 Study area
This study was conducted in the Okola Health District (HD), Centre Region, Cameroon, which is highly endemic for loiasis and hypo- to meso-endemic for onchocerciasis, with no evidence of Bancroftian filariasis (Zouré et al., 2011; Kouam et al., 2013). Ivermectin MDA was initiated in the 11 health areas of the Okola in 1999. However, due to the occurrence of several adverse event cases, MDA activities were stopped. The situation was clarified (identification of loiasis as main risk factor and elaboration of mitigating measures) and MDA resumed in 5 of the 11 health areas considered meso-endemic for onchocerciasis. A Test and Not Treat (TaNT) strategy was piloted in the Okola HD in 2015 (Kamgno et al., 2017) to safely extend ivermectin-based MDA in the 6 remaining health areas hypo-endemic to onchocerciasis (World Health Organization, 2007). Okola HD is a degraded forest area, with a population estimated at 54,870 inhabitants (Ministry of Public Health, 2017). Agriculture (crops, cacao, and nut) and trading are the main activities in the area.
2.3 Study design
This was a longitudinal study involving a cohort of adults (age ≥18 years) heavily infected with L. loa (the choice of heavily infected individuals was guided by the strong association between high L. loa Mf density and false-positive LF rapid test results (Pion et al., 2016). Individuals excluded from the TaNT pilot study in the Okola HD due to L. loa Mf counts higher than 20,000 Mf/mL (Kamgno et al., 2017) were screened in January and February 2020. Daytime capillary blood was collected by fingerpick and tested with FTS (Abbott Bioline) and for L. loa Mf density by LoaScope (D’Ambrosio et al., 2015). FTS-positive individuals were enrolled in the study as cases, and a subset of heavily infected FTS- individuals were also enrolled as controls. After enrolment, participants provided daytime capillary and venous blood for calibrated thick blood smears, ELISA and proteomic analyses, and nighttime capillary blood for W. bancrofti thick blood smear and PCR.
We intended to assess persistence of cross-reactive antigenemia quarterly over the course of one year. However, the assessment planned at 3 months post-enrolment was not possible due to the COVID-19 pandemic. We therefore tested participants at baseline, 6-, 9-, 12-, and 15-months post-enrolment. At each follow-up visit, daytime capillary blood was collected and tested for Mf and L. loa cross-reactive antigen (by FTS), and venous blood was collected for subsequent ELISA and proteomic analyses (Figure 1). For proteomics analyses, endemic and non-endemic control were selected among banked sera from previous studies; endemic controls were amicrofilaremic patients in the Akonolinga and Awae health district, Centre Cameroon (Hertz et al., 2018), while non-endemic controls were de-identified clinical samples collected at Barnes-Jewish Hospital, St Louis Missouri, US, from patients who have never been in loiasis endemic areas.
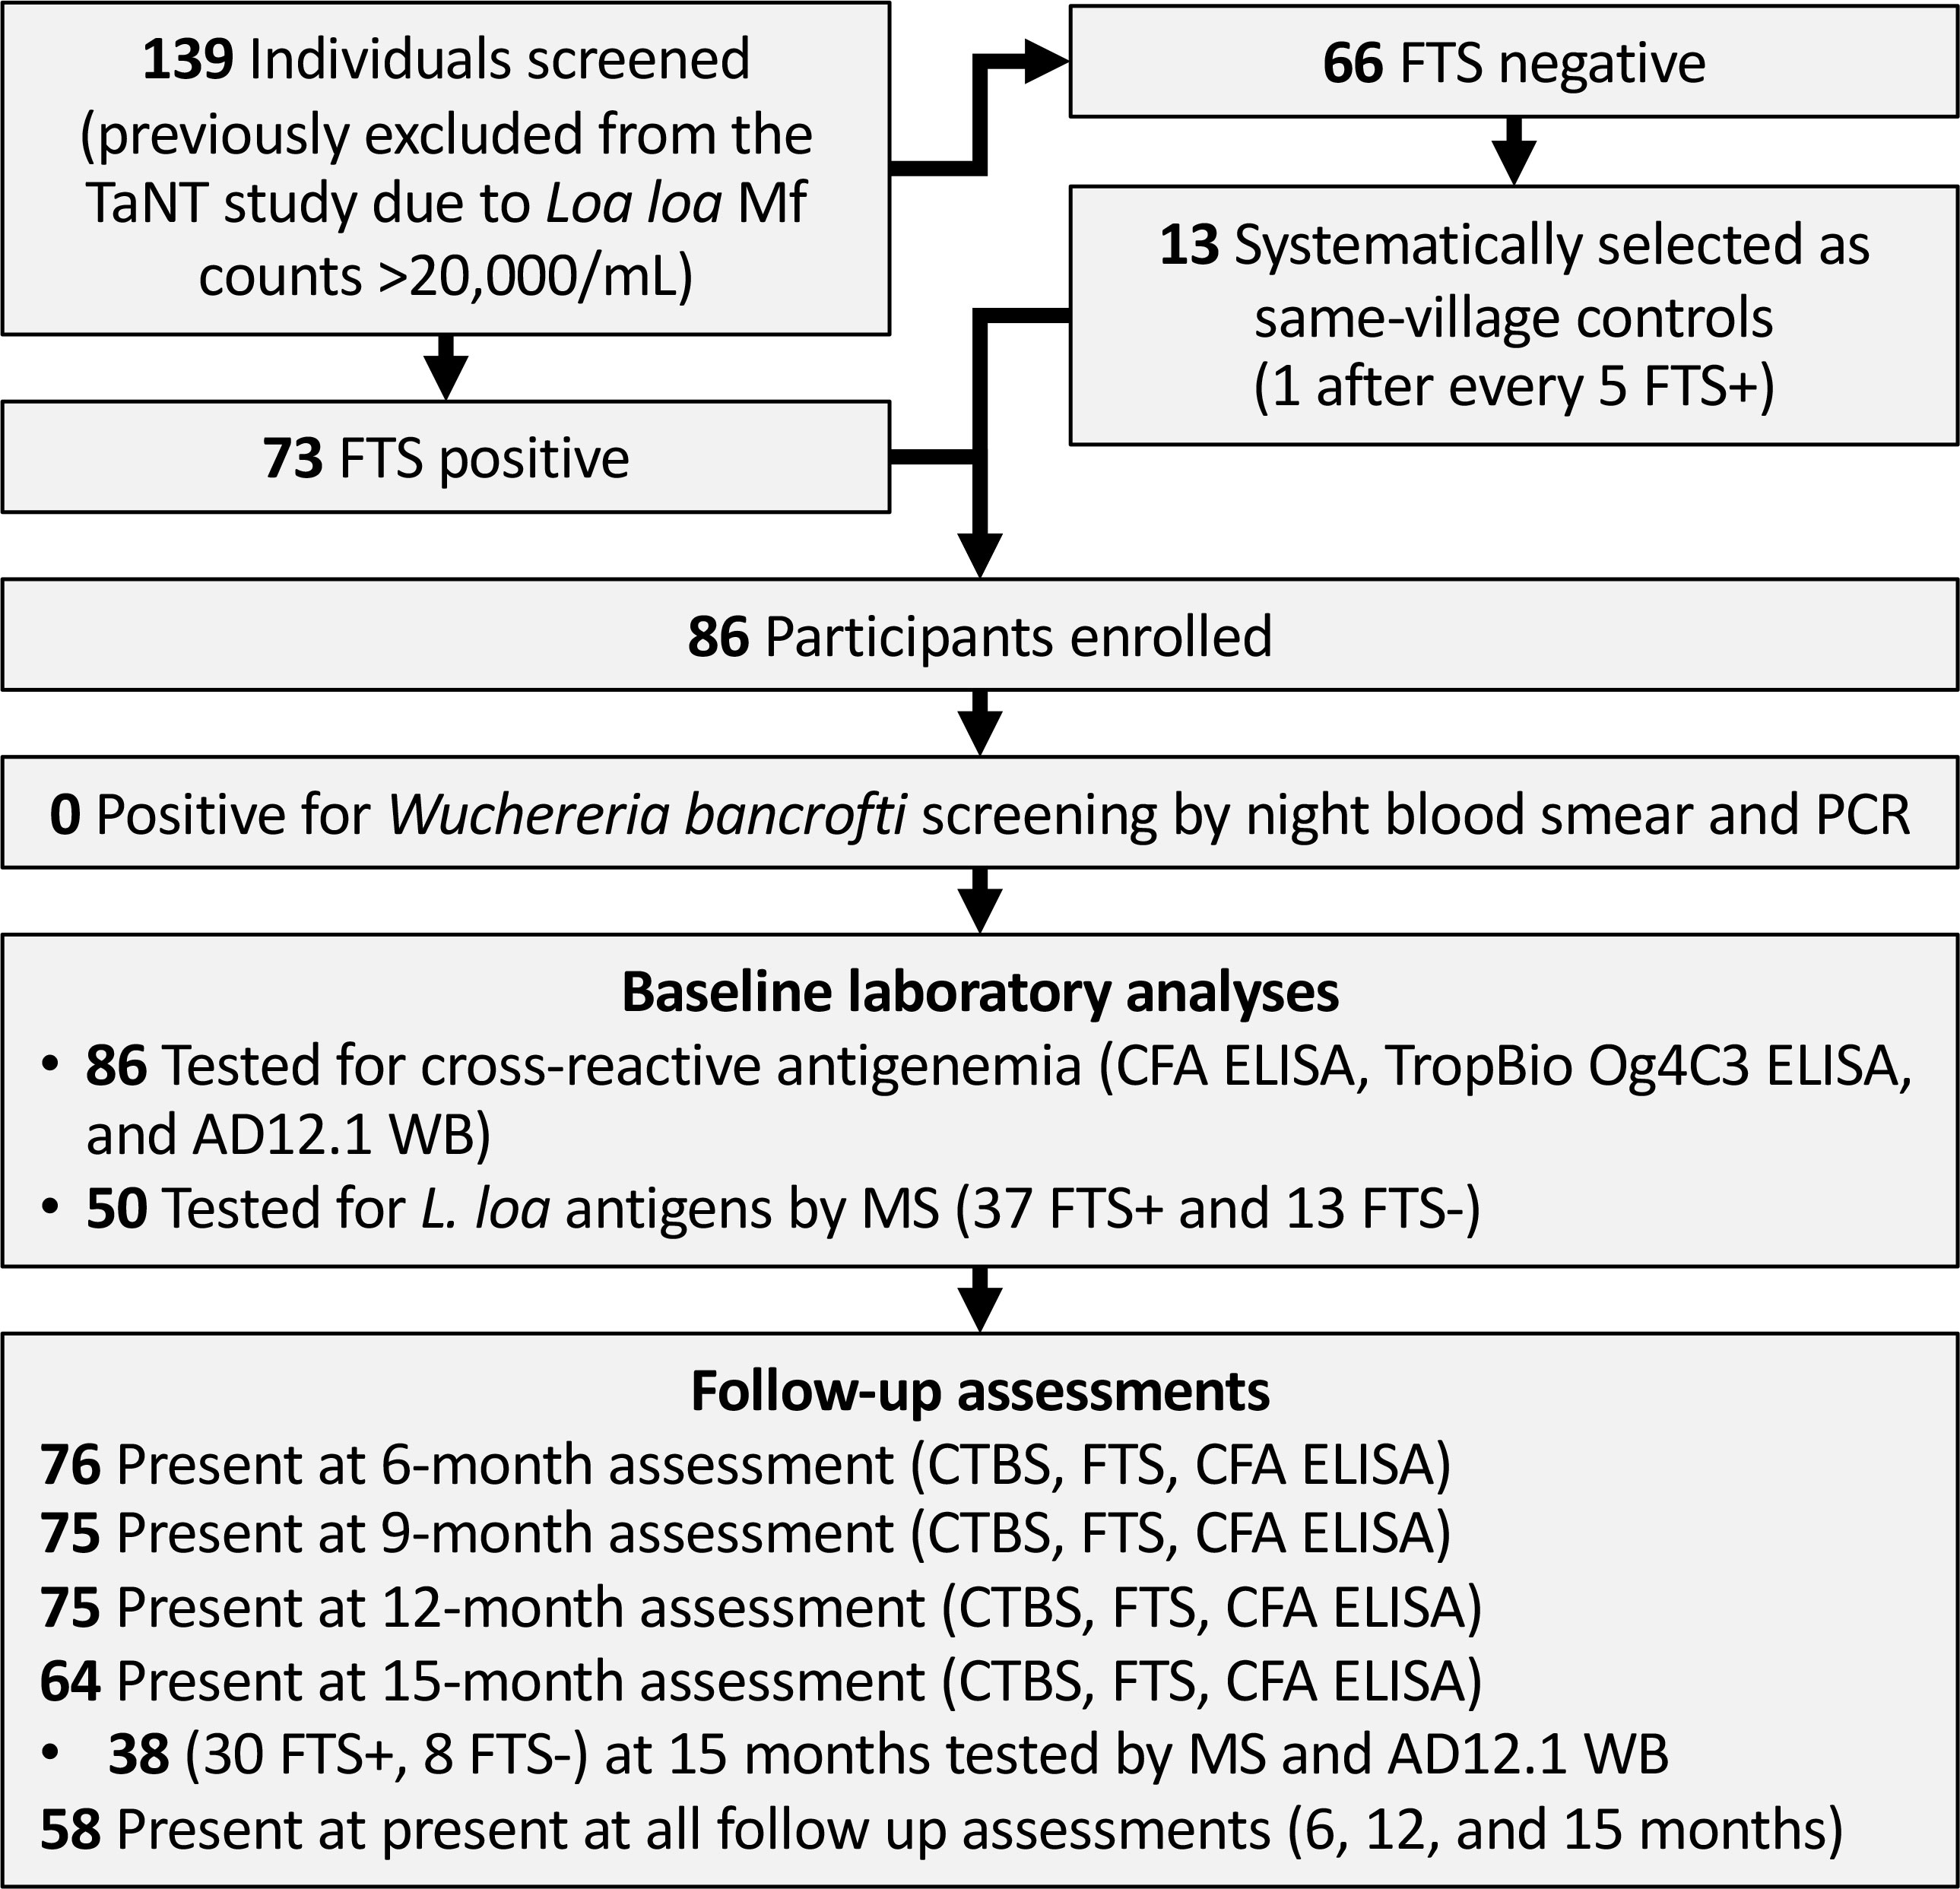
Figure 1 Flow chart showing field study, sample collection and analyses. TaNT, Test and Not Treat; FTS, Filariasis Test Strip; CFA, circulating filarial antigen; WB, western blot; MS, mass spectrometry.
2.4 Sample size
The objective of this study was to identify one or more antigens persistently present among those with cross-reactive loiasis, that can be used as biomarker(s) to distinguish cross-reactive loiasis from LF. We define a potential biomarker as an antigen that is detectable in at least 90% of the population of interest. Therefore, a minimal sample size of 50 participants (for mass spectrometry analyses) was sufficient to give us 95% confidence in excluding antigens that are present in less than 80% of samples (1-sided Wilson score lower than the 95% confidence interval).
2.5 LoaScope and calibrated thick blood smear (CTBS)
Blood for L. loa Mf density measurement was collected between 10:00-16:00 and was assessed by LoaScope as previously described (D’Ambrosio et al., 2015), and by calibrated thick blood smear (CTBS). Enrolled participants also underwent nocturnal (between 22:00-02:00) blood collection for CTBS to rule out W. bancrofti. For each CTBS, 70 μL of non-heparinized finger-prick blood was collected using calibrated capillary tube and ~50 μL was spread onto a microscope slide. The slide was then allowed to air dry and was stained with 10% Giemsa using standard procedures (Sasa, 1976). Giemsa-stained smears were examined under a light microscope at 100X magnification for species identification and quantitation of blood dwelling Mf.
2.6 DNA extraction and qPCR for W. bancrofti and L. loa
Nocturnal blood was also tested for W. bancrofti and L. loa DNA by quantitative PCR as previously described (Bakajika et al., 2014). Fingerpick blood was collected on calibrated filter paper discs (TropBio, Cellabs Pty Ltd, NSW, Australia) and allowed to air dry. Three of the six-disc protrusions (calibrated to hold 10 uL each) of each dried blood spot (DBS), equivalent to ~30 µL whole blood, were used for DNA extraction by QIAamp DNA mini kits (Qiagen, Valencia, CA). Quantitative PCR using Taqman Multiplex master mix (Applied Biosystems, Foster City, CA) was performed with an ABI Quant 6 instrument under standard conditions using W. bancrofti and L. loa specific primers and probes as previously described (Rao et al., 2006; Fink et al., 2011).
2.7 Detection and quantification of cross-reactive antigens
L. loa cross-reactive antigens were detected/quantified in this study using several LF assays: the rapid diagnostic test FTS, the TropBio Og4C3 ELISA, the in-house (IH) sandwich ELISA, and immunoprecipitative western blot. Details on the antibodies used in the different assays are provided in Table 1.

Table 1 Antibodies used to capture cross-reactive antigens.
2.7.1 Bioline Filariasis test strip (FTS)
Cross-reactive loiasis antigens were detected by FTS (Abbott Diagnostics, Scarborough, Maine, USA) as per manufacturer’s recommendations. The test results were read at 10 min and recorded according to a grading procedure described by Chesnais et al. (2013). Negative tests (no visible test line) were scored as zero, FTS with a clearly visible test line weaker than the control line were scored as 1, those with test lines of similar intensity as the control line were scored as 2, and those with test lines darker than the control lines were scored as 3.
2.7.2 In-house CFA ELISA
Detection of L. Loa cross-reactive antigens by sandwich ELISA was performed as previously described, using two analog monoclonal antibodies (AD12.1 and DH6.5) that recognize the same carbohydrate moiety (Weil et al., 1987; Hertz et al., 2018). Briefly, plates were coated with monoclonal antibody DH6.5 at 20 µg/mL in 0.01 M carbonate buffer, pH 8, and incubated overnight at 37°C. Wells were washed with phosphate-buffered saline (PBS) containing 0.05% Tween-20 (PBS-T) and subsequently blocked with 200 µL of 5% fetal calf serum in PBS-T for one hour at 37°C. Human sera were mixed 1:1 with 0.1M EDTA and heated at 56°C for 30 min to dissociate immune complexes (Weil and Liftis, 1987). Fifty microliters of treated sera were then added to the wells and incubated for two hours at 37°C. Wells were washed 3 times with PBS-T and incubated with HRP-conjugated monoclonal antibody AD12.1 for one hour at 37°C. After a final round of three PBS-T washes, 100 µL O-phenylenediamine dihydrochloride (OPD, Thermo Fisher Scientific Inc., Waltham, Massachusetts, USA) substrate was added and allowed to develop for 15 minutes. The reaction was stopped by adding 30 µL of 4 M sulfuric acid, and absorbance was read at 492nm. Cross-reactive antigen levels were determined by automated fit to a calibration curve standard. An antigen value ≥ 6 ng/mL was considered as positive for the CFA ELISA assay.
2.7.3 TropBio Og4C3 ELISA
The TropBio Og4C3 ELISA test kit was used following the manufacturer (TropBio Pty ldt, Queensland, Australia) instructions. Briefly, 100 μL of each individual plasma sample was mixed with 300 μL EDTA solution and boiled at 100°C for 5 min to release the heat stable CFA in positive specimens. After centrifugation (10,000 rpm for 5 min), 50 μL of supernatant was added, in duplicate, to plates previously precoated with the monoclonal anti-filarial antibody Og4C3. Serial dilutions of the supplied positive and negative controls were included in duplicates. After overnight incubation, plates were washed as before then incubated for 1 hour at room temperature with 50 μL of rabbit anti-CFA antibody. After a final washing, the plate was incubated for one hour at room temperature with 50 μL of anti-rabbit horse-radish-peroxidase-conjugate. Plates were developed by addition of the supplied substrate, and the optical density (OD) was read at 450 nm. An ELISA signal ≥ 0.2 was considered positive.
2.8 Immunoprecipitation of cross-reactive antigens and analyses by western blot and mass spectrometry
To capture cross-reactive antigen, we immunoprecipitated circulating filarial antigens as previously described (Hertz et al., 2018). Affigel-10 beads (Bio-Rad, Hercules, California, United States) were conjugated to monoclonal DH6.5 according to the manufacturer’s protocol. Fifty microliters of DH6.5-conjugated beads were mixed with 1mL of human sera and incubated overnight with rocking at 4°C. The next morning, the beads were washed four times with Thermo wash buffer (15mM NaCl, 1mM EDTA, 25mM Tris pH 7.4, 1% NP-40 and 5% glycerol), then twice in cold PBS to remove the detergent. After washing, beads were suspended in 1X NuPAGE LDS sample buffer (Invitrogen Inc, Carlsbad, California, USA) and incubated at 95°C for 5 min to release bound antigen. Immunoprecipitation products were assayed by western blot and mass spectrometry.
For western blot, proteins eluted from DH6.5 conjugated beads were separated by SDS-PAGE using a 4-12% bis-tris NuPAGE gels (Invitrogen Inc, Carlsbad, California, USA) and transferred to nitrocellulose membranes (Amersham BioSciences, Buckinghamshire, UK). Blots were incubated with blocking buffer [5% milk in phosphate-buffered saline with 0.05% Tween-20 (PBS-T)] for one hour, then incubated for one hour at room temperature with HRP-conjugated AD12.1.1 antibody, diluted 1:3000 in blocking buffer. Membranes were washed three times in PBS-T and incubated with Clarity Western ECL substrate (Bio-Rad, Hercules, California, United States) for chemiluminescence detection using an Azure c600 imager.
Immunoprecipitated samples were prepared for LC- MS as previously described (Hertz et al., 2018) and analyzed by mass spectrometry using a TimsTOF PRO spectrometer coupled to a nanoElute LC system (Bruker) or a Q-Exactive coupled to an Easy-nano-LC1000 (Thermo Scientific). Data from the mass spectrometer were converted to peak lists and the MS2 spectra were analyzed using Peaks software (Ma et al., 2003) (Bioinformatics Solutions, Waterloo, Ontario Canada; Peaks Studio version 10.6). Peaks was set up to search against a custom database of L. loa proteins (12,473 entries; version WBPS15 downloaded from parasite.wormbase.org in August 2020 (Tallon et al., 2014), assuming the digestion enzyme was trypsin with a maximum of 3 missed cleavages allowed. For timsTOF data, searches were performed with a fragment ion mass tolerance of 50 ppm and a parent ion tolerance of 25 ppm. For Q-Exactive data, searches were performed with a fragment ion mass tolerance of 20 ppm and a parent ion tolerance of 20 ppm. For all searches, carbamidomethylation of cysteine was specified in Peaks as a fixed modification. Deamidation of asparagine, formation of pyro-glutamic acid from N-terminal glutamine, acetylation of protein N-terminus, oxidation of methionine, and pyro-carbamidomethylation of N-terminal cysteine were specified as variable modifications. Peptide hits were cross-referenced against a human database (ENSEMBL for Human contaminants (Homo_sapiens.GRCh37.72 ENHU, version June 2016) to eliminate potential human peptides. Qualifying peptides had less than 1% false discovery rate and were absent from the human database.
We limited our list of detected proteins to those with at least one unique peptide (i.e. not shared with other L. loa or human proteins) detected with at least 2 mass features and a negative log P-value of 20 or higher (as defined by Peaks). We considered proteins detected in at least 80% of participant samples as potential cross-reactive biomarkers for loiasis. Each batch of participant samples included at least one endemic control and one non-endemic control (see study design). We excluded proteins if more than 10% of detected peptides matched human sequences, or if more than one matching peptide was detected in non-endemic control samples. To better illustrate the presence of one of more members of the Nas-14 family members across all tested samples, non-unique peptides (peptides from identical sequences across family members) were attributed to all family members, rather than only those for which a unique peptide was also detected.
2.9 Functional annotation of top L. loa biomarkers
Functional annotations were assigned to all Loa loa genes in the current genome annotation downloaded from WormBase Parasite (Howe et al., 2017) (PRJNA246086) using (i) Sma3s (version 2) (Casimiro-Soriguer et al., 2017), (ii) PANNZER (2022 release) (Törönen and Holm, 2022), (iii) KEGG gene annotations (Törönen and Holm, 2022) using GhostKOALA v2.2 (Kanehisa et al., 2016), and (iv) results from InterProScan v5.42 (Jones et al., 2014)to identify InterPro functional domains (Blum et al., 2021) and associated gene ontology classifications (The Gene Ontology Consortium, 2021). Potentially secreted proteins were identified using SignalP v5.0 (Almagro Armenteros et al., 2019) to identify signal peptides and to count transmembrane domains. For that analysis, proteins with fewer than 2 TM domains a predicted signal peptide were annotated as having a signal peptide, and proteins with 2 or more transmembrane domains were considered to be transmembrane proteins.
Protein conservation data across nematodes and hosts was quantified using orthologous protein family membership from OrthoFinder (v2.4.1) (Emms and Kelly, 2019), retrieved from Rosa et al. (2023). Additionally, the top BLAST (Altschul et al., 1990) (version 2.13.0+) hit for each L. loa protein to other species (Brugia malayi WS279 PRJNA10729.WBPS16, Onchocerca volvulus WS279 PRJEB513.WBPS16, Wuchereria bancrofti [locally improved annotation] and human GRCh38.106) was also identified, including the E value, alignment length, % identity, and whether the top hit was reciprocal (NCBI blastp v2.13.1+, default settings).
RNA-seq reads were retrieved from a previously published Loa loa dataset (Desjardins et al., 2013) and were mapped to the PRJNA246086 annotation of Loa loa using HiSat2 (v2.2.1), and reads were quantified per gene using featureCounts (from subread package v2.0.3). Stage-specific Brugia malayi gene expression data (PRJEB2709) was also mapped with the same approach to the B. malayi genome (PRJNA10729), and B. malayi genes were assigned to L. loa genes using the top BLAST hit. Relative gene expression in fragments per kilobase per million reads (FPKM) was calculated based on each gene’s length and the total number of reads mapped per sample.
2.10 Data analyses
Participant data collected in Cameroon (demographics, FTS, LoaScope, and CTBS results) were entered into a password protected REDCap database, and statistical analyses were performed using STATA (version. 17.0; StataCorp LLC., College Station, TX, USA). Figures were generated with Graph-Pad prism version 8. Categorical variables (such as gender, positivity to an assay) were summarized using frequencies and 95% confidence interval (CI) (Wilson, 1927). Continuous variables (such as age, Mf density, CFA levels, number of spectral counts) were described using median and interquartile range (IQR). The presence of detectable cross-reactive antigen at each follow-up time point was analyzed as a binary outcome and differences in the proportion of samples positive for cross-reactive antigen was compared using Chi-square test or Fischer exact test when applicable. Kappa statistic was used to determine the strength of agreement between the different CFA detecting assays. Finally, Mf density, antigen levels and peptide detected by MS were compared using Mann Whitney (FTS+ vs. FTS-) or Kruskal Wallis tests (for the different time point), while individual variations of the Mf density and CFA level were compared using Wilcoxon paired or Friedman tests. The cut-off for significance was set at 0.05 for all statistical analyses.
3 Results
3.1 Screening
Overall, 139 individuals aged 18-85 years (median: 49, IQR: 38-65) who were excluded from the TaNT study because of LoaScope Mf counts ≥20, 000Mf/mL were screened for inclusion in this study. One-hundred-thirty-four (96.4%) were microfilaremic for L. loa, with Mf counts ranging from 20-114,240 Mf/mL of blood (Median: 22,780; IQR: 9,280-46,155). Eight (5.8%) of the screened individuals were also microfilaremic for Mansonella perstans. None were positive for W. bancrofti by either nocturnal thick blood smear or qPCR. We did not test for onchocerciasis; we felt that the low likelihood of detecting circulating Onchocerca volvulus antigens did not justify subjecting study participants to skin snips.
3.2 Enrolment and follow-up
Seventy-three of the screened individuals (52.5%) were FTS positive, all of whom were enrolled, along with 13 FTS-negative controls having L. loa Mf counts >20,000/mL (Figure 1). Enrollees were aged 18 to 80 years old (median: 50; IQR: 38-59) and approximately one third (35%) were females.
Among participants who were FTS positive, (78.1%) had a semiquantitative FTS score of 1, 15 (20.5%) had an FTS score of 2, and 1 (1.4%) an FTS score of 3. L. loa Mf counts of FTS-positive enrollees ranged from 6,680 to 114,240 (Median: 34,450; IQR 22,860-54,720) while L. loa Mf counts of FTS negative controls ranged from 21,780 to 98,120 (Median: 42,480; IQR 26,260-49,980) with no statistically significant difference between the two groups (Mann Whitney U: 378; p-value: 0.2494).
To determine whether cross-reactive antigenemia is transient or stable, we followed individuals over time. Over the course of the study, 18 participants were lost to follow-up; 10 (11.6%) withdrew from the study, six (6.9%) moved outside the study area, and two (2.3%) passed away. During follow-up, approximately 75% were present at 6, 9, and 12-months, and 64% were seen at 15-months follow-up. Fifty-eight (67.4%) participants were present during all study visits.
3.3 L. loa Mf counts and FTS status remains constant over 15-months
Among the 58 participants with data at all the time points, 48 (82.8%) did not have a change in FTS status during the study, while 10 (17.2%) experienced at least one FTS conversion event over time. All individuals who experienced FTS conversion events at some point in the study had a semiquantitative FTS score of one at baseline (Figure 2).
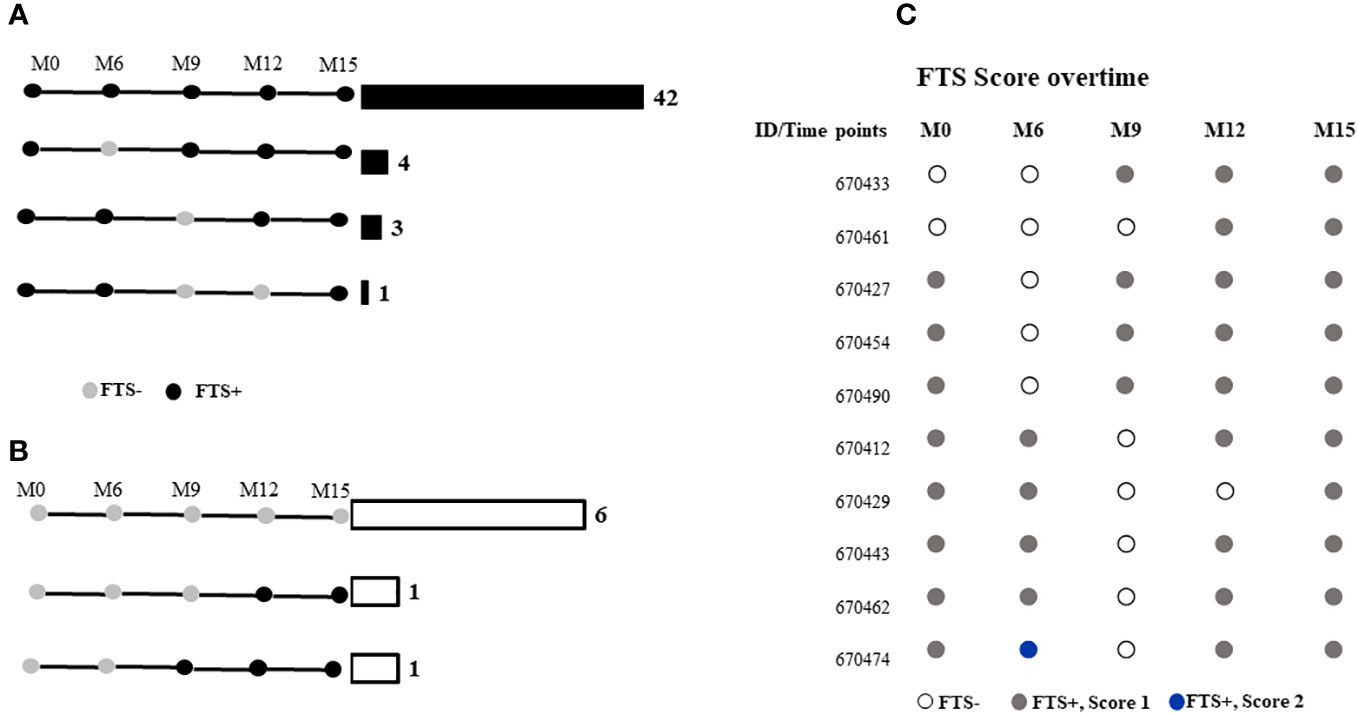
Figure 2 FTS status of participants at months 0, 6-, 9-, 12-, and 15-months post-enrolment among those who were (A) FTS-positive at baseline, or (B) FTS-negative at baseline. Horizontal bars and numbers indicate the number of individuals exhibiting the indicated pattern of antigenemia. (C) Semiquantitative FTS scores over time among participants whose status changed over the course of the study.
Median L. loa Mf densities were stable over time in the study population as a whole, and among the subset of individuals who conserved their FTS status over the course of the study, or among those who experienced at least one FTS conversion event (Figure 3).
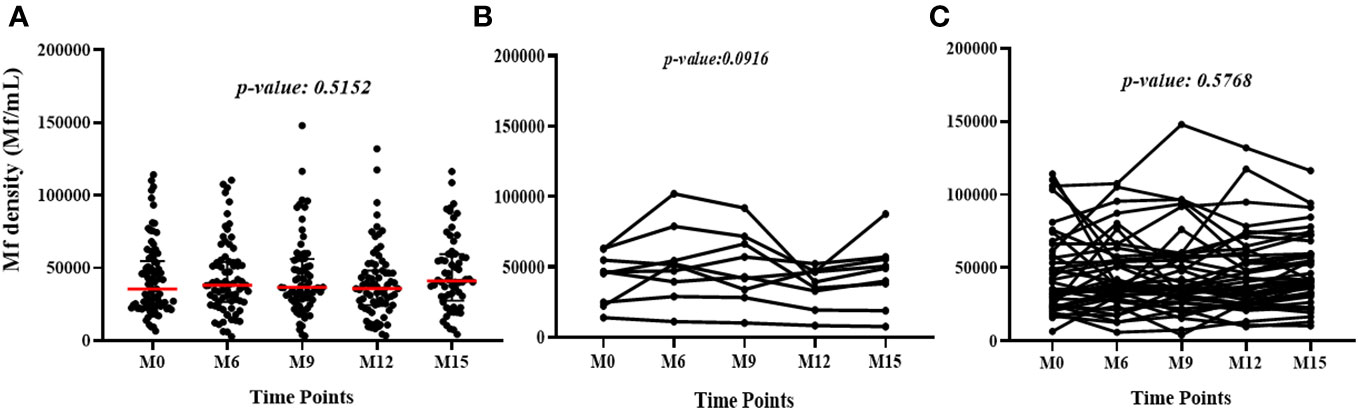
Figure 3 Variation of L. loa Mf counts over time among (A) all participants for all the time points (The p-value shows the comparison of the median Mf count between time points using the Kruskal Wallis test), (B) individuals who experienced FTS status changes (the p-value shows the comparison of individual Mf count over time using Friedman test) and (C) individuals with constant FTS over time (the p-value shows the comparison of individual Mf count over time using Friedman test).
3.4 Quantitative antigen levels
To quantify baseline cross-reactive antigen levels, we used the commercially available TropBio Og4C3 ELISA and an in-house CFA ELISA. There was minimal agreement (kappa score =0.335) between these assays and the FTS; CFA positivity was 35% by in-house ELISA and 69% Og4C3 ELISA (Figure 4). Quantitative CFA ELISA results varied significantly over time (Chi-square: 11.166; p-value: 0.0248; see Table 2).
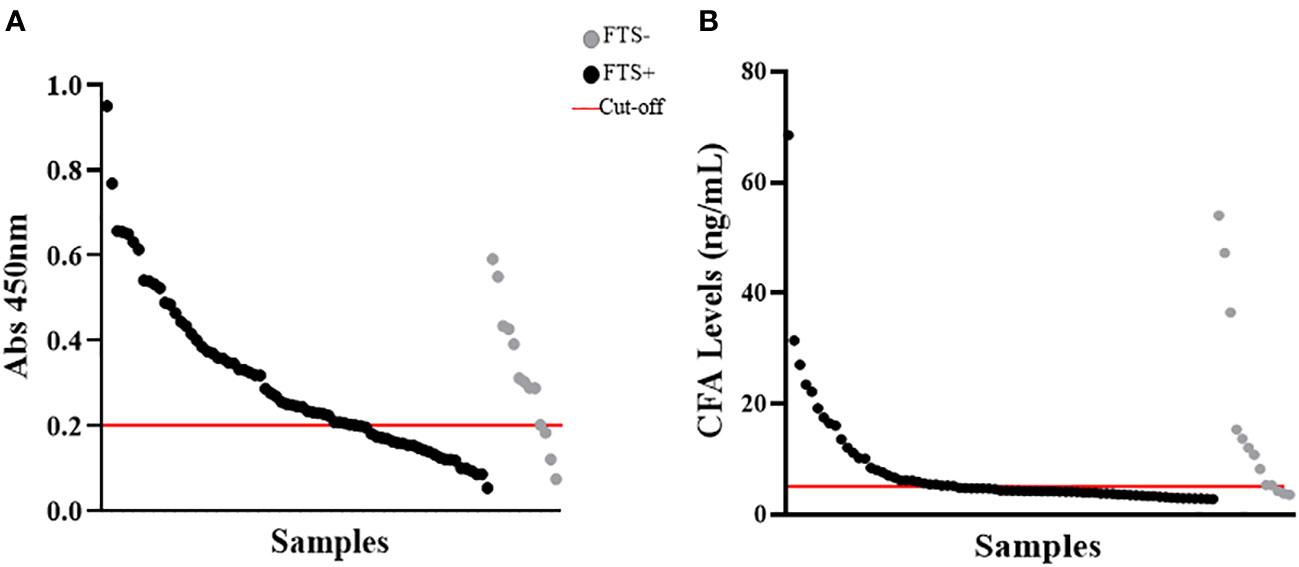
Figure 4 Detection of cross-reactive loiasis antigens by ELISAs at baseline. The x-axis shows the samples (each dot represents a sample) and the y-axis represents the OD in (A) and the cross-reactive antigen concentration in (B). (A) shows the detection of cross-reactive antigens by Og4C3 ELISA and (B) shows the detection of cross-reactive antigens by in-house circulating filarial antigen (CFA) ELISA. In both panels the grey color represents individuals with negative Filariasis Test Strip (FTS) results (n=13), the black color represents individuals with positive FTS results (n=73), and the red line is the cut-off of positivity (set at an antigen level of 6ng for the CFA ELISA and at an OD of 0.2 for the Og4C3 ELISA).
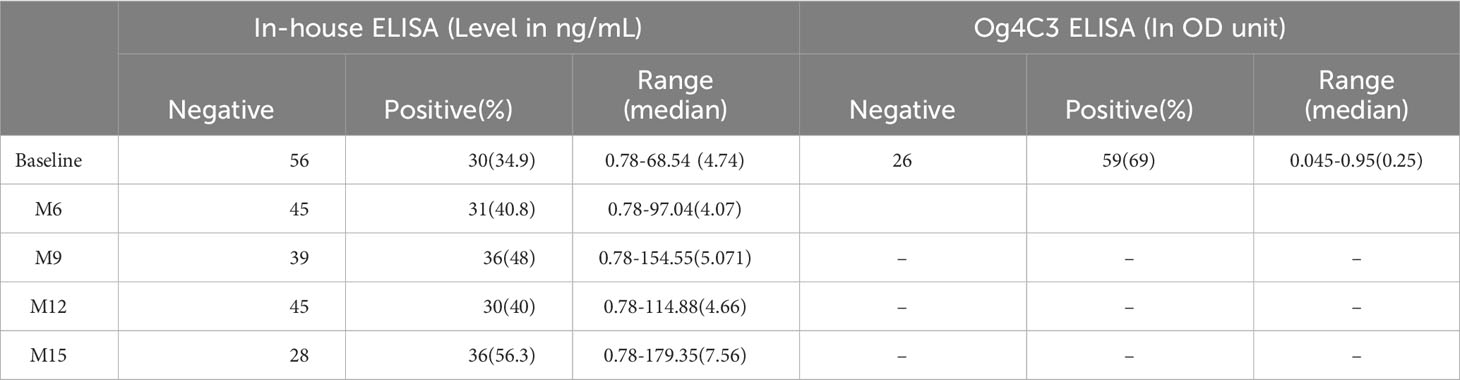
Table 2 Variation of CFA level over time.
3.5 Western blot results
To better characterize the cross-reactive antigens, cross-reactive antigens from all baseline samples (73 FTS-positive and 13 FTS-negative controls) and a portion of the 15-month samples (30 FTS-positive and 8 FTS-negative controls) were immunoprecipitated and detected by western blot. Seventy-nine of the baseline samples (91.9%) and 33/38 15-month samples had at least one reactive protein band by western blot. Notably, a predominant ~80kDa antigen was detected in all positive baseline samples. This ~80kDa antigen was less well detected in the 15-month samples (Figure 5).
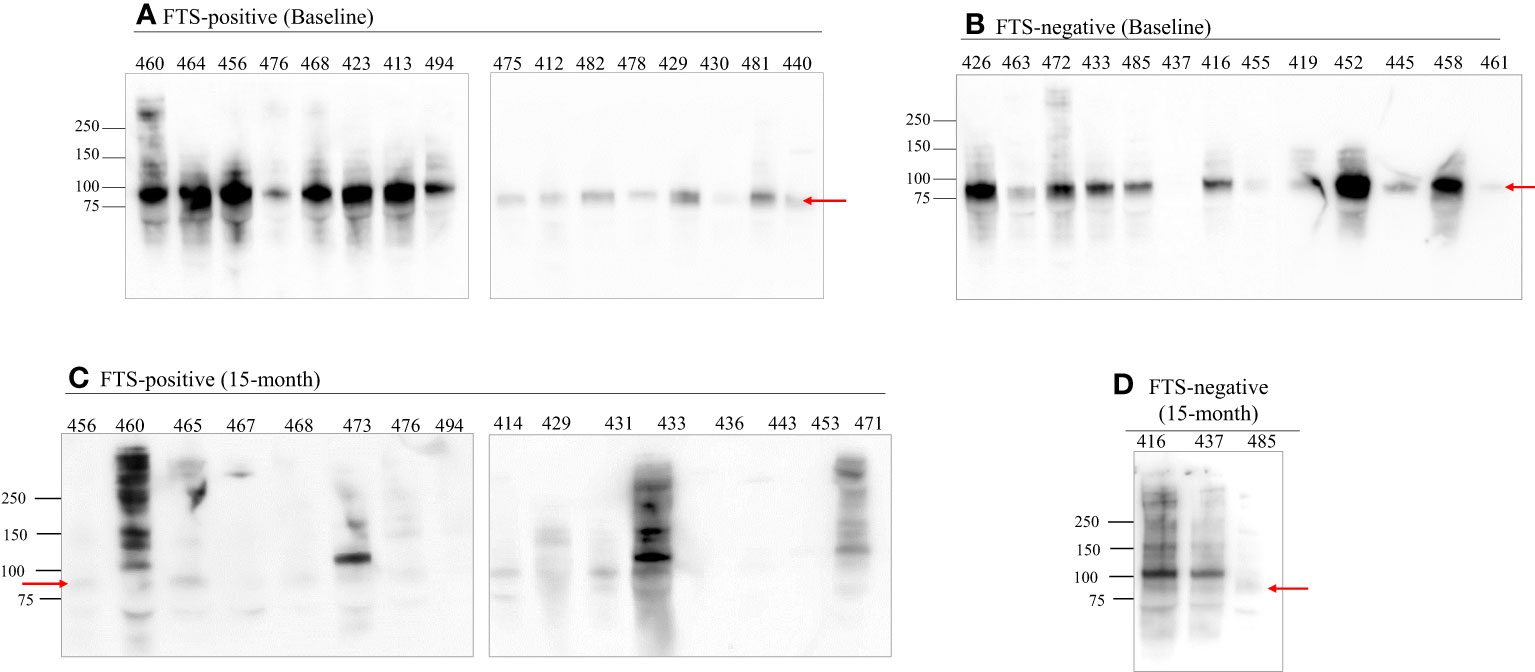
Figure 5 An 80 kDa antigen in predominant in FTS positive and FTS negative loiasis samples. Representative western blots of FTS-positive (A, C) and FTS-negative (B, D) samples show the presence of multiple cross-reactive antigens, including a predominant band at 80kDa (arrow). For each sample, 1mL of serum was immunoprecipitated with DH6.5 antibody-conjugated beads to capture cross-reactive antigens. The proteins were resolved by SDS-PAGE and immunoblotted with AD12-HRP. An abbreviated sample identifier is written above each lane. All baseline (n=86) samples and 38 month 15 samples (30 FTS+ and 9 FTS-) were tested by western blot; representative examples are shown. Although not represented on the figure, the molecular weight corresponding to each detected band was determined using Bio-Rad Precision Plus Protein Standards.
3.6 Agreement between antigen detection methods
No agreement was found between FTS status, CFA ELISA, Og4C3 ELISA, and western blot. Indeed, kappa analysis showed no agreement between FTS and CFA ELISA (Kappa score: -0.1331) or Og4C3 ELISA (Kappa score: -0.0629), nor between western blot and FTS (Kappa score: -0.0079), CFA ELISA (Kappa score: -0.0556), and Og4C3 ELISA (Kappa score: -0.0098). There was minimal agreement was found between the two ELISA formats (Kappa score: 0.2609) (Figure S1).
3.7 Mass spectrometry analysis of potential cross-reactive biomarkers
To identify potential protein biomarkers of cross-reactive loiasis, we used liquid chromatography with tandem mass spectrometry (LC-MS/MS) to analyze immunoprecipitated proteins from 50 baseline samples (37 FTS-positive and 13 FTS-negative) and 38 15-month samples (30 FTS-positive and 8 FTS-negative). Fifty-six L. loa proteins were detected by MS in 50% or more of baseline participant samples (Table S1), and seven proteins met this criterion at 15-months (Table S2). Only nine proteins met our prespecified threshold of detection in at least 80% of loiasis sera (Figure 6); five of these were Nas-14 family metalloproteases. Sequences for all detected proteins are provided are available and posted on a data repository. Unexpectedly, the top biomarker candidates were detected similarly among FTS-positive and FTS-negative loiasis samples (Tables S1, S2).
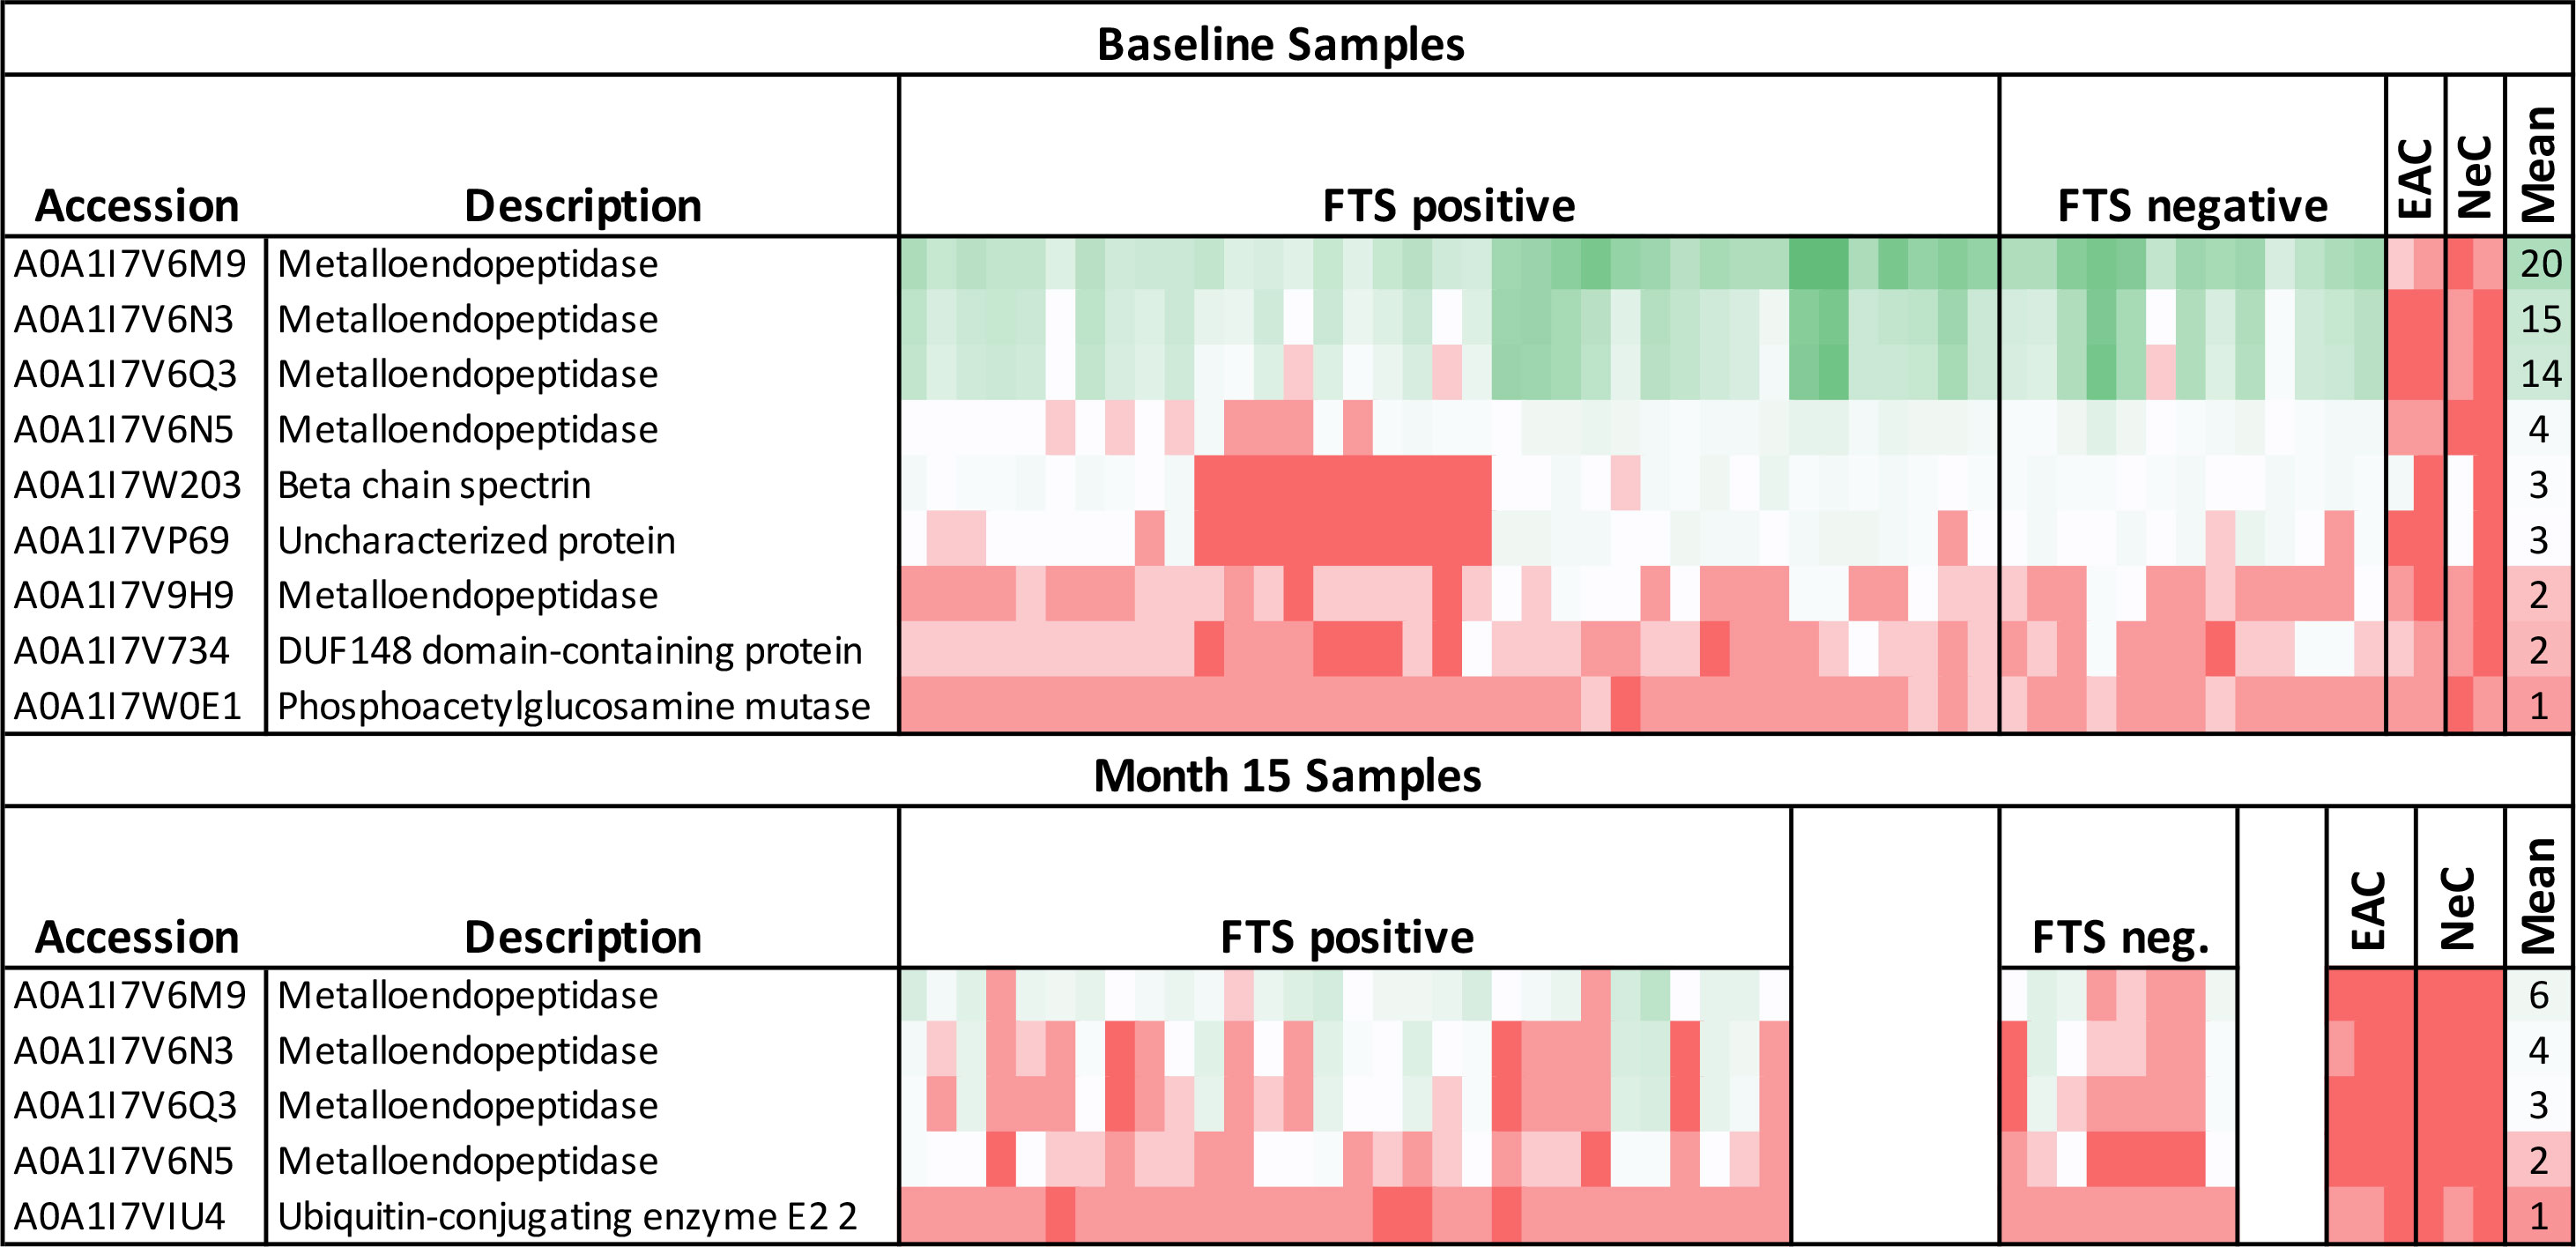
Figure 6 Heatmap of mass spectrometry detection of Loa loa proteins representing protein abundances. The columns represent baseline plasma samples from 50 individual participants, grouped by FTS status (37 FTS-positive and 13 FTS-negative), two endemic, amicrofilaremic controls (EAC), and two non-endemic controls (NeC). Rows represent individual proteins detected, and numbers indicate the number of peptides for each protein detected in each individual sample. The mean number of peptides detected among loiasis samples is indicated as an approximate guide to the color scheme. All the metalloendopeptidase represented here belong to the Nas-14 protein family.
Among baseline samples, a significant correlation was found between Mf counts and the number of L. loa peptides detected per sample (Spearman rho: 0.4336; p-value: 0.0017), but not between the number of L. loa peptides detected per sample and CFA levels measured by in-house ELISA (rho: 0. 0.2508; p-value: 0. 0.0776). For 15-month samples, both Mf density (rho: 0.3832; p-value: 0.0176) and CFA levels (rho: 0.5014; p-value: 0.0013) were correlated with the number of L. loa peptides detected per sample (Figure S2).
Predicted characteristics available via bioinformatics databases for the top ten biomarkers are provided in a Supplemental Table (Table S3). The Nas-14 protease most abundantly detected is a zinc metalloprotease predicted to be secreted, without transmembrane domains. Its predicted percent identity to the closest homologue in other filarial species is 46.5% for Brugia malayi, 52.5% for Onchocerca volvulus, and 59.4% for W. bancrofti. Interestingly, one of the Nas-14 homologues detected is predicted among the top 3% of expressed L. loa proteins (Table S3).
4 Discussion
FTS cross-reactivity in individuals with loiasis represents an obstacle to LF mapping in loiasis-endemic areas. Although loiasis cross-reactivity with LF-RDTs is associated with high L. loa Mf density, it is unclear why only some heavily infected persons are cross-reactive and furthermore why cross-reactive antigenemia is transient in some individuals. This study aimed to investigate the stability of loiasis cross-reactivity over time and determine which L. loa antigens are consistently present in cross-reactive sera. To the best of our knowledge, this study is the largest examination of loiasis cross-reactive antigenemia to date and to examine its persistence over time.
We found that FTS cross-reactivity is relatively stable among individuals with very high L. loa Mf counts over a short time (15 months). Although a proportion of participants experienced FTS status changes from one visit to another, most maintained the same Mf status throughout the study. Among those who did experience FTS conversion events, the changes were from weakly positive (1+) to negative or vice versa; and as observed previously, changes in FTS status were not associated with variation in L. loa Mf density (Hertz et al., 2018). These data suggest that FTS status changes are more likely among individuals with antigen levels near the limit of detection, a pattern more consistent with fluctuations in relatively steady state of antigenemia than with intermittent spikes of antigen release, as previously hypothesized (Hertz et al., 2018). Whether this fluctuation in antigen level is modulated by antigen release from Mf or adult worms, or by fluctuations in antigen clearance remains unclear and represents an avenue for future research. Interestingly, in the month 15 samples the number detected peptides was lower and the western blot patterns were more variable. The reasons for this are unclear but might include seasonal variability in antigen release or clearance. Further studies would be required to test this hypothesis.
Each of the assays used to assess antigenemia in this study (the two ELISA formats, FTS, and AD12.1-HRP western blot) detects filarial antigens by binding to the same carbohydrate moiety (the AD12.1 epitope) (Weil et al., 1987), yet there was little to no agreement between these assays. The reasons for this are unclear but may arise from multiple differences in test formats and reagents. The Og4C3 monoclonal antibody, for example, binds to a broader subset of carbohydrates on a glycan array than the AD12.1 monoclonal antibody (used in the FTS and the in-house ELISA) (Hertz et al., 2020), which may result in recognition of a wider variety of cross-reactive L. loa antigens. Disagreement between the ELISA and FTS may be due to differing availability of cross-reactive epitopes. In the FTS, AD12.1 is immobilized on a nitrocellulose membrane to capture antigens bound to gold-labeled polyclonal anti-filarial antisera, whereas the CFA ELISA uses the analogous antibodies (DH6.5 and AD12.1 recognizing the same carbohydrate moiety) to both capture and detect, theoretically limiting detection to antigens with multiple glycan epitopes. Immunoprecipitation and western blot, although using the same reagents, are not subject to the same limitation since immune complexes formed between antigen and DH6.5 are dissociated after immunoprecipitation making all the available epitopes free for AD12.1 detection during western blot. Additionally, FTS uses a small sample volume (70 µl of fresh whole blood), while the ELISA assays were performed on thawed plasma samples with an intermediate heating step that may alter which epitopes are available for antibody binding. In addition, proteins detected by western blot were concentrated by immunoprecipitation. These differences in detection by different assays underscore our prior observation that L. loa cross-reactive antigenemia is fundamentally different than W. bancrofti antigenemia. While W. bancrofti CFA is a 200+ kDa heat stable glycoprotein containing multiple AD12.1 epitopes (Weil et al., 1987), loiasis cross-reactive antigens are a mixture of glycoproteins that may vary from one individual to another or even within a given individual over time.
An important outcome of this study is the identification of promising candidates for potential loiasis antigen detection assays. Nas-14 family metalloproteases were detected in nearly all loiasis samples by MS. Furthermore, a yet unidentified 80kDa antigen was detectable by western blot in nearly all tested samples, regardless of FTS status. It is not clear whether the 80kDa band is a Nas14 metalloprotease, but this seems unlikely; the predicted molecular weight of Nas-14 is ~37 kDa and we found no relationship between Nas-14 presence/abundance and positivity to western blot.
One of our goals in conducting this study was to identify one or more L. loa proteins consistently present in loiasis-infected individuals over time. Such a molecule (or molecules) may prove useful for two reasons. First, if cross-reactive antigens prove to be present in all individuals with loiasis, but at levels not detected by the FTS, a more sensitive assay for such antigens could function as an antigen detection assay for loiasis. Such an assay could improve mapping and clinical monitoring of loiasis. Second, an assay specific for cross-reactive Loa antigens would aid LF elimination programs. Although a positive test for cross-reactive Loa antigens would not rule out the possibility of W. bancrofti co-infection, at the population level the absence of any FTS positive individuals not also positive for Loa antigens would suggest that bancroftian filariasis was rare or absent.
One important limitation of our study was the inclusion of only individuals with very high L. loa Mf counts. It was necessary to screen heavily infected individuals to identify a large cohort of individuals with cross-reactive antigenemia. This also provided an optimal population for biomarker discovery, but our results may not be typical for individuals with lower microfilarial loads. A second limitation is our inability to definitively exclude co-infection with other filarial infections. Although we tested for blood-borne microfilariae (L. loa, W. bancrofti and M. perstans) by thick blood smear, and ruled out W. bancrofti coinfection by PCR, we did not test for O. volvulus However, it is unlikely that our results significantly impacted by O. volvulus co-infection. The study was conducted in a hypo-endemic area for onchocerciasis with Mf prevalence is less than 18% (Kamgno et al., unpublished data) and there is no prior evidence to suggest detection of cross-reactive antigens in individuals with onchocerciasis. Another potential limitation relative to biomarker discovery is that our discovery approach relied on immunoprecipitation with the DH6.5 antibody. In theory, this should capture cross-reactive antigens containing the AD12.1 carbohydrate epitope, yet many antigens captured previously by this method are not predicted to be targets for glycosylation (Hertz et al., 2018). It is possible that our method of immunoprecipitation using the DH6.5 antibody captures non-cross-reactive antigens lacking the AD12.1 carbohydrate that may be complexed with AD12.1-epitope containing cross-reactive antigens.
In conclusion, this study has shown that in individuals with high L. loa Mf counts, FTS status changes occur primarily among individuals with borderline FTS results. Our data confirm that in a large cohort of individuals, multiple L. loa cross-reactive antigens are present in both FTS positive and FTS negative individuals. Finally, this study has identified one or more loiasis proteins that are consistently detected in individuals with heavy loiasis infections. Future work to develop assays using these biomarkers should lead to improved antigen detection tests capable of distinguishing loiasis from lymphatic filariasis.
Data availability statement
The original contributions presented in the study are included in the article/Supplementary Files, further inquiries can be directed to the corresponding author/s.
Ethics statement
The studies involving humans were approved by Regional Ethics Committee for Human Health Research, Centre Region, Cameroun (CE № 05862/CRERSHC/2019) and the Institutional Review Board of the Washington University in Saint Louis (IRB ID #: 01909003). The studies were conducted in accordance with the local legislation and institutional requirements. The participants provided their written informed consent to participate in this study.
Author contributions
LD: Conceptualization, Data curation, Formal Analysis, Investigation, Methodology, Validation, Visualization, Writing – original draft, Writing – review & editing. MH: Conceptualization, Data curation, Formal Analysis, Funding acquisition, Investigation, Methodology, Project administration, Resources, Software, Supervision, Validation, Visualization, Writing – original draft, Writing – review & editing. HN: Conceptualization, Data curation, Formal Analysis, Funding acquisition, Investigation, Methodology, Project administration, Resources, Software, Supervision, Validation, Visualization, Writing – original draft, Writing – review & editing. AR: Formal Analysis, Methodology, Writing – review & editing. PG: Methodology, Resources, Software, Writing – review & editing. RS: Formal Analysis, Methodology, Resources, Software, Writing – review & editing. JB: Formal Analysis, Methodology, Writing – review & editing. RT: Formal Analysis, Methodology, Resources, Software, Writing – review & editing. PN: Writing – review & editing, Conceptualization, Supervision, Validation, Visualization. JK: Conceptualization, Data curation, Formal Analysis, Funding acquisition, Investigation, Methodology, Project administration, Resources, Software, Supervision, Validation, Visualization, Writing – original draft, Writing – review & editing. PB: Conceptualization, Data curation, Formal Analysis, Funding acquisition, Investigation, Methodology, Project administration, Resources, Software, Supervision, Validation, Visualization, Writing – original draft, Writing – review & editing.
Funding
The author(s) declare financial support was received for the research, authorship, and/or publication of this article. This study was funded by the Doris Duke foundation (Grant number: 2019082). The funder had no role in study design, data collection and analysis, decision to publish, or preparation of the manuscript. PJB was supported in part by the National Institute of Allergy and Infectious Diseases grant K08AI121422.
Acknowledgments
The authors are very grateful to the community health personnel of the Okola Health District staff for their implication and facilitation. We are also thankful to all the participants for their availability and cooperation. We thank Bruce Rosa for help with generating and formatting of the supplementary data tables. The expert technical assistance of Petra Erdmann-Gilmore, Dr. Yiling Mi, Alan Davis, and Rose Connors is gratefully acknowledged. The proteomic experiments were performed at the Washington University Proteomics Shared Resource (WU-PSR), R Reid Townsend MD. PhD., Director, Drs. Robert W. Sprung and Qiang Zhang, PhD., Co-Directors. The WU-PSR is supported in part by the WU Institute of Clinical and Translational Sciences (NCATS UL1 TR000448), the Mass Spectrometry Research Resource (NIGMS P41 GM103422) and the Siteman Comprehensive Cancer Center Support Grant (NCI P30 CA091842).
Conflict of interest
The authors declare that the research was conducted in the absence of any commercial or financial relationships that could be constructed as a potential conflict of interest.
The author(s) HND declared that they were an editorial board member of Frontiers, at the time of submission. This had no impact on the peer review process and the final decision.
Publisher’s note
All claims expressed in this article are solely those of the authors and do not necessarily represent those of their affiliated organizations, or those of the publisher, the editors and the reviewers. Any product that may be evaluated in this article, or claim that may be made by its manufacturer, is not guaranteed or endorsed by the publisher.
Supplementary material
The Supplementary Material for this article can be found online at: https://www.frontiersin.org/articles/10.3389/fpara.2023.1292837/full#supplementary-material
Supplementary Figure 1 | Comparison between the different AD12 epitope detecting assays. (A) Compare FTS and IH sandwich ELISA. (B) Compare FTS and TropBio ELISA. (C) Compare the two ELISA formats. (D) Compare FTS and western blot. (E) Compare TropBio ELISA and western blot. (F) Compare IH sandwich ELISA and western blot.
Supplementary Figure 2 | Correlation between the number of MS peptides, Mf density and antigen levels. (A) Shows the correlation between the number of MS peptides and Mf density at baseline. (B) Shows the correlation between the number of MS peptide antigen level determined by IH sandwich ELISA at baseline. (C) Shows the correlation between the number of MS peptides and Mf density at 15-month. (B) Shows the correlation between the number of MS peptide antigen level determined by IH sandwich ELISA at 15-month.
Supplementary Table 1 | Heatmap of mass spectrometry detection of Loa loa proteins representing protein abundances for baseline samples.
Supplementary Table 2 | Heatmap of mass spectrometry detection of Loa loa proteins representing protein abundances for 15-months samples.
Supplementary Table 3 | Predicted characteristics available via bioinformatics databases for the top ten biomarkers.
References
Almagro Armenteros J. J., Tsirigos K. D., Sønderby C. K., Petersen T. N., Winther O., Brunak S., et al. (2019). SignalP 5.0 improves signal peptide predictions using deep neural networks. Nat. Biotechnol. 37, 420–423. doi: 10.1038/s41587-019-0036-z
Altschul S. F., Gish W., Miller W., Myers E. W., Lipman D. J. (1990). Basic local alignment search tool. J. Mol. Biol. 215, 403–410. doi: 10.1016/S0022-2836(05)80360-2
Bakajika D. K., Nigo M. M., Lotsima J. P., Masikini G. A., Fischer K., Lloyd M. M., et al. (2014). Filarial antigenemia and Loa loa night blood microfilaremia in an area without bancroftian filariasis in the Democratic Republic of Congo. Am. J. Trop. Med. hygiene 91, 1142–1148. doi: 10.4269/ajtmh.14-0358
Blum M., Chang H.-Y., Chuguransky S., Grego T., Kandasaamy S., Mitchell A., et al. (2021). The InterPro protein families and domains database: 20 years on. Nucleic Acids Res. 49, D344–D354. doi: 10.1093/nar/gkaa977
Casimiro-Soriguer C. S., Muñoz-Mérida A., Pérez-Pulido A. J. (2017). Sma3s: A universal tool for easy functional annotation of proteomes and transcriptomes. PROTEOMICS 17, 1700071. doi: 10.1002/pmic.201700071
Chesnais C. B., Awaca-Uvon N.-P., Bolay F. K., Boussinesq M., Fischer P. U., Gankpala L., et al. (2017). A multi-center field study of two point-of-care tests for circulating Wuchereria bancrofti antigenemia in Africa. PloS Negl. Trop. Dis. 11, e0005703. doi: 10.1371/journal.pntd.0005703
Chesnais C. B., Missamou F., Pion S. D. S., Bopda J., Louya F., Majewski A. C., et al. (2013). Semi-quantitative scoring of an immunochromatographic test for circulating filarial antigen. Am. J. Trop. Med. Hyg 89, 916–918. doi: 10.4269/ajtmh.13-0245
D’Ambrosio M. V., Bakalar M., Bennuru S., Reber C., Skandarajah A., Nilsson L., et al. (2015). Point-of-care quantification of blood-borne filarial parasites with a mobile phone microscope. Sci. Transl. Med. 7, 286re4. doi: 10.1126/scitranslmed.aaa3480
Deribe K., Bakajika D. K., Zoure H. M.-G., Gyapong J. O., Molyneux D. H., Rebollo M. P. (2020). African regional progress and status of the programme to eliminate lymphatic filariasis: 2000–2020. Int. Health 13, S22–S27. doi: 10.1093/inthealth/ihaa058
Desjardins C. A., Cerqueira G. C., Goldberg J. M., Hotopp J. C. D., Haas B. J., Zucker J., et al. (2013). Genomics of Loa loa, a Wolbachia-free filarial parasite of humans. Nat. Genet. 45, 495–500. doi: 10.1038/ng.2585
Drame P. M., Meng Z., Bennuru S., Herrick J. A., Veenstra T. D., Nutman T. B. (2016). Identification and validation of loa loa microfilaria-specific biomarkers: a rational design approach using proteomics and novel immunoassays. mBio 7, e02132. doi: 10.1128/mBio.02132-15
Emms D. M., Kelly S. (2019). OrthoFinder: phylogenetic orthology inference for comparative genomics. Genome Biol. 20, 238. doi: 10.1186/s13059-019-1832-y
Fink D. L., Kamgno J., Nutman T. B. (2011). Rapid molecular assays for specific detection and quantitation of Loa loa microfilaremia. PloS Negl. Trop. Dis. 5, e1299. doi: 10.1371/journal.pntd.0001299
Gardon J., Gardon-Wendel N., Demanga-Ngangue, Kamgno J., Chippaux J.-P., Boussinesq M. (1997). Serious reactions after mass treatment of onchocerciasis with ivermectin in an area endemic for Loa loa infection. Lancet 350, 18–22. doi: 10.1016/S0140-6736(96)11094-1
Herrera J. S., Franco-Paredes C., Santos-Preciado J. I. (2011). The global burden of neglected tropical diseases. Boletín Médico del Hosp. Infantil México 68, 78–82.
Hertz M. I., Nana-Djeunga H., Kamgno J., Njouendou A. J., Chunda V. C., Wanji S., et al. (2018). Identification and characterization of Loa loa antigens responsible for cross-reactivity with rapid diagnostic tests for lymphatic filariasis. PloS Negl. Trop. Dis. 12, e0006963. doi: 10.1371/journal.pntd.0006963
Hertz M. I., Rush A., Nutman T. B., Weil G. J., Bennuru S., Budge P. J. (2020). Characterization of glycan determinants that mediate recognition of the major Wuchereria bancrofti circulating antigen by diagnostic antibodies. Mol. Biochem. Parasitol. 240, 111317. doi: 10.1016/j.molbiopara.2020.111317
Howe K. L., Bolt B. J., Shafie M., Kersey P., Berriman M. (2017). WormBase ParaSite – a comprehensive resource for helminth genomics. Mol. Biochem. Parasitol. 215, 2–10. doi: 10.1016/j.molbiopara.2016.11.005
Jones P., Binns D., Chang H.-Y., Fraser M., Li W., McAnulla C., et al. (2014). InterProScan 5: genome-scale protein function classification. Bioinformatics 30, 1236–1240. doi: 10.1093/bioinformatics/btu031
Kamgno J., Pion S. D., Chesnais C. B., Bakalar M. H., D’Ambrosio M. V., Mackenzie C. D., et al. (2017). A test-and-not-treat strategy for onchocerciasis in loa loa–endemic areas. New Engl. J. Med. 377, 2044–2052. doi: 10.1056/NEJMoa1705026
Kanehisa M., Sato Y., Morishima K. (2016). BlastKOALA and ghostKOALA: KEGG tools for functional characterization of genome and metagenome sequences. J. Mol. Biol. 428, 726–731. doi: 10.1016/j.jmb.2015.11.006
Kelly-Hope L. A., Stanton M. C., Zouré H. G. M., Kinvi B. E., Mikhailov A., Tekle A., et al. (2017). A practical approach for scaling up the alternative strategy for the elimination of lymphatic filariasis in Loa loa endemic countries - developing an action plan. Glob Health Res. Policy 2, 12. doi: 10.1186/s41256-017-0032-0
Kouam M. K., Tchatchueng-Mbougua J. B., Demanou M., Boussinesq M., Pion S. D., Kamgno J. (2013). Impact of repeated ivermectin treatments against onchocerciasis on the transmission of loiasis: an entomologic evaluation in central Cameroon. Parasites Vectors 6, 283. doi: 10.1186/1756-3305-6-283
Lindsay S., Thomas C. (2000). Mapping and estimating the population at risk from lymphatic filariasis in Africa. Trans. R. Soc. Trop. Med. Hygiene 94, 37–45. doi: 10.1016/S0035-9203(00)90431-0
Ma B., Zhang K., Hendrie C., Liang C., Li M., Doherty-Kirby A., et al. (2003). PEAKS: powerful software for peptide de novo sequencing by tandem mass spectrometry. Rapid Commun. Mass Spectrometry 17, 2337–2342. doi: 10.1002/rcm.1196
Ministry of Public Health (2017). Health population denominators 2017-Cameroon (Yaoundè, Cameroon: Ministry of Public Health).
More S., Copeman D. (1990). A highly specific and sensitive monoclonal antibody-based ELISA for the detection of circulating antigen in bancroftian filariasis. Tropical medicine and parasitology: official organ of Deutsche Tropenmedizinische Gesellschaft and of Deutsche Gesellschaft fur Technische Zusammenarbeit (GTZ) 41, 403–406.
Mwase E. T., Stensgaard A.-S., Nsakashalo-Senkwe M., Mubila L., Mwansa J., Songolo P., et al. (2014). Mapping the geographical distribution of lymphatic filariasis in Zambia. PloS Negl. Trop. Dis. 8, e2714. doi: 10.1371/journal.pntd.0002714
NTD Modelling Consortium Lymphatic Filariasis Group (2019). The roadmap towards elimination of lymphatic filariasis by 2030: insights from quantitative and mathematical modelling. Gates Open Res. 3, 1538–1538. doi: 10.12688/gatesopenres.13065.1
Ottesen E. A. (2000). Editorial: the global programme to eliminate lymphatic filariasis. Trop. Med. Int. Health 5, 591–594. doi: 10.1046/j.1365-3156.2000.00620.x
Pion S., Montavon C., Chesnais C., Kamgno J., Wanji S., Klion A., et al. (2016). Positivity of Antigen Tests Used for Diagnosis of Lymphatic Filariasis in Individuals Without Wuchereria bancrofti Infection But with High Loa loa Microfilaremia. Am. J. Trop. Med. Hygiene 95, 1417–1423. doi: 10.4269/ajtmh.16-0547
Rao R., Atkinson L., Ramzy R., Helmy H., Farid H., Bockarie M., et al. (2006). A real-time PCR-based assay for detection of Wuchereria bancrofti DNA in blood and mosquitoes. Am. J. Trop. Med. hygiene 74, 826–832.
Rebollo M. P., Bockarie M. J. (2013). Rapid diagnostics for the endgame in lymphatic filariasis elimination. Am. J. Trop. Med. Hyg 89, 3–4. doi: 10.4269/ajtmh.13-0202
Rocha A., Braga C., Belém M., Carrera A., Aguiar-Santos A., Oliveira P., et al. (2009). Comparison of tests for the detection of circulating filarial antigen (Og4C3-ELISA and AD12-ICT) and ultrasound in diagnosis of lymphatic filariasis in individuals with microfilariae. Memórias do Instituto Oswaldo Cruz 104, 621–625. doi: 10.1590/S0074-02762009000400015
Rosa B. A., Curtis K., Erdmann Gilmore P., Martin J., Zhang Q., Sprung R., et al. (2023). Direct proteomic detection and prioritization of 19 onchocerciasis biomarker candidates in humans. Mol. Cell. Proteomics 22, 100454. doi: 10.1016/j.mcpro.2022.100454
Ruberanziza E., Mupfasoni D., Karibushi B., Rujeni N., Kabanda G., Kabera M., et al. (2009). Mapping of lymphatic filariasis in Rwanda. J. Lymphoedema 4, 20–23.
Sasa M. (1976). Human filariasis: a global survey of epidemiology and control (Baltimore, Maryland: University Park Press). xiii + 819.
Tallon L. J., Liu X., Bennuru S., Chibucos M. C., Godinez A., Ott S., et al. (2014). Single molecule sequencing and genome assembly of a clinical specimen of Loa loa,the causative agent of loiasis. BMC Genomics 15, 788. doi: 10.1186/1471-2164-15-788
The Gene Ontology Consortium (2021). The Gene Ontology resource: enriching a GOld mine. Nucleic Acids Res. 49, D325–D334. doi: 10.1093/nar/gkaa1113
Törönen P., Holm L. (2022). PANNZER—A practical tool for protein function prediction. Protein Sci. 31, 118–128. doi: 10.1002/pro.4193
Wanji S., Amvongo-Adjia N., Koudou B., Njouendou A. J., Ndongmo P. W. C., Kengne-Ouafo J. A., et al. (2015). Cross-reactivity of filariais ICT cards in areas of contrasting endemicity of Loa loa and Mansonella perstans in Cameroon: implications for shrinking of the lymphatic filariasis map in the Central African Region. PloS Negl. Trop. Dis. 9, e0004184. doi: 10.1371/journal.pntd.0004184
Wanji S., Amvongo-Adjia N., Njouendou A. J., Kengne-Ouafo J. A., Ndongmo W. P. C., Fombad F. F., et al. (2016). Further evidence of the cross-reactivity of the Binax NOW® Filariasis ICT cards to non-Wuchereria bancrofti filariae: experimental studies with Loa loa and Onchocerca ochengi. Parasites Vectors 9, 267. doi: 10.1186/s13071-016-1556-8
Wanji S., Esum M. E., Njouendou A. J., Mbeng A. A., Chounna Ndongmo P. W., Abong R. A., et al. (2019). Mapping of lymphatic filariasis in loiasis areas: A new strategy shows no evidence for Wuchereria bancrofti endemicity in Cameroon. PloS Negl. Trop. Dis. 13 (3), e0007192. doi: 10.1371/journal.pntd.0007192
Weil G. J., Curtis K. C., Fakoli L., Fischer K., Gankpala L., Lammie P. J., et al. (2013). Laboratory and field evaluation of a new rapid test for detecting Wuchereria bancrofti antigen in human blood. Am. J. Trop. Med. Hyg 89, 11–15. doi: 10.4269/ajtmh.13-0089
Weil G. J., Jain D. C., Santhanam S., Malhotra A., Kumar H., Sethumadhavan K. V., et al. (1987). A monoclonal antibody-based enzyme immunoassay for detecting parasite antigenemia in bancroftian filariasis. J. Infect. Dis. 156, 350–355. doi: 10.1093/infdis/156.2.350
Weil G. J., Liftis F. (1987). Identification and partial characterization of a parasite antigen in sera from humans infected with Wuchereria bancrofti. J. Immunol. 138, 3035–3041. doi: 10.4049/jimmunol.138.9.3035
Wilson E. B. (1927). Probable inference, the law of succession, and statistical inference. J. Am. Stat. Assoc. 22, 209–212. doi: 10.1080/01621459.1927.10502953
World Health Organization (2007). Report of the twenty-second session of the Technical Consultative Committee (TCC) Ouagadougou, 13-17 March 2006. Afr. Programme Onchocerciasis Control, 29–23.
World Health Organization (2010). Progress report 2000-2009 and strategic plan 2010-2020 of the global programme to eliminate lymphatic filariasis: halfway towards eliminating lymphatic filariasis (World Health Organization). Available at: https://apps.who.int/iris/handle/10665/44473 (Accessed June 23, 2021).
World Health Organization (2019). Global programme to eliminate lymphatic filariasis: progress report, 2018–Programme mondial pour l’élimination de la filariose lymphatique: rapport de situation, 2018. Weekly Epidemiological Record= Relevé épidémiologique hebdomadaire 94, 457–470.
World Health Organization (2021). Ending the neglect to attain the sustainable development 402 goals: A road map for neglected tropical diseases 2021–2030. World Health (Geneva: World Health Organization), 403.
Zouré H. G. M., Wanji S., Noma M., Amazigo U. V., Diggle P. J., Tekle A. H., et al. (2011). The geographic distribution of Loa loa in Africa: results of large-scale implementation of the rapid assessment procedure for loiasis (RAPLOA). PloS Negl. Trop. Dis. 5, e1210. doi: 10.1371/journal.pntd.0001210
Keywords: Loiasis, lymphatic filariasis, cross-reactivity, LF-rapid diagnostic tests, biomarker
Citation: Djune-Yemeli L, Hertz M, Nana-Djeunga HC, Rush A, Erdmann-Gilmore P, Sprung R, Bopda JG, Townsend R, Netongo PM, Kamgno J and Budge PJ (2023) Longitudinal study of cross-reactive antigenemia in individuals with high Loa loa microfilarial density reveals promising biomarkers for distinguishing lymphatic filariasis from loiasis. Front. Parasitol. 2:1292837. doi: 10.3389/fpara.2023.1292837
Received: 12 September 2023; Accepted: 27 October 2023;
Published: 17 November 2023.
Edited by:
Vitaliano Cama, Centers for Disease Control and Prevention (CDC), United StatesReviewed by:
Kenneth Pfarr, University Hospital Bonn, GermanyMarco Biamonte, Drugs & Diagnostics for Tropical Diseases, United States
Copyright © 2023 Djune-Yemeli, Hertz, Nana-Djeunga, Rush, Erdmann-Gilmore, Sprung, Bopda, Townsend, Netongo, Kamgno and Budge. This is an open-access article distributed under the terms of the Creative Commons Attribution License (CC BY). The use, distribution or reproduction in other forums is permitted, provided the original author(s) and the copyright owner(s) are credited and that the original publication in this journal is cited, in accordance with accepted academic practice. No use, distribution or reproduction is permitted which does not comply with these terms.
*Correspondence: Philip J. Budge, cGJ1ZGdlQHd1c3RsLmVkdQ==