 Yunlong Liang
- Institute for Social and Economic Research, University of Essex, Colchester, United Kingdom
Background: Socioeconomic disadvantages (SEDs) are associated with chronic pain (CP) and allostatic load (AL). Few prospective population-based studies have examined the relationship between life course SED, CP interference, and CP widespreadness, and there is no prospective population-based study on whether AL mediates the association between SED and CP.
Objective: In this study, we investigated whether the prospective effect of SED on CP at Midlife in the United States (MIDUS) 3 is consistent with the accumulation of risk model and social mobility model, using the National Survey of MIDUS (n = 593). To prepare for the mediation analysis, we tested (1) whether SED would be prospectively associated with AL in the MIDUS 2 biomarker project, (2) whether AL would be prospectively associated with CP, and (3) whether childhood, as a critical period, moderated the association between AL and CP. In addition, the mediating effect of AL on the association between SED and CP was examined.
Method: SED was measured using cumulative scores and disadvantage trajectories derived from latent class trajectory modeling (LCTM). After multiple imputations, analyses were conducted using multinomial logistic regression for CP and negative binomial regression for AL, respectively. Finally, mediation analyses and moderated mediation analyses were performed.
Results: LCTM identified three SED trajectories, namely, constant low, high to low, and medium to high. The results showed that proximal cumulative SED was associated with high-interference CP. Furthermore, compared with the group with constant low SED, the group with medium-to-high SED was significantly associated with high-interference pain and experienced pain in at least three different sites. Cumulative SED and deteriorating SED trajectories were associated with higher AL, consistent with previous studies. Furthermore, childhood SED moderated the effect of AL on CP widespreadness and unexpectedly demonstrated a protective effect, while other associations between AL and CP were not significant. Subsequent mediation analysis did not yield statistically significant evidence.
Conclusions: People who experienced more recent SED or increasing disadvantage throughout their lives were more likely to suffer from CP, and this association was not mediated by physiological system dysregulation caused by chronic stress. Therefore, measures to alleviate AL may not be effective in protecting socioeconomically disadvantaged populations from CP.
1. Introduction
The study of the relationship between socioeconomic dislocation and individual anomic behavior and experiences can be traced back to the inception of sociology (1). Over the past half-century, the American socioeconomic structure has undergone a gradual decline concomitant with the process of deindustrialization and continuous trade disadvantages, which has precipitated a surge in anomic phenomena known as “deaths of despair” (2), which encompass suicides, drug overdoses, and alcoholism deaths among middle-age individuals (3). Coincidentally, the prevalence of chronic pain (CP) among Americans has also increased during the same period (4–7). The conjugate trend underscores the necessity of examining the relationship between socioeconomic disadvantages (SEDs) and CP because CP may not only serve as the intermediary mechanism connecting socioeconomic collapse with the deaths of despair (8, 9) but also play a pivotal role in engendering a more extensive public burden (10). The International Association for the Study of Pain (IASP) defines CP as pain that persists or recurs for more than 3 months (11). A meta-analysis indicates that CP affects approximately 43.5% of the general population in the United Kingdom (12). In the United States, approximately 20.5% of adults suffer from CP each year, which causes substantial burdens on the national health system as well as a considerable productivity loss of over $296 billion (10).
CP is suggested to be a crucial factor in suicides related to deaths of despair (8). Both CP and deaths of despair seem to share an antecedent cause—protracted socioeconomic turmoil. SED reflects an individual's or a group's lower position in the social hierarchy, characterized by their limited economic and social resources, and it encompasses facing economic hardships, social inequality, and reduced access to resources and opportunities compared with more advantaged social groups (13, 14). For decades, SED has been identified as the fundamental cause of chronic disease disparities between different social groups (13). The fundamental cause theory posits that the unequal distribution of flexible resources among individuals is the main driving force for the varying vulnerability of distinct social groups to diseases (13). The accumulation of risk model further links life course SED to health disparities (15). Individuals who consistently face SED are at a heightened risk of exposure to detrimental stressors, or SED can be considered the persistent stressor itself (16), increasing the probability of experiencing CP. Furthermore, the social mobility framework integrates the temporal variations in the level of SED experienced during different stages of life into the accumulation of risk model. The social mobility model elucidates the progression of individuals as they move up or down the social class ladder throughout their entire life span (17, 18). Recent studies have corroborated the trajectory of SED on health outcomes: descending SED is positive for one's wellbeing (19, 20), and the detrimental effect of early-life adversity can be alleviated or even reversed by upward social mobility (21, 22).
A previous topical review has revealed substantial evidence of a statistically significant association between SED and an increased prevalence of CP, elevated levels of pain interference, and a greater extent of CP widespreadness (23). Few cohort studies prospectively examined the differential impacts of life course SEDs on CP widespreadness (24–26) and the recent cohort studies have several limitations. First, only a few population-based prospective studies have investigated the association between SED and pain interference. Similar to the number of pain sites, pain interference is closely linked to functional limitations in patients in pain (27), and such limitations provoke physical, psychological, and societal issues in an individual’s life (28). Thus, it is necessary to incorporate pain interference and the number of pain sites in the examination. Second, chronic illnesses have not been considered a substantial confounder influencing SED (29) and CP (30). In addition, although population-based research on social mobility and low back pain (pain lasting 7 days or more in the past 12 months) exists, the study did not utilize the definition of CP in terms of its duration (31). Therefore, the trajectories of SED link to CP remain unknown. Finally, previous studies have explored the mediation mechanisms of psychological distress (25) and obesity (26), but how SEDs are prospectively linked with CP through sociobiological mechanisms remains unknown.
Allostatic load (AL) is defined as the physiological wear and tear arising from repeated adaptations to chronic stressors (32). It begins with the prolonged activation of the hypothalamus–pituitary–adrenal (HPA) axis and sympathetic nervous system and culminates with elevated levels of glucocorticoids and catecholamines. Over time, the excessive accumulation of these substances can have downstream repercussions and contribute to subclinical or clinical conditions affecting the cardiovascular, metabolic, and immune systems. AL may provide a biosocial framework bridging SED and CP. First, individuals subjected to prolonged SEDs or deteriorating trajectories of such adversities are prone to trigger chronic stress responses and dysregulation across multiple physiological systems (33). In accordance with the theory, several years of empirical evidence consistently show that people who report more SED have higher AL levels (34, 35). Second, the pathology of CP is associated with the physiological dysregulation of systems related to AL (36–38). Specifically, the excessive activation of the HPA axis and sympathetic nervous system, accompanied by subsequent sustained pro-inflammatory states, is related to central sensitization and alterations in pain signaling pathways, resulting in the occurrence or maintenance of nociception (37, 39). Despite the compelling theory linking AL and CP, research investigating the correlation between these two factors, especially in terms of prospective population-based studies, remains scarce. Previous studies have indicated that CP was associated with the dysregulation of the biological stress response to chronic stress (38, 40). Cross-sectional studies based on population samples have discovered that elevated AL was associated with higher levels of CP severity and an increased risk of its occurrence (41, 42). However, previous studies did not incorporate HPA axis biomarkers in constructing AL (42), and the definition of CP used in other studies lacked time specificity (41). Moreover, early CP (30) and medication use (43) were not adjusted for.
Childhood has been recognized as a critical period in both the risk accumulation and social mobility models, and childhood SED could act as a moderator in the association between AL and CP. The critical period emphasizes that during childhood, which is considered a window of biological development, the experience of adversity can have long-lasting and irreversible effects on physiological functions (44). Numerous studies indicate that exposure to chronic stress during the critical period can alter the normal development of the stress response system (45) and disrupt the pain processing pathway (46), thereby exacerbating poor stress responses and amplifying the effects of stress on pain perception in adulthood. Although previous research on the critical period has emphasized the biological consequences of childhood disadvantage and emerging literature has revealed the long-term harmful effects of SED on AL and CP (23, 47), whether the biological long arm of childhood SED magnifies the impacts of chronic stress response on CP in adulthood remains unclear.
Overall, the present research aimed to examine three goals. The first goal was to test whether cumulative SED and SED trajectory would have a prospective association with future CP outcomes. Second, in preparation for mediation analysis, the present study aimed to examine whether SED and SED trajectory would be prospectively related to AL and examine whether AL would be associated with future CP outcomes. Also, the moderation effect of childhood SED on the association between AL and CP was tested. The third goal was to test whether AL would mediate the association between SED and CP, Furthermore, the study aimed to examine whether mediation analyses would be moderated by childhood SED.
2. Methods
2.1. Data
This study used data from the Midlife in the United States (MIDUS) study, which spanned from 1995 to 2014, including three waves of main surveys and a biomarker project. The MIDUS is a national longitudinal study on individual social status, psychological profiles, and biological processes of aging, which started between 1995 and 1996 and followed 7,108 non-institutionalized Americans aged 25–74 years in the contiguous United States. The MIDUS 2 and MIDUS 3 main surveys followed the same group of respondents and collected data through phone interviews and self-administered questionnaires between 2004 and 2006, and 2013 and 2014, respectively. In addition, a total of 1,255 respondents participated in the MIDUS 2 biomarker project conducted from 2004 to 2009 with 201 non-probability samples of the Milwaukee project. The samples meeting the following criteria were incorporated into the final analysis (see Figure 1): (1) samples that completed the baseline survey and two MIDUS follow-up surveys and participated in the biomarker program and (2) samples that provided complete information on the major variables (SED, AL, and CP). The majority of MIDUS data are publicly available and can be accessed through the Inter-University Consortium of Political and Social Research (ICPSR) data repository (https://www.icpsr.umich.edu/web/ICPSR/series/203). However, because of the specificity of geographic and racial information involved in the MIDUS Milwaukee data, additional protection against the disclosure of personally identifying information is required. More information can be found at http://midus.wisc.edu/. With regard to the biomarker project, details are reported in description documents (48, 49).
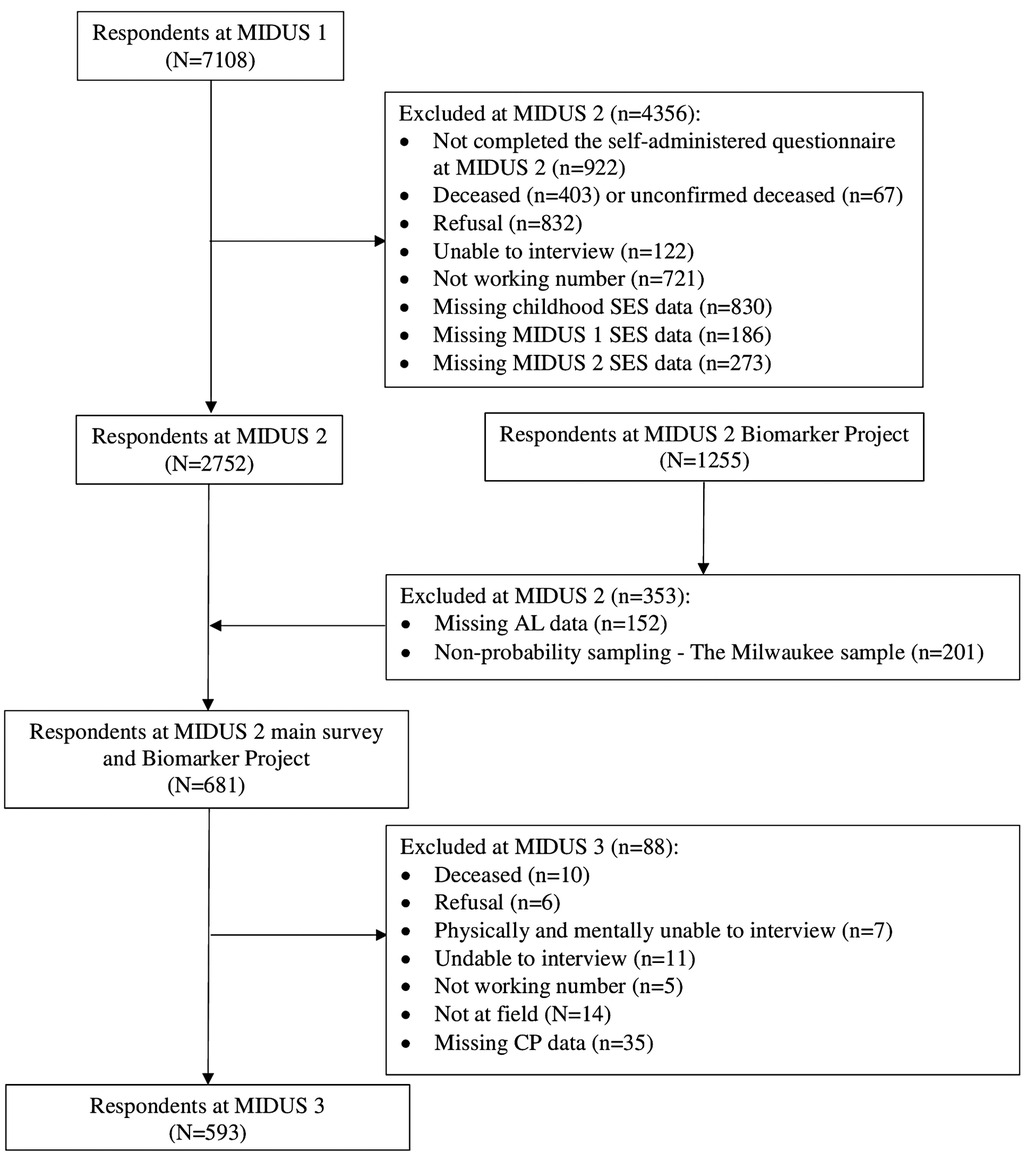
Figure 1. Flowchart for eligible sample.
2.2. Measures
2.2.1. Dependent variable: chronic pain
CP is defined as pain that persists or recurs for more than 3 months (11). CP was measured using two indicators. The present study aimed to explore the prospective relationship between SEDs and CP; therefore, MIDUS 3 data regarding CP interference and the number of pain sites were utilized. The respondents were first asked, “Do you have CP, that is, do you have pain that persists beyond the time of normal healing and has lasted from anywhere from a few months to many years?” If they answered “yes,” they were then asked about CP interference. A pain interference index was generated by calculating the mean score from five questions of how much pain interfered with the respondents’ activity, mood, relations, sleep, and enjoyment, with scores ranging from 0 (no interference) to 10 (complete interference). The items for this index were selected based on the Pain Interference Subscale of the Brief Pain Inventory (50). Then, the CP interference index was further categorized as categorical variables into no pain (respondents without CP), low-interference pain (≤4), and high-interference pain (>4). In addition, if respondents reported experiencing CP, they were asked about the location of the pain across nine regions, including the head, neck, back, arms, legs, shoulders, hips, knees, and other sites. The pain sites were summed up into a count variable and then categorized into no pain, 0–2 sites, or 3 or more sites as a categorical variable. The threshold values for pain interference, the number of pain sites, and the calculation methods for the pain interference scale and the number of pain sites were determined based on established practices from previous studies (27, 43, 50).
2.2.2. Allostatic load
AL biomarkers were collected from the MIDUS 2 biomarker project. The project collected 12-h urine samples, fasting blood samples, and data on nervous system function (48) from respondents during a one-day stay at the General Clinical Research Center of either UCLA, University of Wisconsin, or Georgetown University, depending on where the respondents live.
Building upon previous studies (20, 32), AL was constructed using 27 biomarkers from seven physiological systems (as shown in Table 1). The upper or lower quartiles were used to represent the high-risk threshold of biomarkers (51). Dehydroepiandrosterone sulfate (DHEA-S) and cortisol in their upper or lower 25th quartiles were considered high risk. When high-frequency heart rate variability (HFHRV), low-frequency heart rate variability (LFHRV), root mean square of successive differences (RMSSD), and standard deviation of heart beat–to–heart beat intervals (SDRR) fell within their lower 25th quartiles, they were considered high risk. Other biomarkers with values falling into their upper 25th quartile were assigned to the high-risk range. Biomarkers in their high-risk quartiles were coded as 1; otherwise, they were coded as 0. The AL index was then calculated by summing up the risk scores of the biomarkers (52), with a theoretical range of 0–27.
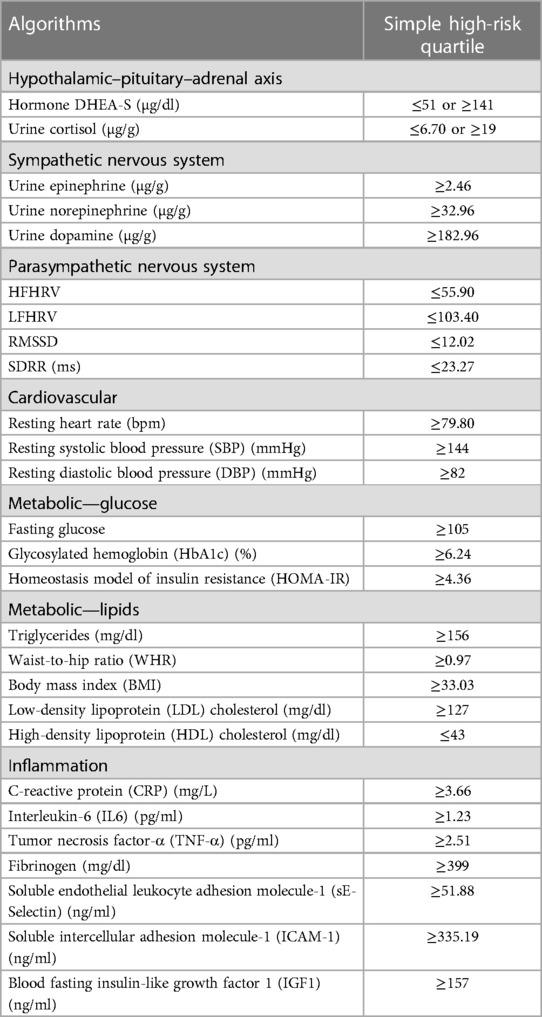
Table 1. High-risk cut-point values for AL biomarkers.
2.2.3. Socioeconomic disadvantages: accumulation and trajectories
The indicator selection and algorithm of SED were based on previous research (20, 53–55). SED was divided into three periods, namely, childhood, adulthood in MIDUS 1, and adulthood in MIDUS 2. In addition, each SED indicator was recoded into an index ranging from 0 to 2, where 0 represented no SED, 1 represented mild/moderate SED, and 2 represented severe SED. Childhood SED was retrospectively collected during the MIDUS 1 period, including the highest level of parental education (0 = bachelor's degree or more, 1 = high school/General Educational Development diploma (GED)/some college, or 2 = less than high school), whether a respondent was on welfare during childhood (0 = no, 2 = yes), and father's occupation (0 = managerial and professional specialty occupations/technical, sales, and administrative support occupations/service occupations; 1 = operators, fabricators, and laborers/farming, forestry, and fishing occupations; or 2 = precision production, craft, and repair occupations/experienced unemployed not classified by occupations).
SED during adulthood (MIDUS 1 and MIDUS 2) included the income-to-needs ratio adjusted for family size and year (0 = affluent/adequate income, 1 = low income, or 2 = poor/extreme poverty), education (0 = bachelor's degree or more, 1 = high school/GED/some college, or 2 = less than high school), rating of current financial situation (0 = best, 1 = medium, or 2 = worst), money to meet needs (0 = more than enough money, 1 = just enough money, or 2 = not enough money), difficulty to pay monthly bills (0 = not at all difficult, 1 = not very difficult/somewhat difficult, or 2 = very difficult), and occupation (0 = managerial and professional specialty occupations/technical, sales, and administrative support occupations/service occupations; 1 = operators, fabricators, and laborers/farming, forestry, and fishing occupations; or 2 = precision production, craft, and repair occupations/experienced unemployed not classified by occupations).
The cumulative indices of SED for childhood and adulthood were calculated by summing up the indicators within each period. In childhood, the index ranged from 0 to 8, while in adulthood (MIDUS 1 and MIDUS 2), it ranged from 0 to 12. The overall SED index, which represents the sum of the indices for all three periods, ranges from 0 to 32 (see Table 2).
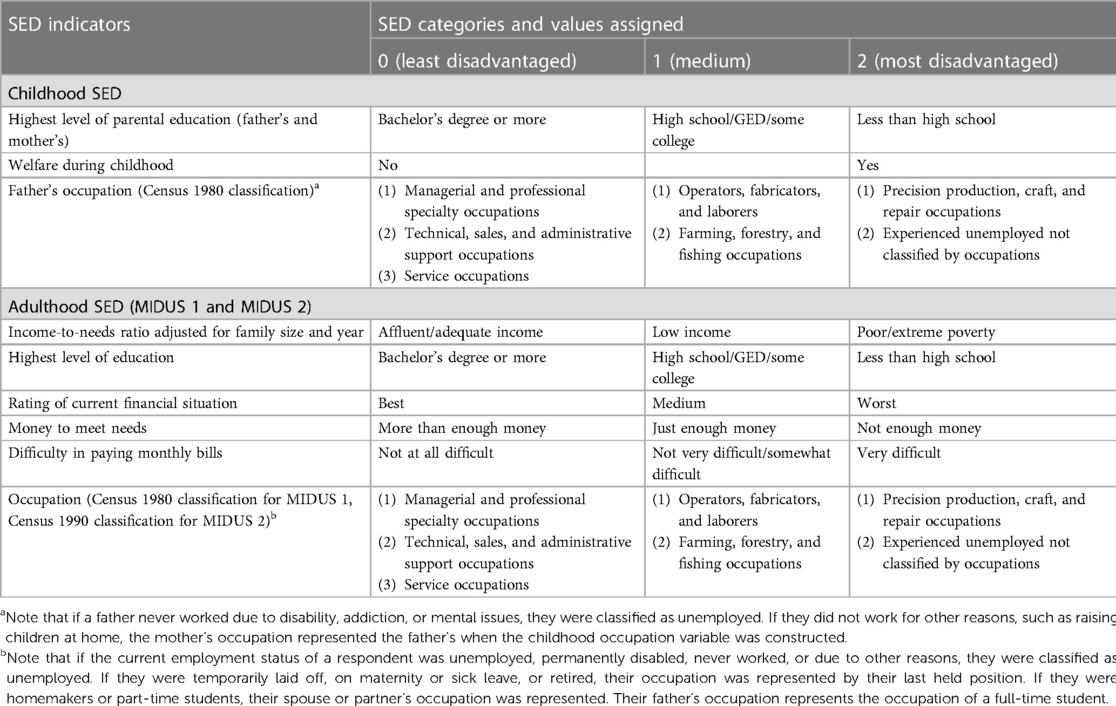
Table 2. SED indicators used to generate the cumulative socioeconomic disadvantage index.
Latent class trajectory modeling (LCTM) was employed to identify groups of SED mobility. The method can simplify heterogeneous individuals in longitudinal changes into groups or clusters with similar trends (56, 57). LCTM was estimated using the R package “lcmm” (58). The trajectory group number was tested from 1 to 5, and the model performance was further improved by random effects (intercepts, slopes, or both), standardized SED index calculations (dividing the period disadvantage index by item count), and reduced skewness with square roots. The optimal trajectory clustering was determined by the lower values of the Akaike information criterion (AIC), the Bayesian information criterion (BIC), and sample size–adjusted BIC (SABIC); the assurance of a minimum of 5% of respondents per class; and the high entropy value (57, 59).
2.2.4. Confounders
The selection of confounders was based on existing knowledge and research findings (20, 41, 43), which aims to screen for confounding effects that exist between SED and AL, SED and CP, and AL and CP, to minimize spurious associations (as shown in Supplementary Tables S1B–F).
With regard to the associations between childhood SED and CP/AL, gender, age at MIDUS 1, race/ethnicity, whether living with a smoker/alcoholic during childhood, whether living with biological parents during childhood, parental health, and emotional/physical abuse from mothers/fathers were adjusted for.
Concerning the links between adulthood SED at MIDUS 1/2 and CP/AL, gender, age at MIDUS 1/2, race/ethnicity, marital status at MIDUS 1/2, number of chronic conditions (60, 61) at MIDUS 1/2, support from family/friends at MIDUS 1/2, personal mastery at MIDUS 1/2, perceived constraint at MIDUS 1/2, smoking behavior at MIDUS 1/2, drinking behavior at MIDUS 1/2, and physical activity at MIDUS 1/2 were controlled for.
Regarding the associations between SED trajectories and CP/AL, we controlled for the confounders from childhood SED and CP/AL and from adulthood SED at MIDUS 1 and CP/AL.
With regard to the associations between AL and CP, we adjusted for gender, age at MIDUS 2, race/ethnicity, marital status at MIDUS 2, SED at MIDUS 2, emotional/physical abuse from mothers/fathers, perceived stress scale, number of chronic conditions at MIDUS 2 biomarker project (62), metabolic equivalent of task (MET), and medications including antihyperlipidemic agents, angiotensin-converting enzyme inhibitors, beta-adrenergic blocking agents, antihypertensive combinations, analgesics, anxiolytics sedatives and hypnotics, antiplatelet agents, antacids, sex hormones, thyroid hormones, antihistamines, antidepressants, analgesics, and opioid.
2.3. Statistical analyses
Multinomial logistic regression was used to estimate the odds ratio (OR) of CP interference and CP sites at MIDUS 3 in relation to cumulative SED (including life course cumulative SED and period-specific cumulative SED). This approach was chosen due to the categorical nature of the two pain measures. Similarly, multinomial logistic regression was used to test the association between SED trajectories and CP measures at MIDUS 3. All related confounders were adjusted for (for confounder information, see Section 2.2.4). The same approach was used to test the association between AL and CP. Finally, an interaction term of AL and childhood cumulative SED was included to examine the potential moderating effect of childhood SED on the association between AL and CP.
Negative binomial models were used to examine the association between cumulative SEDs at specific periods and across life course and AL, to control for relevant confounders. This method was used because AL was coded as a count variable. Finally, the associations between SED trajectories and AL were tested using negative binomial models.
Finally, causal mediation analyses were conducted using the R package “mediation” (63) to examine whether SEDs were indirectly associated with CP by the mediating effects of AL. We created 500 bootstrapped samples to estimate the indirect effect and its standard error. The counterfactual framework was introduced to mediation analysis, and the sequential ignorability assumption is a fundamental assumption in the causal mediation analysis (64). This assumption posits that the mediator must be conditionally independent of the effect, given the exposure and any other confounders that are measured or controlled for in the analysis. Compared with the traditional mediation analysis, causal mediation analysis shows more robustness to different limitations, including confounding between the exposure, mediator, and outcome variables. Due to the fact that the “mediation” package does not accommodate negative binomial regression as the method for analyzing mediating effects (SEDs-AL), nor does it support multinomial logistic regression as the method for examining direct effects (SEDs-CP), this study, in accordance with prior research, employed ordinary least squares linear regression for the mediating effect model (65) and employed logistic regression for the direct effect model after coding categorical CP measures into dummy variables (66). Also, moderated mediation analyses were conducted to examine whether childhood SEDs would modify the effect of AL on CP.
Missing data can lead to a biased estimation (67, 68). Multiple imputation (MI) using the R package “MICE” (69) was employed to address item non-response, based on the assumption of missing at random. It should be noted that MI can also be applied to handle missing completely at random (70). The missingness pattern of the data was assessed using Little's test (71), with the “misty” R package, to determine if it followed a systematic or random pattern. The result indicated that there was no evidence of systematic missingness (P = 0.999). Missing confounders were then imputed based on the specific distribution of each item, following the recommended approach (68). A total of 20 imputed datasets were generated, and the coefficients from all statistical models, including causal mediation analysis, were combined using Rubin's rules.
3. Results
3.1. Descriptive statistics
Supplementary Tables S1A–F present the characteristics of the analytic sample (N = 593). Similar distributions demonstrate the effectiveness of MI, and subsequent regression results are identical between the imputed data and the complete case data. A total of 381 respondents reported being free from pain, 144 individuals reported experiencing low-interference pain, and 68 individuals reported having high-interference pain. In addition, 133 individuals reported experiencing pain in fewer than two body regions, and 79 individuals reported experiencing pain in three or more body sites. Meanwhile, the AL index of the sample was moderate (with a mean of 6.7 and a median of 6). With regard to the number of SEDs, there was no significant difference between the three periods, with the number of SED events fluctuating around an average of approximately 2.9 events, while the average number of life course SED events was 8.8.
According to the model fit statistics (see Figure 2 and Table 3), the standardized SED index and random slope method of LCTM generated the best-fitting model for the classification. We identified three SED mobility groups, namely, stable low, early high to late low, and early medium to late high (lower scores indicating higher SED). Approximately 45.7% of participants had severe early SED that improved to mild late SED, 36.8% had stable low, and 17.5% had early moderate SED that worsened to late severe SED.
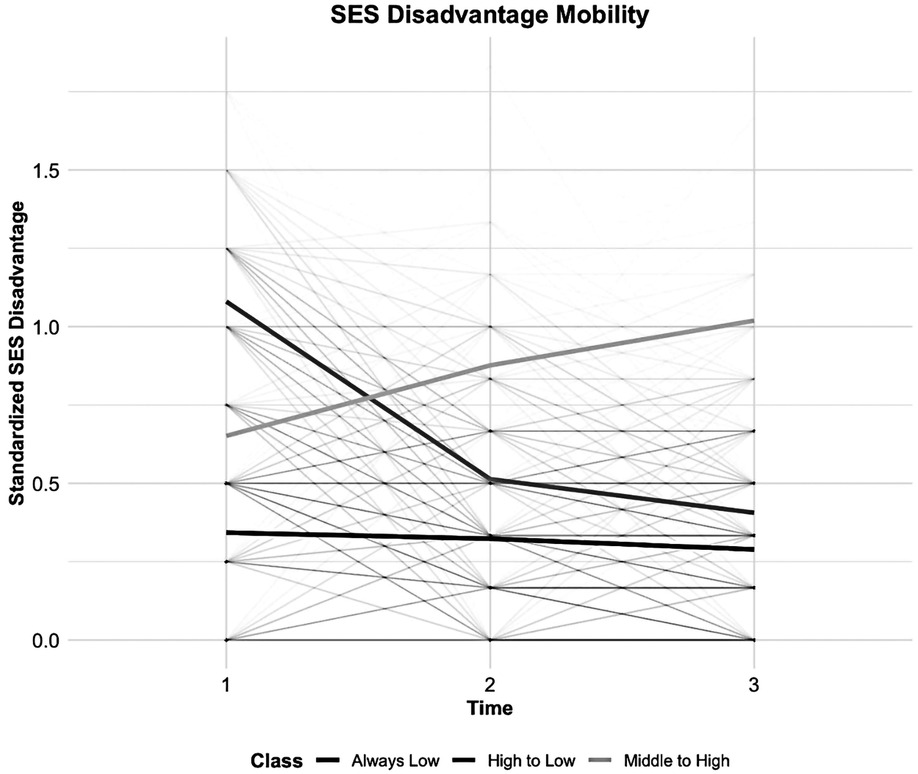
Figure 2. Group-based trajectories of socioeconomic disadvantages.
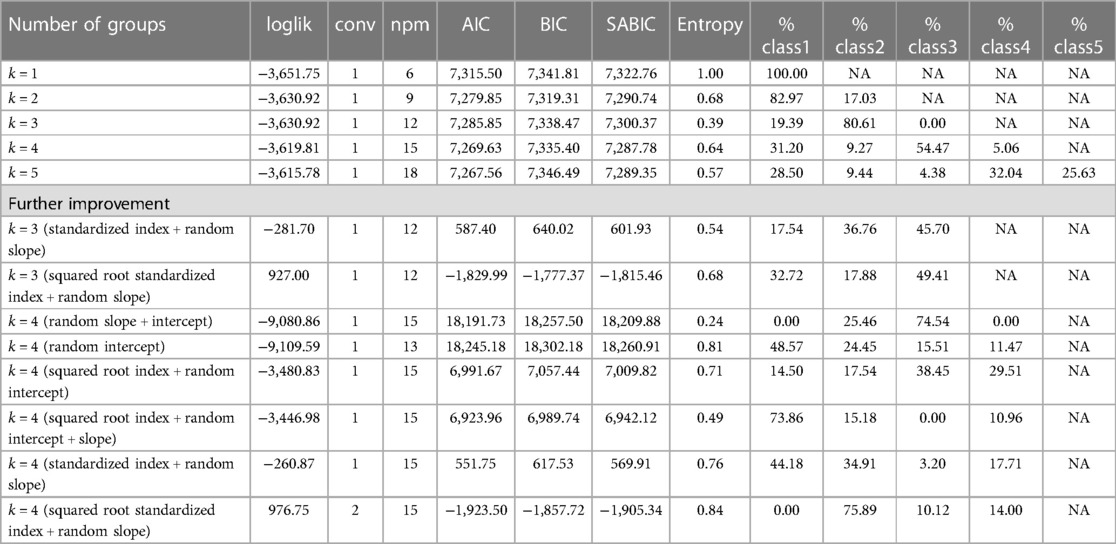
Table 3. Model fit of the latent class trajectory model.
3.2. Regression results
3.2.1. Associations between accumulation and trajectories of SEDs and CP
Table 4 presents the associations between period-specific cumulative SED, life course cumulative SED, and SED trajectories and the degree of CP interference and the number of pain sites at MIDUS 3. The results indicated that only cumulative SED at MIDUS 2 was associated with higher CP interference at MIDUS 3. The risk of reporting high pain interference increased by 15% (OR = 1.15, 95% CI: 1.01–1.32, P < 0.05) with each additional SED event experienced in MIDUS 2. However, no statistical evidence supported the lifetime accumulation of risk model.
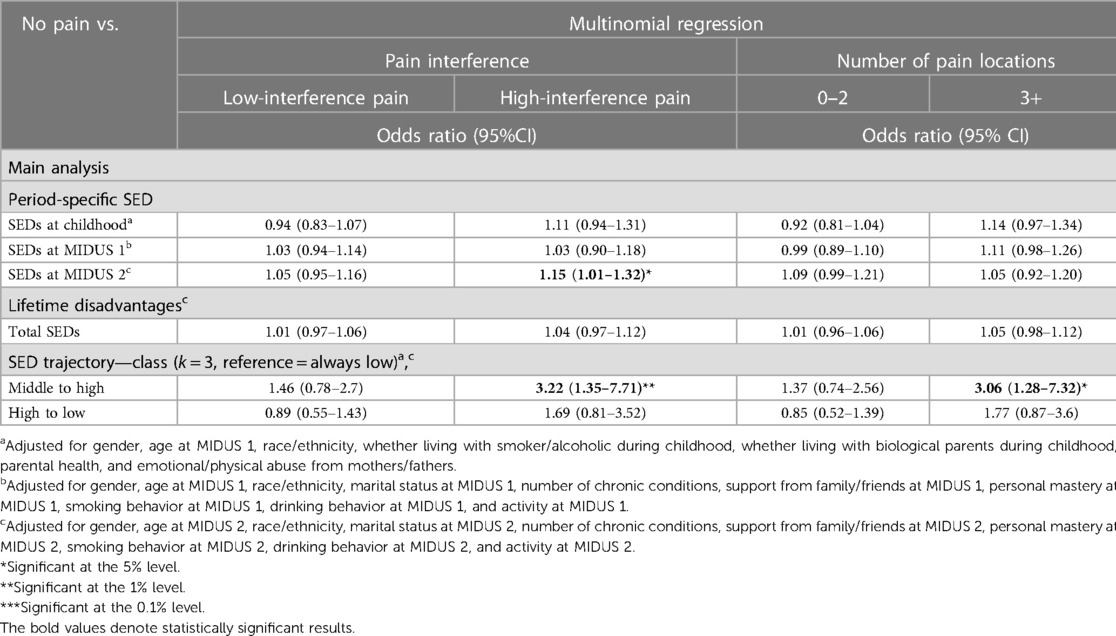
Table 4. Results from the multinomial regression for the association between SEDs and CP interference and the number of pain sites.
Furthermore, the results from the SED trajectory analysis showed that individuals who experienced a moderate number of SEDs in childhood and saw a worsening trend in adulthood reported higher pain interference (OR = 3.22, 95% CI: 1.35–7.71, P < 0.01) and three or more pain sites (OR = 3.06, 95% CI: 1.28–7.32, P < 0.05) at MIDUS 3, compared with those who continuously experience few SEDs. There was no difference in the likelihood of reporting CP conditions between individuals who transitioned to fewer SED events in later life from high SED conditions in childhood and those who consistently experienced low SED situations.
3.2.2. Associations between SEDs and AL
Table 5 demonstrates that more SEDs at each period consistently correlate with increased prevalence of AL. Also, the prevalence of AL increased by 2% [incidence rate ratio (IRR) = 1.02, 95% CI: 1.01–1.03, P < 0.001] with each unit increment in cumulative SEDs.
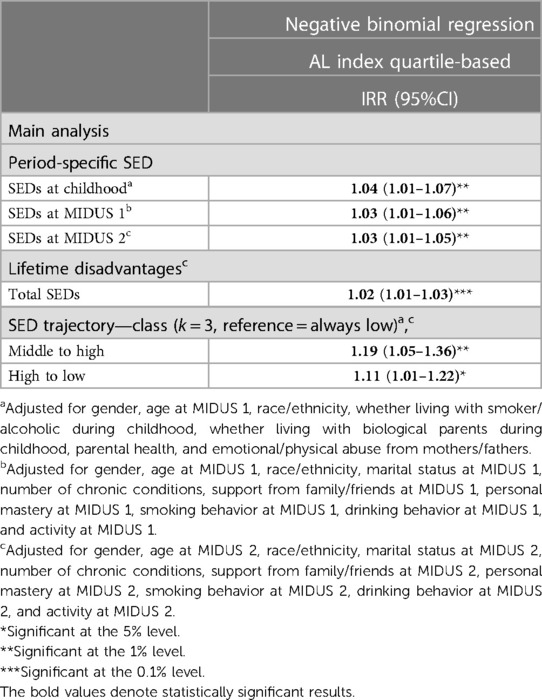
Table 5. Results from the negative binomial regression for the association between SEDs and AL.
Individuals who had a moderate number of SEDs in childhood and experienced continuous deterioration in SEDs throughout their lives had a 19% higher incidence rate of AL (IRR = 1.19, 95% CI: 1.05–1.36, P < 0.01), compared with those who consistently experienced few SEDs. Similarly, those who had a high number of SED early on and then experienced low disadvantage later in life had an 11% higher incidence rate (IRR = 1.11, 95% CI: 1.01–1.2, P < 0.05).
3.2.3. The association between AL and CP and mediation analysis
The main analysis in Table 6 does not reveal a prospective relationship between AL and CP. However, subsequent moderation analysis found that childhood SED significantly strengthened the correlation between AL and CP in three or more pain sites. Specifically, with each additional high-risk AL biomarker and childhood SED, the risk of CP in no fewer than three sites increased by 19% (95% CI: 1.02–1.4, P < 0.05) and 69% (95% CI: 1.16–2.46, P < 0.01), respectively. Surprisingly, the impact of AL was weakened by increasing childhood SED events (OR = 0.95, 95% CI: 0.9–0.99, P < 0.05).

Table 6. Results from the multinomial regression for the association between AL and CP interference and the number of pain sites.
Finally, mediation analyses, including the moderation mediation analysis of the interaction between childhood SED and AL, did not show significant mediating effects (see Supplementary Table S2B). The most probable pathway to achieve the mediating effect of AL was the moderation mediation analysis of childhood SED and three or more CP sites (Prop. mediated = 0.25, 95% CI: −0.12–1.72, P = 0.0608), but statistically significant evidence was not demonstrated.
4. Discussion
This study utilized the MIDUS national survey to examine the prospective associations between SED and CP. The results indicated a significant association between proximal SED and high-interference CP, but not between the whole life course accumulation of SED and future CP. Also, individuals with a worsening SED trajectory had a higher risk of high-interference pain and 3+ chronic pain sites. There is a positive correlation between cumulative SED and AL, and an improving trajectory of SED has a protective effect on AL. The association between AL and CP was initially not found significant, but after adding the interaction term of childhood SED and AL, the association became significant. Specifically, childhood SED may reduce the impact of AL on CP. Finally, no mediating effect of AL was found.
Previous studies have found that economic difficulties at age 43 and cumulative economic difficulties at ages 43 and 60–64 were associated with chronic widespread pain at age 68 (24). Similarly, another study found that occupational status at age 42 was associated with chronic widespread pain at age 45 (26). However, we did not find similar associations between cumulative SED and CP widespreadness. Compared with the studies mentioned, this study has several advantages that may contribute to the difference. We attempted to capture the multidimensional aspects of SED by integrating both subjective and objective SEDs rather than relying on a single socioeconomic indicator (72, 73). In addition, we considered various confounders to eliminate spurious associations. For example, disease diagnoses can reduce employment chances and working hours (74) and harm future health outcomes and social status (29). Therefore, chronic disease exacerbates SED and triggers CP conditions (30), leading to a false association. Furthermore, a different measure of CP widespreadness may contribute to the null association. Previous studies relied on the 1990 American College of Rheumatology standard (24, 26), while our measure utilized the 2016 revision criteria (75), which involved the use of the widespread pain index. However, both pain measurement methods utilized in the previous literature and in the MIDUS study were merely approximations of clinical pain assessment.
This study found that only MIDUS 2 SED was prospectively associated with high-interference CP at MIDUS 3; therefore, the results did not support the lifetime accumulation of risk model. This finding is consistent with previous research on life course SED and health outcome. A long-term cohort study of individuals who graduated from high school in Wisconsin in 1957 showed that only proximal socioeconomic status was associated with later mortality (22). The results of the present study corroborate previous research indicating that subsequent socioeconomic resources completely mediate the impacts of early SED on CP. Furthermore, in line with prior research, our results indicated that increased SEDs are related to elevated levels of CP interference (76–78). The recent accumulation of SED has exposed individuals to a high risk environment for CP and limited access to immediate resources for CP management. This could be one explanation for this association. Moreover, pain interference encompasses not only the intensity of pain but also the perceptions and beliefs of an individual about their pain (79). Individuals with recent socioeconomic advantages may hold more positive attitudes toward their health and possess greater self-efficacy in managing it, thereby contributing to a more favorable assessment of pain interference (80).
To our knowledge, our study is the first to use rigorously defined measures of CP to ascertain a prospective association of SED trajectories with CP within a community-dwelling sample. We used LCTM to standardize the trajectory phenotype of SED from heterogeneous data, providing a robust and reproducible tool for measuring SED trajectories (57), which supplements the limited literature on social mobility and CP. Our results support the social mobility model of CP development. The results indicated that individuals experiencing continuous worsening of SED over the years were more likely to have more CP sites and high-interference pain. A study found that a low socioeconomic trajectory was associated with high pain interference (81). However, SED trajectories were constructed using binary measures for three periods, which may result in an overclassified group number and groups with very few respondents. Another study refined the classification approach of unsecured debt-to-income ratio trajectories through a group-based trajectory model. They revealed that individuals who experienced trajectories of more unsecured debt were more susceptible to reporting joint problems and pain interference compared with those with minimal or no debt (82). However, both studies assessed pain experienced over the past 4 weeks rather than pain persisting for more than 3 months, resulting in the measure including trivial and recent pain. Our rigorous use of measures defined based on CP criteria eliminates much measurement error that previous studies with vague measures of CP duration have, thereby significantly enhancing our comprehension of the link between SED trajectories and CP.
Also, compared with those who remained in a prolonged state of advantage, no significant association was found between an improving SED trajectory and CP, even among individuals who experienced a highly disadvantaged childhood. One study found that an upward income trajectory can mitigate the adverse impacts of early-life disadvantages on physical health (19). Therefore, positive social mobility may enhance an individual’s access to flexible resources, which in turn enables them to adopt more proactive pain-coping strategies and cultivate healthy social relationships. As a result, this has the potential to alleviate the detrimental effects of early SED on the development of CP in the future. It could explain the null association between the trajectory characterized by high SED early in life transitioning to low SED later in life and CP.
This study may also be the first to explore the prospective association between AL and CP using population-based samples. Our results indicated that the relationship was initially statistically insignificant, but the association became significant when the interaction term of AL and childhood SED was added. On the one hand, as a critical period, childhood disadvantage can alter long-term pain processing, including sensitizing nociceptive pathways and lowering adulthood pain thresholds (46). In addition, early-life chronic stress can chronically change the function of the HPA axis, resulting in a pronociceptive effect (45, 46). As indicated by our results, childhood SED increases the risk of having AL, and AL was prospectively associated with having no less than three CP sites in the presence of the synergistic effect of SED and AL. On the other hand, we have discovered a counterintuitive phenomenon that childhood SED has a protective effect on at least three CP sites. One explanation is the development of resilience during childhood. Being resilient refers to the ability to effectively deal with the aftermath of risks, overcome the effects of traumatic events, and avoid harmful paths that frequently accompany risky circumstances (83). Childhood is a plastic period for developing resilience, and children raised in socioeconomically deprived environments may acquire coping skills and tactics that empower them to handle stress and adversity, potentially mitigating the harmful impact of disadvantage on their health (84–86), including CP (87, 88).
Only one community-dwelling study examined the mediating effect of AL on the cross-sectional association between SED and CP (42), and the findings indicate that the mediating effect was not significant. Similarly, when employing an introduced counterfactual framework in the mediation analysis, we did not find a significant prospective mediating effect of AL while controlling for additional confounders. The non-significant mediating effect may be related to the following reasons or limitations. First, different CP syndromes exhibit distinct underlying pathologies. The recent classification of CP (ICD-11) distinguishes between two broad categories (11), namely, chronic primary pain (also referred to as nociplastic pain) and chronic secondary pain (also categorized as nociceptive pain and neuropathic pain). Chronic primary pain is characterized by persistent or recurring pain in one or more anatomical regions lasting longer than 3 months (11). It is accompanied by significant emotional distress or functional interference, impacting daily activities and social engagement. This type of pain is not attributable to another specific CP condition (11) and is often associated with maladaptive stress responses (89). However, the CP measure in our study may have captured chronic secondary pain, which arises directly from underlying conditions such as cancer, stroke, diabetic neuropathy, and other related ailments (11). This is because our findings demonstrated a significant association between the chronic disease index and CP conditions (results not presented), indicating that diseases predominantly induced the pain. Future research can improve the analysis of AL as a mediator by using specific types of CP, such as migraine (36). Nevertheless, it is important to acknowledge that even for identical CP types, pain pathological traits may vary depending on the course, such as HPA dysfunction manifestation being associated with degrees of muscle pain distribution (38).
Second, this operationalization has limitations even if we measured AL using rigorously collected biomarkers that included the primary mediator system and calculated the AL index using classical additive methods. This additive method assumes that stressors have an equal impact on each high-risk biomarker or that each biomarker is equally crucial for outcomes. In addition, how the biomarkers of each score are combined is not clear. Alternative methods include latent class analysis and latent profile analysis. They can detect the dysregulation pattern of physiological systems driving AL (90). However, both latent class analysis and latent profile analysis come with their own set of challenges. One challenge is the exploratory nature of these analyses, which means that subjectivity often involves selecting the final model and qualitatively naming the clusters. We encourage future research to use advanced algorithms to narrow the gap between operationalization and theoretical implications.
There are also limitations to our sample. While the demographic and health traits of the biomarker project sample closely resemble those of the national survey sample (91), our longitudinal data containing biomarker project samples lack representation of ethnic minorities. Daily stress, such as discrimination, can amplify the CP inequality experienced by African Americans in the incidence of CP and medical practices (92). Therefore, future research should supplement the study of minority ethnic samples. In addition, childhood indicators were retrospectively collected. Some studies have validated the concordance of childhood socioeconomic indicators in the MIDUS study using sibling samples and a sample of twins, and the results indicated that the concordance of recall measures was generally high (93). However, prospective childhood indicators are still recommended in future research due to retrospective biases.
5. Conclusion
This study revealed the prospective associations between recent SED and future CP reports despite limitations. Also, the present study supports the social mobility model of CP. Furthermore, childhood, as a critical developmental period, provides advantages in developing resilience to adversity through the experience of SED. However, this resilience comes at a cost, as it interacts with AL and increases the risk of multisite pain in adulthood. Overall, increasing opportunities for positive social mobility and reducing childhood and recent SED may be key to mitigating inequalities in CP. Future research might investigate SED and CP connections by refining CP and AL measurements or scrutinizing other sociobiological processes.
Data availability statement
The data backing the conclusions of this study can be found openly at the Inter-university Consortium for Political and Social Research. MIDUS 1: 10.3886/ICPSR02760.v19. MIDUS 2: 10.3886/ICPSR04652.v8. MIDUS 2 Biomarker Project: 10.3886/ICPSR29282.v10. MIDUS 3: 10.3886/ICPSR36346.v7.
Author contributions
The author confirms being the sole contributor of this work and has approved it for publication.
Acknowledgments
The author would like to thank Cara Booker and Laura Fumagalli for the patient guidance, encouragement, and advice they have provided; all participants in the survey of MIDUS; and all members of the MIDUS team. Also, the author would like to thank the staff of the Clinical Research Centers at the University of Wisconsin–Madison, UCLA, and Georgetown University for their support in conducting this study. The study was supported by the following grants: M01-RR023942 (Georgetown), M01-RR00865 (UCLA) from the General Clinical Research Centers Program, and 1UL1RR025011 (UW) from the Clinical and Translational Science Award (CTSA) program of the National Center for Research Resources, National Institutes of Health.
Conflict of interest
The author declares that the research was conducted in the absence of any commercial or financial relationships that could be construed as a potential conflict of interest.
Publisher's note
All claims expressed in this article are solely those of the authors and do not necessarily represent those of their affiliated organizations, or those of the publisher, the editors and the reviewers. Any product that may be evaluated in this article, or claim that may be made by its manufacturer, is not guaranteed or endorsed by the publisher.
Supplementary material
The Supplementary Material for this article can be found online at: https://www.frontiersin.org/articles/10.3389/fpain.2023.1213750/full#supplementary-material
References
2. King L, Scheiring G, Nosrati E. Deaths of despair in comparative perspective. Annu Rev Sociol. (2022) 48:299–317. doi: 10.1146/annurev-soc-030320-031757
3. Case A, Deaton A. Mortality and morbidity in the 21st century. Brookings Pap Econ Act. (2017) 2017:397–476. doi: 10.1353/eca.2017.0005
4. Grol-Prokopczyk H. Sociodemographic disparities in chronic pain, based on 12-year longitudinal data. Pain. (2017) 158:313–22. doi: 10.1097/j.pain.0000000000000762
5. Nahin RL, Sayer B, Stussman BJ, Feinberg TM. Eighteen-year trends in the prevalence of, and health care use for, noncancer pain in the United States: data from the medical expenditure panel survey. J Pain. (2019) 20:796–809. doi: 10.1016/j.jpain.2019.01.003
6. Zajacova A, Grol-Prokopczyk H, Zimmer Z. Pain trends among American adults, 2002–2018: patterns, disparities, and correlates. Demography. (2021) 58:711–38. doi: 10.1215/00703370-8977691
7. Zimmer Z, Zajacova A. Persistent, consistent, and extensive: the trend of increasing pain prevalence in older Americans. J Gerontol B. (2018) 75:436–47. doi: 10.1093/geronb/gbx162
8. Case A, Deaton A. The great divide: education, despair, and death. Annu Rev Econom. (2022) 14:1–21. doi: 10.1146/annurev-economics-051520-015607
9. Case A, Deaton A. Chapter 10: Suicide, age, and wellbeing: an empirical investigation. In: Wise DA, editors. Insights in the economics of aging. Chicago: University of Chicago Press (2017). p. 307–34.
10. Yong RJ, Mullins PM, Bhattacharyya N. Prevalence of chronic pain among adults in the United States. Pain. (2022) 163:e328–32. doi: 10.1097/j.pain.0000000000002291
11. Treede R-D, Rief W, Barke A, Aziz Q, Bennett MI, Benoliel R, et al. Chronic pain as a symptom or a disease: the IASP classification of chronic pain for the International Classification of Diseases (ICD-11). Pain. (2019) 160:19–27. doi: 10.1097/j.pain.0000000000001384
12. Fayaz A, Croft P, Langford RM, Donaldson LJ, Jones GT. Prevalence of chronic pain in the UK: a systematic review and meta-analysis of population studies. BMJ Open. (2016) 6:e010364. doi: 10.1136/bmjopen-2015-010364
13. Phelan JC, Link BG, Tehranifar P. Social conditions as fundamental causes of health inequalities: theory, evidence, and policy implications. J Health Soc Behav. (2010) 51:S28–S40. doi: 10.1177/0022146510383498
14. Weber M. From max weber: Essays in sociology. Gerth HH, Mills W, editors. Florence: Taylor & Francis Group (2013). 180–195 p.
15. Ben-Shlomo Y, Kuh D. A life course approach to chronic disease epidemiology: conceptual models, empirical challenges and interdisciplinary perspectives. Int J Epidemiol. (2002) 31:285–93. doi: 10.1093/ije/31.2.285
16. Aneshensel CS. Social stress: theory and research. Ann Rev Sociol. (1992) 18:15–38. doi: 10.1146/annurev.so.18.080192.000311
17. Hallqvist J, Lynch J, Bartley M, Lang T, Blane D. Can we disentangle life course processes of accumulation, critical period and social mobility? An analysis of disadvantaged socio-economic positions and myocardial infarction in the Stockholm heart epidemiology program. Soc Sci Med. (2004) 58:1555–62. doi: 10.1016/S0277-9536(03)00344-7
18. Heraclides A, Brunner E. Social mobility and social accumulation across the life course in relation to adult overweight and obesity: the Whitehall II study. J Epidemiol Community Health. (2010) 64:714–9. doi: 10.1136/jech.2009.087692
19. Frech A, Damaske S. Men’s income trajectories and physical and mental health at midlife. Am J Sociol. (2019) 124:1372–412. doi: 10.1086/702775
20. Gruenewald TL, Karlamangla AS, Hu P, Stein-Merkin S, Crandall C, Koretz B, et al. History of socioeconomic disadvantage and allostatic load in later life. Soc Sci Med. (2012) 74:75–83. doi: 10.1016/j.socscimed.2011.09.037
21. Morrissey K, Kinderman P. The impact of financial hardship in childhood on depression and anxiety in adult life: testing the accumulation, critical period and social mobility hypotheses. SSM Popul Health. (2020) 11:100592. doi: 10.1016/j.ssmph.2020.100592
22. Pudrovska T, Anikputa B. Early-life socioeconomic status and mortality in later life: an integration of four life-course mechanisms. J Gerontol B. (2014) 69:451–60. doi: 10.1093/geronb/gbt122
23. Khalatbari-Soltani S, Blyth FM. Socioeconomic position and pain: a topical review. Pain. (2022) 163:1855–61. doi: 10.1097/j.pain.0000000000002634
24. Jay MA, Bendayan R, Cooper R, Muthuri SG. Lifetime socioeconomic circumstances and chronic pain in later adulthood: findings from a British birth cohort study. BMJ Open. (2019) 9:e024250. doi: 10.1136/bmjopen-2018-024250
25. Jones GT, Power C, Macfarlane GJ. Adverse events in childhood and chronic widespread pain in adult life: results from the 1958 British birth cohort study. Pain. (2009) 143:92–6. doi: 10.1016/j.pain.2009.02.003
26. Macfarlane GJ, Norrie G, Atherton K, Power C, Jones GT. The influence of socioeconomic status on the reporting of regional and widespread musculoskeletal pain: results from the 1958 British birth cohort study. Ann Rheum Dis. (2009) 68:1591–5. doi: 10.1136/ard.2008.093088
27. Li R, Kreher DA, Jusko TA, Chapman BP, Bonham AD, Seplaki CL. Prospective association between dysmenorrhea and chronic pain development in community-dwelling women. J Pain. (2021) 22:1084–96. doi: 10.1016/j.jpain.2021.03.139
28. Zajacova A, Grol-Prokopczyk H, Zimmer Z. Sociology of chronic pain. J Health Soc Behav. (2021) 62:302–17. doi: 10.1177/00221465211025962
29. Hoffmann R, Kröger H, Pakpahan E. Pathways between socioeconomic status and health: does health selection or social causation dominate in Europe? Adv Life Course Res. (2018) 36:23–36. doi: 10.1016/j.alcr.2018.02.002
30. Mills SEE, Nicolson KP, Smith BH. Chronic pain: a review of its epidemiology and associated factors in population-based studies. Br J Anaesth. (2019) 123:e273–83. doi: 10.1016/j.bja.2019.03.023
31. Lallukka T, Viikari-Juntura E, Raitakari OT, Kähönen M, Lehtimäki T, Viikari J, et al. Childhood and adult socio-economic position and social mobility as determinants of low back pain outcomes: socio-economic position and low back pain. EJP. (2014) 18:128–38. doi: 10.1002/j.1532-2149.2013.00351.x
32. Juster R-P, McEwen BS, Lupien SJ. Allostatic load biomarkers of chronic stress and impact on health and cognition. Neurosci Biobehav Rev. (2010) 35:2–16. doi: 10.1016/j.neubiorev.2009.10.002
33. McEwen BS. Stress, adaptation, and disease: allostasis and allostatic load. Ann N Y Acad Sci. (1998) 840:33–44. doi: 10.1111/j.1749-6632.1998.tb09546.x
34. Dowd JB, Simanek AM, Aiello AE. Socio-economic status, cortisol and allostatic load: a review of the literature. Int J Epidemiol. (2009) 38:1297–309. doi: 10.1093/ije/dyp277
35. Johnson SC, Cavallaro FL, Leon DA. A systematic review of allostatic load in relation to socioeconomic position: poor fidelity and major inconsistencies in biomarkers employed. Soc Sci Med. (2017) 192:66–73. doi: 10.1016/j.socscimed.2017.09.025
36. Borsook D, Maleki N, Becerra L, McEwen B. Understanding migraine through the lens of maladaptive stress responses: a model disease of allostatic load. Neuron. (2012) 73:219–34. doi: 10.1016/j.neuron.2012.01.001
37. Rabey M, Moloney N. “I don’t know why i’ve got this pain!” allostasis as a possible explanatory model. Phys Ther. (2022) 102:pzac017. doi: 10.1093/ptj/pzac017
38. Woda A, Picard P, Dutheil F. Dysfunctional stress responses in chronic pain. Psychoneuroendocrinology. (2016) 71:127–35. doi: 10.1016/j.psyneuen.2016.05.017
39. Woolf CJ. Central sensitization: implications for the diagnosis and treatment of pain. Pain. (2011) 152:S2–S15. doi: 10.1016/j.pain.2010.09.030
40. Hannibal KE, Bishop MD. Chronic stress, cortisol dysfunction, and pain: a psychoneuroendocrine rationale for stress management in pain rehabilitation. Phys Ther. (2014) 94:1816–25. doi: 10.2522/ptj.20130597
41. Sibille KT, McBeth J, Smith D, Wilkie R. Allostatic load and pain severity in older adults: results from the English longitudinal study of ageing. Exp Gerontol. (2017) 88:51–8. doi: 10.1016/j.exger.2016.12.013
42. Slade GD, Sanders AE, By K. Role of allostatic load in sociodemographic patterns of pain prevalence in the U.S. population. J Pain. (2012) 13:666–75. doi: 10.1016/j.jpain.2012.04.003
43. Li R, Chapman BP, Smith SM. Blood dehydroepiandrosterone and dehydroepiandrosterone sulfate as pathophysiological correlates of chronic pain: analyses using a national sample of midlife adults in the United States. Pain Med. (2021) 22:243–54. doi: 10.1093/pm/pnaa345
44. Nelson CA, Gabard-Durnam LJ. Early adversity and critical periods: neurodevelopmental consequences of violating the expectable environment. Trends Neurosci. (2020) 43:133–43. doi: 10.1016/j.tins.2020.01.002
45. Chen Y, Baram TZ. Toward understanding how early-life stress reprograms cognitive and emotional brain networks. Neuropsychopharmacology. (2016) 41:197–206. doi: 10.1038/npp.2015.181
46. Burke NN, Finn DP, McGuire BE, Roche M. Psychological stress in early life as a predisposing factor for the development of chronic pain: clinical and preclinical evidence and neurobiological mechanisms: early-life stress and chronic pain in later life. J Neurosci Res. (2017) 95:1257–70. doi: 10.1002/jnr.23802
47. Finlay S, Roth C, Zimsen T, Bridson TL, Sarnyai Z, McDermott B. Adverse childhood experiences and allostatic load: a systematic review. Neurosci Biobehav Rev. (2022) 136:104605. doi: 10.1016/j.neubiorev.2022.104605
48. Ryff CD, Seeman T, Weinstein M. Project 4 summary. In: Midlife in the United States (MIDUS 2): biomarker project, 2004–2009. Inter-university consortium for political and social research [distributor], 2022-12-14. doi: 10.3886/ICPSR29282.v10
49. Ryff CD, Seeman T, Weinstein M. Blood, urine, and saliva data. In: Midlife in the United States (MIDUS 2): biomarker project, 2004–2009. Inter-university consortium for political and social research [distributor], 2022-12-14. doi: 10.3886/ICPSR29282.v10
50. Jensen MP. Measuring pain interference. In: Curtis T, editor. The pain stethoscope: A clinician's guide to measuring pain. Tarporley: Springer Healthcare Ltd. (2011). p. 23–7.
51. McEwen BS, Seeman T. Protective and damaging effects of mediators of stress: elaborating and testing the concepts of allostasis and allostatic load. Ann N Y Acad Sci. (1999) 896:30–47. doi: 10.1111/j.1749-6632.1999.tb08103.x
52. Seeman T, Epel E, Gruenewald T, Karlamangla A, McEwen BS. Socio-economic differentials in peripheral biology: cumulative allostatic load: SES peripheral biology. Ann N Y Acad Sci. (2010) 1186:223–39. doi: 10.1111/j.1749-6632.2009.05341.x
53. Glover LM, Martin CL, Green-Howard A, Adatorwovor R, Loehr L, Staley-Salil B, et al. Cumulative socioeconomic status and incident type 2 diabetes among African American adults from the Jackson heart study. SSM Popul Health. (2023) 22:101389. doi: 10.1016/j.ssmph.2023.101389
54. Surachman A, Jenkins AIC, Santos AR, Almeida DM. Socioeconomic status trajectories across the life course, daily discrimination, and inflammation among black and white adults. Psychoneuroendocrinology. (2021) 127:105193. doi: 10.1016/j.psyneuen.2021.105193
55. Surachman A, Rice C, Bray B, Gruenewald T, Almeida D. Association between socioeconomic status mobility and inflammation markers among white and black adults in the United States: a latent class analysis. Psychosom Med. (2020) 82:224–33. doi: 10.1097/PSY.0000000000000752
56. Herle M, Micali N, Abdulkadir M, Loos R, Bryant-Waugh R, Hübel C, et al. Identifying typical trajectories in longitudinal data: modelling strategies and interpretations. Eur J Epidemiol. (2020) 35:205–22. doi: 10.1007/s10654-020-00615-6
57. Lennon H, Kelly S, Sperrin M, Buchan I, Cross AJ, Leitzmann M, et al. Framework to construct and interpret latent class trajectory modelling. BMJ Open. (2018) 8:e020683. doi: 10.1136/bmjopen-2017-020683
58. Proust-Lima C, Philipps V, Liquet B. Estimation of extended mixed models using latent classes and latent processes: the R package lcmm. J Stat Softw. (2017) 78:1–56. doi: 10.18637/jss.v078.i02
59. Sinha P, Calfee CS, Delucchi KL. Practitioner's guide to latent class analysis: methodological considerations and common pitfalls. Crit Care Med. (2021) 49:e63–e79. doi: 10.1097/CCM.0000000000004710
60. Brim OG, Baltes PB, Bumpass LL, Cleary PD, Featherman DL, Hazzard WR, et al. Documentation of scales and constructed variables in MIDUS 1. In: Midlife in the United States (MIDUS 1), 1995–1996. Inter-university consortium for political and social research [distributor], 2020-09-28. doi: 10.3886/ICPSR02760.v19
61. Ryff CD, Almeida DM, Ayanian JZ, Carr DS, Cleary PD, Coe C, et al. Documentation of psychosocial constructs and composite variables in MIDUS 2. In: Midlife in the United States (MIDUS 2), 2004–2006. Inter-university consortium for political and social research [distributor], 2021-09-15. doi: 10.3886/ICPSR04652.v8
62. Ryff CD, Seeman T, Weinstein M. ICPSR 29282 Midlife in the United States (MIDUS 2): biomarker project, 2004-2009 scales and composite variables (2018).
63. Tingley D, Yamamoto T, Hirose K, Keele L, Imai K. Mediation: R package for causal mediation analysis. J Stat Soft. (2014) 59:1–38. doi: 10.18637/jss.v059.i05
64. Imai K, Keele L, Tingley D. A general approach to causal mediation analysis. Psychol Methods. (2010) 15:309–34. doi: 10.1037/a0020761
65. Priest JB, Woods SB, Maier CA, Parker EO, Benoit JA, Roush TR. The biobehavioral family model: close relationships and allostatic load. Soc Sci Med. (2015) 142:232–40. doi: 10.1016/j.socscimed.2015.08.026
66. Iob E, Lacey R, Giunchiglia V, Steptoe A. Adverse childhood experiences and severity levels of inflammation and depression from childhood to young adulthood: a longitudinal cohort study. Mol Psychiatry. (2022) 27:2255–63. doi: 10.1038/s41380-022-01478-x
67. He Y. Missing data analysis using multiple imputation. Circ Cardiovasc Qual Outcomes. (2010) 3:8. doi: 10.1161/CIRCOUTCOMES.109.875658
68. Sterne JAC, White IR, Carlin JB, Spratt M, Royston P, Kenward MG, et al. Multiple imputation for missing data in epidemiological and clinical research: potential and pitfalls. Br Med J. (2009) 338:b2393. doi: 10.1136/bmj.b2393
69. van Buuren S, Groothuis-Oudshoorn K. MICE: multivariate imputation by chained equations in R. J Stat Soft. (2011) 45:1–67. doi: 10.18637/jss.v045.i03
70. Pedersen A, Mikkelsen E, Cronin-Fenton D, Kristensen N, Pham TM, Pedersen L, et al. Missing data and multiple imputation in clinical epidemiological research. Clin Epidemiol. (2017) 9:157–66. doi: 10.2147/CLEP.S129785
71. Van Ness PH, Murphy TE, Araujo KLB, Pisani MA, Allore HG. The use of missingness screens in clinical epidemiologic research has implications for regression modeling. J Clin Epidemiol. (2007) 60:1239–45. doi: 10.1016/j.jclinepi.2007.03.006
72. Diemer MA, Mistry RS, Wadsworth ME, López I, Reimers F. Best practices in conceptualizing and measuring social class in psychological research: social class measurement. Anal Soc Issues Public Policy. (2013) 13:77–113. doi: 10.1111/asap.12001
73. Waters T, Waters D. Are the terms “socio-economic status” and “class status” a warped form of reasoning for Max Weber? Palgrave Commun. (2016) 2:1–13. doi: 10.1057/palcomms.2016.2
74. Booker CL, Andrews L, Green G, Kumari M. Impacts of long-standing illness and chronic illness on working hours and household income in a longitudinal UK study. SSM Popul Health. (2020) 12:100684. doi: 10.1016/j.ssmph.2020.100684
75. Wolfe F, Clauw DJ, Fitzcharles M-A, Goldenberg DL, Häuser W, Katz RL, et al. 2016 revisions to the 2010/2011 fibromyalgia diagnostic criteria. Semin Arthritis Rheum. (2016) 46:319–29. doi: 10.1016/j.semarthrit.2016.08.012
76. Aroke EN, Jackson P, Overstreet DS, Penn TM, Rumble DD, Kehrer CV, et al. Race, social status, and depressive symptoms: a moderated mediation analysis of chronic low back pain interference and severity. Clin J Pain. (2020) 36:658–66. doi: 10.1097/AJP.0000000000000849
77. Fagerlund P, Salmela J, Pietiläinen O, Salonsalmi A, Rahkonen O, Lallukka T. Life-course socioeconomic circumstances in acute, chronic and disabling pain among young employees: a double suffering. Scand J Public Health. (2023) 51:257–67. doi: 10.1177/14034948211062314
78. Janevic MR, McLaughlin SJ, Heapy AA, Thacker C, Piette JD. Racial and socioeconomic disparities in disabling chronic pain: findings from the health and retirement study. J Pain. (2017) 18:1459–67. doi: 10.1016/j.jpain.2017.07.005
79. Jensen MP, Tomé-Pires C, de la Vega R, Galán S, Solé E, Miró J. What determines whether a pain is rated as mild, moderate, or severe? The importance of pain beliefs and pain interference. Clin J Pain. (2017) 33:414–21. doi: 10.1097/AJP.0000000000000429
80. Poleshuck EL, Green CR. Socioeconomic disadvantage and pain. Pain. (2008) 136:235–8. doi: 10.1016/j.pain.2008.04.003
81. Lacey RJ, Belcher J, Croft PR. Does life course socio-economic position influence chronic disabling pain in older adults? A general population study. Eur J Public Health. (2013) 23:534–40. doi: 10.1093/eurpub/cks056
82. Frech A, Houle J, Tumin D. Trajectories of unsecured debt and health at midlife. SSM Popul Health. (2021) 15:100846. doi: 10.1016/j.ssmph.2021.100846
83. Fergus S, Zimmerman MA. Adolescent resilience: a framework for understanding healthy development in the face of risk. Annu Rev Public Health. (2005) 26:399–419. doi: 10.1146/annurev.publhealth.26.021304.144357
84. De France K, Evans GW, Brody GH, Doan SN. Cost of resilience: childhood poverty, mental health, and chronic physiological stress. Psychoneuroendocrinology. (2022) 144:105872. doi: 10.1016/j.psyneuen.2022.105872
85. Hostinar CE, Miller GE. Protective factors for youth confronting economic hardship: current challenges and future avenues in resilience research. Am Psychol. (2019) 74:641–52. doi: 10.1037/amp0000520
86. Masten AS, Barnes AJ. Resilience in children: developmental perspectives. Children (Basel). (2018) 5:98. doi: 10.3390/children5070098
87. Friborg O, Hjemdal O, Rosenvinge JH, Martinussen M, Aslaksen PM, Flaten MA. Resilience as a moderator of pain and stress. J Psychosom Res. (2006) 61:213–9. doi: 10.1016/j.jpsychores.2005.12.007
88. Sturgeon JA, Zautra AJ. Psychological resilience, pain catastrophizing, and positive emotions: perspectives on comprehensive modeling of individual pain adaptation. Curr Pain Headache Rep. (2013) 17:317. doi: 10.1007/s11916-012-0317-4
89. Fitzcharles M-A, Cohen SP, Clauw DJ, Littlejohn G, Usui C, Häuser W. Nociplastic pain: towards an understanding of prevalent pain conditions. Lancet. (2021) 397:2098–110. doi: 10.1016/S0140-6736(21)00392-5
90. Carbone JT, Clift J, Alexander N. Measuring allostatic load: approaches and limitations to algorithm creation. J Psychosom Res. (2022) 163:111050. doi: 10.1016/j.jpsychores.2022.111050
91. Dienberg Love G, Seeman TE, Weinstein M, Ryff CD. Bioindicators in the MIDUS national study: protocol, measures, sample, and comparative context. J Aging Health. (2010) 22:1059–80. doi: 10.1177/0898264310374355
92. Maly A, Vallerand AH. Neighborhood, socioeconomic, and racial influence on chronic pain. Pain Manag Nurs. (2018) 19:14–22. doi: 10.1016/j.pmn.2017.11.004
Keywords: life course socioeconomic disadvantages, chronic pain, allostatic load, biomarkers, mediation analysis, resilience
Citation: Liang Y (2023) The mediating effect of allostatic load on the association between life course socioeconomic disadvantage and chronic pain: a prospective finding from the National Survey of Midlife Development in the United States. Front. Pain Res. 4:1213750. doi: 10.3389/fpain.2023.1213750
Received: 28 April 2023; Accepted: 26 June 2023;
Published: 13 July 2023.
Edited by:
Fabien Marchand, INSERM U1107 Douleur et Biophysique Neurosensorielle (Neuro-Dol), FranceReviewed by:
Dokyoung Sophia You, Stanford University, United StatesDakota Witzel, The Pennsylvania State University (PSU), United States
© 2023 Liang. This is an open-access article distributed under the terms of the Creative Commons Attribution License (CC BY). The use, distribution or reproduction in other forums is permitted, provided the original author(s) and the copyright owner(s) are credited and that the original publication in this journal is cited, in accordance with accepted academic practice. No use, distribution or reproduction is permitted which does not comply with these terms.
*Correspondence: Yunlong Liang eXVubG9uZy5saWFuZ0Blc3NleC5hYy51aw==