
95% of researchers rate our articles as excellent or good
Learn more about the work of our research integrity team to safeguard the quality of each article we publish.
Find out more
CORRECTION article
Front. Oral. Health , 13 March 2025
Sec. Cardiometabolic Health
Volume 6 - 2025 | https://doi.org/10.3389/froh.2025.1580261
This article is part of the Research Topic Periodontitis and Cardiovascular Disease: Shared Clinical Challenges in Patient Care View all 6 articles
 Mario Dioguardi1
 Maria Eleonora Bizzoca1
 Stefania Cantore2*
 Giorgia Apollonia Caloro3
 Gennaro Musella1
 Filiberto Mastrangelo1
 Lorenzo Lo Muzio1
 Andrea Ballini1
A corrigendum on
By Dioguardi M, Bizzoca ME, Cantore S, Caloro GA, Musella G, Mastrangelo F, Lo Muzio L, Ballini A. Front Oral Health. (2024) 5:1473744. doi: 10.3389/froh.2024.1473744
Error in Figure/Table
In the published article, there was an error in figures 2–6 as published. In the forest plot images (figures 2–6) representing the results of the meta-analysis that have been published, the fixed effects have been applied unlike the Random effects as described in the captions and in the manuscript. The corrected (Figures 2–6) and its caption.
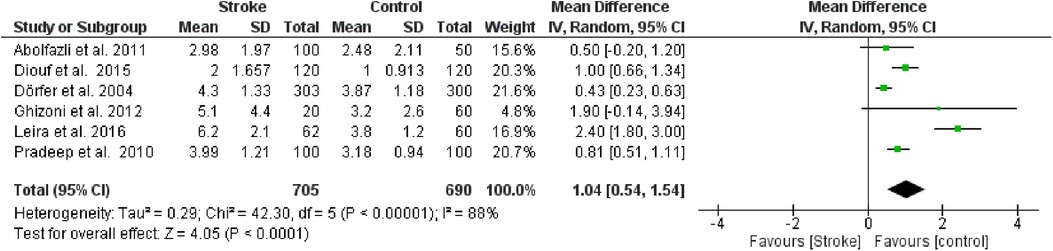
Figure 2. Forest plot of clinical attachment loss, mean difference: 1.04 95% CI [0.54, 1.54], Tau2 = 0.29, Higgins heterogeneity index I2 = 88, Chi2 = 42.30, df (degrees of freedom) 5, P value < 0.00001, test for overall effect: Z = 4.05 (P < 0.0001) weights: Abolfazli et al. 2011 15.6%, Diouf et al. 2015 20.3%, Dörfer et al. 2004 21.6%, Ghizoni et al. 2012 4.8%, Leira et al. 2016 2.40%, Pradeep et al. 2010 20.7%.the graph for each study included shows the first author, the date of publication, the number of patients with stroke and control, the average clinical attack loss in the two groups with the standard deviation (SD), the mean difference, the weight of the study on the meta-analysis. The final effect of the single study is expressed in a green square with the related confidence intervals (black line crossing the square) while the final effect of the meta-analysis is depicted by the black diamond whose width is given by the confidence intervals.
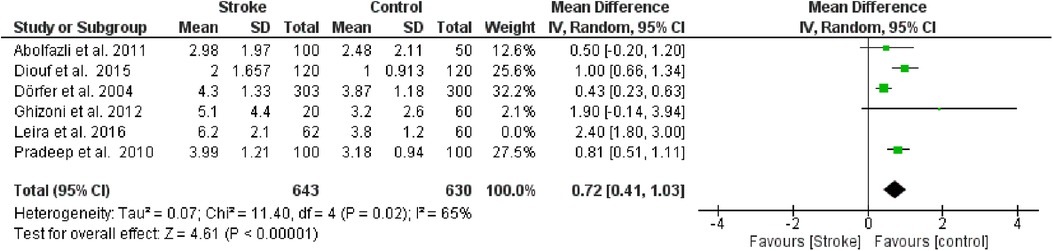
Figure 3. Sensitivity analysis, clinical attachment loss forest plot of the random effects model of the meta-analysis, exclusion of Leira et al., 2016 data.
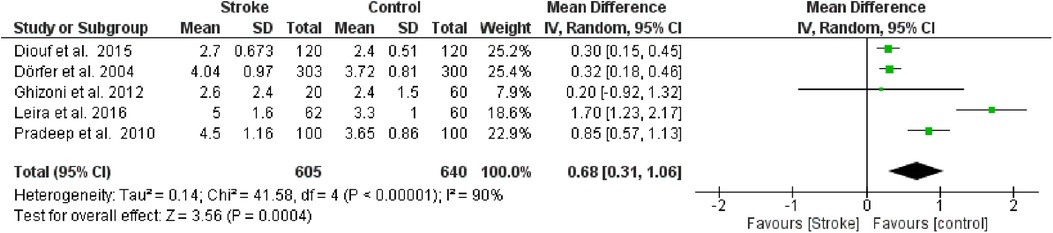
Figure 4. Forest plot of probing pocket depth, mean difference: 0.68 95% CI [0.31, 1.06], Tau2 = 0.14, Higgins heterogeneity index I2 = 90, Chi2 = 41.58, df (degrees of freedom) 4, P value <0.00001, test for overall effect: Z = 3.56 (P < 0.0004) weights: Diouf et al., 2015 25.2%, Dörfer et al., 2004 25.4%, Ghizoni et al., 2012 7.9%, Leira et al., 2016 18.6%, Pradeep et al., 2010 22.9%. The graph for each study included shows the first author, the date of publication, the number of patients with stroke and control, the average clinical attack loss in the two groups with the standard deviation (SD), the mean difference, the weight of the study on the meta-analysis. The final effect of the single study is expressed in a green square with the related confidence intervals (black line crossing the square) while the final effect of the meta-analysis is depicted by the black diamond whose width is given by the confidence intervals.

Figure 5. Sensitivity analysis, probing pocket depth forest plot of the random effects model of the meta-analysis, exclusion of Leira et al., 2016 data.
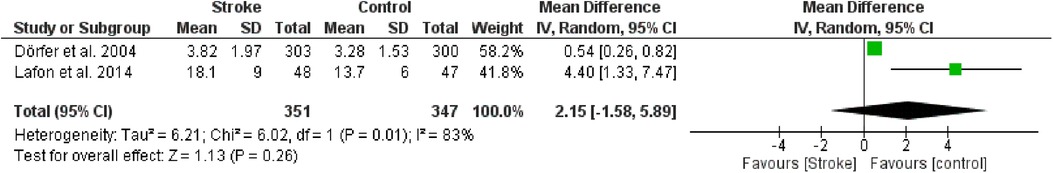
Figure 6. Forest plot of radiological bone loss, mean difference: 2.15 95% CI [−1.58, 5.89], Tau2 = 6.21, Higgins heterogeneity index I2 = 83, Chi2 = 6.02, df (degrees of freedom) 1, P value = 0.01, test for overall effect: Z = 1.13 (P = 0.26) weights: Dörfer et al., 2004 58.2%, Lafon et al., 2014 41.8%, the graph for each study included shows the first author, the date of publication, the number of patients with stroke and control, the average clinical attack loss in the two groups with the standard deviation (SD), the mean difference, the weight of the study on the meta-analysis. The final effect of the single study is expressed in a green square with the related confidence intervals (black line crossing the square) while the final effect of the meta-analysis is depicted by the black diamond whose width is given by the confidence intervals.
ORIGINAL Figures 2–6 appear below.
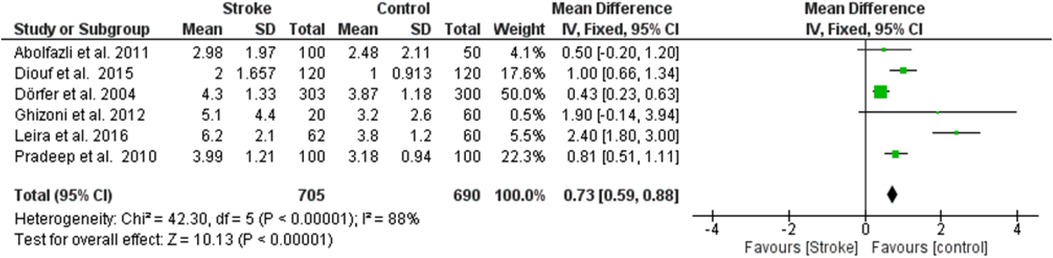
Figure 2. Forest plot of clinical attachment loss, mean difference: 1.04 95% CI [0.54, 1.54], Tau2 = 0.29, Higgins heterogeneity index I2 = 88, Chi2 = 42.30, df (degrees of freedom) 5, P value < 0.00001, test for overall effect: Z = 4.05 (P < 0.0001) weights: Abolfazli et al. 2011 15.6%, Diouf et al. 2015 20.3%, Dörfer et al. 2004 21.6%, Ghizoni et al. 2012 4.8%, Leira et al. 2016 2.40%, Pradeep et al. 2010 20.7%.the graph for each study included shows the first author, the date of publication, the number of patients with stroke and control, the average clinical attack loss in the two groups with the standard deviation (SD), the mean difference, the weight of the study on the meta-analysis. The final effect of the single study is expressed in a green square with the related confidence intervals (black line crossing the square) while the final effect of the meta-analysis is depicted by the black diamond whose width is given by the confidence intervals.
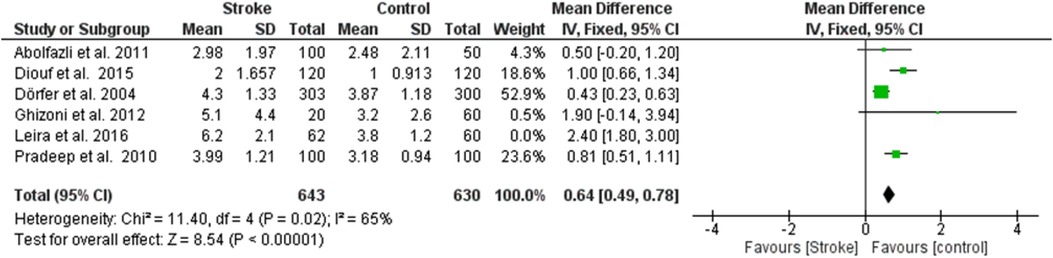
Figure 3. Sensitivity analysis, clinical attachment loss forest plot of the random effects model of the meta-analysis, exclusion of Leira et al., 2016 data.

Figure 4. Forest plot of probing pocket depth, mean difference: 0.68 95% CI [0.31, 1.06], Tau2 = 0.14, Higgins heterogeneity index I2 = 90, Chi2 = 41.58, df (degrees of freedom) 4, P value <0.00001, test for overall effect: Z = 3.56 (P < 0.0004) weights: Diouf et al., 2015 25.2%, Dörfer et al., 2004 25.4%, Ghizoni et al., 2012 7.9%, Leira et al., 2016 18.6%, Pradeep et al., 2010 22.9%. The graph for each study included shows the first author, the date of publication, the number of patients with stroke and control, the average clinical attack loss in the two groups with the standard deviation (SD), the mean difference, the weight of the study on the meta-analysis. The final effect of the single study is expressed in a green square with the related confidence intervals (black line crossing the square) while the final effect of the meta-analysis is depicted by the black diamond whose width is given by the confidence intervals.
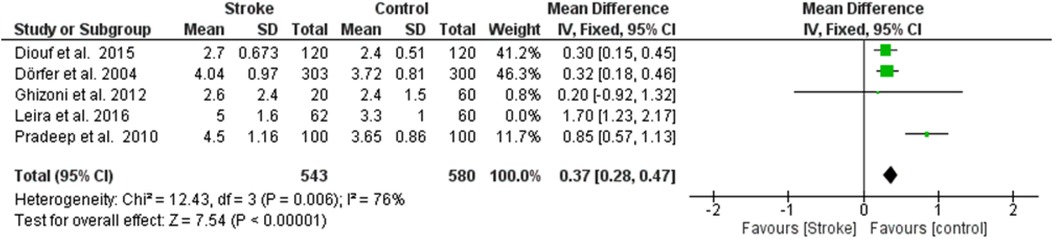
Figure 5. Sensitivity analysis, probing pocket depth forest plot of the random effects model of the meta-analysis, exclusion of Leira et al., 2016 data.
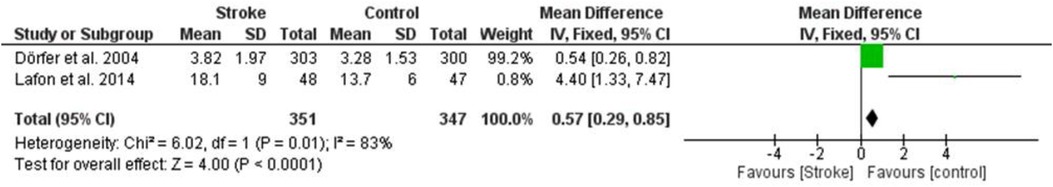
Figure 6. Forest plot of radiological bone loss, mean difference: 2.15 95% CI [−1.58, 5.89], Tau2 = 6.21, Higgins heterogeneity index I2 = 83, Chi2 = 6.02, df (degrees of freedom) 1, P value = 0.01, test for overall effect: Z = 1.13 (P = 0.26) weights: Dörfer et al., 2004 58.2%, Lafon et al., 2014 41.8%, the graph for each study included shows the first author, the date of publication, the number of patients with stroke and control, the average clinical attack loss in the two groups with the standard deviation (SD), the mean difference, the weight of the study on the meta-analysis. The final effect of the single study is expressed in a green square with the related confidence intervals (black line crossing the square) while the final effect of the meta-analysis is depicted by the black diamond whose width is given by the confidence intervals.
The authors apologize for this error and state that this does not change the scientific conclusions of the article in any way. The original article has been updated.
All claims expressed in this article are solely those of the authors and do not necessarily represent those of their affiliated organizations, or those of the publisher, the editors and the reviewers. Any product that may be evaluated in this article, or claim that may be made by its manufacturer, is not guaranteed or endorsed by the publisher.
Keywords: stroke, periodontitis, brain, oral and dental health, bone loss, oral inflammation, risk factor, tooth loss
Citation: Dioguardi M, Bizzoca ME, Cantore S, Caloro GA, Musella G, Mastrangelo F, Lo Muzio L and Ballini A (2025) Corrigendum: Impact of cerebrovascular stroke on inflammatory periodontal indices: a systematic review with meta-analysis and trial sequential analysis of case-control studies. Front. Oral Health 6:1580261. doi: 10.3389/froh.2025.1580261
Received: 20 February 2025; Accepted: 25 February 2025;
Published: 13 March 2025.
Approved by: Frontiers Editorial Office, Frontiers Media SA, Switzerland
Copyright: © 2025 Dioguardi, Bizzoca, Cantore, Caloro, Musella, Mastrangelo, Lo Muzio and Ballini. This is an open-access article distributed under the terms of the Creative Commons Attribution License (CC BY). The use, distribution or reproduction in other forums is permitted, provided the original author(s) and the copyright owner(s) are credited and that the original publication in this journal is cited, in accordance with accepted academic practice. No use, distribution or reproduction is permitted which does not comply with these terms.
*Correspondence: Stefania Cantore, c3RlZmFuaWFjYW50b3JlQHBlYy5vbWNlby5iYXJpLml0
Disclaimer: All claims expressed in this article are solely those of the authors and do not necessarily represent those of their affiliated organizations, or those of the publisher, the editors and the reviewers. Any product that may be evaluated in this article or claim that may be made by its manufacturer is not guaranteed or endorsed by the publisher.
Research integrity at Frontiers
Learn more about the work of our research integrity team to safeguard the quality of each article we publish.