 Siwen Pang
- Department of Radiology, Second Affiliated Hospital of Jilin University, Changchun, China
Objective: The objective of this study is to evaluate the predictive value of quantitative parameters from spectral CT for Ki-67 expression in ovarian cancer (OC).
Methods: Spectral CT imaging data from 39 patients with ovarian cancer by pathology, encompassing 52 lesions overall, were collected retrospectively and split into two groups based on immunohistochemical results. Tumor solid components in arterial, venous, and delayed phases can be measured using post-processing software to obtain the quantitative parameters of spectral CT. An independent sample t-test was implemented for evaluating spectral CT parameters between two groups, and a Spearman correlation coefficient was applied among all participants to estimate the relationship between spectral parameters and Ki-67 levels. Moreover, an examination of the receiver operating characteristic (ROC) curve was conducted to assess the diagnostic efficacy of the significantly different parameters between the two groups.
Results: The Ki-67 high-level group includes 22 patients and 29 lesions, while the Ki-67 low-level group contains 17 patients and 23 lesions. The A-sIC, A-sZeff, V-IC, D-Zeff, and D-sZeff values in the Ki-67 high-level group were greater than those in the Ki-67 low-level group (P =0.028, AUC = 0.705; P < 0.001, AUC = 0.742; P = 0.047, AUC = 0.657; P = 0.014, AUC = 0.665; and P = 0.006, AUC = 0.675, respectively). For correlation analysis, A-IC, A-sIC, A-Zeff, A-sZeff, A-λHU, D-IC, D-Zeff, and D-sZeff were positively correlated with Ki-67 levels, with correlation coefficients ranging from 0.277 to 0.417, P<0.05. Through multiple logistic regression, the combined model that included 5 quantitative parameters showed the highest diagnostic performance, with a sensitivity of 93.10%, a specificity of 60.90%, and an AUC value of 0.808.
Conclusion: Spectral CT provides multi-parametric imaging data and is useful in predicting Ki-67 expression in ovarian cancer, delivering comprehensive and reliable imaging evidence for the formulation of therapeutic treatment options.
1 Introduction
Ovarian cancer (OC) is a prevalent malignant tumor in gynecology, and its mortality rate rises year after year, making it one of the leading causes of cancer death and posing a major threat to patients’ lives (1, 2). Because of the non-specific clinical symptoms of ovarian cancer, the majority of patients are detected for the first time in stages III and IV, resulting in an extremely low survival rate. In contrast, a survival probability of over 90% can be achieved through early diagnosis (3, 4). In clinical practice, certain indicators such as CA125 and CA199 are closely related to the occurrence of ovarian cancer, and an increase in these indicators in patients often indicates the emergence of ovarian cancer. Any histological component can become the site of ovarian cancer, and the most common kind is high-grade serous carcinoma that starts in the epithelium (5). Although surgery and chemotherapy are the most common treatments for epithelial ovarian cancer, individuals with advanced epithelial ovarian cancer still have a poor prognosis, and more research is needed to develop improved diagnostic and therapeutic approaches.
Numerous factors, such as the tumor’s stage, differentiation grade, and histological type, affect the prognosis of individuals with ovarian cancer (5, 6). Ki-67, an essential proliferation marker, is frequently detected in several types of malignant tumors and can be used to assess cell growth scores (7). Numerous studies (8, 9) have indicated that the level of Ki-67 is typically connected to the tumor’s risk of malignancy and recurrence and might be a helpful indicator for determining a patient’s prognosis. Furthermore, research has shown that Ki-67 has advantages in discriminating between benign and malignant cancers, identifying tumor subtypes, and guiding chemotherapy decisions, making it an essential signal for disease diagnosis, treatment, and prognosis (10–12).
Multiple histological types abound in ovarian tumors, and their endocrine action and tissue composition are complicated, leading to various imaging appearances. Ovarian cancer is currently diagnosed using a variety of imaging methods, such as ultrasound, multi detector computed tomography (MDCT), and magnetic resonance imaging (MRI). Among them, ultrasound is frequently employed to screen for ovarian cancer; additionally, MDCT and MRI provide specific advantages for the detection and staging of ovarian cancer (13, 14). Nevertheless, spectral CT, an emerging imaging technology, is capable of not only qualitatively diagnosing lesions based on morphology but also quantitatively analyzing the condition of lesions through multiple parameters, thereby providing patients with a greater variety of imaging information. Spectral CT is frequently utilized in disease detection because it serves benefits over traditional CT, including the capacity to separate materials, low-dose imaging, artifact reduction, functional imaging, and multi-parameter analysis. Furthermore, spectral CT characteristics can offer more useful imaging evidence for clinical practice and are frequently employed in oncology (15, 16). According to several research, spectral CT is extensively utilized in the diagnosis of ovarian cancer; it offers notable benefits for the differential detection of benign and malignant cancers (17, 18).
The development of a variety of malignancies, particularly colon cancer, ovarian cancer, and breast cancer, is closely associated with Ki-67 (9, 19, 20). Moreover, some studies (9, 21)have demonstrated that the level of Ki-67 is linked to the prognosis and subsequent treatment. However, no studies have utilized quantitative parameters of spectral CT to assess the level of Ki-67 in ovarian cancer patients. The efficacy of spectral CT for evaluating Ki-67 level in ovarian cancer is not yet established. Consequently, this investigation implemented numerous spectral CT parameters to estimate Ki-67 levels in ovarian cancer and extend patients’ imaging information.
2 Methods
2.1 Patient characteristics
The Hospital Ethics Committee has approved this study based on exemptions covering the signing of informed consent forms, and all procedures comply with applicable regulations. From March 2023 to September 2024, spectral CT scans were performed on 132 patients suspected of having ovarian cancer in clinical practice. Inclusion criteria: (1) comprehensive imaging and clinical data; (2) ovarian tumor confirmed by pathological testing; (3) no contraindications for CT scanning. For the following reasons, a total of 93 cases were not included: (1) accepted surgery or radiotherapy/chemotherapy (n = 23); (2) poor imaging quality (n = 11); (3) difficulty defining the lesion’s Region of Interest (ROI) (n = 11); (4) lack of Ki-67 results (n = 15), and (5) benign ovarian tumors (n = 33). Finally, 39 instances with 52 ovarian tumor lesions were the last patients to be enrolled. Figure 1 shows the patient selection process.
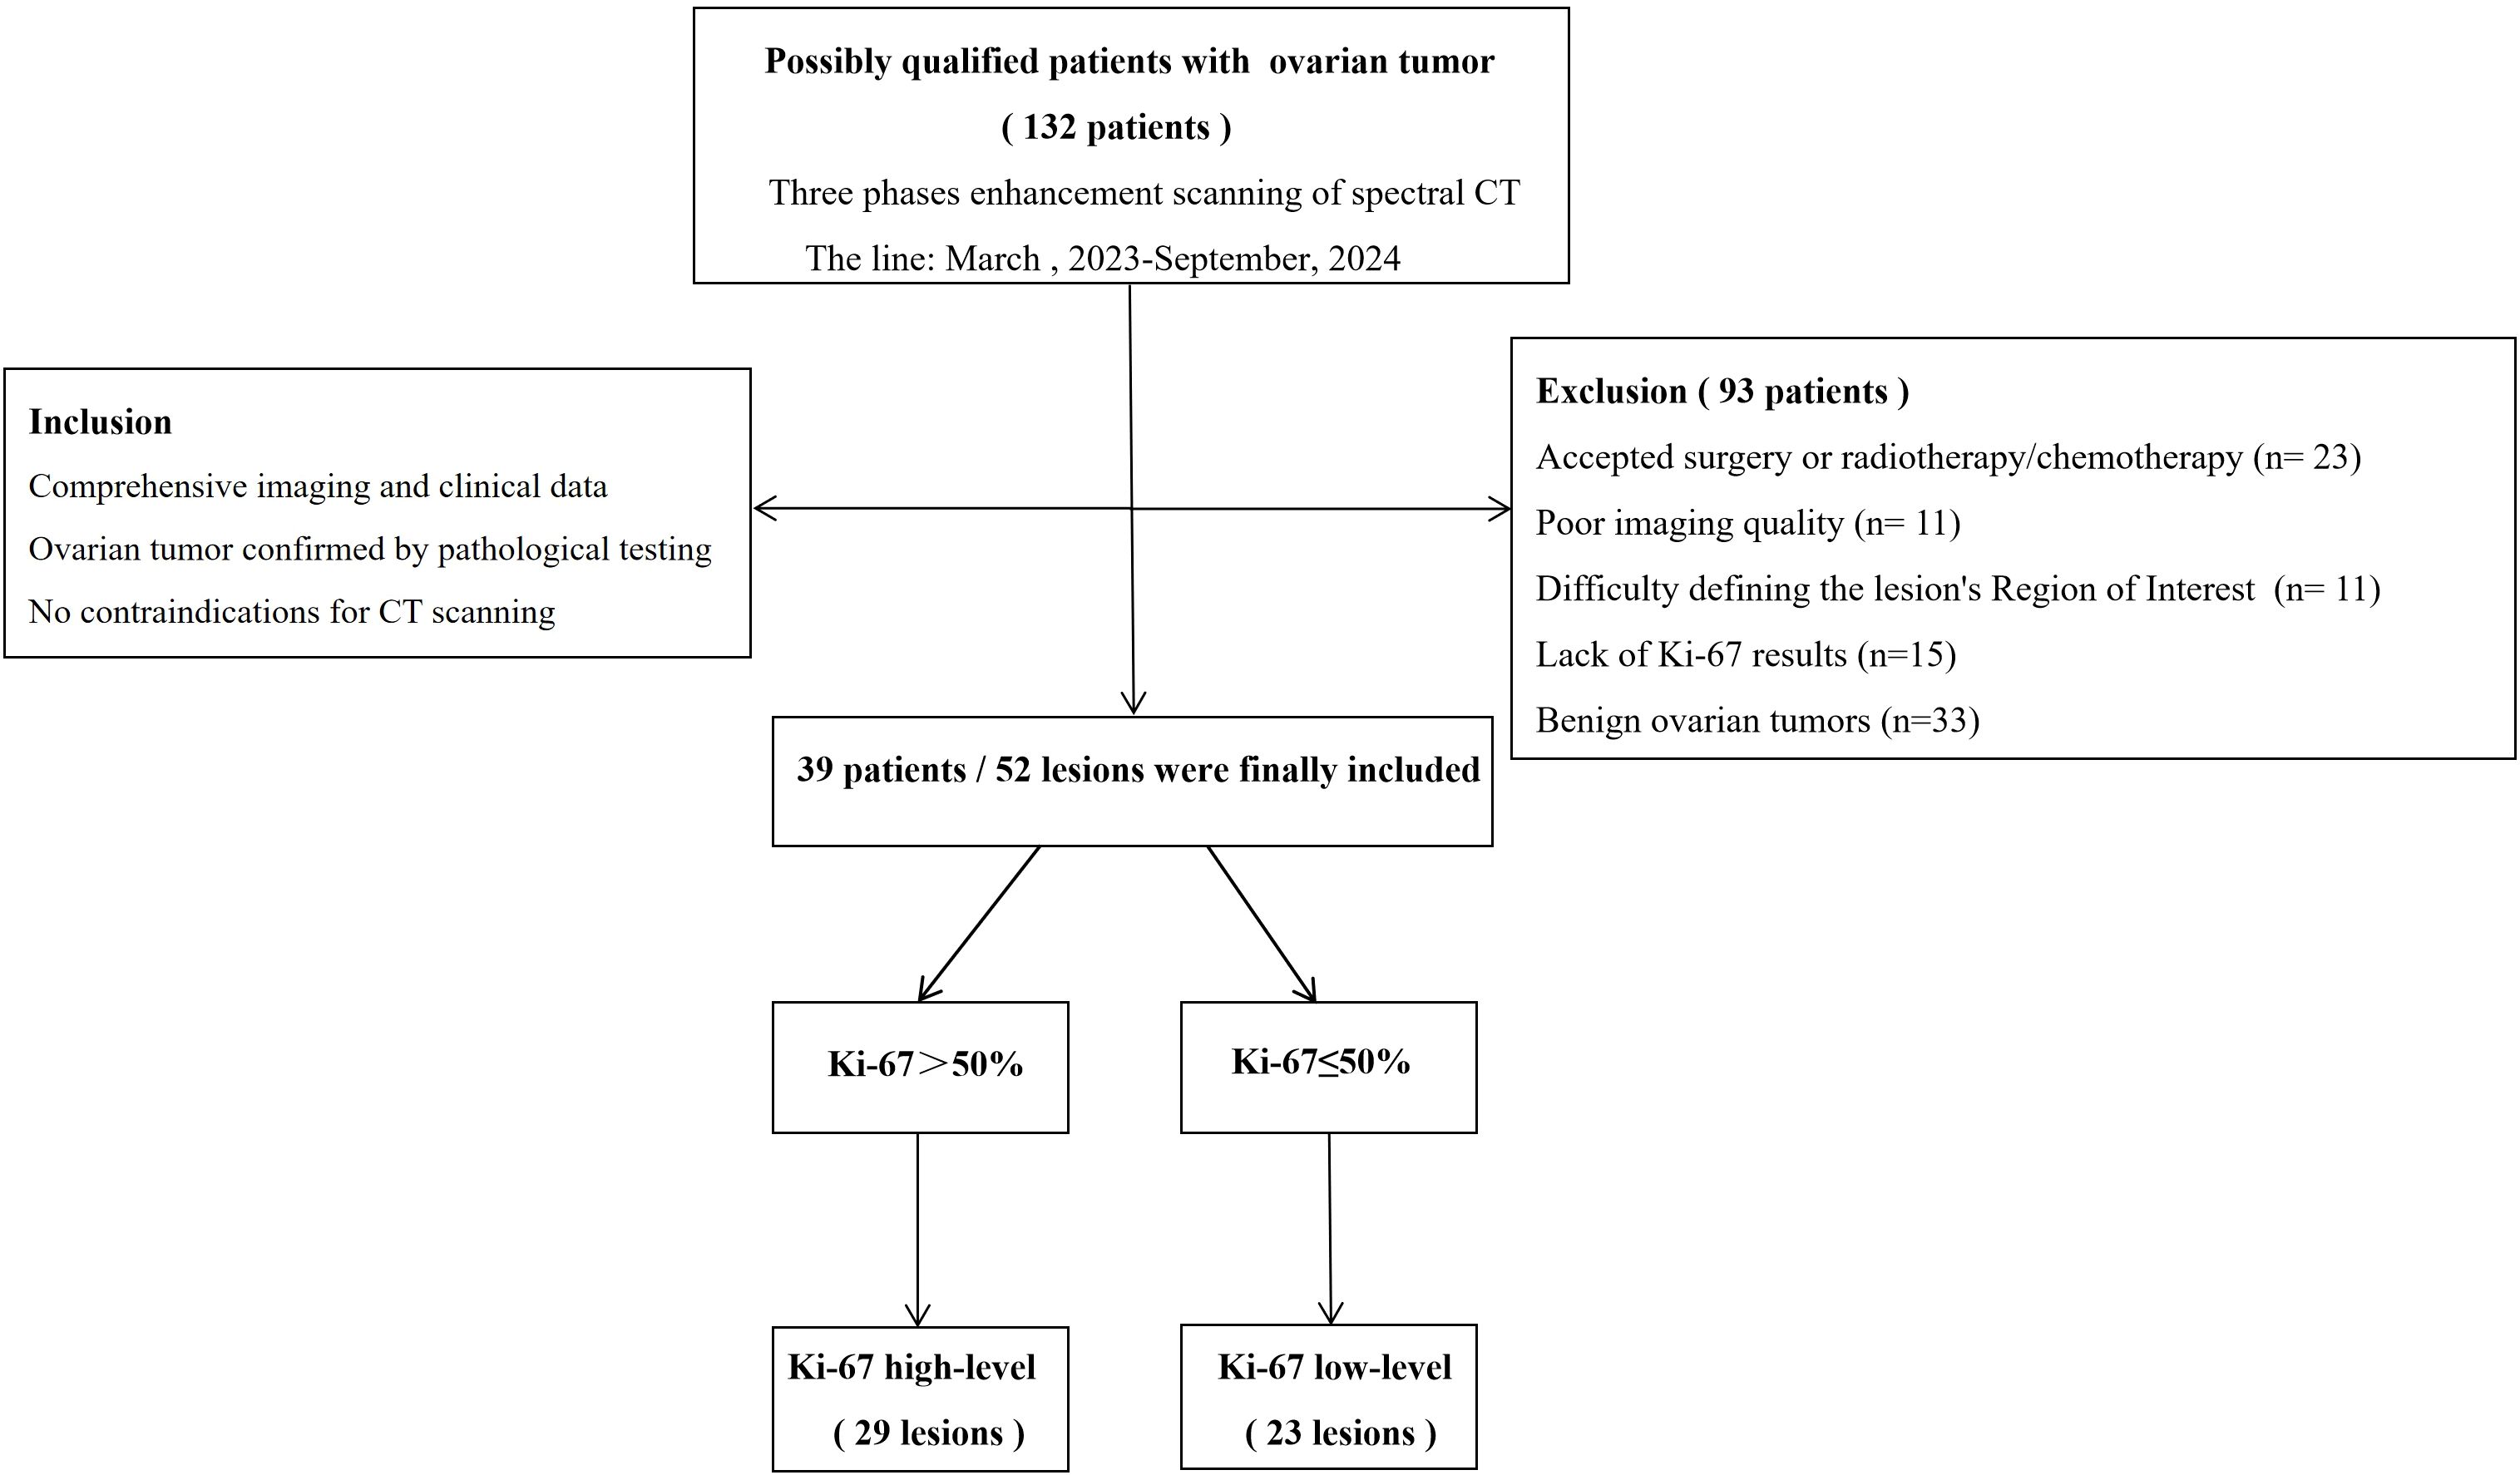
Figure 1. Process diagram for selecting patients.
2.2 Spectral CT protocol
Two weeks elapsed between the scan and the surgery. Before going through the scanning process, patients had to refrain from consuming anything for at least eight hours. Additionally, at least 800 ml of water should be drunk in order to maximize stomach fullness and improve lesion visibility. A 256-row CT scanner (GE Revolution CT) was employed to acquire plain and three-phase enhanced scan images, with a scanning range of the diaphragm to the pubic symphysis. The following are the specific parameters: The tube voltage quickly switches between 80 kVp/140 kVp; tube current: 445 mA; scanning thickness: 5 mm; reconstruction thickness: 1.25 mm; pitch: 0.6; rotational time: 0.5s/r; matrix: 512 × 512. Using a high-pressure injector (Stellant, Medrad, Byer HealthCare), 70 mL of iodine contrast agent was administered at a rate of 5 mL/s through the central elbow vein. Next, delivered 40 mL of physiological saline. The bolus tracking method was used to acquire enhanced images of the arterial, venous, and delayed phases. Arterial phase (AP), venous phase (VP), and delayed phase (DP) scan delays were set at 30 seconds, 55 seconds, and 120 seconds, respectively.
2.3 Image post-processing and analysis
The initial spectral images were imported to the GE AW4.7 workstation, and image post-processing was performed using the GSI Viewer program. Two radiologists with over a decade of experience and a specialization in gynaecology assessed the image condition to guarantee the accuracy of image processing. To avoid prejudice, they were blinded to the pathology results. Any discrepancies that had surfaced were discussed between the two radiologists. For optimal precision, the subsequent guidelines were implemented during region of interest (ROI) delineation: (1) The region with the most obvious enhancement of the solid part of the lesion on three adjacent layers was selected as the ROI for measurement, and all data were taken as the average of three measurements; (2)The delineation of ROI depends on the size of the lesion, avoiding cystic and hemorrhagic necrotic areas, and must be placed on the solid part of the lesion while controlling the size of ROI to be about 1/2-2/3 of the lesion; (3) The ROI replication function of the post-processing workstation ensures consistency in ROI size and position for each phase. By choosing iodine-based substances for substance separation in the three-phase energy spectrum enhanced image, the iodine concentration (IC) value and effective atomic number (Zeff) value within the lesion ROI of the three phases were recorded, along with CT values at 40 and 80 KeV. In addition, by plotting the spectral CT curve to calculate the slope of the curve (λHU) value, λHU = CT40KeV-CT80keV/40. Meanwhile, two associated parameters were assessed: sIC = IClesion/ICiliac artery, sZeff = Zefflesion/Zeffiliac artery. Each patient was split into two groups depending on the expression level of Ki-67 immunohistochemistry. Patients with Ki-67 values > 50% were categorized in the high-level group, whilst those with Ki-67 values ≤ 50% were placed in the low-level group (21, 22).
2.4 Statistical analysis
The statistical analysis was carried out employing IBM SPSS 27 (IBM, Armonk, NY, USA) and Graphpad Prism 10.2.3 (GraphPad Software, La Jolla, CA, USA). The intraclass correlation coefficient (ICC) was applied for consistency testing. ICCs above 0.80 were deemed highly reliable. The Shapiro-Wilk test validated the standard of the data distribution. The independent sample t-test was implemented to analyze the variations in spectral CT parameters and Ki-67 levels. The correlation between the spectral characteristics and the Ki-67 levels was evaluated using Spearman’s correlation coefficient. While categorical variables were stated in frequency (rate), the formula for continuous data was mean ± standard deviation. Receiver operating characteristic (ROC) curves were generated for parameters showing statistically differentials in order to evaluate diagnostic efficacy. In addition, the area under the curve (AUC) value, cut-off value, sensitivity, and specificity were calculated. The diagnostic efficacy of the ROC curves was compared by the Delong test. Single-factor and multiple-factor logistic regression analysis were used to evaluate the independent predictive factors for Ki-67. P value < 0.05 is considered statistically significant.
3 Results
3.1 Clinical characteristics of patients
This study included 39 participants with 52 lesions overall (average age: 53.69 years, range: 26–76 years). Age and the number of lesions did not significantly differ between the two groups (P=0.107, 0.819). In the Ki-67 high-level group (51.00 ± 10.25 years), there were 15 patients (68.2%) with single lesions and 7 patients (31.8%) with bilateral lesions; in the low-level group (57.18 ± 13.14 years), there were 11 patients (64.7%) with single lesions and 6 patients (35.3%) with bilateral lesions. Additionally, the two groups’ intratumoral bleeding, CA199 value, and ascites status varied not statistically meaningfully (P=0.582, 0.872, and 0.709, respectively). Nonetheless, the Ki-67 high-level group had greater values for CA125, and ROMA (premenopausal and postmenopausal) than the low-level group (P = 0.008, 0.022, and <0.001, respectively). Table 1 and Figure 2 display the pertinent clinical data.

Table 1. Clinical features of patients.
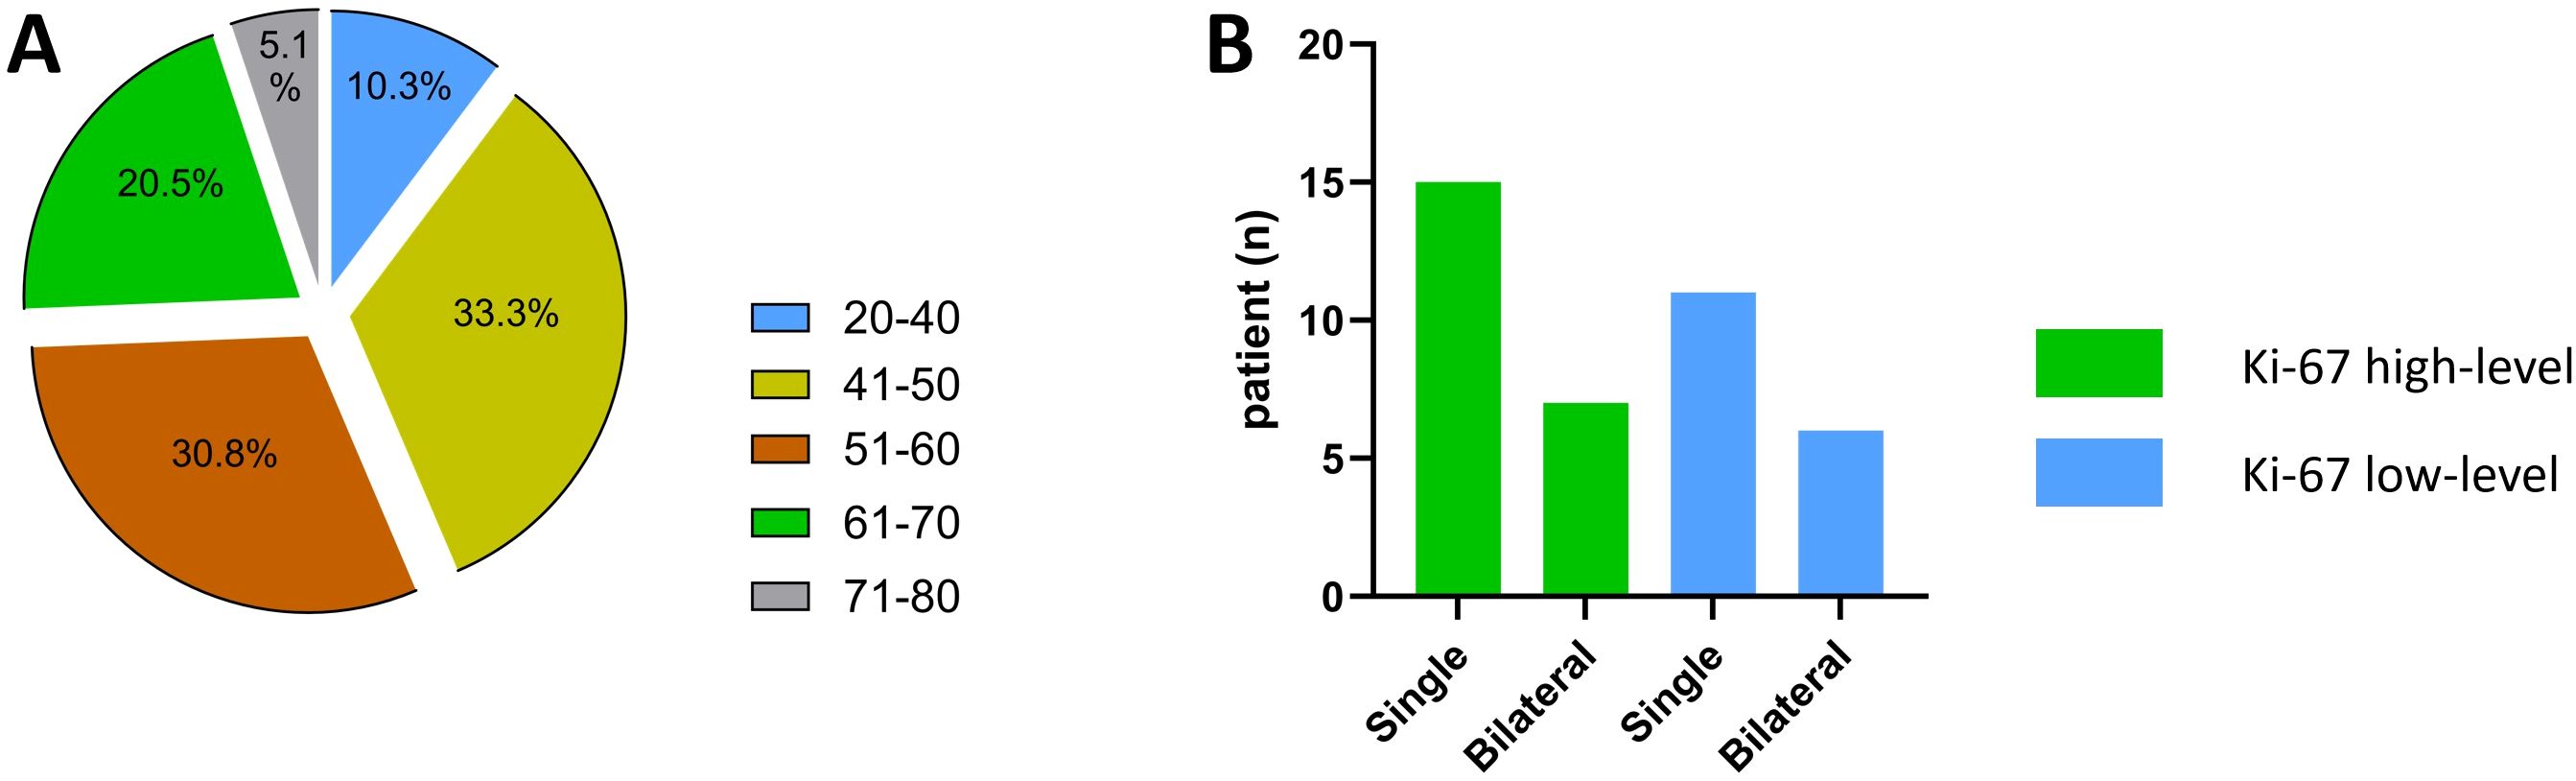
Figure 2. Patient age and lesion Single/Bilateral status. (A) Patient age status; (B) Lesion Single/Bilateral status.
3.2 Consistency in the measurement of spectral CT parameters
The spectral CT quantitative parameter values (IC, Zeff, λHU) of the three phases evaluated showed high consistency (ICC:0.943-0.990), with ICC values all above 0.80; the specific values are presented in Table 2.
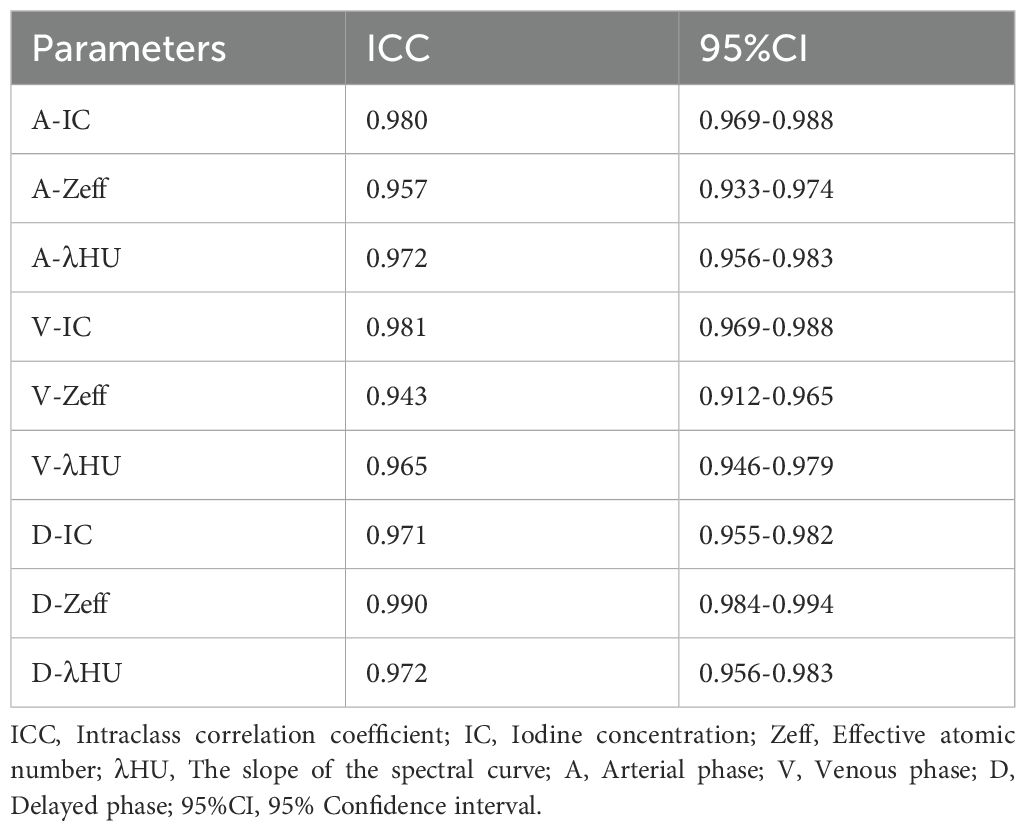
Table 2. Consistency across readers for spectral CT parameters measurement.
3.3 Comparison of spectral CT parameters
Figure 3 and Table 3 show that the spectral CT parameters, including A-sIC, A-sZeff, V-IC, D-Zeff, and D-sZeff, were considerably distinct between the two groups, with the Ki-67 high-level group displaying higher values (mean A-sIC,0.52 ± 0.61vs.0.22 ± 0.23; mean A-sZeff, 0.87 ± 0.16 vs.0.66 ± 0.25; mean V-IC,19.59 ± 13.72 (100μg/cm3) vs.13.01 ± 8.08 (100μg/cm3); mean D-Zeff,8.78 ± 0.84 vs.8.23 ± 0.68; mean D-sZeff,1.08 ± 0.37 vs.0.81 ± 0.28; P<0.05). In addition, for A-IC, A-Zeff, A-λHU, V-sIC, V-Zeff, V-sZeff, V-λHU, D-IC, D-sIC, and D-λHU, the Ki-67 high-level group exhibited somewhat higher values than the low-level group in all three phases. However, all P values were more than 0.05, suggesting that the variation did not approach statistical relevance. Figures 4 and 5 respectively depict the examples with low and high Ki-67 levels.
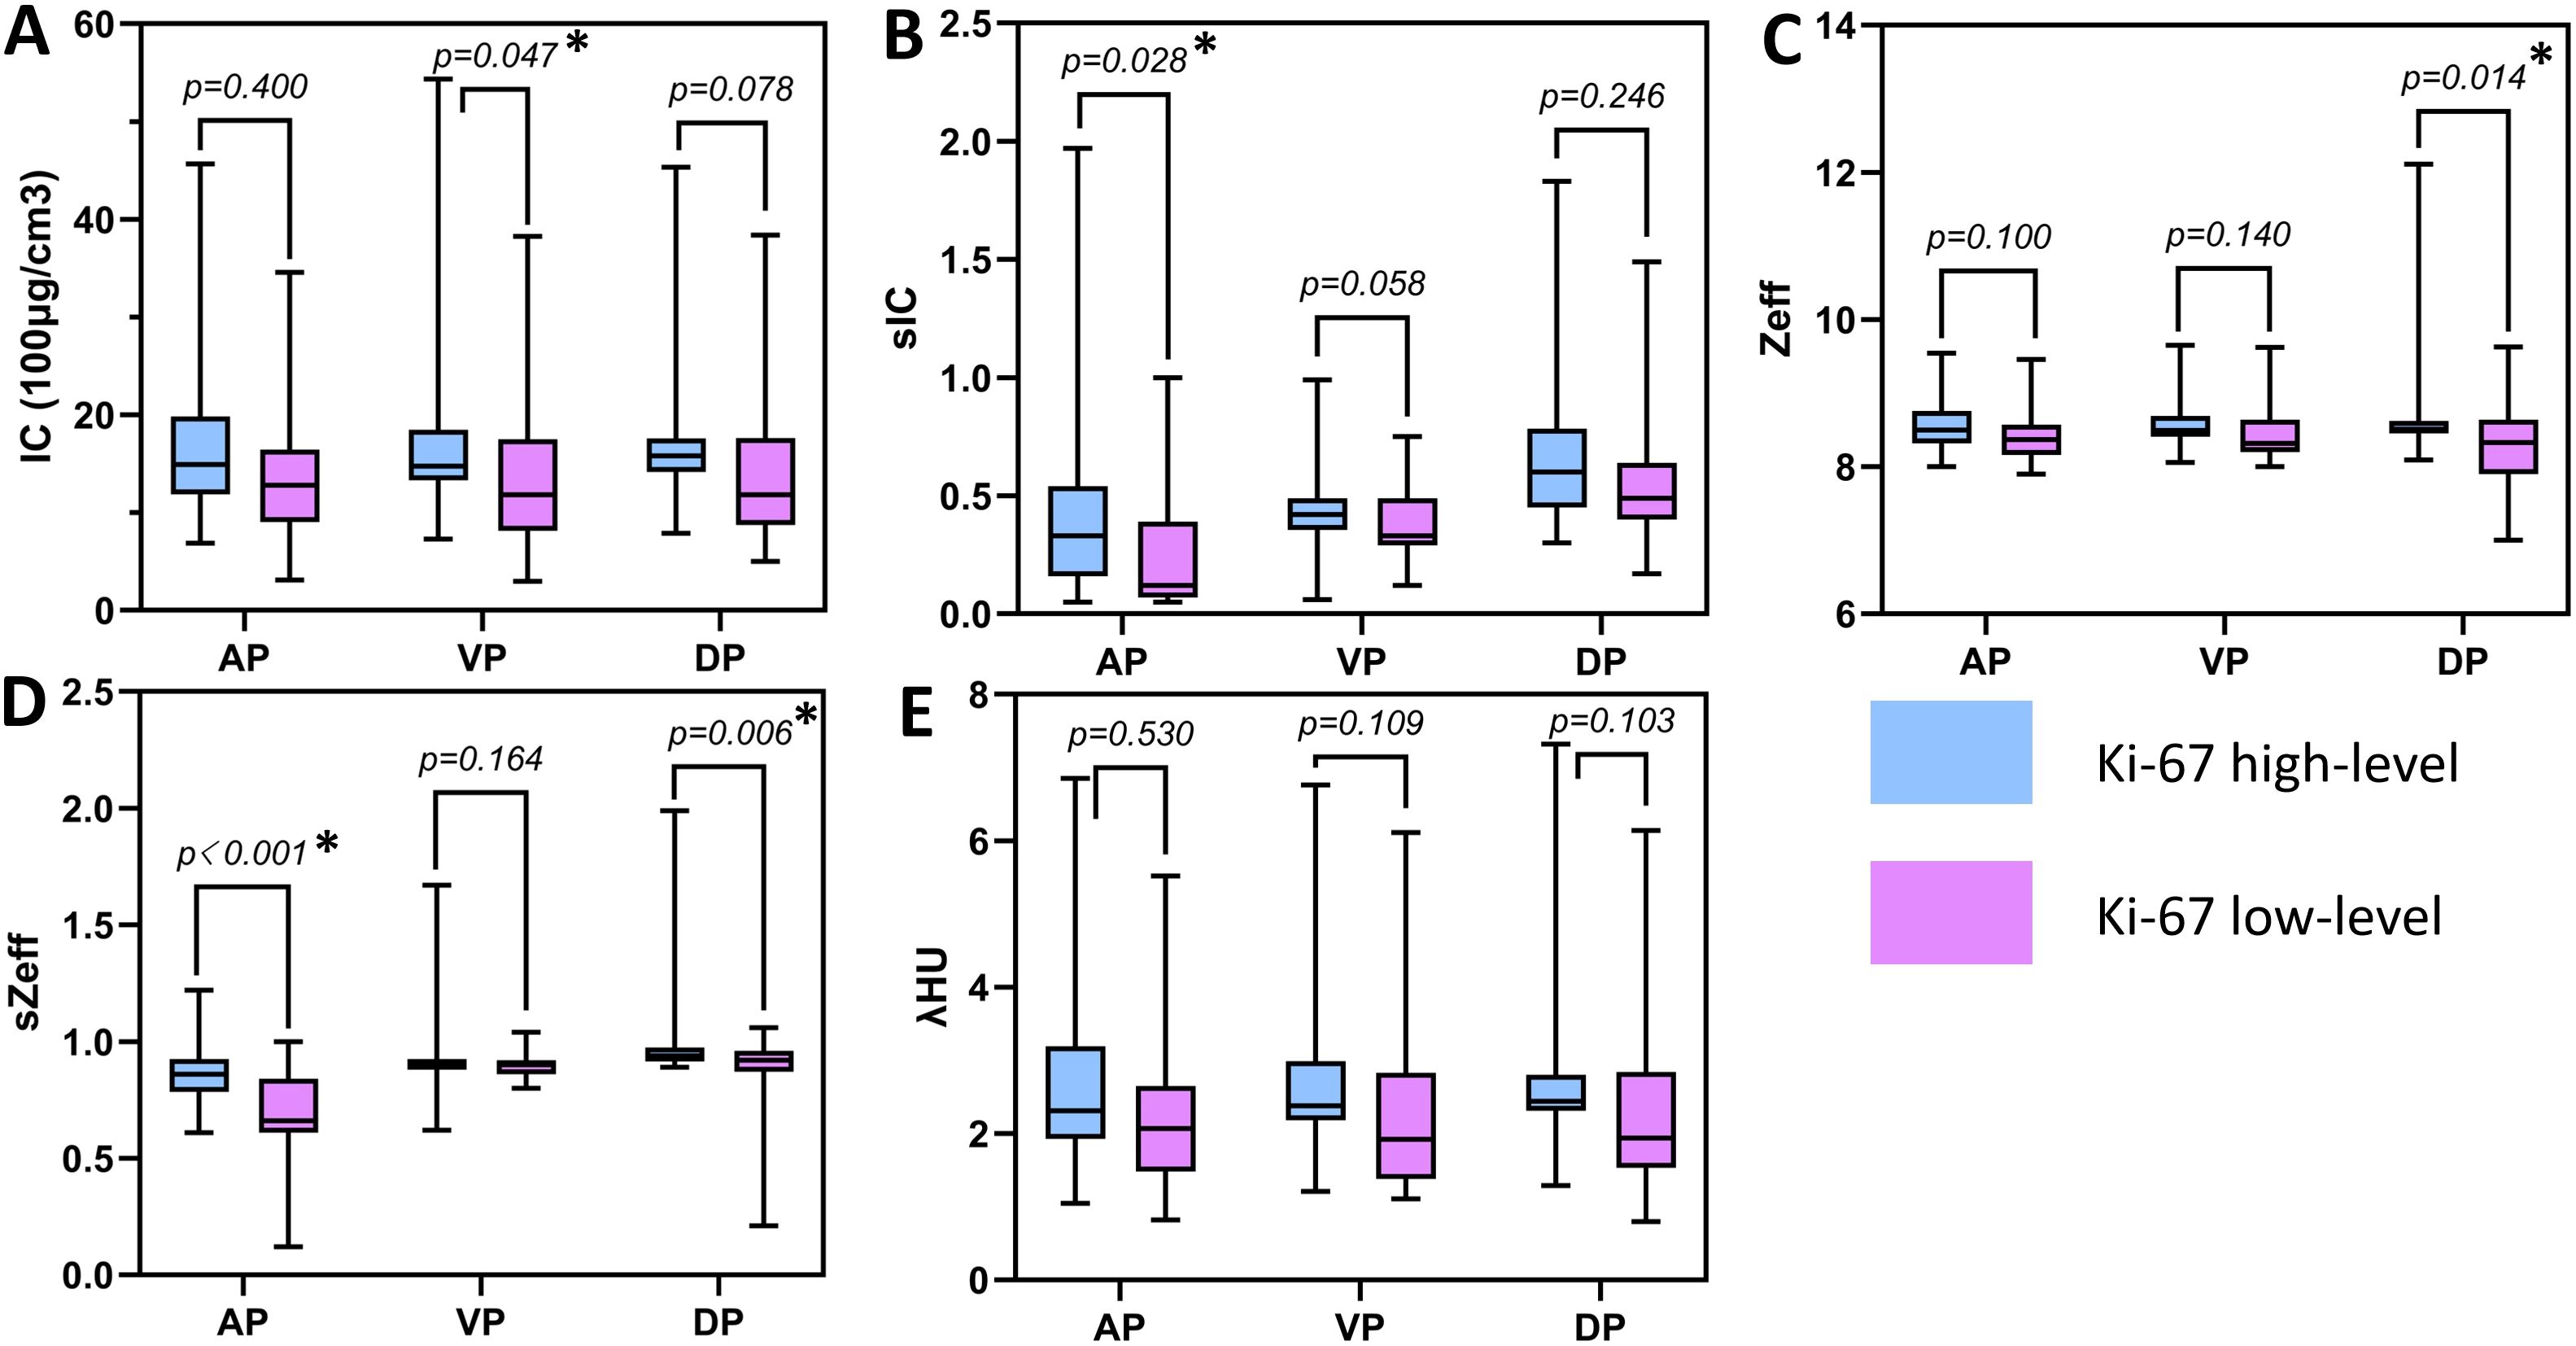
Figure 3. Boxplots of spectral CT parameters between two groups. (A) The IC value between two groups; (B) The sIC value between two groups; (C) The Zeff value between two groups; (D) The sZeff value between two groups; (E) The λHU value between two groups. * indicates the significant difference between two parameters.
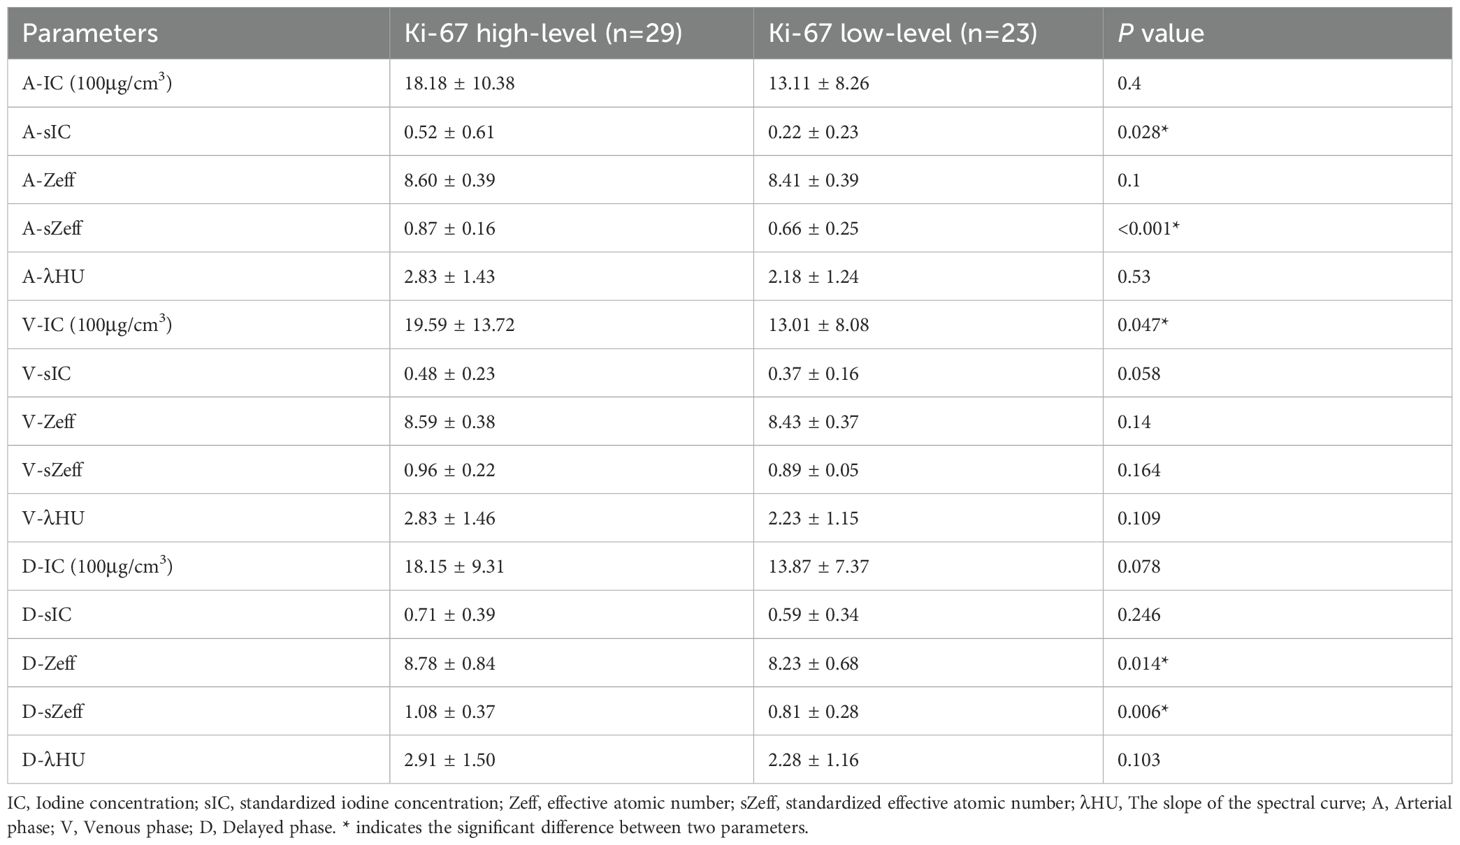
Table 3. Comparative analysis of two groups’ spectral CT parameters.
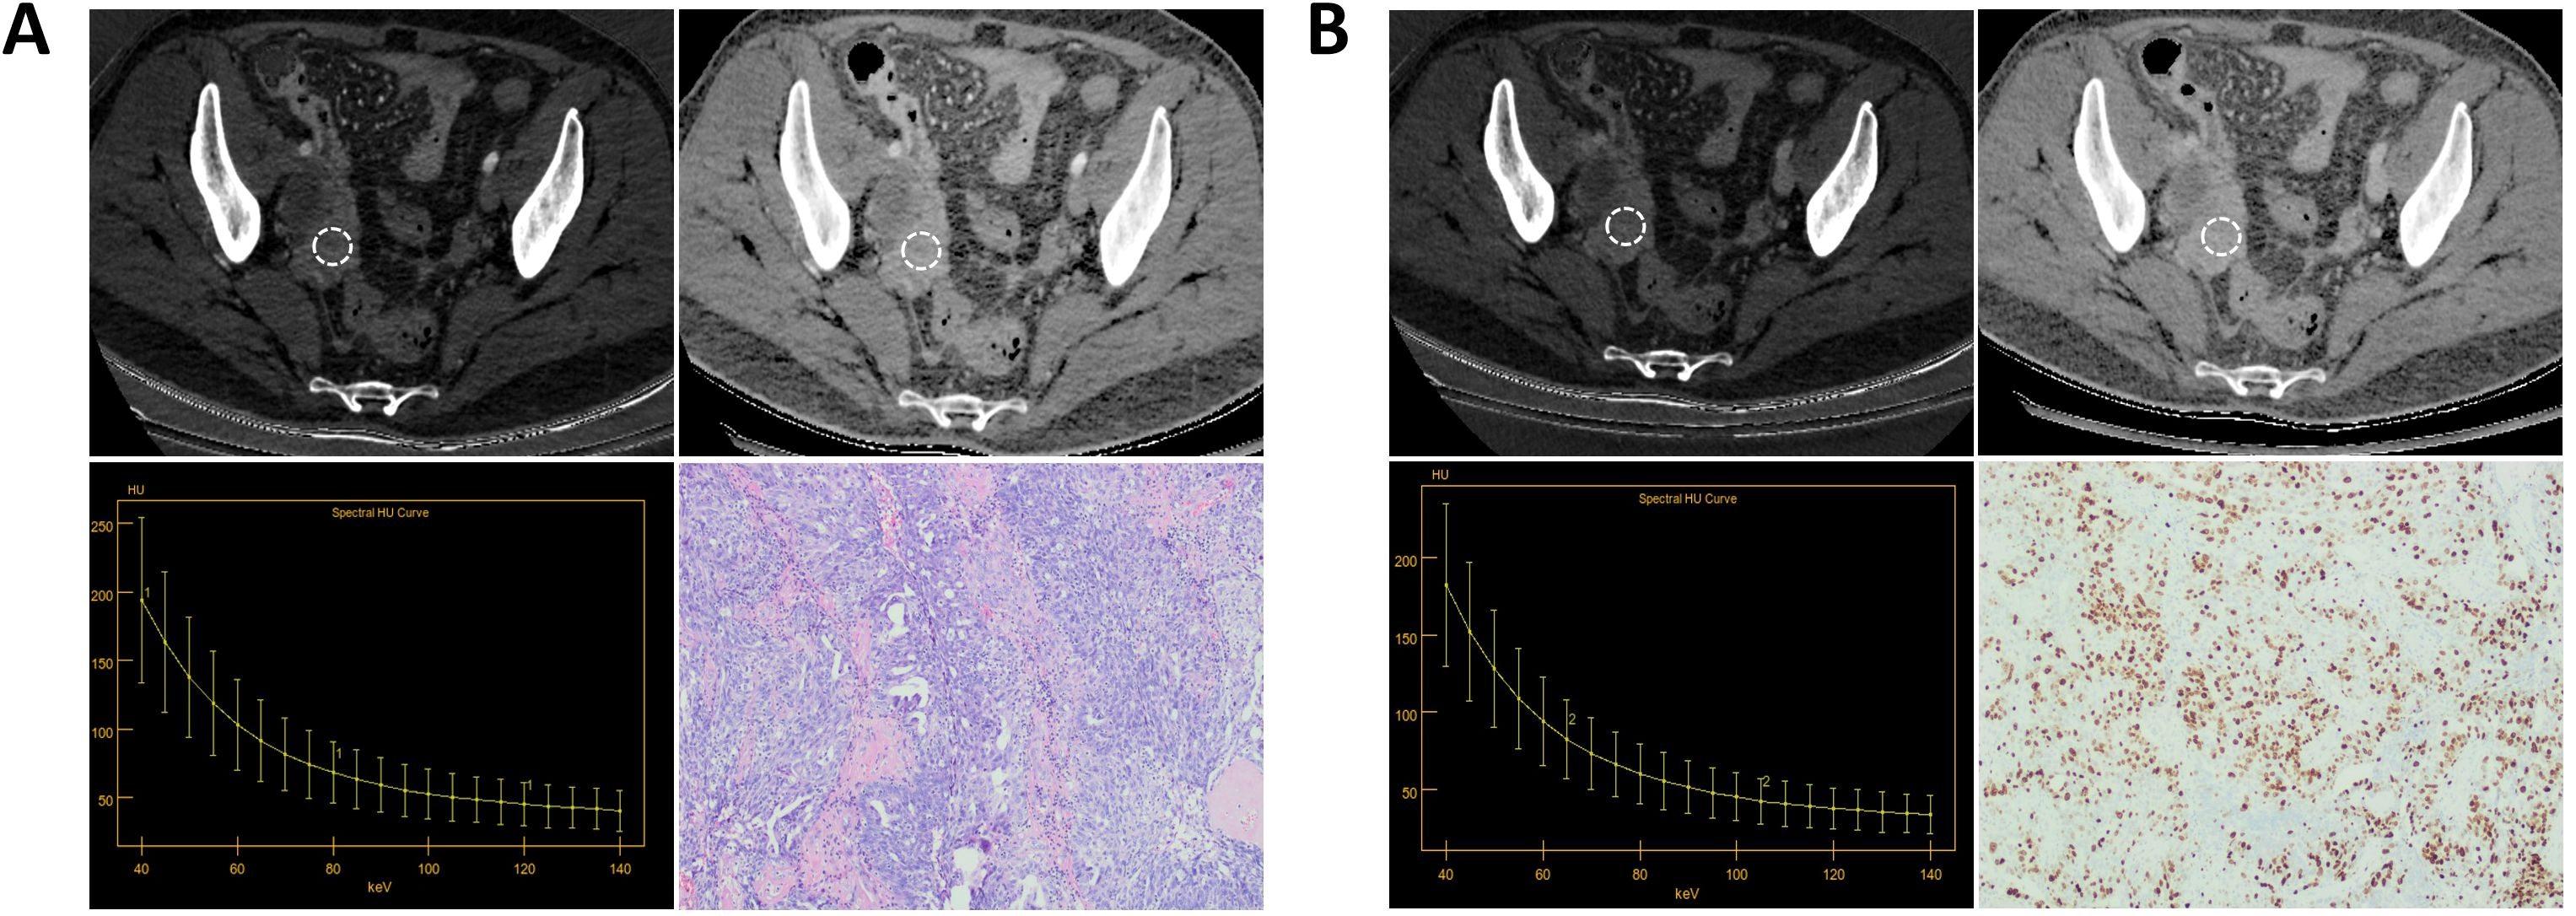
Figure 4. A patient with Ki-67 expression level of 70%. (A) The AP IC value = 17.50×100μg/cm3; The AP Zeff value = 8.63; The AP λHU value = 3.11; HE staining showed high-grade serous carcinoma of the right ovary (magnification, 100x). (B) The VP IC value = 16.13×100μg/cm3; The VP Zeff value = 8.57; The VP λHU value = 3.17; Immunohistochemistry shows Ki-67 positivity of about 70% (magnification, 100x).
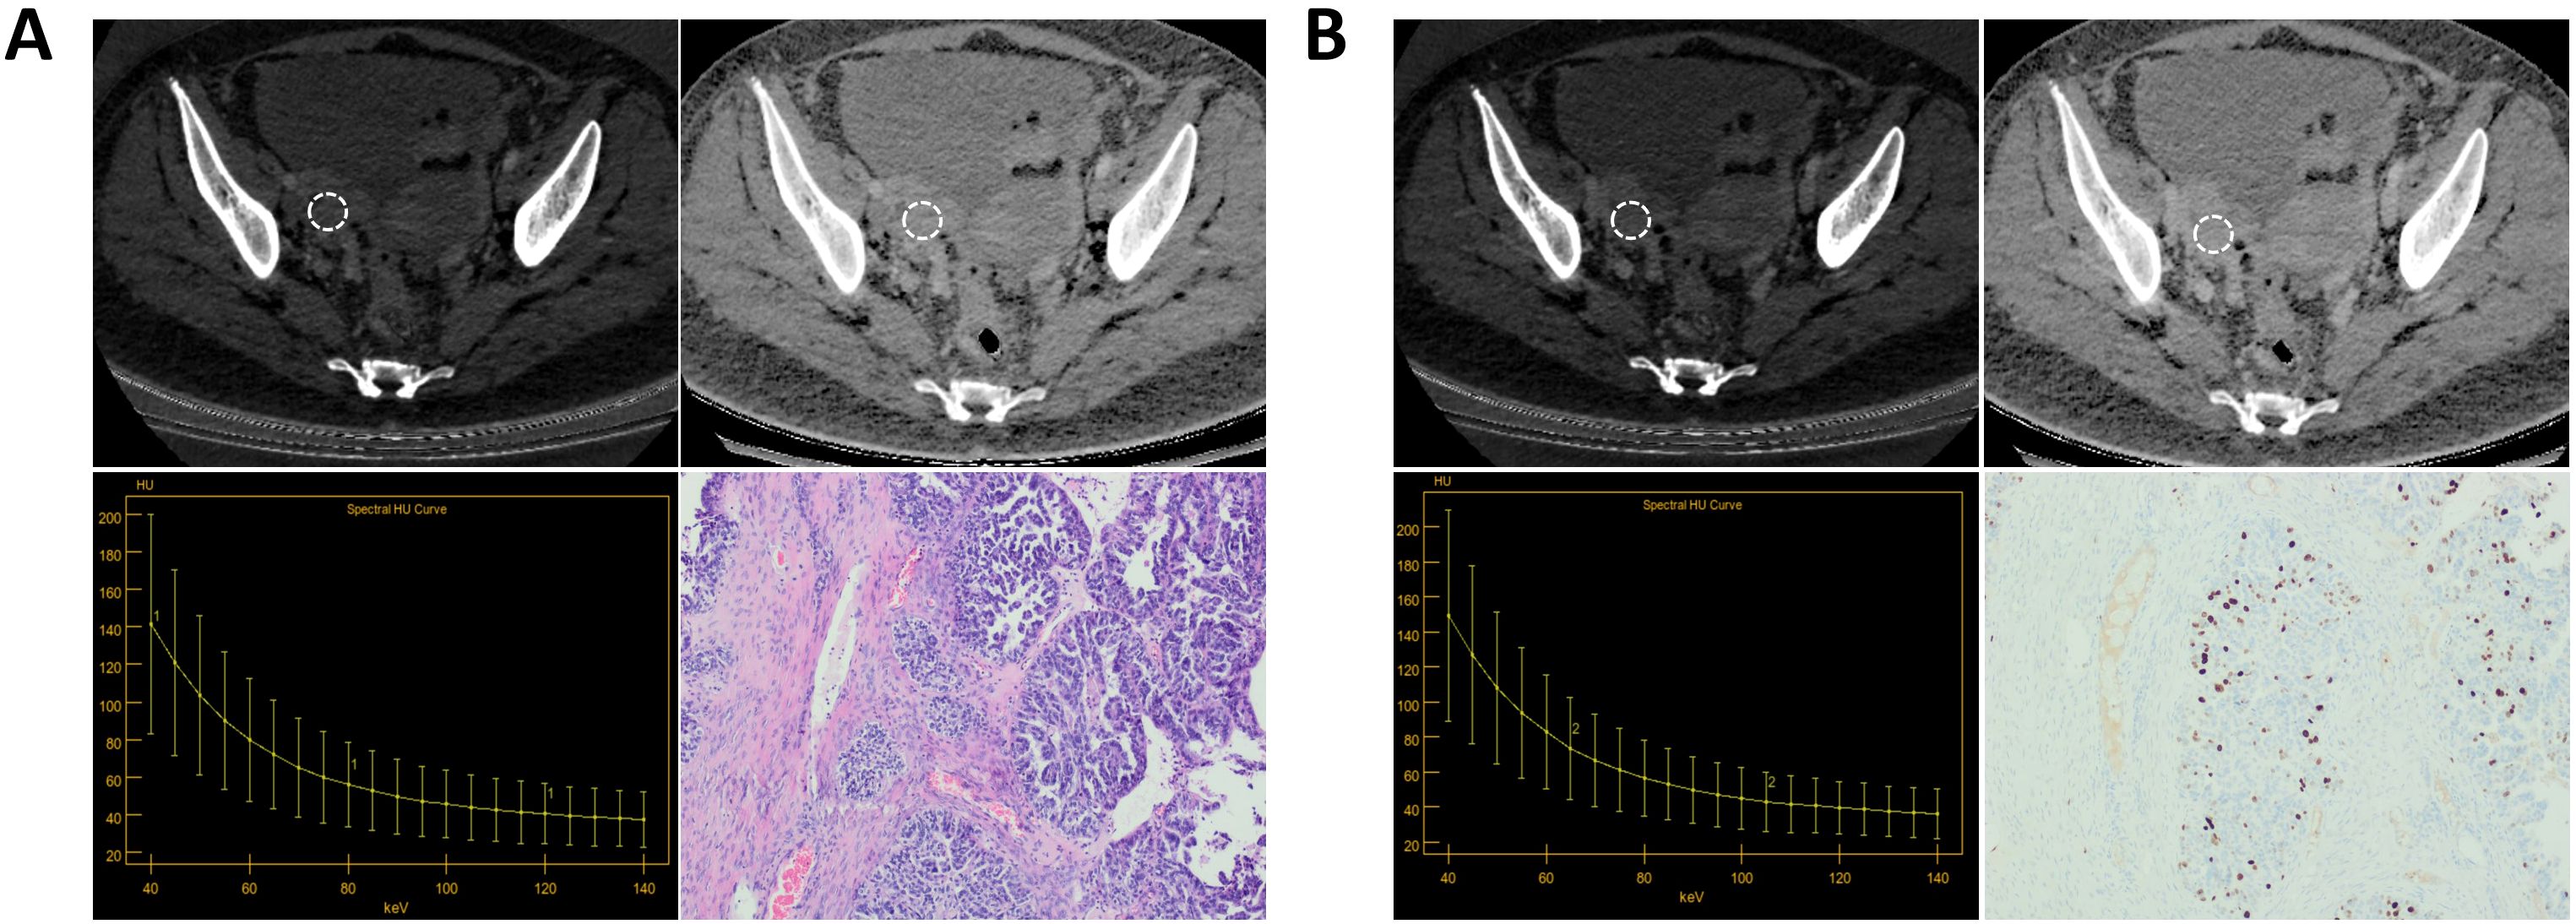
Figure 5. A patient with Ki-67 expression level of 40%. (A) The AP IC value = 12.13×100μg/cm3; The AP Zeff value = 8.34; The AP λHU value=2.08; HE staining showed high-grade serous carcinoma of the right ovary (magnification, 100x). (B) The VP IC value = 10.95×100μg/cm3; The VP Zeff value = 8.26; The VP λHU value =2.30; Immunohistochemistry shows Ki-67 positivity of about 40% (magnification, 100x).
3.4 Correlation analysis between spectral CT parameters and Ki-67 levels
Table 4 shows the correlation coefficients and 95% confidence intervals. The data disclosed a positive correlation between A-IC, A-sIC, A-Zeff, A-sZeff, A-λHU, D-IC, D-Zeff, and D-sZeff with Ki-67 status, with correlation coefficients of 0.301, 0.354, 0.290, 0.417, 0.292, 0.277, 0.284, and 0.301, respectively, all P values < 0.05. Among them, the correlation between A-sZeff and Ki-67 levels was the strongest (r = 0.417), showing a moderate positive correlation, while the other parameters revealed a weak positive correlation(correlation criteria: strong correlation: 0.7 <|r|< 1; moderate correlation: 0.4 <|r|< 0.7;weak correlation: 0 <|r|< 0.4).
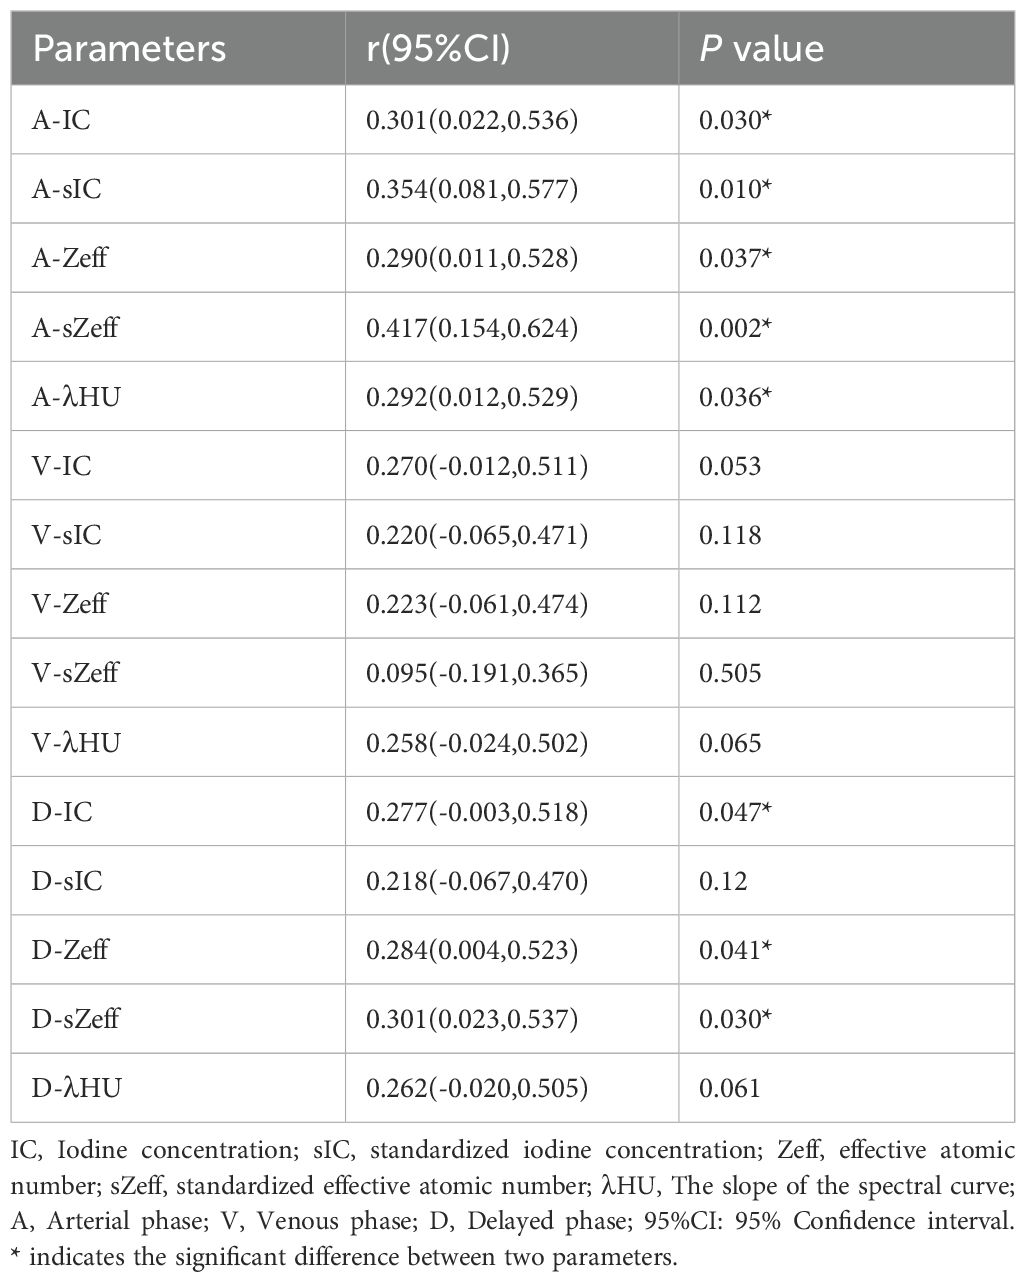
Table 4. Correlation between spectral CT parameters and Ki-67 levels.
3.5 The diagnostic efficacy of spectral CT parameters
The diagnostic potential of a number of significant spectral CT characteristics is shown in Table 5 and Figure 6. For A-sIC, A-sZeff, V-IC, D-Zeff, and D-sZeff, the corresponding AUCs were 0.705, 0.742, 0.657, 0.665, and 0.675. For predicting the Ki-67 status of ovarian cancer, A-sZeff revealed the highest diagnostic efficiency among the single spectral CT measures (AUC = 0.742, 95% CIs: [0.603-0.881], cutoff value = 0.765, sensitivity = 82.80%, specificity = 60.90%). Additionally, the combined model comprising A-sIC, A-sZeff, V-IC, D-Zeff, and D-sZeff showed remarkable efficacy in forecasting the level of Ki-67 of ovarian cancer by multivariate logistic regression (AUC = 0.808, 95% CIs: [0.687-0.929], cutoff value = 0.466, sensitivity = 93.10%, specificity = 60.90%). Through single-factor and multiple-factor logistic regression analysis, it was found that A-sZeff is an independent predictor of Ki-67. Besides, Delong’s test compared the AUC of the combined model with the other individual parameters (A-sIC, A-sZeff, V-IC, D-Zeff, D-sZeff) and showed that there were significant differences (all P values <0.05) between the combined model and other individual parameters, as well as between individual parameters. This result indicates good comparability between the models.
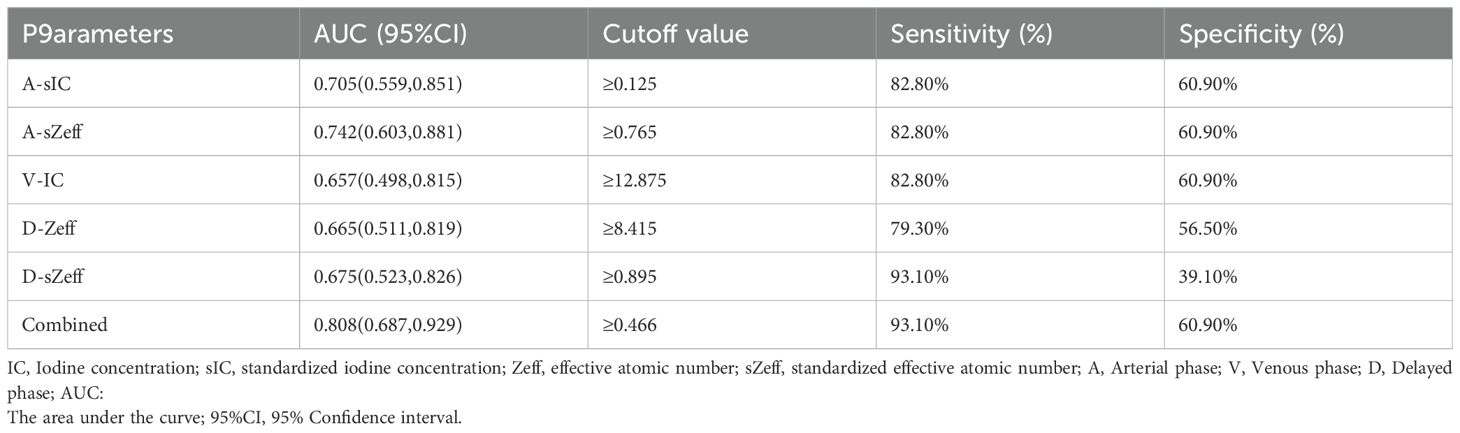
Table 5. Diagnostic performance of spectral CT parameters.
Figure 6. ROC analysis of relevant spectral CT parameters.
4 Discussion
Spectral CT, a novel imaging technique, offers several quantitative characteristics for illness diagnosis and analysis (23, 24). This study examined the relationship between multiple quantitative indicators obtained from spectral CT and Ki-67 levels in ovarian cancer. Our findings indicated that certain spectral CT parameters, such as IC and Zeff, were considerably elevated in the Ki-67 high-level group than in the low-level group. Moreover, in certain phases of IC, sIC, Zeff, sZeff, and λHU values were positively correlated with the Ki-67 level. However, the correlation between spectral parameters and Ki-67 levels is not strong, and the reason for this phenomenon is due to technical limitations or other reasons (such as a small sample size), which require a larger sample size for verification. By comparing the sensitivity and specificity of individual parameters and the combined parameter models, this study discovered that the optimal specificity is low, at roughly 60.9%, and the optimal sensitivity is high, at roughly 93.10%. This result indicates that the possibility of missed diagnosis is relatively small, and the possibility of misdiagnosis is relatively large. The model needs further improvement in the future to improve diagnostic efficiency. Although histology is the gold standard for identifying ovarian cancer, employing spectral CT to predict Ki67 may bring unexpected results to the diagnostic process.
The growth, maturation, and subsequent metastasis of tumor cells are greatly impacted by the blood vessels of tumors (25–27). IC possesses the ability to objectively display the blood flow status within the tumor in numerical form and quantitatively reflect the degree of vascular formation (28–30). Furthermore, NIC has the potential to lessen individual hemodynamic disparities, thereby enhancing the comparability of individuals (31). The A-sIC and V-IC values of the high-level group were markedly greater than those of the low-level group in this study. This finding is in alignment with the reality that cells with high Ki-67 levels exhibit a higher degree of proliferation and are accompanied by denser and more abundant angiogenesis (32, 33).
The effective atomic number of a substance, denoted by Zeff, can also serve as an indicator of the composition of substances within the tumor (34). Substantial distinctions were identified in Zeff between the two groups in this study, with increased Ki-67 levels corresponding to higher values. Furthermore, Zeff displayed a positive correlation with Ki-67 level, which is in line with certain findings from prior research (35, 36). The potential explanation is that cells with elevated Ki-67 expression levels show a greater degree of proliferation, which leads to a more compact arrangement of cells.
Diverse chemical molecules generate diverse energy attenuation curves, and different substances reflect varied chemical molecular structures. Consequently, according to the slope of the spectral curve, the disparity is quantifiable. The chemical compositions of various substances can be ascertained by comparing the inclinations of their spectrum curves (37, 38). However, in this study, we discovered that the λHU failed to vary significantly between two groups, despite the fact that there was a slight difference (P > 0.05). In contrast, Wang et al. (35)observed that the λHU value was considerably greater in the Ki-67 high-level group than in the low-level group. We believe that this variation is owing to the study’s low sample size, as well as the various degrees of tumor differentiation. More research is needed to figure out the efficiency of λHU by expanding the sample size and refining the differentiation degree.
In analyzing the diagnostic efficacy of spectral CT parameters for differentiating Ki-67 levels, ROC analysis findings suggested that the combined model behaved excellently, with relatively high sensitivity and specificity, whereas the univariate model performed moderately. As a result, spectral CT-derived parameters have a high predictive value for Ki-67 level in ovarian cancer, which is critical for predicting prognosis and guiding treatment of ovarian cancer patients.
The study is restricted to specific constraints. Initially, it is retrospective, and selection bias may influence the outcomes. Second, the association between factors may be exaggerated due to the limited sample size utilized in this study, necessitating the inclusion of more participants to corroborate the study’s conclusions. Third, the pathogenic categories and differentiation degrees of ovarian cancers have not been grouped, and more research is needed to substantiate our preliminary conclusions. Additionally, this study is a single-center design and homogeneous patient population, which may limit external validity. Finally, the manual delineation of ROI in this study may have a certain impact on the experimental results, and AI-driven segmentation can be used as an alternative in the future to improve reproducibility.
In conclusion, the level of Ki-67 in ovarian cancer can be predicted using the quantitative characteristics of spectral CT. When it came to differentiating Ki-67 level in ovarian cancer, the multivariate model including spectral parameters performed better diagnostically than the univariate model. Spectral CT-derived IC and Zeff could be helpful metrics for assessing the degree of Ki-67 expression in ovarian cancer. The combined model demonstrated a good diagnostic performance (AUC=0.808), and spectral CT is expected to replace or complement biopsy for Ki-67 assessment in resource-limited settings.
Data availability statement
The original contributions presented in the study are included in the article/supplementary material. Further inquiries can be directed to the corresponding author/s.
Ethics statement
The studies involving humans were approved by Medical Ethics Committee of the second hospital of Jilin University. The second hospital of Jilin University. The studies were conducted in accordance with the local legislation and institutional requirements. The ethics committee/institutional review board waived the requirement of written informed consent for participation from the participants or the participants’ legal guardians/next of kin because This study is a retrospective study.
Author contributions
SP: Conceptualization, Data curation, Formal Analysis, Investigation, Methodology, Project administration, Writing – original draft. MW: Conceptualization, Data curation, Formal Analysis, Writing – original draft. HY: Conceptualization, Formal Analysis, Methodology, Software, Writing – original draft. TM: Data curation, Formal Analysis, Writing – original draft. JL: Conceptualization, Formal Analysis, Methodology, Software, Writing – original draft, Data curation, Funding acquisition, Investigation, Project administration, Resources, Supervision, Validation, Visualization, Writing – review & editing. SL: Data curation, Formal Analysis, Writing – original draft, Conceptualization, Investigation, Methodology, Project administration, Resources, Software, Validation.
Funding
The author(s) declare that financial support was received for the research and/or publication of this article. This work was supported by the Program of Youth Science and Technology Innovation and Entrepreneurship Outstanding Talents (Team) of Jilin Province, China (No.20230508063RC), the Excellent Youth Training Foundation of Jilin University, China (No.419080520665), and the Innovation and Entrepreneurship Talent Funding Program of Jilin Province, China.
Conflict of interest
The authors declare that the research was conducted in the absence of any commercial or financial relationships that could be construed as a potential conflict of interest.
The author(s) declared that they were an editorial board member of Frontiers, at the time of submission. This had no impact on the peer review process and the final decision.
Generative AI statement
The author(s) declare that no Generative AI was used in the creation of this manuscript.
Publisher’s note
All claims expressed in this article are solely those of the authors and do not necessarily represent those of their affiliated organizations, or those of the publisher, the editors and the reviewers. Any product that may be evaluated in this article, or claim that may be made by its manufacturer, is not guaranteed or endorsed by the publisher.
References
2. Armstrong DK, Alvarez RD, Backes FJ, Bakkum-Gamez JN, Barroilhet L, Behbakht K, et al. NCCN guidelines® Insights: ovarian cancer, version 3.2022. J Natl Compr Canc Netw. (2022) 20:972–80. doi: 10.6004/jnccn.2022.0047
3. Gao JB, Sun YS. Expert consensus on standardized process of imaging examination and diagnosis of gastric cancer (2022 edition). Zhonghua Wei Chang Wai Ke Za Zhi. (2022) 25:859–68. doi: 10.3760/cma.j.cn441530-20220703-00295
4. Xiao Y, Bi M, Guo H, Li M. Multi-omics approaches for biomarker discovery in early ovarian cancer diagnosis. EBioMedicine. (2022) 79:104001. doi: 10.1016/j.ebiom.2022.104001
5. O’Shea AS. Clinical staging of ovarian cancer. Methods Mol Biol. (2022) 2424:3–10. doi: 10.1007/978-1-0716-1956-8_1
6. Garsed DW, Pandey A, Fereday S, Kennedy CJ, Takahashi K, Alsop K, et al. The genomic and immune landscape of long-term survivors of high-grade serous ovarian cancer. Nat Genet. (2022) 54:1853–64. doi: 10.1038/s41588-022-01230-9
7. Andrés-Sánchez N, Fisher D, Krasinska L. Physiological functions and roles in cancer of the proliferation marker Ki-67. J Cell Sci. (2022) 135:jcs258932. doi: 10.1242/jcs.258932
8. Centonze G, Maisonneuve P, Simbolo M, Lagano V, Grillo F, Fabbri A, et al. Lung carcinoid tumours: histology and Ki-67, the eternal rivalry. Histopathology. (2023) 82:324–39. doi: 10.1111/his.14819
9. Rödel F, Zhou S, Győrffy B, Raab M, Sanhaji M, Mandal R, et al. The prognostic relevance of the proliferation markers ki-67 and plk1 in early-stage ovarian cancer patients with serous, low-grade carcinoma based on mRNA and protein expression. Front Oncol. (2020) 10:558932. doi: 10.3389/fonc.2020.558932
10. Du M, Zou D, Gao P, Yang Z, Hou Y, Zheng L, et al. Evaluation of a continuous-time random-walk diffusion model for the differentiation of Malignant and benign breast lesions and its association with Ki-67 expression. NMR BioMed. (2023) 36:e4920. doi: 10.1002/nbm.v36.8
11. Li Z, Li F, Pan C, He Z, Pan X, Zhu Q, et al. Tumor cell proliferation (Ki-67) expression and its prognostic significance in histological subtypes of lung adenocarcinoma. Lung Cancer. (2021) 154:69–75. doi: 10.1016/j.lungcan.2021.02.009
12. Wang Y, Zhang S, Yu W, Wang Y, Yan F, Yang B. The role of ADC value and Ki-67 index in predicting the response to neoadjuvant chemotherapy in advanced stages of olfactory neuroblastoma. Br J Radiol. (2022) 95:20220367. doi: 10.1259/bjr.20220367
13. Engbersen MP, Van Driel W, Lambregts D, Lahaye M. The role of CT, PET-CT, and MRI in ovarian cancer. Br J Radiol. (2021) 94:20210117. doi: 10.1259/bjr.20210117
14. Hu X, Li D, Liang Z, Liao Y, Yang L, Wang R, et al. Indirect comparison of the diagnostic performance of (18)F-FDG PET/CT and MRI in differentiating benign and Malignant ovarian or adnexal tumors: a systematic review and meta-analysis. BMC Cancer. (2021) 21:1080. doi: 10.1186/s12885-021-08815-3
15. Sauerbeck J, Adam G, Meyer M. Spectral CT in oncology. Rofo. (2023) 195:21–9. doi: 10.1055/a-1902-9949
16. Li J, Chen X, Xu S, Wang Y, Ma F, Wu Y, et al. Predicting pathologic response to neoadjuvant chemotherapy in locally advanced gastric cancer: The establishment of a spectral CT-based nomogram from prospective datasets. Eur J Surg Oncol. (2024) 50:108020. doi: 10.1016/j.ejso.2024.108020
17. Elsherif SB, Zheng S, Ganeshan D, Iyer R, Wei W, Bhosale PR. Does dual-energy CT differentiate benign and Malignant ovarian tumours? Clin Radiol. (2020) 75:606–14. doi: 10.1016/j.crad.2020.03.006
18. Han X, Li B, Sun M, Li J, Li Y, Liu A. Application of contrast-enhanced dual-energy spectral CT for differentiating borderline from Malignant epithelial ovarian tumours. Clin Radiol. (2021) 76:585–92. doi: 10.1016/j.crad.2021.04.004
19. Ayerden D, Tayfur M, Balci MG. Comparison of histopathological findings of the colon adenomas and adenocarcinomas with cyclin D1 and Ki-67 expression. Niger J Clin Pract. (2021) 24:1737–41. doi: 10.4103/njcp.njcp_68_21
20. Skjervold AH, Pettersen HS, Valla M, Opdahl S, Bofin AM. Visual and digital assessment of Ki-67 in breast cancer tissue - a comparison of methods. Diagn Pathol. (2022) 17:45. doi: 10.1186/s13000-022-01225-4
21. Wang X, Xu C, Grzegorzek M, Sun H. Habitat radiomics analysis of pet/ct imaging in high-grade serous ovarian cancer: Application to Ki-67 status and progression-free survival. Front Physiol. (2022) 13:948767. doi: 10.3389/fphys.2022.948767
22. Qiu D, Cai W, Zhang Z, Li H, Zhou D. High Ki-67 expression is significantly associated with poor prognosis of ovarian cancer patients: evidence from a meta-analysis. Arch Gynecol Obstet. (2019) 299:1415–27. doi: 10.1007/s00404-019-05082-3
23. Cao X, Hu HG, Shen M, Deng K, Wu N. Correlation between quantitative spectral CT parameters and ki-67 expression in lung adenocarcinomas manifesting as ground-glass nodules. Curr Med Imaging. (2023) 19:1052–62. doi: 10.2174/1573405619666221230120528
24. Deng L, Yang J, Jing M, Zhang B, Han T, Zhang Y, et al. Differentiating invasive thymic epithelial tumors from mediastinal lung cancer using spectral CT parameters. Jpn J Radiol. (2023) 41:973–82. doi: 10.1007/s11604-023-01428-9
25. Liu ZL, Chen HH, Zheng LL, Sun LP, Shi L. Angiogenic signaling pathways and anti-angiogenic therapy for cancer. Signal Transduct Target Ther. (2023) 8:198. doi: 10.1038/s41392-023-01460-1
26. Dudley AC, Griffioen AW. Pathological angiogenesis: mechanisms and therapeutic strategies. Angiogenesis. (2023) 26:313–47. doi: 10.1007/s10456-023-09876-7
27. Liu H, Lan W. Imaging features of rare ovarian adenomyoma. iRADIOLOGY. (2025) 3:176–7. doi: 10.1002/ird3.v3.2
28. Trimarchi R, Migliaccio N, Bucolo GM, Abate C, Aricò FM, Ascenti V, et al. Spectral CT for non-invasive evaluation of bladder cancer grade. Abdom Radiol (NY). (2024) 50:2232–40. doi: 10.1007/s00261-024-04683-0
29. Li R, Li J, Wang X, Liang P, Gao J. Detection of gastric cancer and its histological type based on iodine concentration in spectral CT. Cancer Imaging. (2018) 18:42. doi: 10.1186/s40644-018-0176-2
30. Du M, Wang X, Zhuang S, Lou K, Li G, Xie X, et al. Quantitative parameters in novel spectral computed tomography for assessing gastric cancer and cell proliferation. Eur J Radiol. (2023) 167:111052. doi: 10.1016/j.ejrad.2023.111052
31. Gong X, Guo Y, Zhu T, Xing D, Shi Q, Zhang M. Noninvasive assessment of significant liver fibrosis in rabbits by spectral CT parameters and texture analysis. Jpn J Radiol. (2023) 41:983–93. doi: 10.1007/s11604-023-01423-0
32. Davey MG, Hynes SO, Kerin MJ, Miller N, Lowery AJ. Ki-67 as a prognostic biomarker in invasive breast cancer. Cancers (Basel). (2021) 13:4455. doi: 10.3390/cancers13174455
33. Liu Q, Peng Z, Shen L, Shen L. Prognostic and clinicopathological value of ki-67 in melanoma: A meta-analysis. Front Oncol. (2021) 11:737760. doi: 10.3389/fonc.2021.737760
34. Zhan Y, Wang Y, Wang P, Wang Y, Ni X, Wang J, et al. Pretreatment dual-energy CT for predicting early response to induction chemotherapy and survival in nasopharyngeal carcinoma. Eur Radiol. (2023) 33:9052–62. doi: 10.1007/s00330-023-09837-0
35. Wang P, Tang Z, Xiao Z, Wu L, Hong R, Duan F, et al. Dual-energy CT in predicting Ki-67 expression in laryngeal squamous cell carcinoma. Eur J Radiol. (2021) 140:109774. doi: 10.1016/j.ejrad.2021.109774
36. Wang X, Liu D, Zeng X, Jiang S, Li L, Yu T, et al. Dual-energy CT quantitative parameters for evaluating Immunohistochemical biomarkers of invasive breast cancer. Cancer Imaging. (2021) 21:4. doi: 10.1186/s40644-020-00370-7
37. Zhu Q, Sun J, Zhu W, Chen W, Ye J. Spectral CT imaging versus conventional CT post-processing technique in differentiating Malignant and benign renal tumors. Br J Radiol. (2023) 96:20230147. doi: 10.1259/bjr.20230147
Keywords: ovarian cancer, Ki-67 level, quantitative parameters, iodine concentration, effective atomic number, the slope of the spectral curve, spectral CT
Citation: Pang S, Wu M, Yu H, Ma T, Liu J and Liu S (2025) The value of spectral CT quantitative parameters in predicting Ki-67 level in ovarian cancer. Front. Oncol. 15:1576690. doi: 10.3389/fonc.2025.1576690
Received: 14 February 2025; Accepted: 22 April 2025;
Published: 14 May 2025.
Edited by:
Shuai Ren, Affiliated Hospital of Nanjing University of Chinese Medicine, ChinaReviewed by:
Demao Deng, Guangxi Academy of Medical Sciences, ChinaPengfei Rong, Central South University, China
Xiao-Jing He, He Xiaojing, China
Copyright © 2025 Pang, Wu, Yu, Ma, Liu and Liu. This is an open-access article distributed under the terms of the Creative Commons Attribution License (CC BY). The use, distribution or reproduction in other forums is permitted, provided the original author(s) and the copyright owner(s) are credited and that the original publication in this journal is cited, in accordance with accepted academic practice. No use, distribution or reproduction is permitted which does not comply with these terms.
*Correspondence: Jianhua Liu, jian_hua@jlu.edu.cn; Siwen Liu, lsw22@mails.jlu.edu.cn