 Jingna Tao
 Zhongmian Zhang2†
 Linghan Meng
 Liju Zhang
 Jiaqi Wang
 Zhihong Li
94% of researchers rate our articles as excellent or good
Learn more about the work of our research integrity team to safeguard the quality of each article we publish.
Find out more
ORIGINAL RESEARCH article
Front. Oncol., 04 April 2025
Sec. Gastrointestinal Cancers: Gastric and Esophageal Cancers
Volume 15 - 2025 | https://doi.org/10.3389/fonc.2025.1554523
Background: This study aimed to construct and validate diagnostic models for the Operative Link on Gastritis Assessment (OLGA) and Operative Link on Gastric Intestinal Metaplasia Assessment (OLGIM) staging systems using three different methodologies based on magnifying endoscopy with narrow-band imaging (ME-NBI) features, to evaluate model performance, and to analyse risk factors for high-risk OLGA/OLGIM stages.
Methods: We enrolled 356 patients who underwent white-light endoscopy and ME-NBI at the Department of Gastroenterology, Dongzhimen Hospital, Beijing University of Chinese Medicine, between January 2022 and September 2023. Clinical data were recorded. Chi-square or Fisher’s exact tests were used to analyse differences in endoscopic features between OLGA/OLGIM stages. Variables showing statistical significance underwent collinearity diagnosis before model inclusion. We constructed predictive models using Bayesian stepwise discrimination, random forest, and XGBoost algorithms. Receiver operating characteristic (ROC) curves were plotted using Python 3.12.4. Model accuracy, area under the ROC curve (AUC), sensitivity, and specificity were calculated for comprehensive validation.
Results: All three models demonstrated excellent diagnostic performance, with random forest and XGBoost models showing marginally superior accuracy, AUC values, and sensitivity compared with the Bayesian stepwise discrimination model. For OLGA staging, the AUC values were 0.928, 0.958, and 0.966, with accuracies of 0.854, 0.902, and 0.918 for Bayesian, random forest, and XGBoost models, respectively. For OLGIM staging, the corresponding AUC values were 0.924, 0.975, and 0.979, with accuracies of 0.910, 0.938, and 0.927. Risk factors for high-risk OLGA included lesion location (subcardial and lower body greater curvature), intestinal metaplasia patches, lesion size, demarcation line (DL), and margin regularity of micro-capillary demarcation line (MCDL). Risk factors for high-risk OLGIM included Helicobacter pylori infection status, mucosal condition, lesion location (lesser curvature and lower body greater curvature), erosion, lesion size, DL, vessel and epithelial classification (VEC), white globe appearance (WGA), and MCDL margin regularity.
Conclusions: All three models demonstrated robust accuracy and predictive capability, confirming that conventional white-light endoscopy combined with ME-NBI features provides valuable diagnostic reference for clinical risk assessment of precancerous gastric lesions.
Gastric cancer is the fifth most common malignant tumour globally and ranks fourth among cancer-related deaths, accounting for 7.7% of total cancer mortality and posing a serious threat to human health (1). Helicobacter pylori (H. pylori) has been classified as a Group 1 carcinogen by the World Health Organisation and the International Agency for Research on Cancer consensus group (2). Studies have shown that H. pylori infection is associated with both intestinal and diffuse types of gastric cancer (3), making it the most common risk factor. H. pylori infection leads to persistent chronic active mucosal inflammation, potentially progressing to chronic atrophic gastritis (CAG), intestinal metaplasia (IM), and dysplasia (Dys) (4). Advanced stages of CAG, IM, and Dys are recognised as precancerous conditions (5, 6). Therefore, early and accurate diagnosis of precancerous gastric lesions is crucial for identifying high-risk patients.
The Operative Link on Gastritis Assessment (OLGA) and Operative Link on Gastric Intestinal Metaplasia Assessment (OLGIM) systems, evolved from the Sydney System (7, 8), reflect the severity of atrophy and intestinal metaplasia and assess gastric cancer risk. These systems have significant clinical value in gastric cancer screening and precancerous lesion surveillance (9). OLGA and OLGIM staging systems are based on histopathological examination following endoscopic forceps biopsy (EFB). Whilst histopathological examination remains the ‘gold standard’, this method presents notable limitations. EFB, being a point-sampling technique with limited specimen size, often fails to fully represent tumour cell heterogeneity, resulting in diagnostic deviation rates of 1.5%-8.0% (10–12). Although increasing the number of biopsies may enhance diagnostic accuracy, this approach can lead to mucosal injury and fibrosis, potentially compromising subsequent endoscopic interventions. Hence, there is an urgent need for a more comprehensive method to accurately determine lesion characteristics, extent, and identify high-risk mucosa. Endoscopic examination, compared to EFB histopathological assessment, offers the advantage of obtaining more comprehensive information about gastric mucosal lesions.
Magnifying endoscopy (ME) enables real-time observation of mucosal surface microstructures, whilst narrow-band imaging (NBI) is an emerging optical technology that aids in detecting early cancer and precancerous lesions (13, 14). The combination of ME and NBI provides clearer visualisation of fine mucosal surface microstructures and microvascular patterns, serving as a powerful tool for characterising gastric mucosal lesions and detecting early gastric cancer (15–17). The combination of conventional white-light endoscopy (C-WLE) and magnifying endoscopy with narrow-band imaging (ME-NBI) enables more sensitive detection of high-risk gastric mucosa through detailed mucosal characterisation. This approach also facilitates targeted EFB sampling, thereby improving the identification of precancerous gastric lesions. However, the predictive value of endoscopic mucosal features for high-risk OLGA/OLGIM stages is still uncertain, representing a critical gap in current diagnostic methods. This study is designed as both a development and validation study to address this gap by developing and validating diagnostic machine learning models. Indeed, the application of AI in the diagnosis and management of gastric diseases is rapidly expanding (18). To enhance OLGA/OLGIM risk stratification, artificial intelligence (AI) methodologies present a compelling advancement in diagnostic capabilities. Through systematic analysis of features obtained via magnifying endoscopy with narrow-band imaging (ME-NBI), AI systems can deliver more objective, consistent, and precise classification of precancerous lesion risk. This enhanced analytical approach facilitates more accurate patient risk stratification, potentially leading to optimised clinical decision-making and improved patient outcomes.
This study aims to stratify patients into OLGA/OLGIM stages and to construct and validate diagnostic models based on conventional white-light endoscopy (C-WLE) and ME-NBI features, employing Bayesian stepwise discrimination, random forest, and XGBoost algorithms. These models were selected for their complementary strengths: Bayesian models offer interpretability, random forests excel in feature selection, and XGBoost is renowned for its high predictive accuracy and ability to handle complex non-linear relationships, offering a comprehensive approach compared to relying solely on traditional endoscopic assessment or more complex ‘black-box’ deep learning models which may be less transparent and require larger datasets. Analysing endoscopic risk factors for high-risk OLGA/OLGIM patients will provide evidence for improved endoscopic identification of high-risk H. pylori-related precancerous lesions. The ultimate goal is to provide gastroenterologists with a practical, AI-enhanced tool that can improve the real-world clinical diagnosis of precancerous gastric lesions, potentially leading to more targeted biopsies, earlier detection of high-risk patients, and improved patient management strategies.
This study collected clinical data from 356 patients who underwent C-WLE and ME-NBI examinations with histopathological results at the Endoscopy Centre of Dongzhimen Hospital, Beijing University of Chinese Medicine, between January 2022 and September 2023. Patient identifiers, including names, addresses, and contact information, were anonymised. The study was approved by the Ethics Committee of Dongzhimen Hospital, Beijing University of Chinese Medicine. The sample size (n=356) is comparable to similar machine learning studies in this field (19, 20). Whilst modest for complex models, especially with class imbalance, we employed SMOTE to mitigate this limitation. Larger, multi-centre validation is planned for future research.
(1) Age ≥18 years
(2) Completion of both C-WLE and ME-NBI examinations
(3) Availability of standardised biopsy histopathological results suitable for OLGA/OLGIM staging
(4) Complete clinical data, including basic demographic characteristics, endoscopic findings, and pathological diagnoses
(1) Autoimmune gastritis (type A chronic atrophic gastritis)
(2) Inadequate pathological sampling preventing OLGA/OLGIM staging
(3) Concurrent gastroduodenal ulcer or upper gastrointestinal bleeding
(4) Previous gastric surgery or history of any gastrointestinal tumours
(5) Other conditions deemed unsuitable for inclusion by investigators
These exclusion criteria were necessary to ensure a homogeneous study population focused on H. pylori-related precancerous lesions and to obtain reliable endoscopic and histopathological data. Specifically, autoimmune gastritis was excluded due to its distinct pathogenesis, whilst conditions such as ulcers and bleeding were excluded to prevent compromise of endoscopic image quality and biopsy accuracy. Whilst these exclusions strengthen internal validity, we acknowledge they may limit the model’s generalisability, which will be discussed further.
1. Demographic characteristics: sex, age
2. Endoscopic lesion characteristics: According to the Kyoto Classification of Gastritis (21), C-WLE and ME-NBI features were described as follows:
i. H. pylori infection status (none, current, or past infection), Figure 1
ii. Lesion location and orientation (subcardial, lesser curvature of the gastric body, gastric fundus, gastric angle, gastric antrum, anterior and posterior walls of the upper gastric body, greater curvature of the lower gastric body, pre-pyloric region)
iii. C-WLE features: mucosal status (none, map-like redness, chicken skin appearance, diffuse redness, mucosal oedema), number of lesions, size, border clarity, gross morphology (elevated, flat, or depressed), colour (compared with surrounding mucosa: same, pale, or red), surrounding mucosal conditions (erosion, surface nodularity, ulceration, or intestinal metaplasia patches)
iv. ME-NBI features: presence or absence of demarcation line (DL), irregular microvascular pattern (IMVP), irregular microsurface pattern (IMSP), light blue crest (LBC), white opaque substance (WOS), white globe appearance (WGA), vessels within epithelial circle (VEC) pattern, and multiple convex demarcation line (MCDL), as well as the clarity and regularity of the DL boundary (Figure 2).
3. Histopathological Diagnosis: According to the 2019 European Guidelines on Management of Precancerous Conditions and Lesions in the Stomach (22) and the 2022 Chinese Guidelines for Chronic Gastritis (23), histological results were staged with OLGA/OLGIM stages 0-II defined as low-risk and stages III-IV as high-risk.
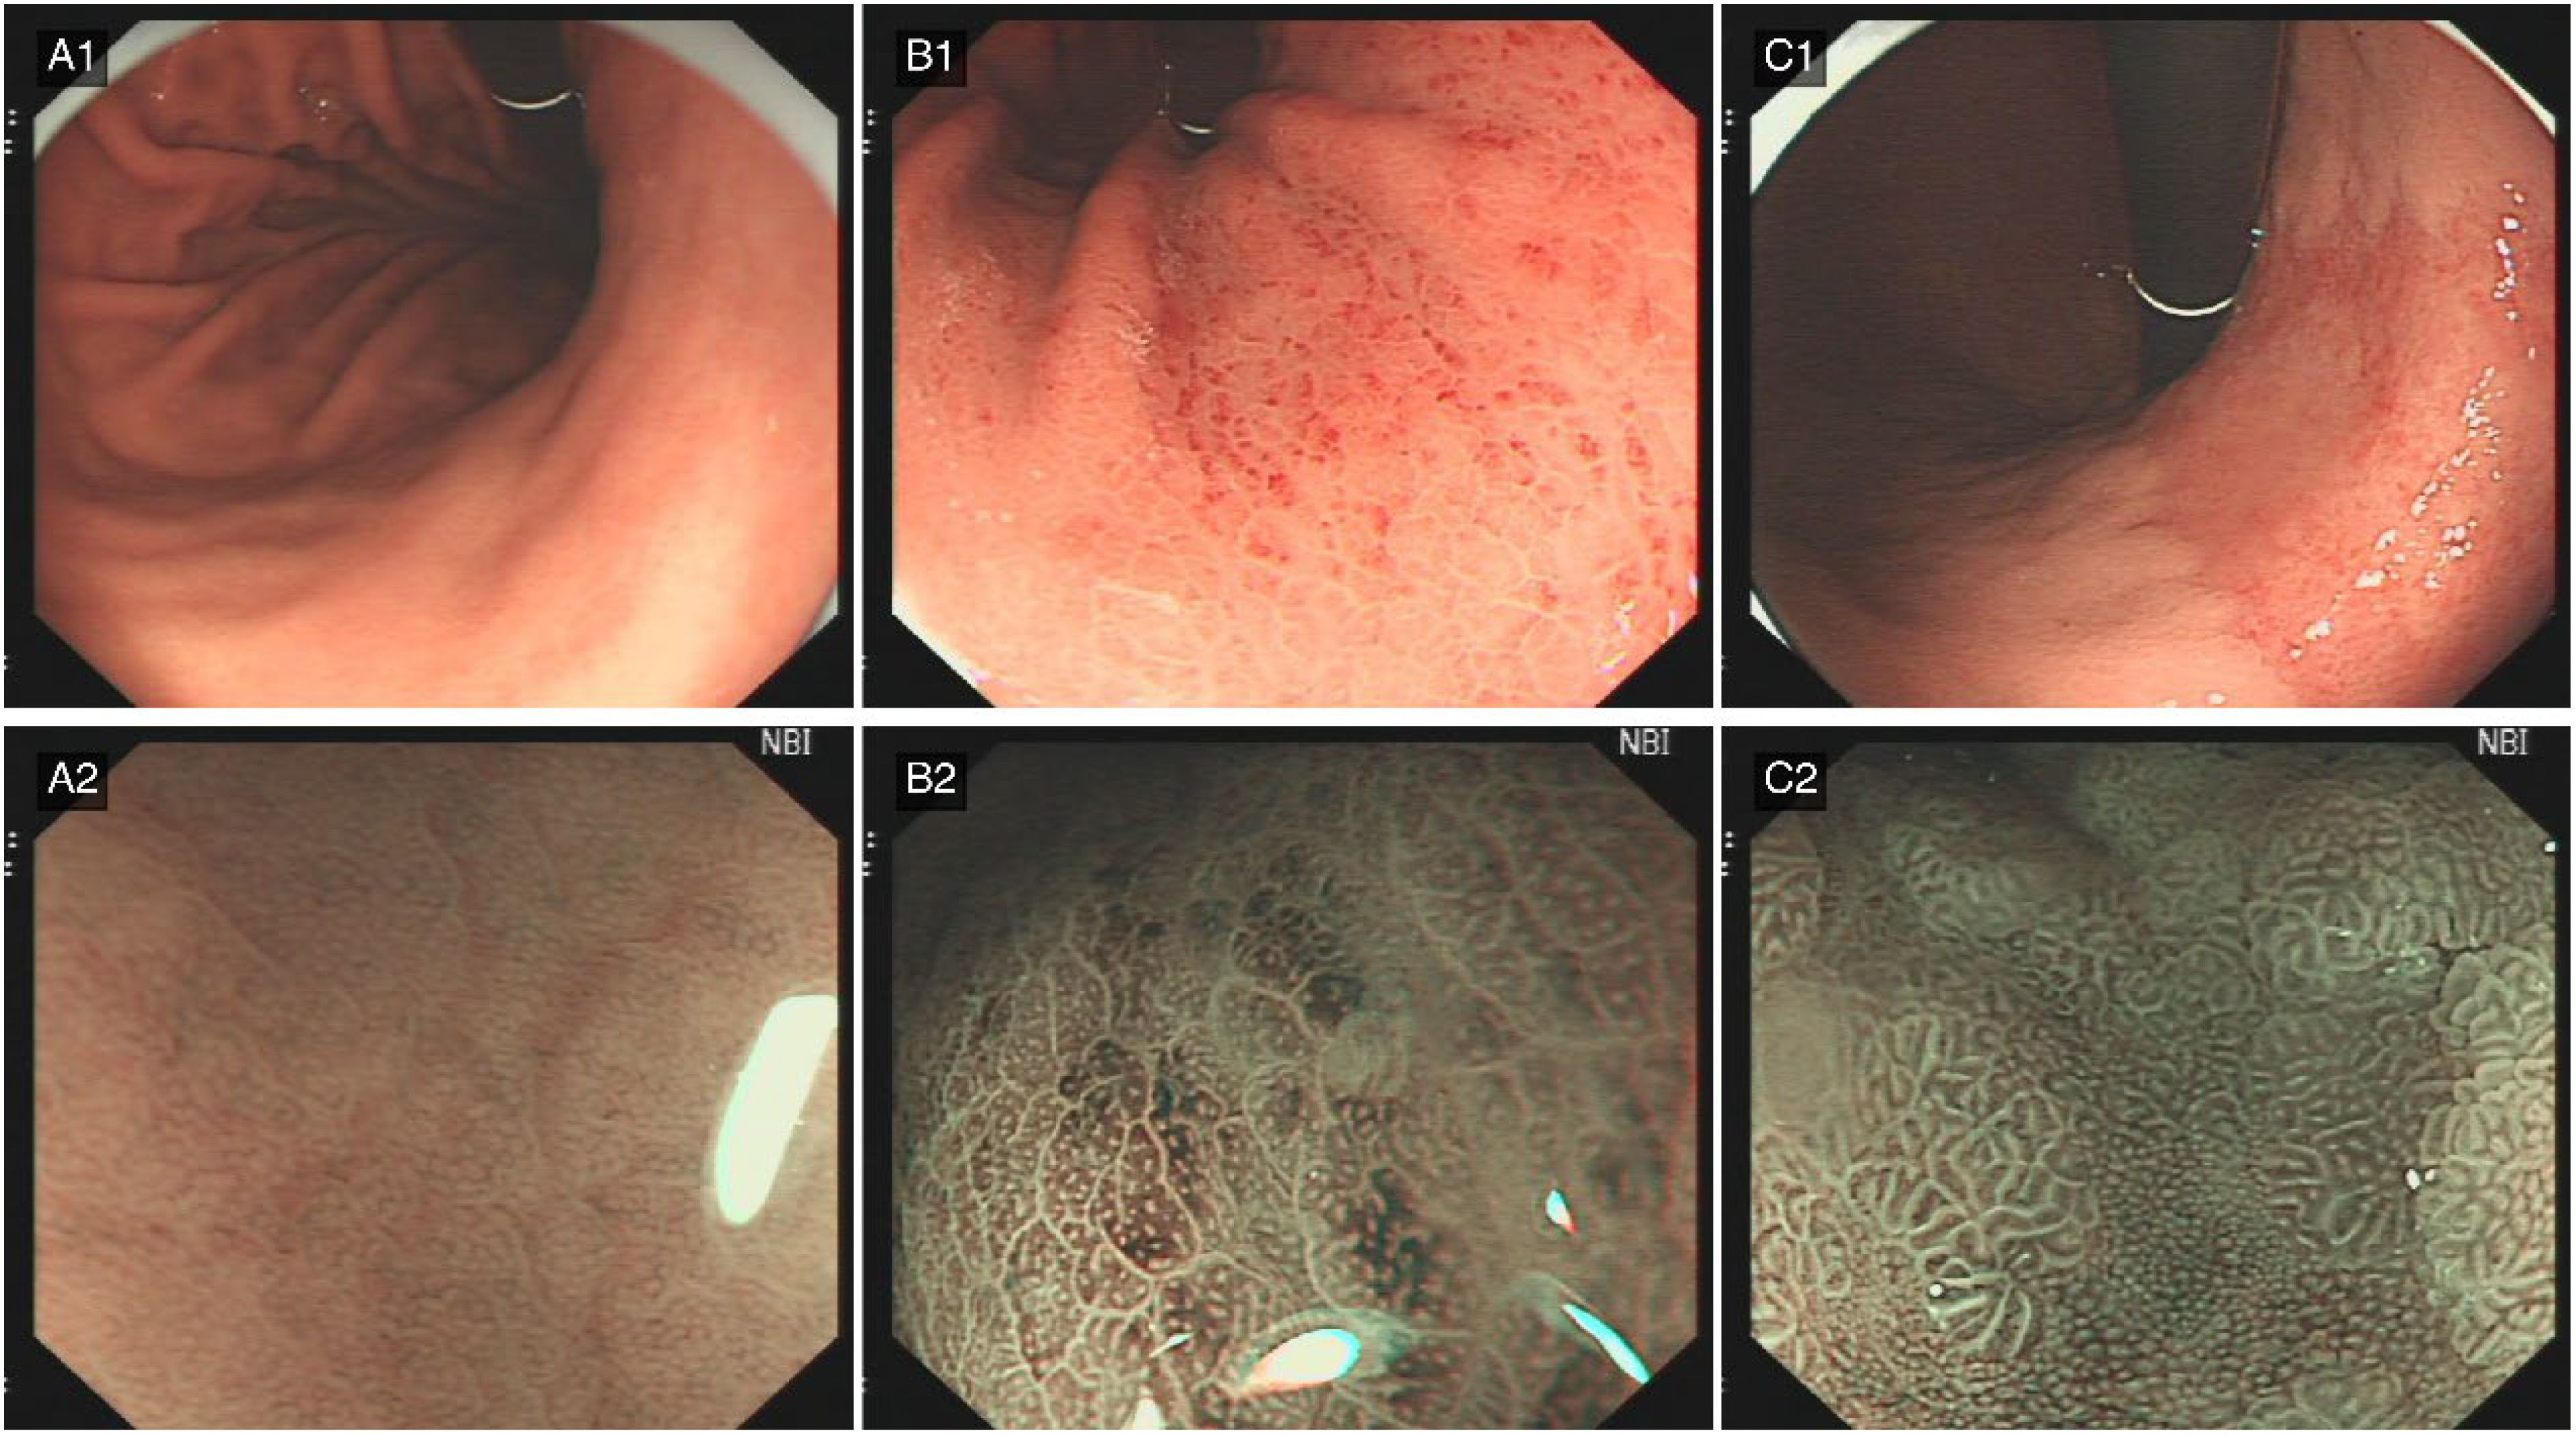
Figure 1. Characteristic features of H. pylori infection status. (A) Absence of Helicobacter pylori infection. (A1) (C-WLE): The gastric body mucosa exhibits a distinct regular arrangement of collecting venules (RAC), characteristically indicative of H. pylori-negative status. (A2) (ME-NBI): The gastric fundus glands display regular architectural arrangement with readily discernible glandular apertures. (B) Active Helicobacter pylori infection. (B1) (C-WLE): Diffuse mucosal redness manifests as extensive erythematous alterations throughout the gastric mucosa, suggesting active inflammatory processes. (B2) (ME-NBI): The inflammatory response is characterised by obscured glandular apertures accompanied by epithelial oedema at the glandular margins. (C) Post-Helicobacter pylori infection status. (C1) (C-WLE): Map-like redness presents as irregular erythematous regions within the gastric mucosa, displaying geographical patterning characteristic of post-eradication status. (C2) (ME-NBI): The mucosa demonstrates absence of normal glandular architecture concurrent with extensive intestinal metaplasia, corresponding to the observed map-like redness pattern.
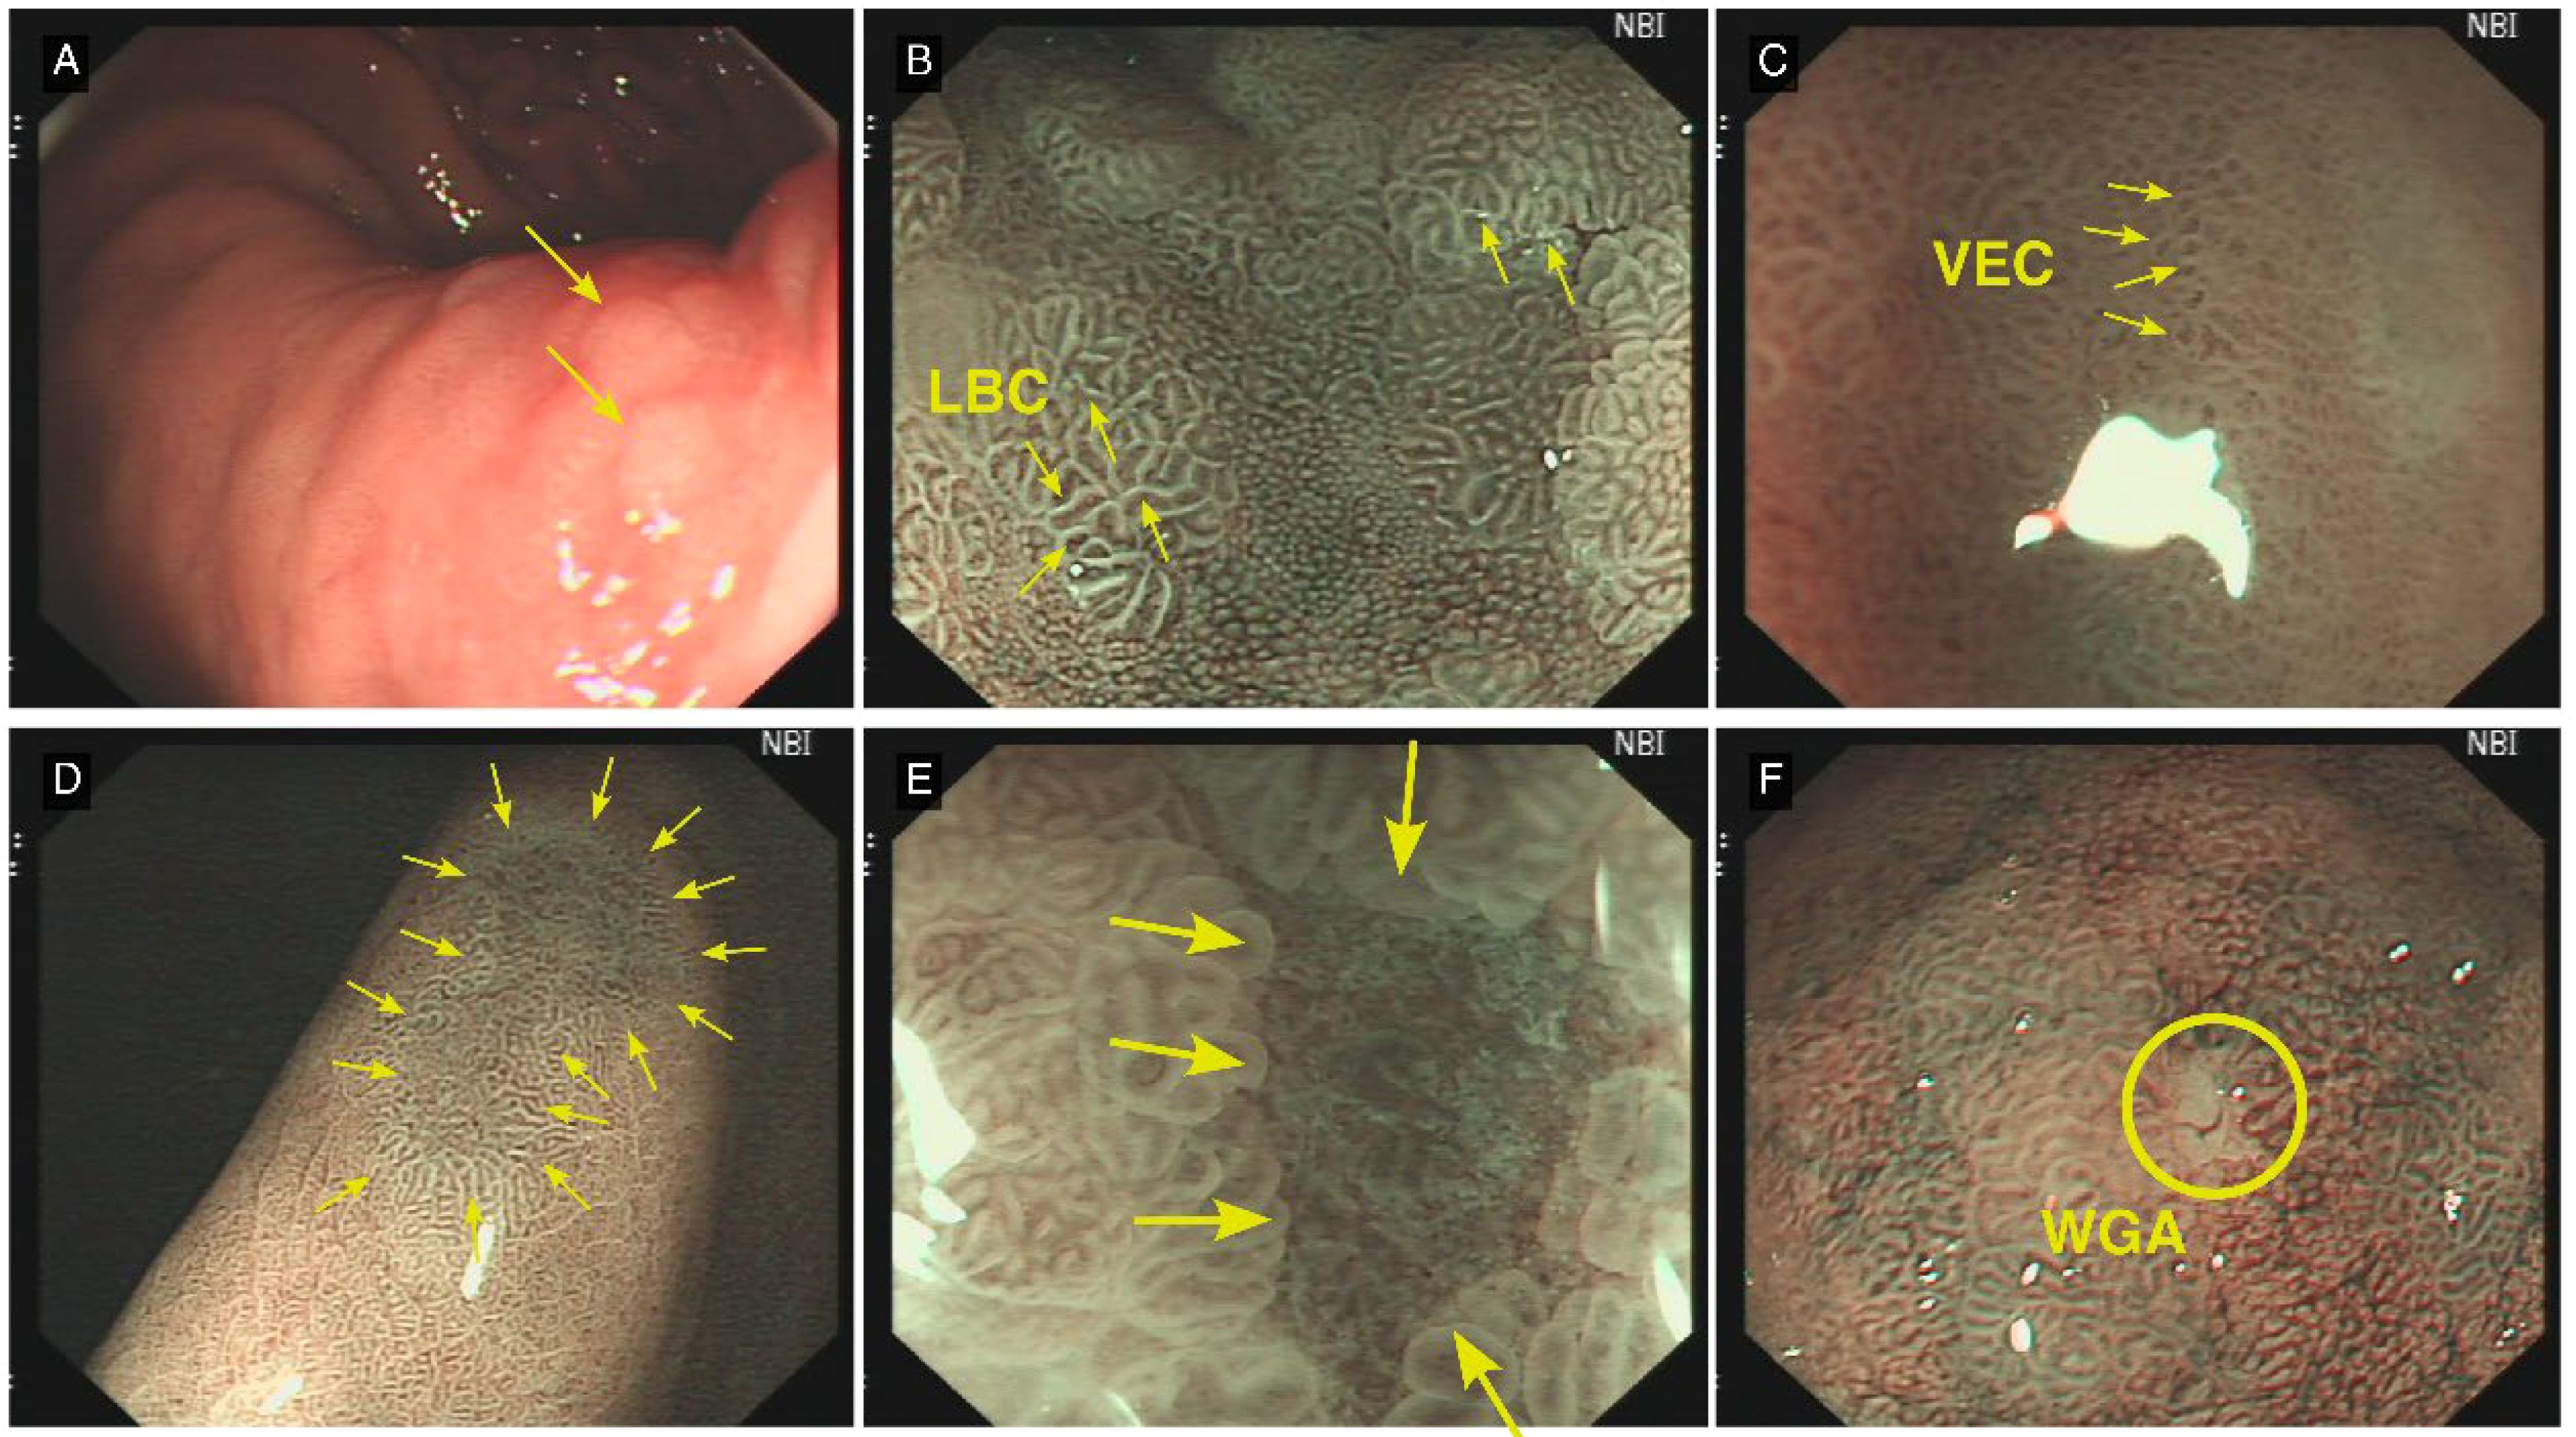
Figure 2. Typical Lesion Features Under C-WLE and ME-NBI. (A) (C-WLE): Intestinal metaplasia presents as a flat or marginally elevated white plaque (yellow arrow). (B) (ME-NBI): Light blue crest (LBC), a pathognomonic feature of intestinal metaplasia, manifests as delicate, light-blue linear structures or networks within the intervillous regions (yellow arrow). (C) (ME-NBI): The vessels within epithelial circle (VEC) pattern is observed, suggestive of potential dysplastic changes or early-stage carcinoma (yellow arrow). (D) A distinct demarcation line (DL) delineates the interface between the lesional and adjacent normal mucosal tissue (yellow arrow). (E) (ME-NBI): Multiple convex demarcation line (MCDL) demonstrates elevated demarcation boundaries at the epithelial margin of the surrounding mucosa. The morphological characteristics of these boundaries serve as crucial parameters in assessing lesional malignancy potential (yellow arrow). (F) (ME-NBI): White globe appearance (WGA) manifests as diminutive spherical white structures situated beneath the gastric epithelium. Histopathologically, these correspond to distended glandular lumina containing fragmentary necrotic epithelial debris (yellow circle).
To establish the reliability of endoscopic feature interpretation and histopathological staging, we conducted a comprehensive inter-observer agreement analysis. Two experienced endoscopists independently evaluated all images whilst blinded to clinical and pathological data. Concurrently, two senior pathologists independently performed OLGA/OLGIM staging. Any discrepancies were resolved through consensus discussion. Cohen’s kappa (κ) coefficients were calculated for all endoscopic features and staging classifications. The resultant analyses, detailed in the Results section, demonstrated exceptional agreement, thereby substantiating the robustness of both image interpretation and staging methodologies.
(1) Feature Selection: Chi-square tests or Fisher’s exact tests were used to analyse correlations between endoscopic features and predictive variables (OLGA and OLGIM staging). Features with statistical significance (P < 0.05) were included in the candidate variable set for model construction.
(2) Collinearity Diagnosis: Following feature selection, variance inflation factor (VIF) analysis was performed to reduce the impact of highly collinear variables. A VIF threshold of 10 was used to identify potentially problematic collinearity, as this is a widely accepted criterion in many fields, including medical research (24, 25).
Variables with VIF > 10 were considered for removal or combination to ensure independence or low correlation among model variables. Specifically, VIF analysis identified demarcation line (DL), multiple convex demarcation line (MCDL) border size, and MCDL border regularity as having VIF values exceeding 10. However, given the clinical dependency of MCDL assessment on the presence of DL, and to maintain the clinical relevance of these features, all features, including those with high VIF values, were retained for model construction.
(3) Model Construction and Performance Evaluation: Three models were constructed: Bayesian stepwise discrimination, random forest, and XGBoost.
Initially, Bayesian stepwise discrimination analysis was performed using SPSS 30.0, employing stepwise variable introduction to generate discriminant functions. The model was validated through self-validation, leave-one-out cross-validation, and receiver operating characteristic (ROC) curve analysis.
Subsequently, random forest and XGBoost models were constructed using Python 3.12.4. Following data standardisation, Synthetic Minority Over-sampling Technique (SMOTE) was applied to address class imbalance. To assess the models’ generalisation capability, we implemented a systematic data partitioning protocol. The dataset underwent random stratification into a training cohort (comprising 80% of patients) and a testing cohort (comprising the remaining 20%). Stratified random sampling methodology was employed to preserve the proportional distribution of low-risk and high-risk OLGA/OLGIM cases across both cohorts. The training cohort facilitated model development, incorporating hyperparameter optimisation through 5-fold cross-validation protocols. The testing cohort was reserved exclusively for independent evaluation of the finalised models’ performance metrics. For robust validation, a 5-fold cross-validation was incorporated during the grid search process for hyperparameter tuning of both random forest and XGBoost models. Hyperparameter tuning for random forest and XGBoost models was conducted using grid search. For the random forest model, the tuned hyperparameters were ‘max_depth’: None, ‘min_samples_leaf’: 1, ‘min_samples_split’: 10, and ‘n_estimators’: 100. For the XGBoost model, the tuned hyperparameters were ‘colsample_bytree’: 0.8, ‘learning_rate’: 0.3, ‘max_depth’: 5, ‘n_estimators’: 100, and ‘subsample’: 0.8. Unless specified during grid search, default parameter settings in the scikit-learn and XGBoost libraries were used. Data were split into 80% training and 20% test sets. Grid search was employed for hyperparameter tuning of both models. The model validation protocol encompassed multiple metrics, including accuracy, sensitivity, specificity, AUC, F1-score and Precision-Recall curves. To address the inherent class imbalance, particular emphasis was placed on F1-scores and PR curves for evaluating performance in the minority high-risk OLGA/OLGIM classifications
External validation was not performed in this study due to its single-centre nature and the limitations in accessing external datasets. Future studies will focus on validating these models using multi-centre datasets to assess their generalizability. The dataset used in this study is available upon reasonable request from the corresponding author, subject to ethical approval and data protection regulations, as detailed in the ‘Availability of data and material’ section. The code for the developed machine learning models will be made available in a public repository upon publication to ensure reproducibility.
The study included 356 patients with complete C-WLE, ME-NBI, and histopathological biopsy results. No significant differences were observed in sex and age distribution across OLGA/OLGIM stages (P > 0.05), as detailed in Supplementary Table 1.
Supplementary Table 1 presents the demographic characteristics of the study cohort stratified by OLGA and OLGIM risk categories. No statistically significant differences in age or sex distribution were observed between low-risk and high-risk groups for either staging system (P > 0.05). This indicates demographic homogeneity across risk strata, suggesting these factors are unlikely to confound the analysis of endoscopic features.
The inter-observer agreement analysis revealed remarkable consistency between both endoscopists and pathologists. For OLGA-related assessments, Cohen’s kappa (κ) coefficients ranged from 0.849 (MCDL border regularity) to 1.000 (H. pylori infection status), with the majority of values exceeding 0.90. Analogously, OLGIM-related assessments yielded κ values ranging from 0.840 (prepyloric location) to 1.000 (H. pylori infection status), with most coefficients similarly surpassing 0.90. Notably, the κ values for OLGA and OLGIM staging demonstrated particularly high concordance at 0.953 and 0.948, respectively. These consistently elevated κ coefficients across all assessed parameters provide robust evidence for the reliability of both the endoscopic interpretation and histopathological staging protocols.
Among the 356 patients, 52 (14.6%) were classified as high-risk OLGA and 304 (85.4%) as low-risk. Under C-WLE, statistically significant differences between low-risk and high-risk OLGA patients were observed in H. pylori infection category, mucosal status, number of lesions, gross morphology, presence of intestinal metaplasia patches, and lesion size (all P < 0.001). Under ME-NBI, significant differences were found in the presence of DL (P < 0.001), presence of LBC (P = 0.003) and WOS (P = 0.002), MCDL border regularity (P < 0.001), and border size (P < 0.001) between OLGA stages (Supplementary Tables 2, 3).
Supplementary Table 2 compares C-WLE lesion characteristics between OLGA stages. Significant differences (P < 0.001) were found in H. pylori infection history, mucosal status, lesion number and size, morphology, IM patches. High-risk OLGA was associated with past H. pylori, map-like redness, multiple lesions, depressed morphology, IM patches, and larger size, highlighting macroscopically visible features indicative of advanced stages.
Supplementary Table 3 details ME-NBI features and OLGA stage. Significant differences (P < 0.001) were observed for DL, MCDL border regularity and size, and LBC and WOS presence (P ≤ 0.003). High-risk OLGA showed increased DL, LBC, WOS, irregular MCDL border, and larger MCDL size, demonstrating ME-NBI’s ability to detect microstructural features associated with advanced OLGA.
Of the 356 patients, 116 (32.6%) were classified as high-risk OLGIM and 240 (67.4%) as low-risk. Under C-WLE, statistically significant differences were found in H. pylori infection category, mucosal status, number of lesions, gross morphology, lesion border clarity, presence of intestinal metaplasia patches, and lesion size (all P < 0.001), lesion colour (P = 0.012), presence of erosion (P = 0.002), and surface nodularity (P = 0.032). Under ME-NBI, significant differences were observed in the presence of DL, LBC, WOS, and WGA, MCDL border regularity and size (all P < 0.001), and presence of VEC pattern (P = 0.006) between OLGIM stages (Supplementary Tables 4, 5).
Supplementary Table 4 presents C-WLE lesion characteristics by OLGIM stage. Significant differences (P < 0.05) were found for H. pylori history, mucosal status, lesion number and size, morphology, border clarity, IM patches, colour, erosion, and surface nodularity. High-risk OLGIM correlated with similar C-WLE features as high-risk OLGA, reinforcing the macroscopic endoscopic markers for advanced precancerous lesions.
Supplementary Table 5 details ME-NBI features and OLGIM stage. Significant differences (P < 0.001) were observed for DL, LBC, WOS, WGA, MCDL border regularity and size, and VEC pattern (P = 0.006). High-risk OLGIM exhibited increased DL, LBC, WOS, WGA, irregular MCDL border, larger MCDL size, and VEC pattern, further emphasizing ME-NBI’s role in identifying microvascular and mucosal changes in advanced OLGIM stages.
Based on chi-square and Fisher’s exact tests results, features significantly associated with OLGA/OLGIM staging from sections 2.2 and 2.3 were assigned values (Table 1). Collinearity analysis was performed on these features (Tables 2, 3), with final variable selection requiring VIF < 10. DL, MCDL border size, and border regularity showed VIF > 10, confirmed by feature correlation matrix analysis (Figures 3, 4). However, given that MCDL assessment clinically depends on DL presence, indicating a structural dependency, these features were retained for subsequent model construction.
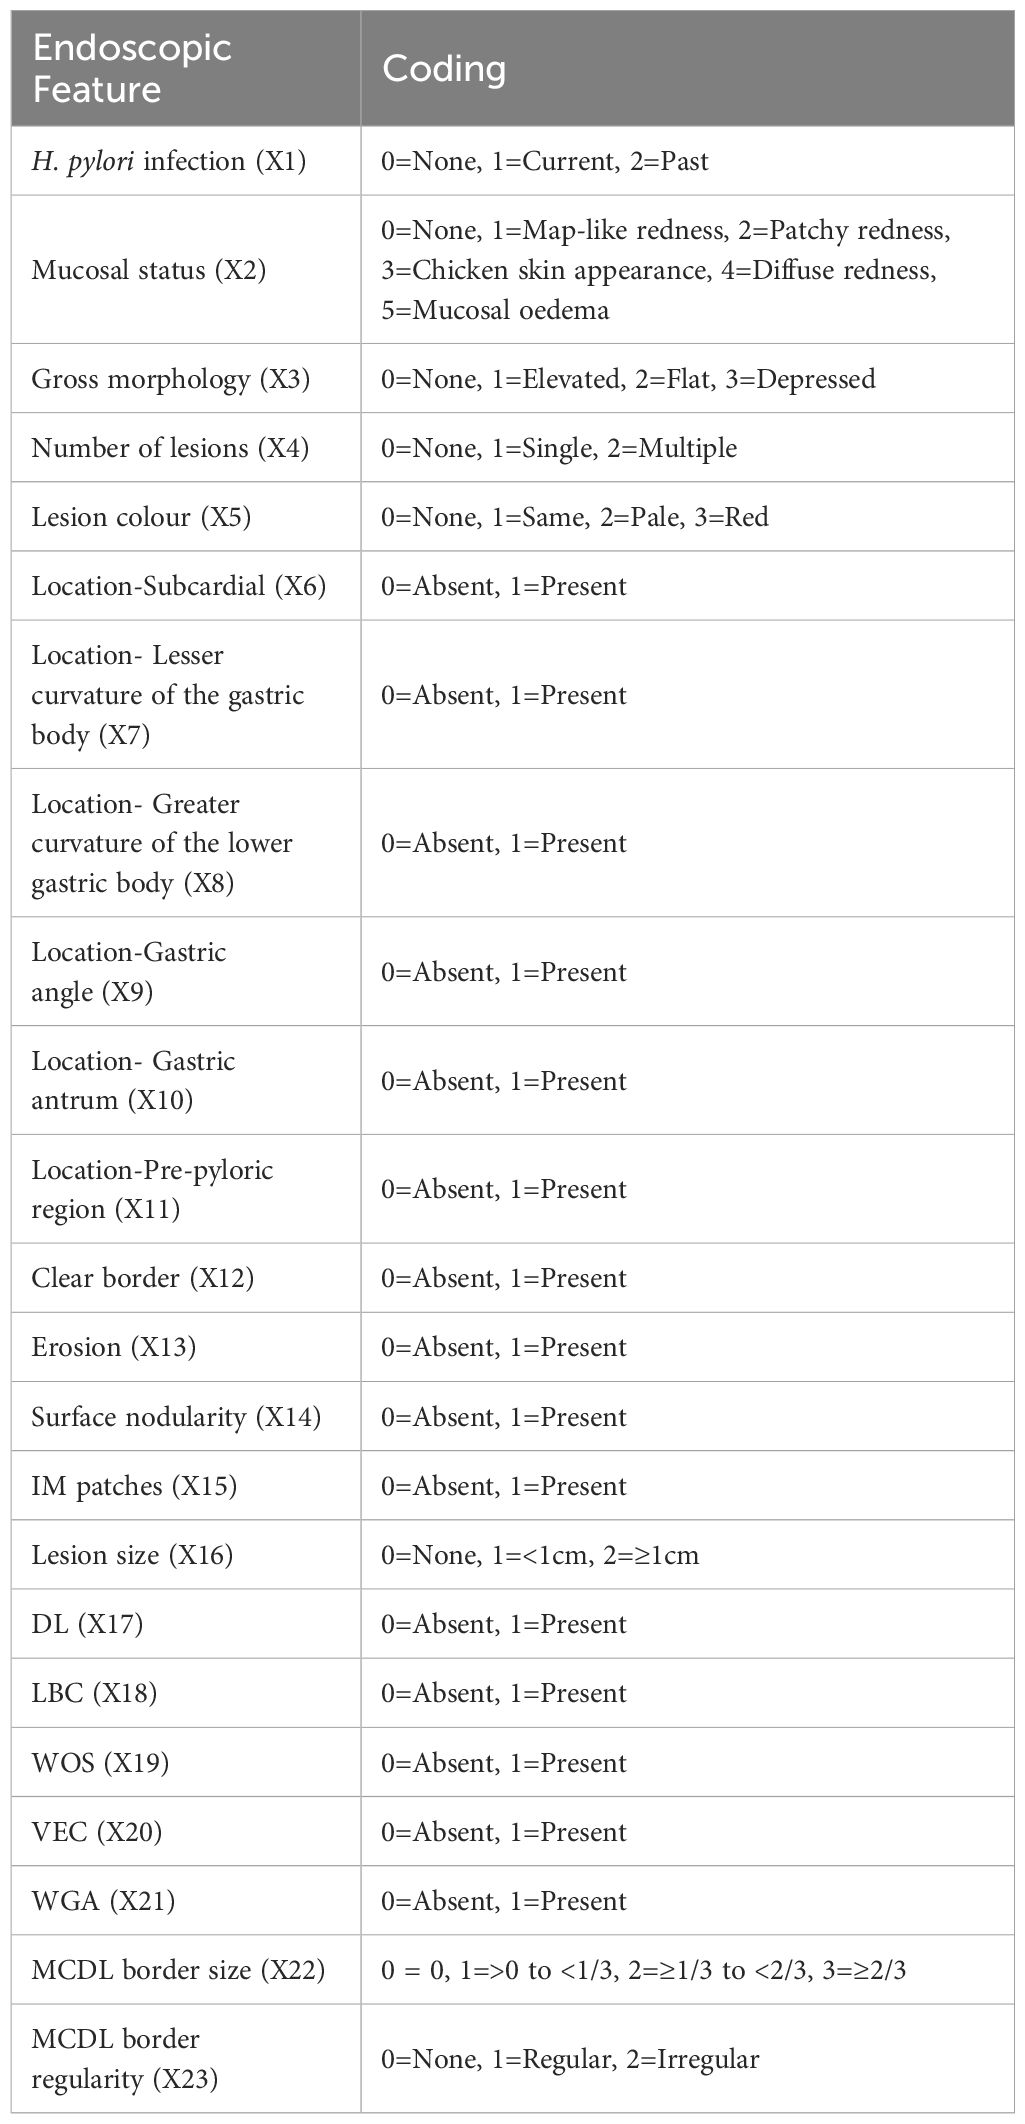
Table 1. Endoscopic feature variable coding.
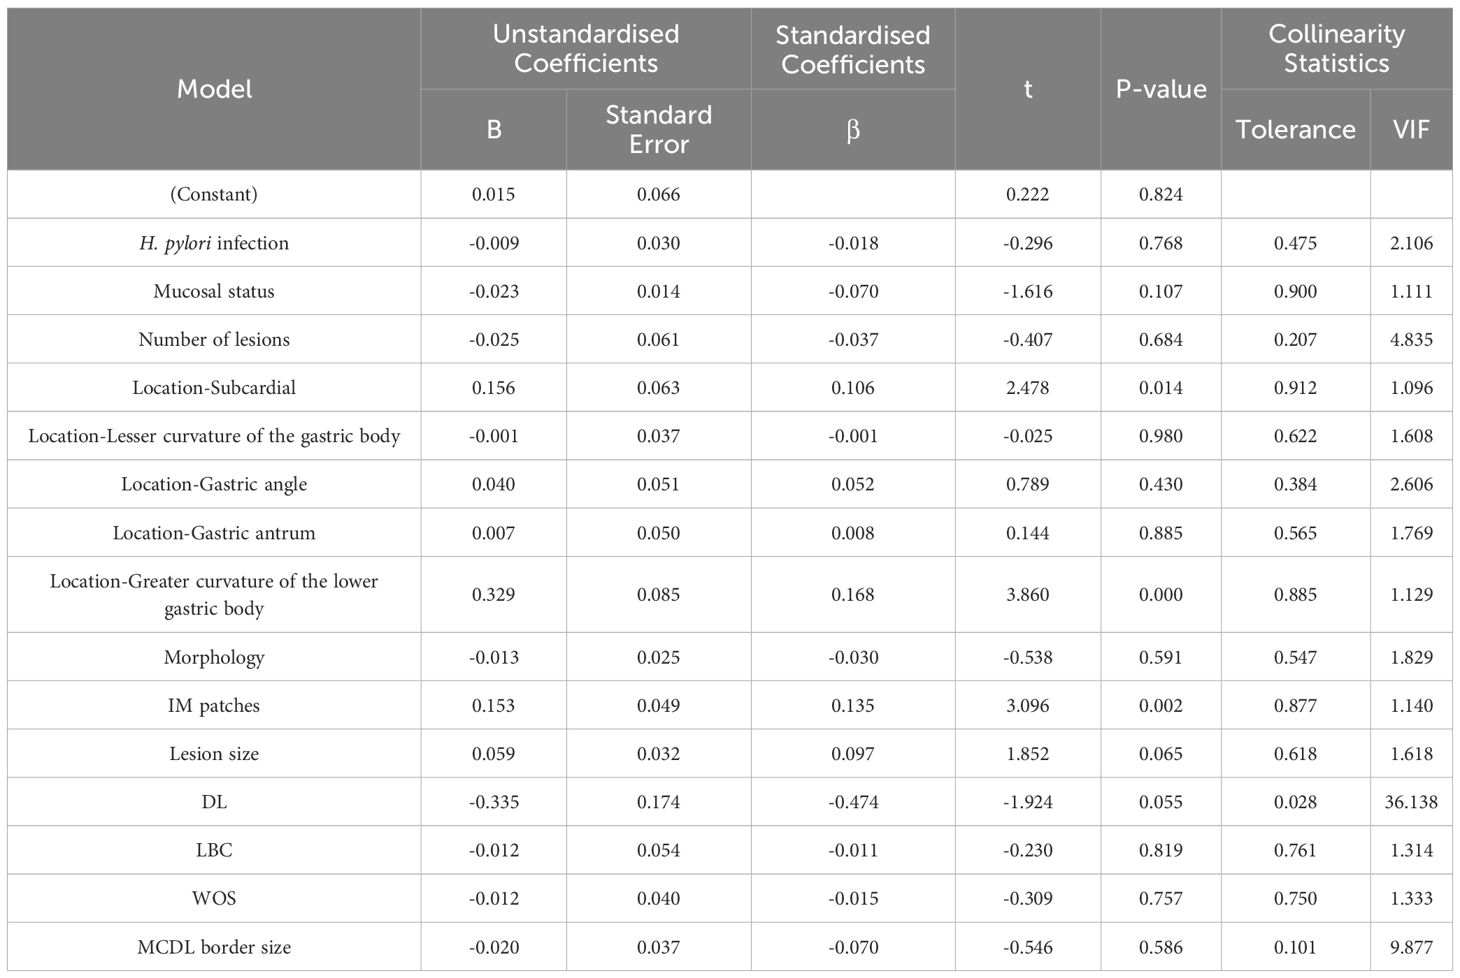
Table 2. Collinearity analysis of endoscopic features based on OLGA staging.

Table 3. Collinearity analysis of endoscopic features based on OLGIM staging.
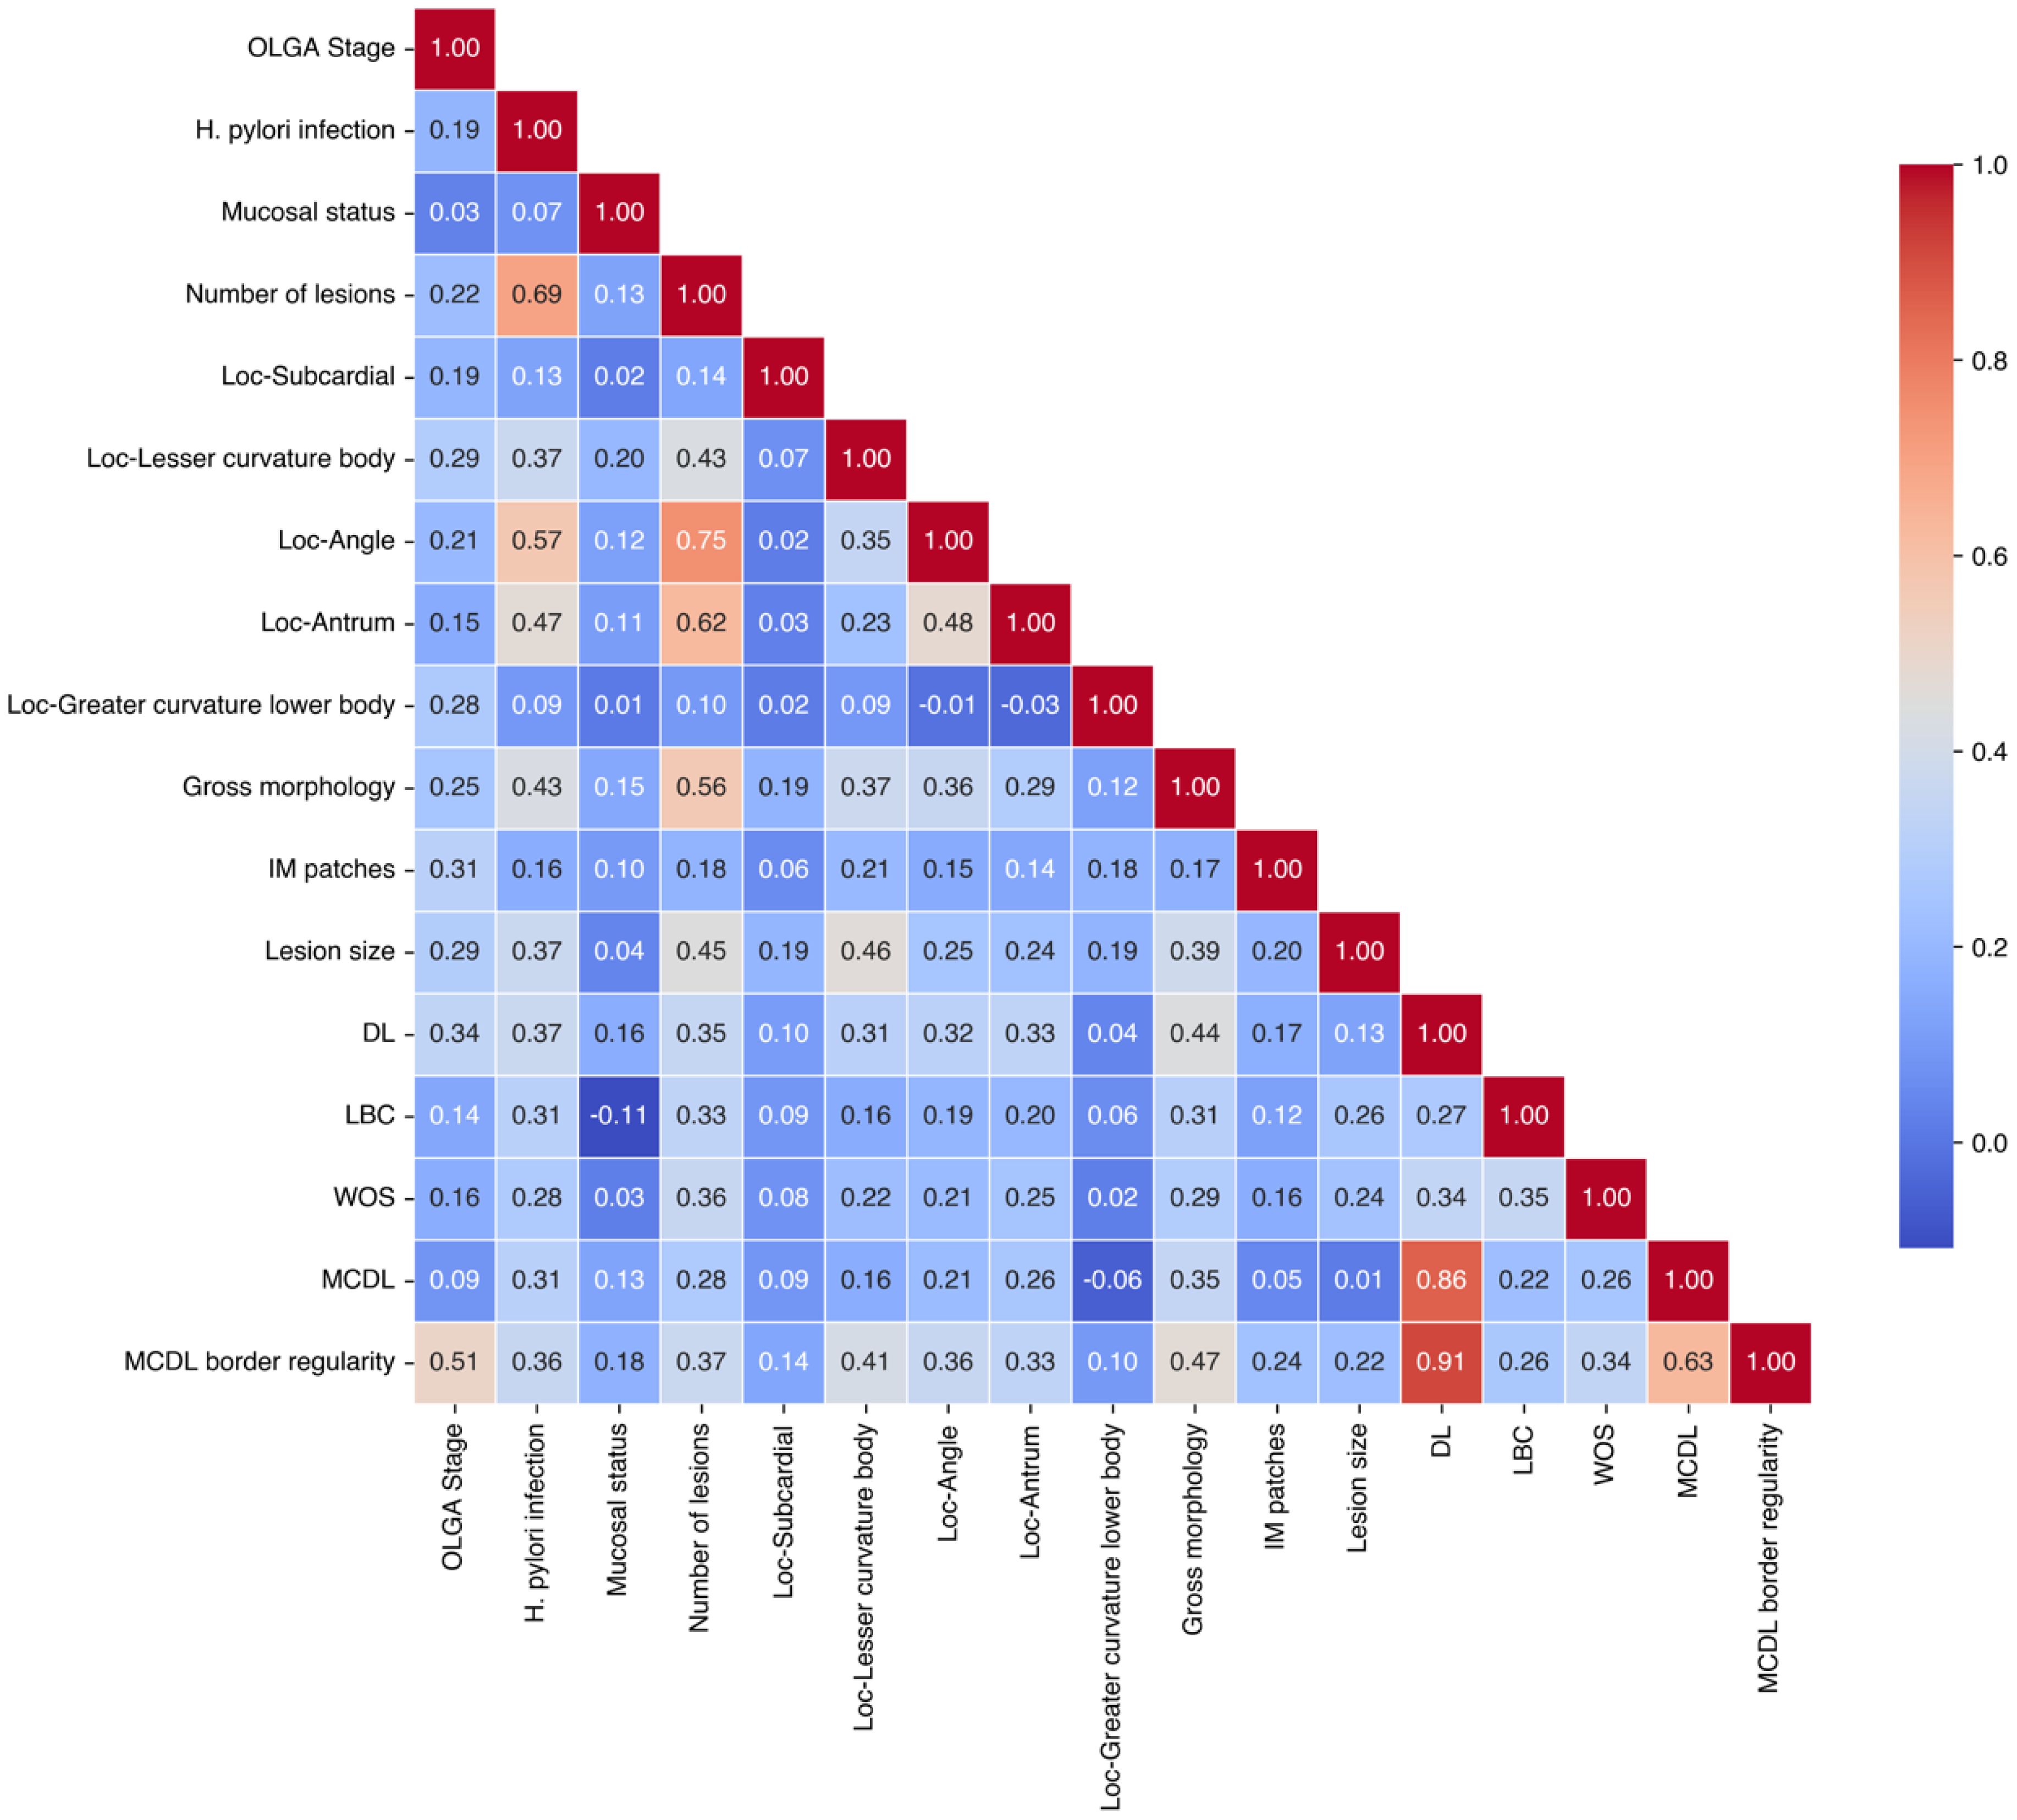
Figure 3. Correlation matrix analysis of endoscopic features based on OLGA staging.
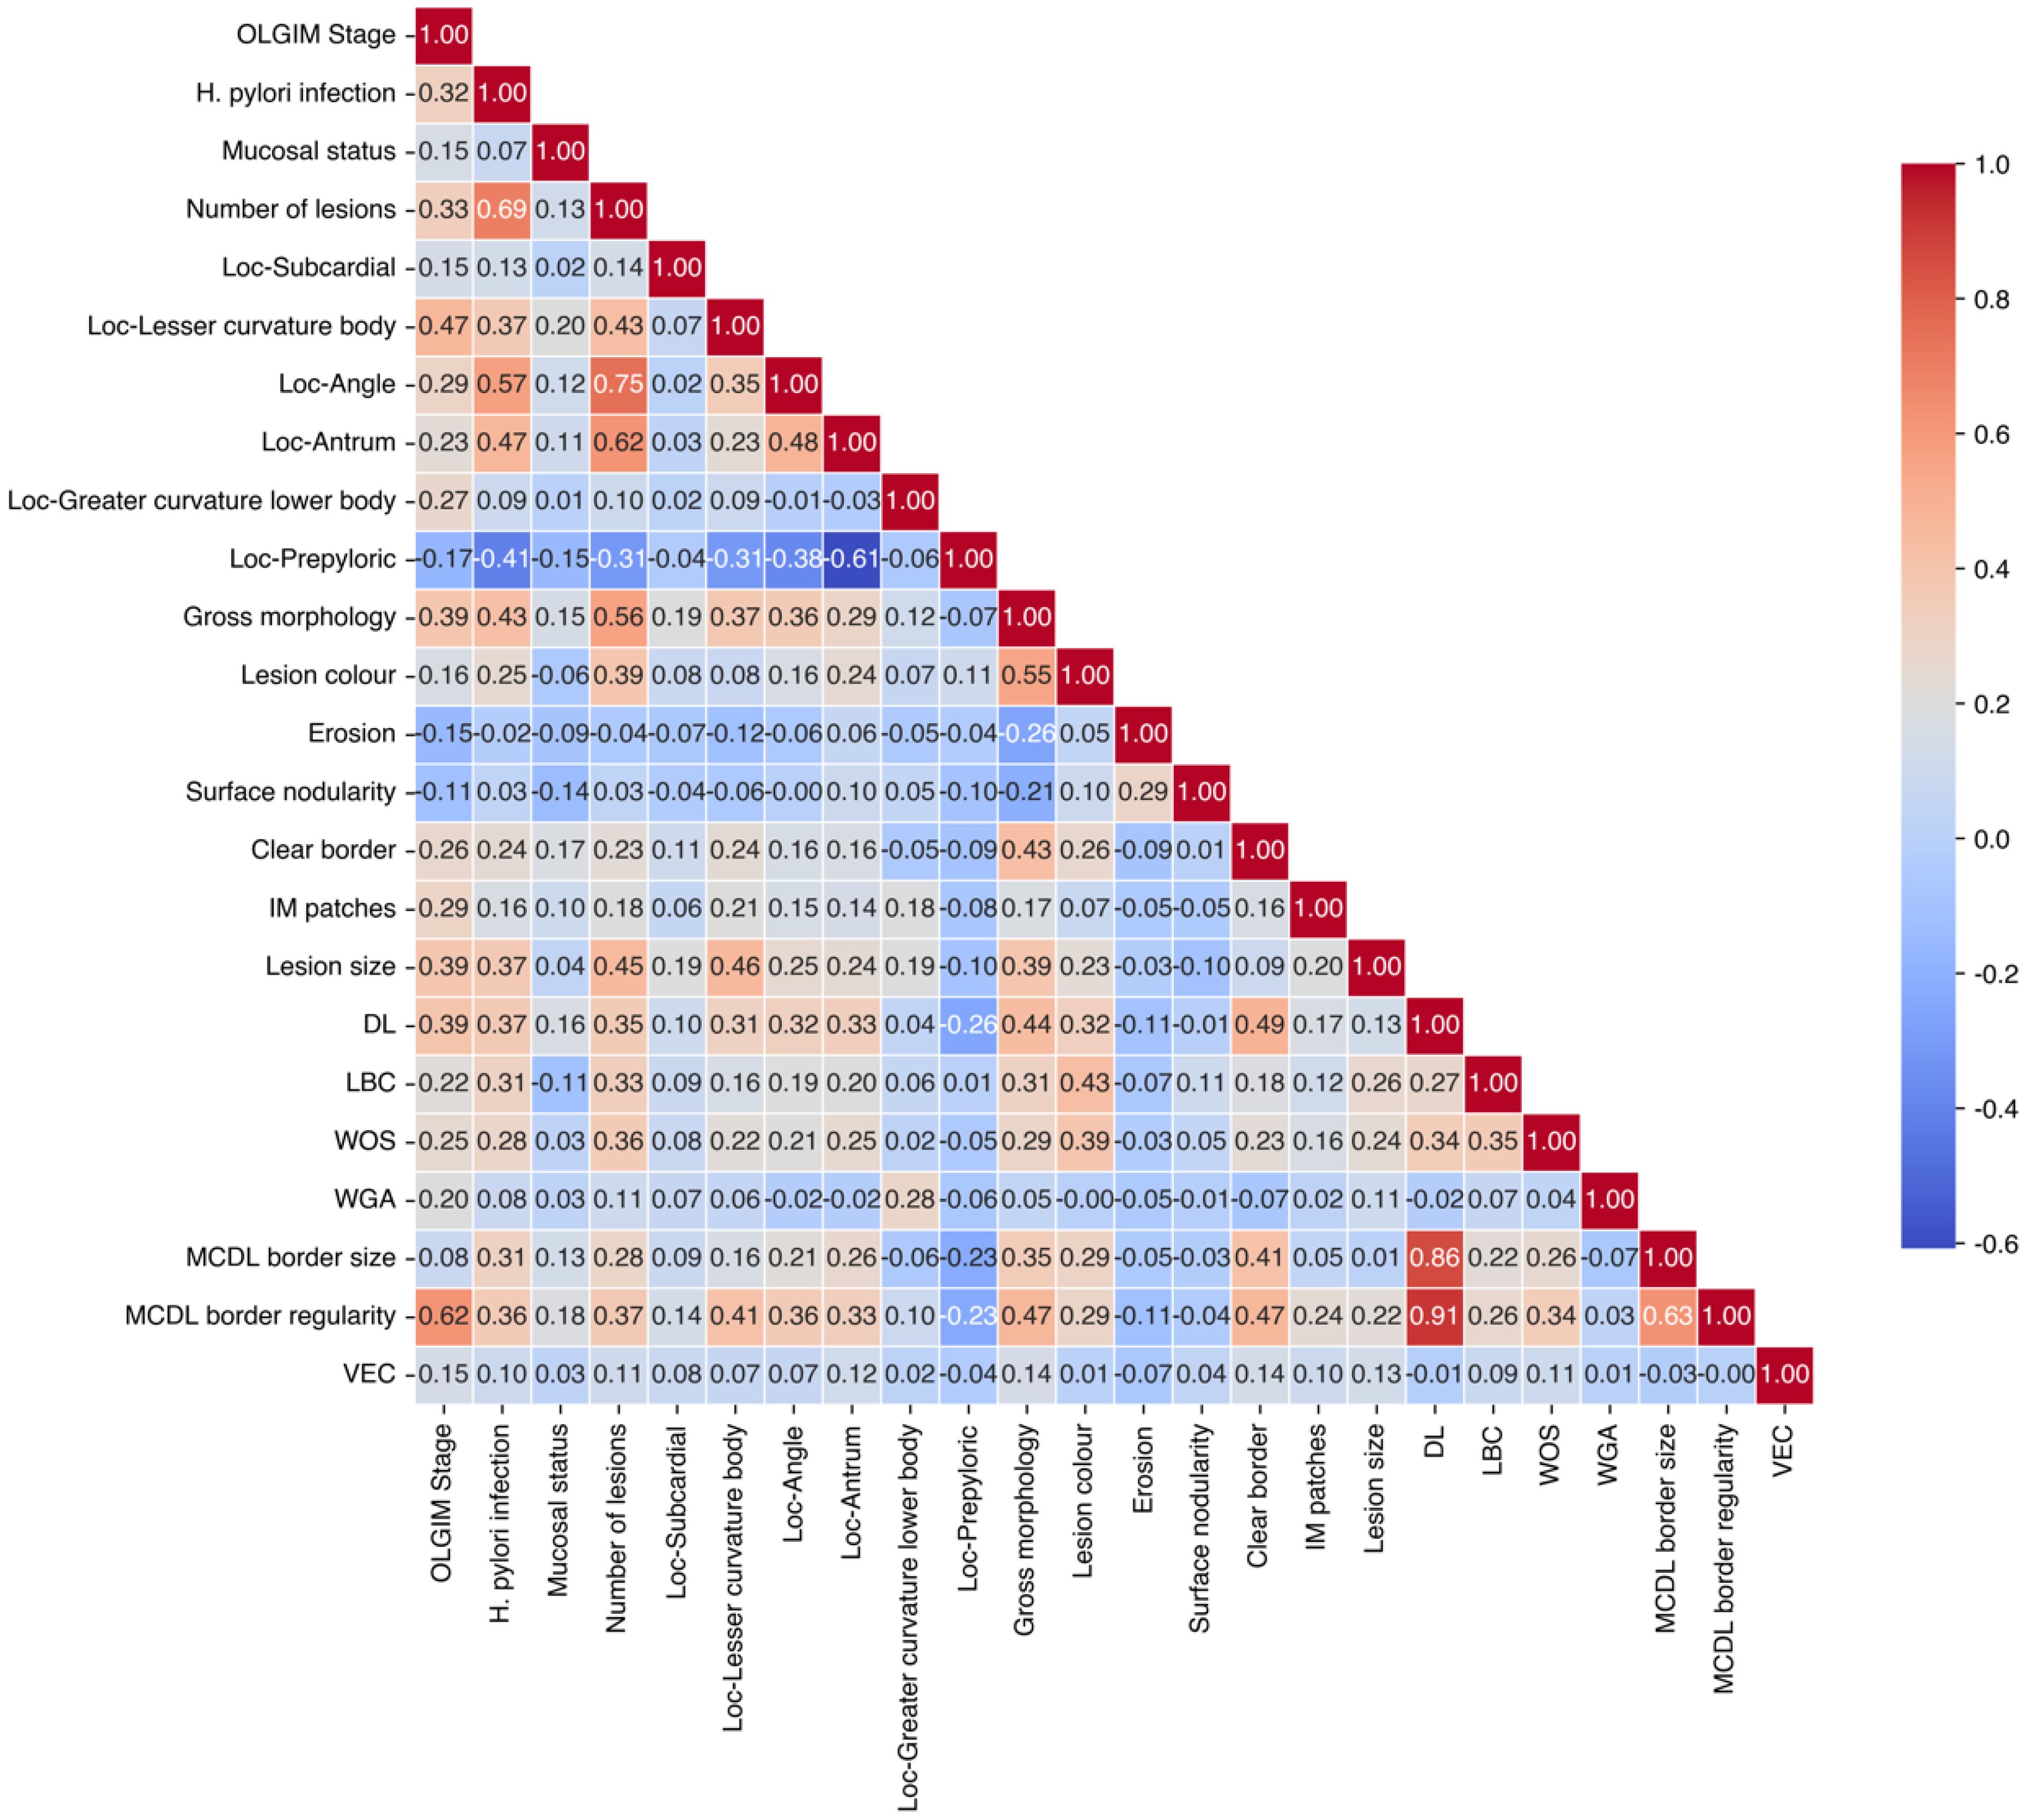
Figure 4. Correlation matrix analysis of endoscopic features based on OLGIM staging.
Table 1 outlines the coding scheme for endoscopic features used in subsequent statistical analyses and model construction. This standardisation ensures consistent variable representation for quantitative analysis and facilitates model interpretability.
Table 2 presents the collinearity analysis for endoscopic features related to OLGA staging. High VIF values (>10) for DL indicate multicollinearity, while the VIF values for MCDL border size are close to 10 (9.877), suggesting a potential concern for multicollinearity. Despite this, these features were retained due to the clinical dependency of MCDL assessment on DL presence, reflecting their structural relationship in endoscopic evaluation.
Table 3 shows the collinearity analysis for endoscopic features related to OLGIM staging. Similar to OLGA, high VIF values (>10) were observed for DL, MCDL border size, and border regularity, indicating multicollinearity. These features were retained due to their clinical relevance and structural dependency in endoscopic assessment, despite statistical collinearity.
To develop high-performance predictive models for precancerous gastric lesion risk, we employed rigorous feature selection criteria encompassing four key dimensions: statistical significance (P < 0.05 between low-risk and high-risk cohorts), clinical relevance (demonstrated association with OLGA/OLGIM staging pathophysiology or established diagnostic utility from previous investigations), endoscopic feasibility (reliable assessment during routine C-WLE and ME-NBI examinations), and multicollinearity considerations (generally VIF < 10).
The selected features represent complementary diagnostic modalities: C-WLE features, including mucosal status, lesion size/morphology, and IM patches, characterise macroscopic mucosal alterations, whilst ME-NBI features, comprising demarcation line, light blue crest, white opaque substance, MCDL border regularity, and VEC, elucidate microstructural details. This dual-modality approach yields a comprehensive representation of pathological alterations, thereby enhancing the model’s predictive capability for high-risk OLGA/OLGIM stages.
Features excluded from the final models met one or more elimination criteria: insufficient statistical significance (P ≥ 0.05), excessive multicollinearity (generally VIF > 10; notably, DL, MCDL border size, and regularity were retained owing to the clinical dependency of MCDL assessment on DL presence), inadequate clinical significance or assessment feasibility.
Based on features selected in section 3.4, comprehensive diagnostic models for OLGA/OLGIM staging of precancerous gastric lesions were established. Variables X1, X2, X3, X4, X6, X7, X8, X9, X10, X15, X16, X17, X18, X19, X22, and X23 were used for the OLGA staging diagnostic model, whilst X1 through X23 were used for the OLGIM staging model.
Using stepwise forward selection in Bayesian stepwise discrimination analysis, classification function coefficients for OLGA and OLGIM staging models were obtained (Tables 4, 5), yielding the following prediction model equations:
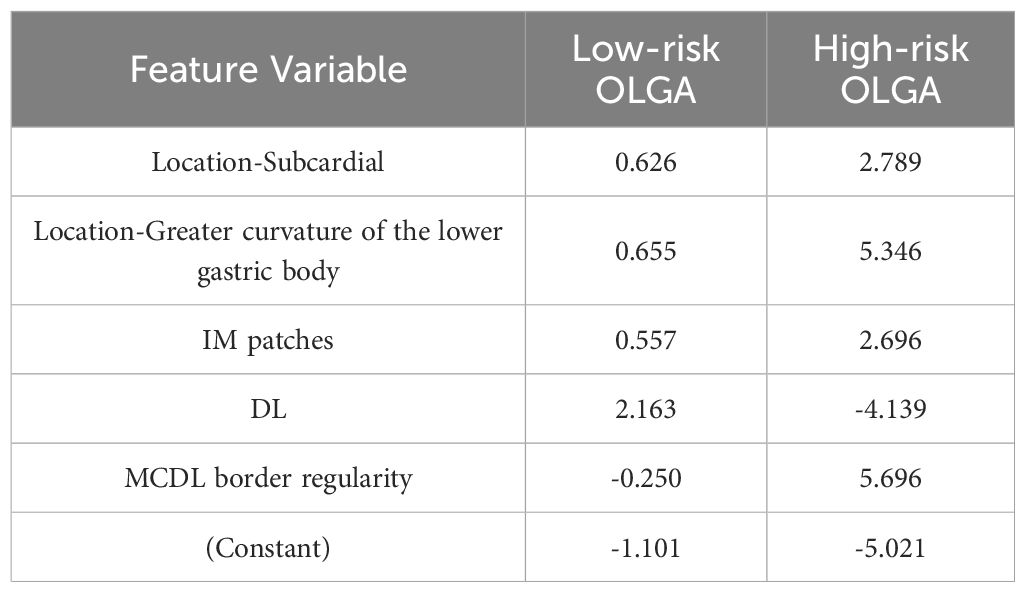
Table 4. Classification function coefficients for stepwise discriminant model of OLGA staging.
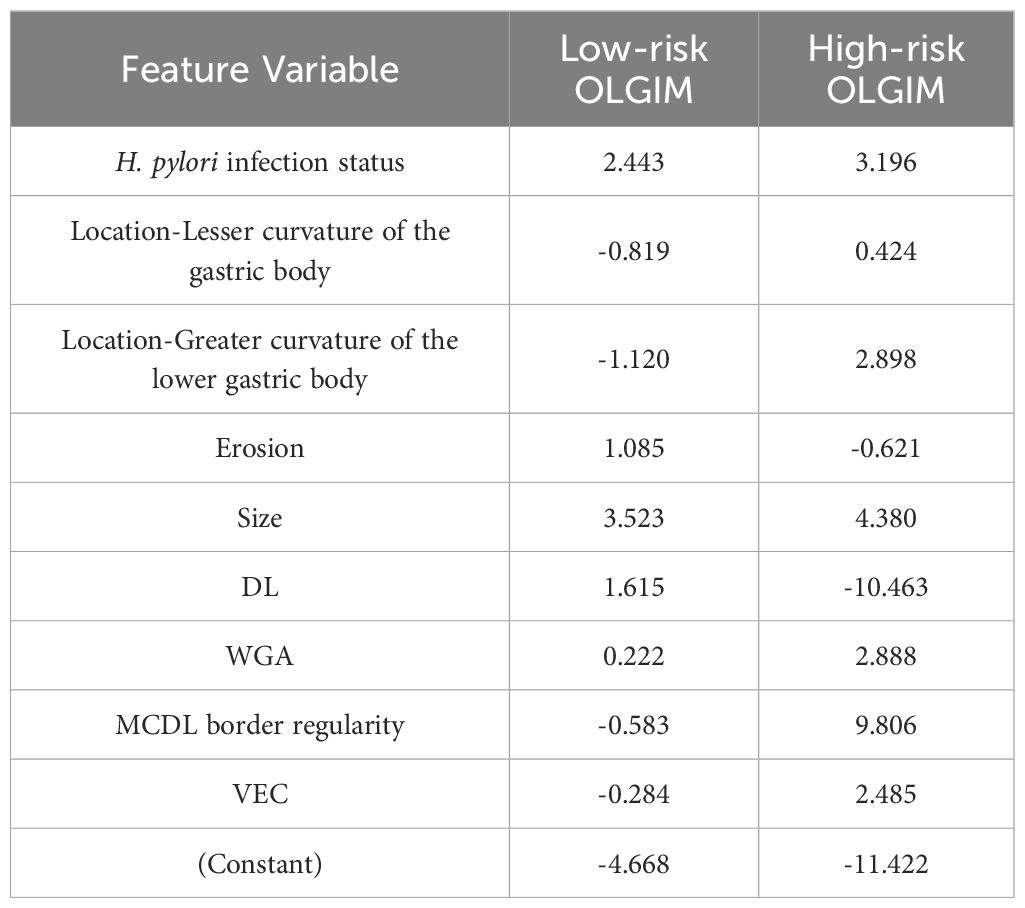
Table 5. Classification function coefficients for stepwise discriminant model of OLGIM staging.
Table 4 displays the classification function coefficients derived from the Bayesian stepwise discriminant model for OLGA staging. These coefficients quantify the contribution of each selected endoscopic feature (location-subcardial, location-greater curvature of lower body, IM patches, DL, MCDL border regularity) to the prediction of low-risk and high-risk OLGA stages within the Bayesian model.
Table 5 presents the classification function coefficients from the Bayesian stepwise discriminant model for OLGIM staging. These coefficients indicate the weight of each selected endoscopic feature (H. pylori status, location-lesser curvature and greater curvature of lower body, erosion, size, DL, WGA, MCDL border regularity, VEC) in predicting low-risk and high-risk OLGIM stages within the Bayesian model.
For self-validation, the overall accuracy rates were 85.4% for the OLGA staging prediction model and 91.0% for the OLGIM staging prediction model. In cross-validation, the overall accuracy rates were 85.1% for OLGA and 91.0% for OLGIM. Both models demonstrated high accuracy (Table 6).
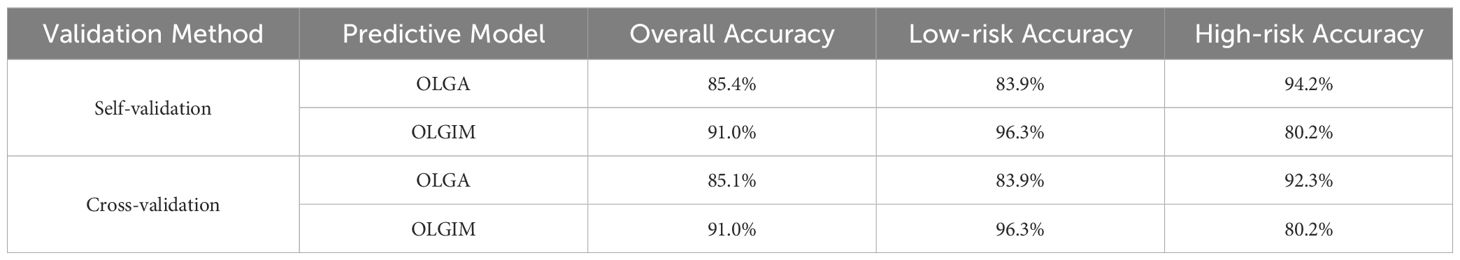
Table 6. Bayesian stepwise discriminant results for OLGA/OLGIM staging diagnostic models (Self-validation and Cross-validation).
Table 6 summarises the validation results of the Bayesian stepwise discriminant models for OLGA and OLGIM staging. Both self-validation and cross-validation demonstrated high overall accuracy (OLGA: ~85%, OLGIM: ~91%), indicating robust performance of the Bayesian models in classifying precancerous gastric lesions.
ROC curves were constructed to evaluate the performance of both prediction models (Figure 5), with detailed parameters shown in Table 7. The OLGA model achieved an AUC value of 0.928 (95% CI: 0.901-0.955), with sensitivity of 0.942 and specificity of 0.842. The OLGIM model achieved an AUC value of 0.924 (95% CI: 0.896-0.951), with sensitivity of 0.942 and specificity of 0.839.
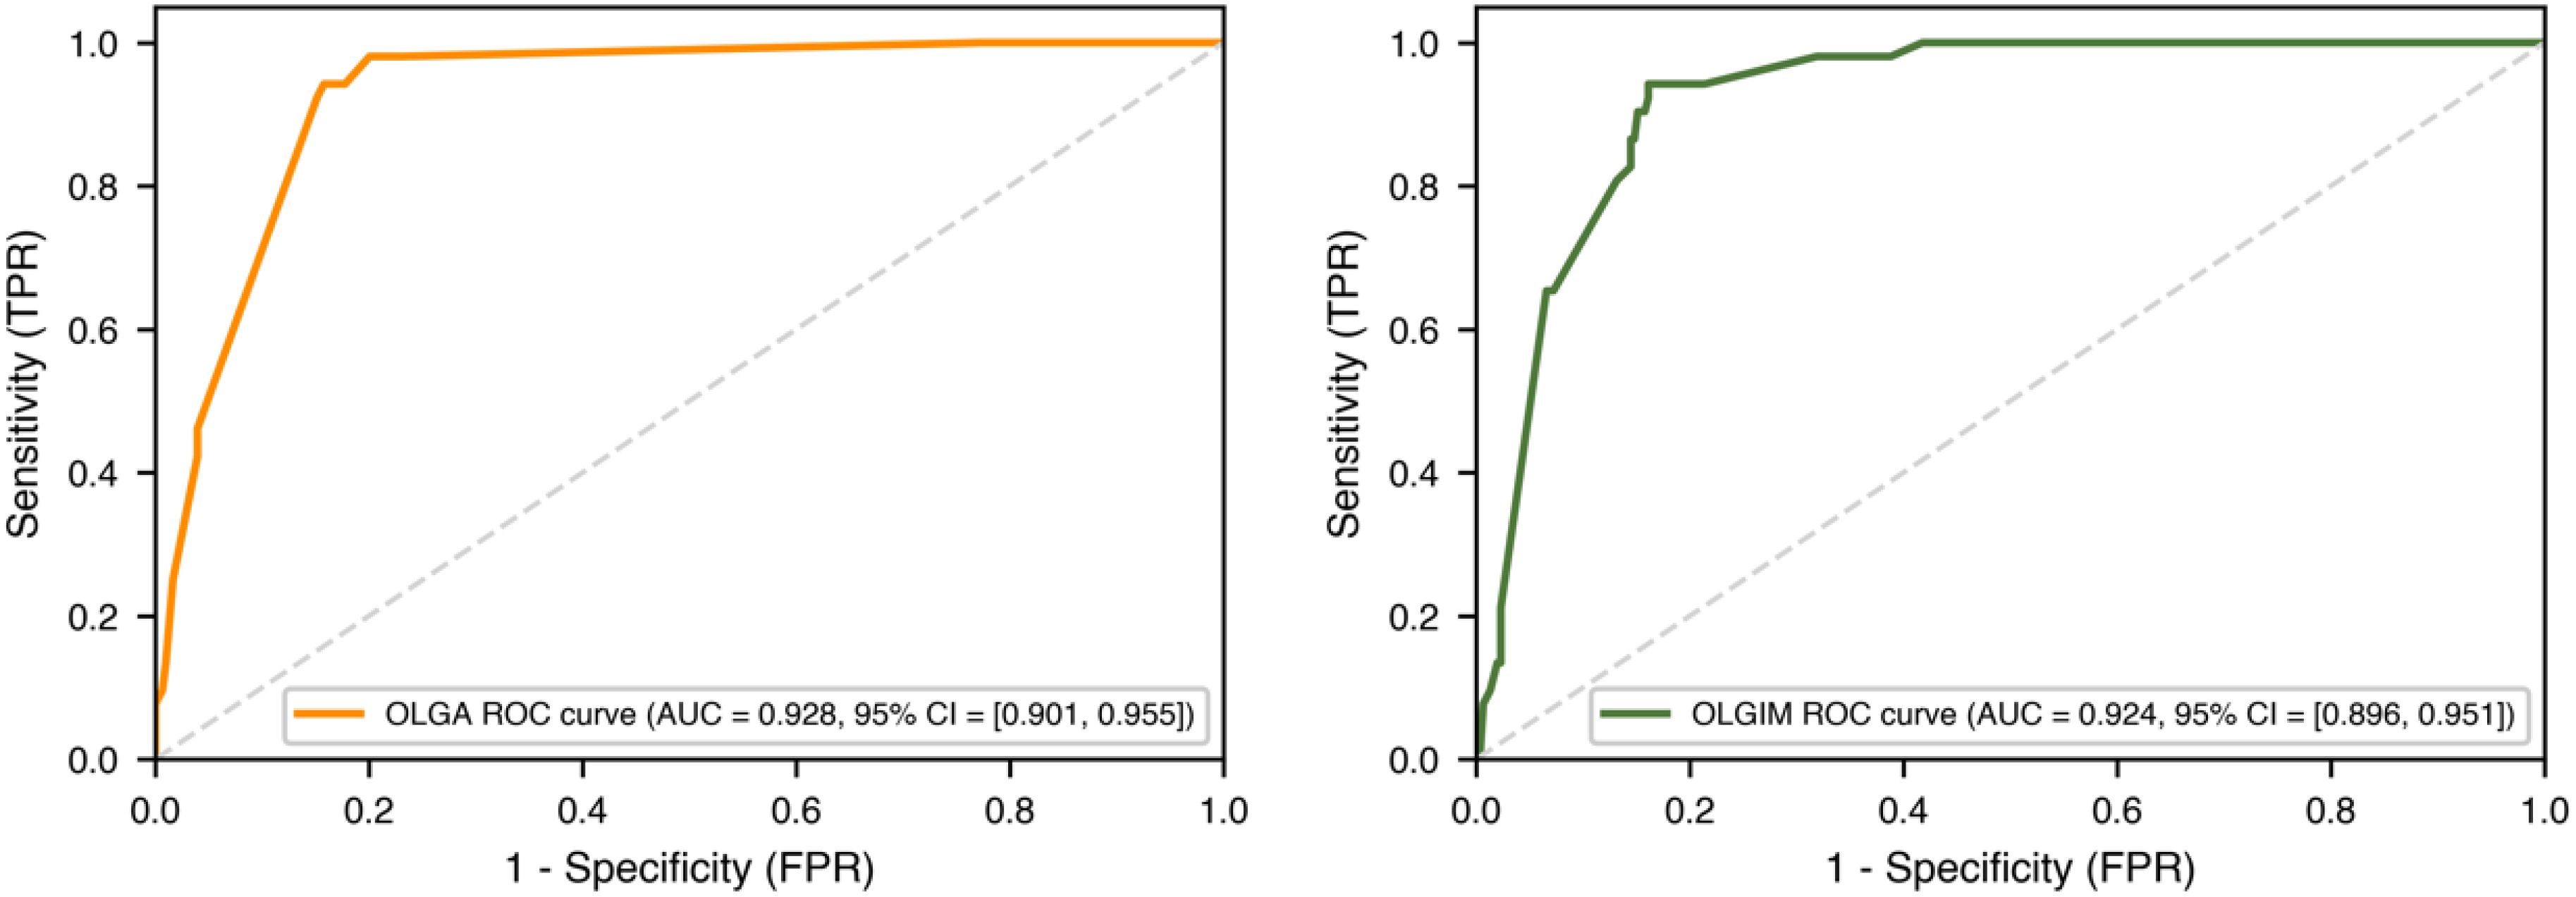
Figure 5. ROC curves for bayesian stepwise discriminant OLGA and OLGIM staging diagnostic models.
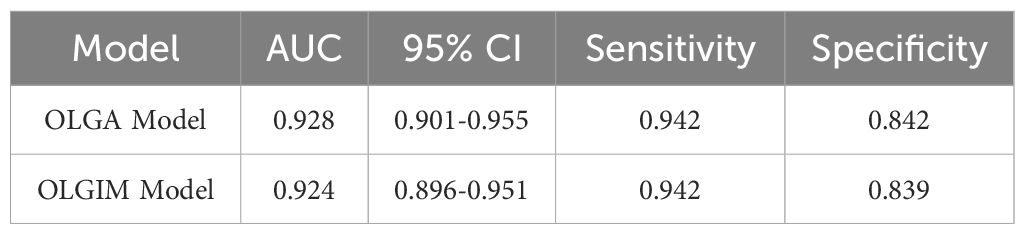
Table 7. Performance of bayesian stepwise discriminant OLGA and OLGIM staging diagnostic models.
Table 7 details the performance metrics of the Bayesian models. Both OLGA and OLGIM models achieved high AUC values (~0.92), sensitivity (~0.94), and specificity (~0.84), confirming their excellent discriminatory ability for identifying high-risk precancerous gastric lesions based on Bayesian stepwise discrimination.
Random forest algorithms were employed to construct prediction models for both OLGA and OLGIM staging. Following data standardisation and class balancing, Synthetic Minority Over-sampling Technique (SMOTE) was applied to address the imbalance between low-risk and high-risk classifications. Grid search and cross-validation methods were utilised during model training to optimise parameters for optimal predictive performance.
ROC curves were constructed to evaluate model performance. On the test set, the OLGA and OLGIM staging diagnostic models achieved accuracy rates of 0.902 and 0.938, respectively; AUC values of 0.958 and 0.975; precision of 0.855 and 0.938; sensitivity of 0.967 and 0.938; specificity of 0.836 and 0.938; and F1 scores of 0.908 and 0.938 (Table 8). The ROC curves for both models deviated substantially from the diagonal line, indicating robust predictive performance (Figure 6).
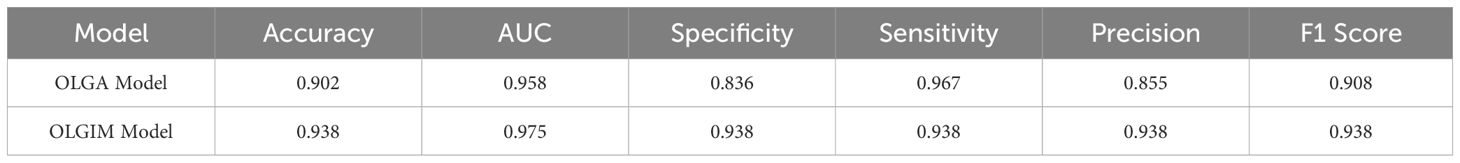
Table 8. Performance of random forest OLGA and OLGIM staging diagnostic models.
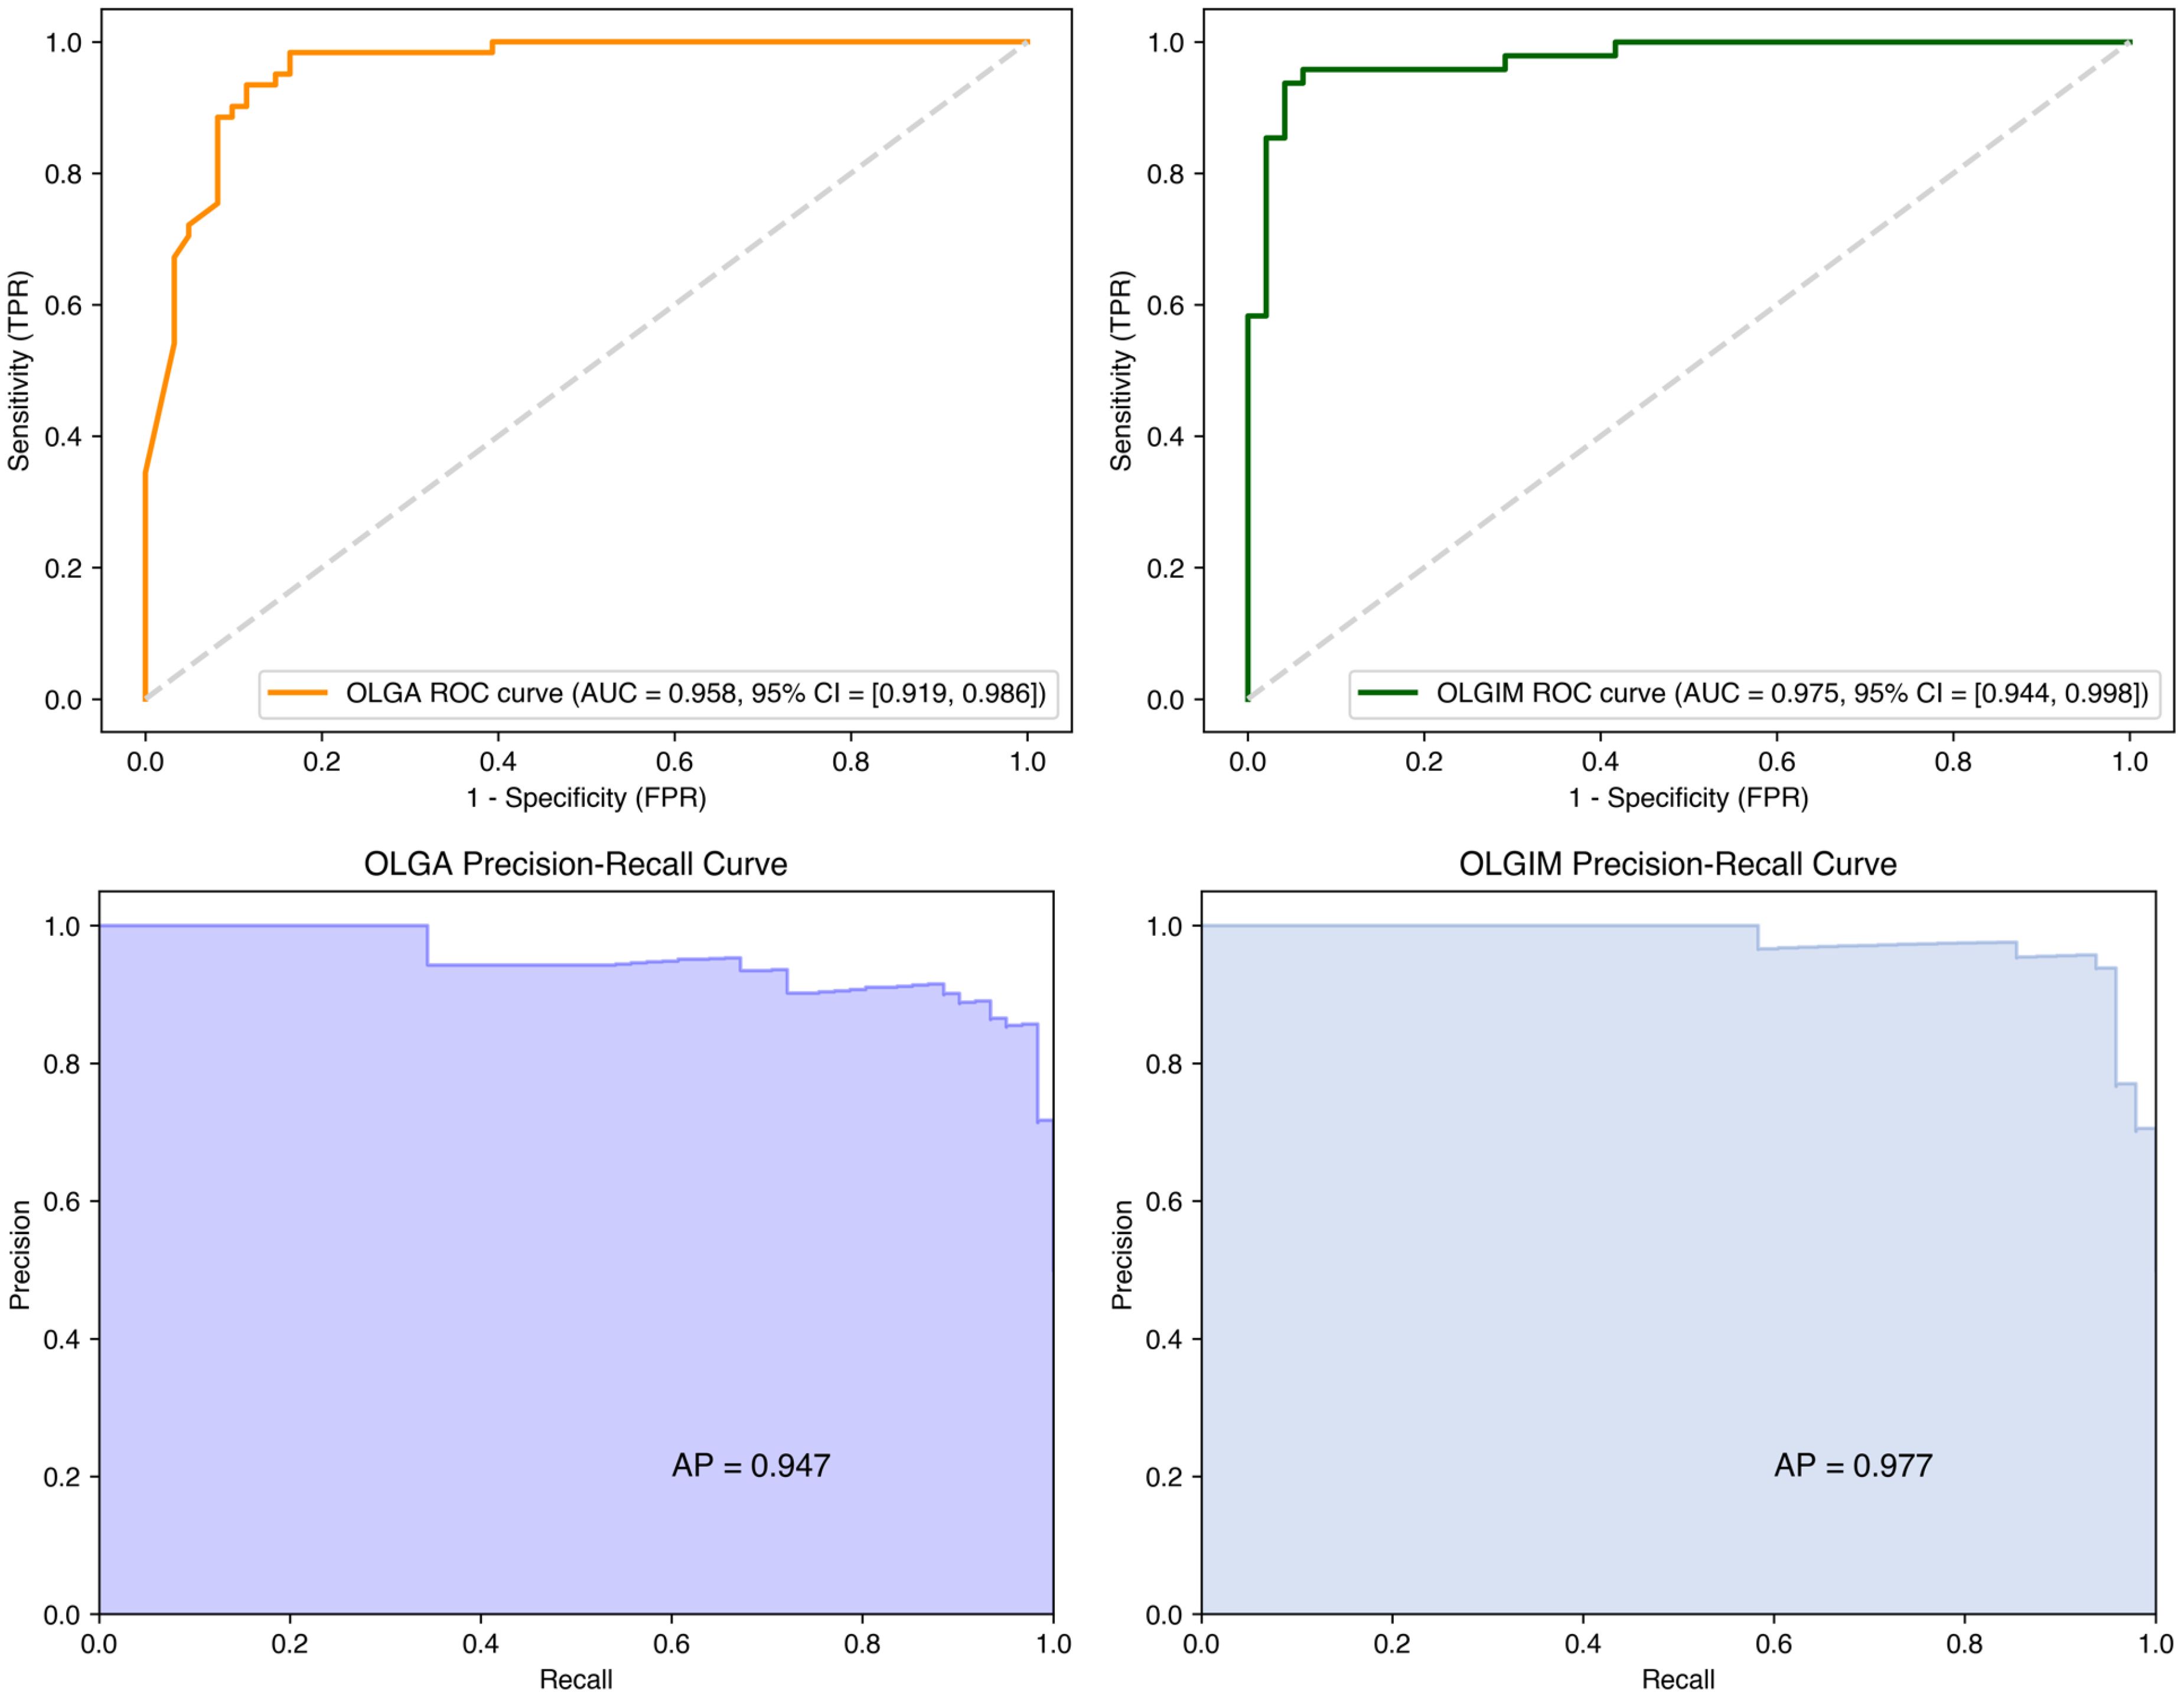
Figure 6. ROC and precision-recall curves for random forest OLGA and OLGIM staging diagnostic models.
Table 8 presents the performance metrics of the Random Forest models. Both OLGA and OLGIM models demonstrated high accuracy (~0.90 and ~0.94 respectively) and AUC values (~0.96 and ~0.975 respectively), along with balanced sensitivity and specificity, indicating strong predictive capability for risk stratification using Random Forest algorithms.
The Random Forest models demonstrated robust performance in high-risk classification, achieving F1-scores of 0.908 (OLGA) and 0.938 (OLGIM). Figure 6 presents the Precision-Recall curves, which elucidate the precision-recall trade-off for high-risk OLGA/OLGIM classifications.
To comprehensively evaluate the reliability of predictive results, we conducted thorough stability testing. Through 100 random sampling evaluations and 5-fold cross-validation, we obtained statistical distributions of model performance metrics. The OLGA model achieved a mean accuracy of 0.912 ± 0.019 and mean AUC value of 0.972 ± 0.010, whilst the OLGIM model achieved a mean accuracy of 0.901 ± 0.032 and mean AUC value of 0.934 ± 0.031. The small standard deviations indicate stable predictive performance across different data subsets. Furthermore, 5-fold cross-validation revealed mean validation scores of 0.903 ± 0.007 for the OLGA model and 0.900 ± 0.013 for the OLGIM model. This stable cross-validation performance further confirms model reliability, demonstrating consistent high predictive accuracy across different patient populations (Figures 7, 8).
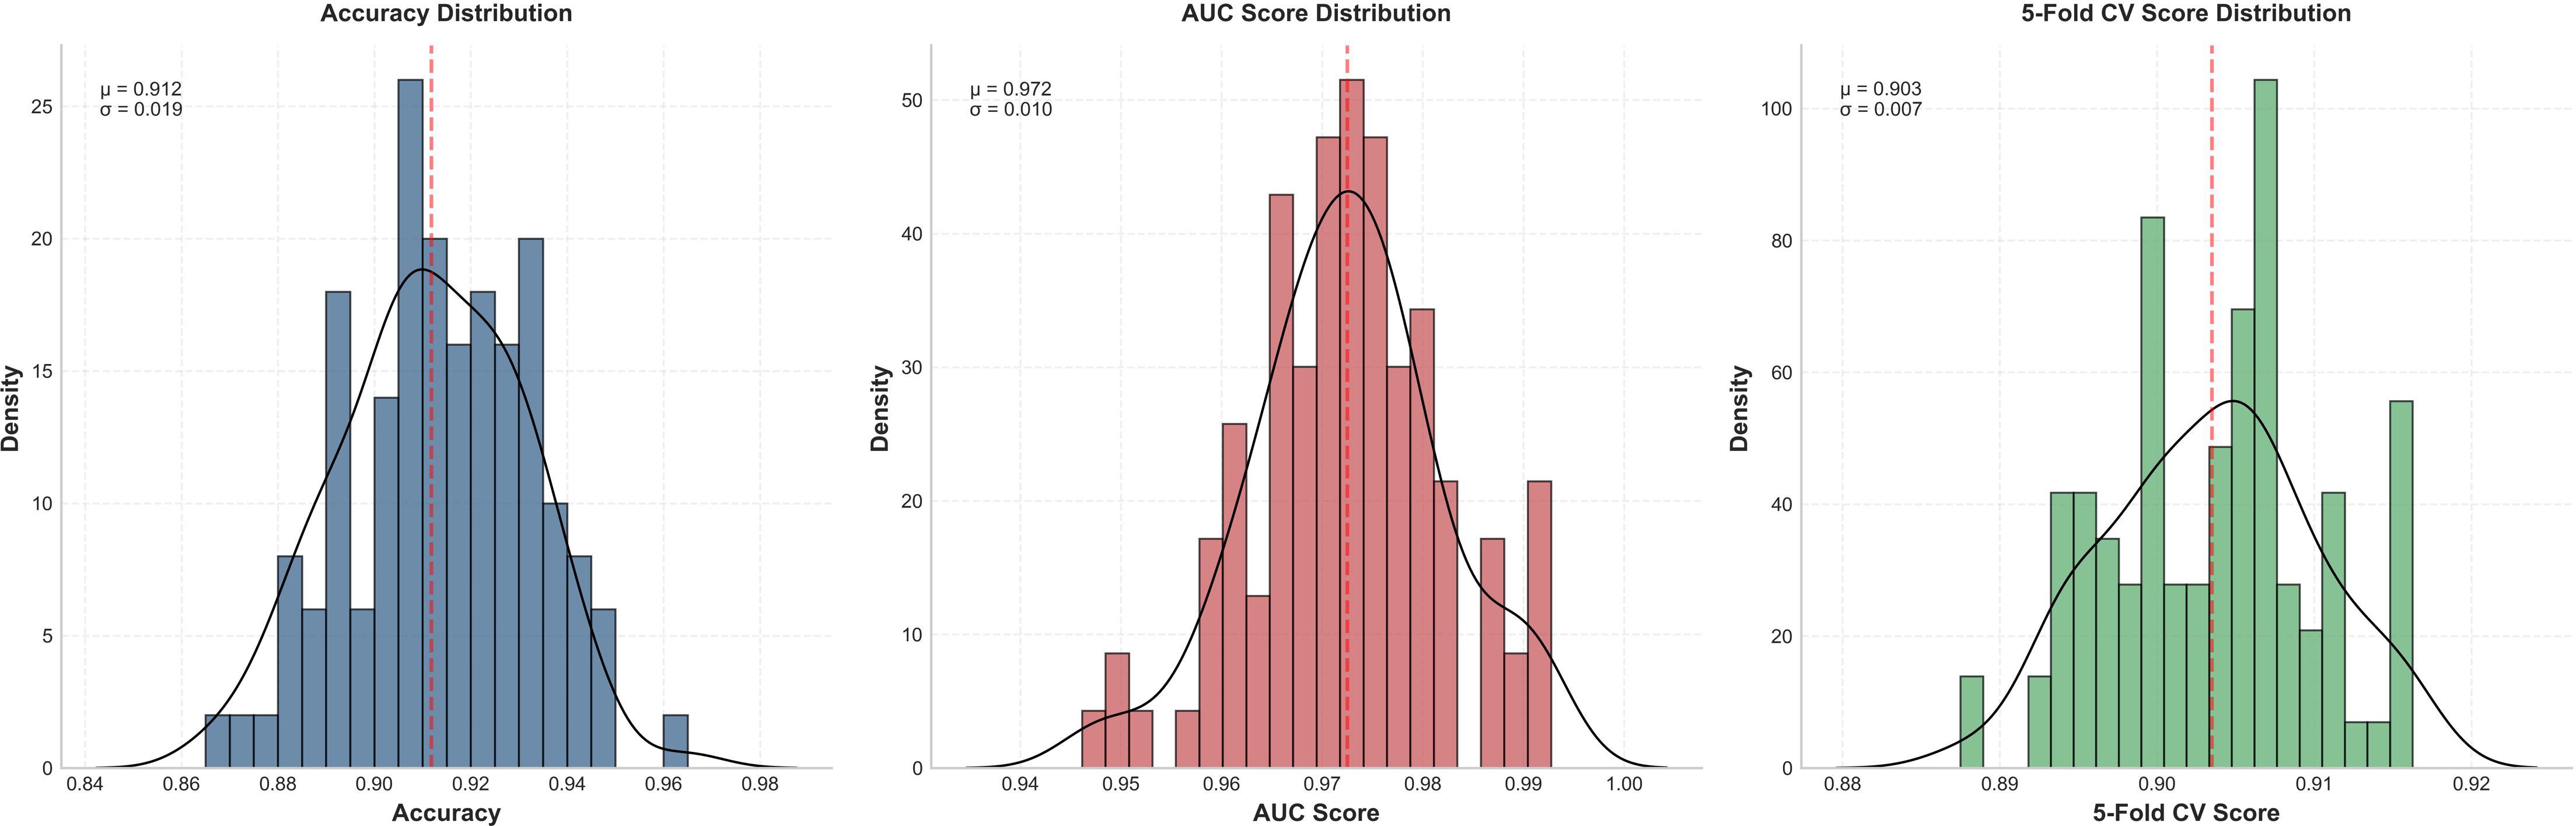
Figure 7. Stability assessment of the random forest OLGA staging diagnostic model.
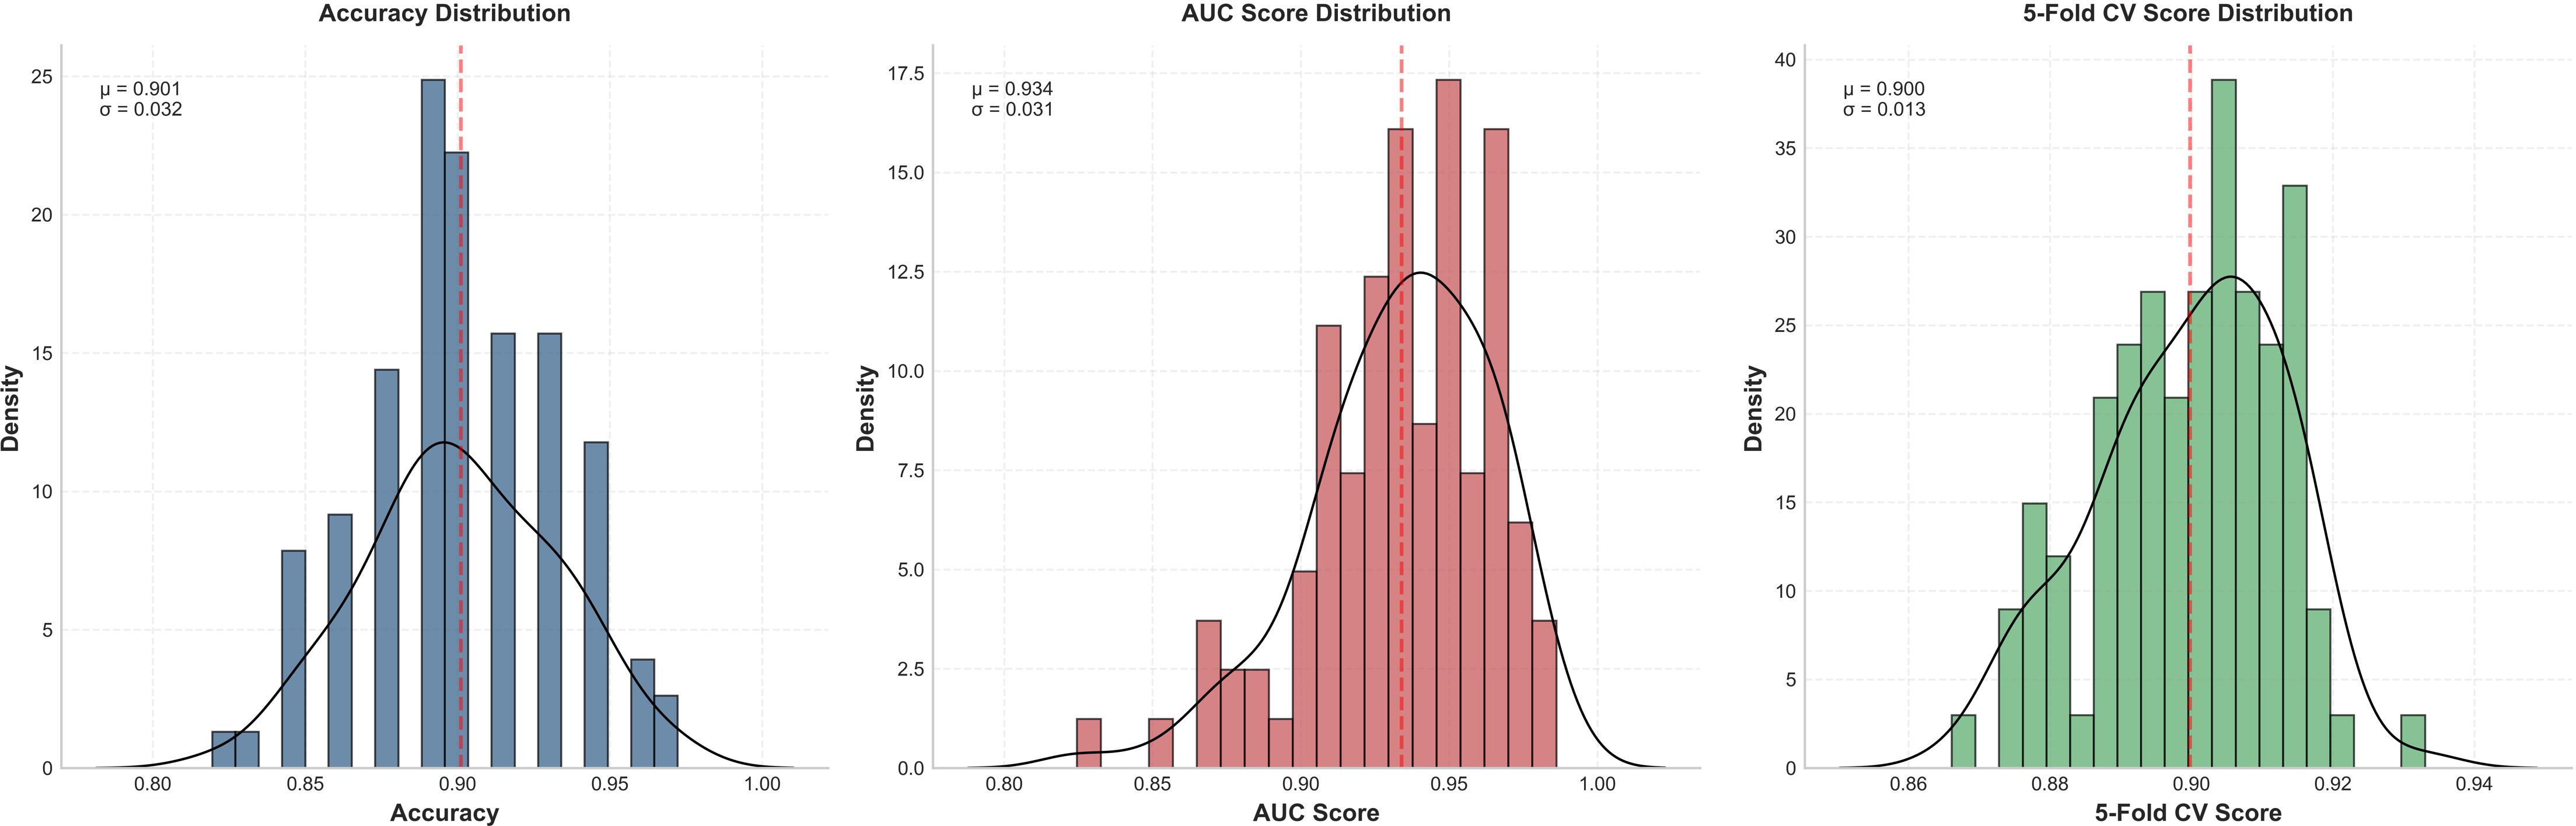
Figure 8. Stability assessment of the random forest OLGIM staging diagnostic model.
Feature importance analysis revealed the relative contributions of different endoscopic characteristics to the prediction models. In the OLGA model, the top three features were MCDL border regularity (28.15%), MCDL border size (15.64%), and presence of DL (14.42%). For the OLGIM model, the most important features were MCDL border regularity (25.84%), mucosal status (15.75%), and MCDL border size (10.77%). These results indicate that these specific endoscopic features have high predictive value for assessing precancerous gastric lesion risk (Supplementary Figure 1, 2).
To gain deeper insight into the relationships between endoscopic features and model predictions, SHAP (SHapley Additive exPlanations) value analysis was performed to reveal the direction and magnitude of each feature’s impact on prediction outcomes (Figures 9, 10). We found that certain features, such as MCDL border regularity and lesion size, demonstrated strong positive predictive effects in both OLGA and OLGIM diagnostic models.
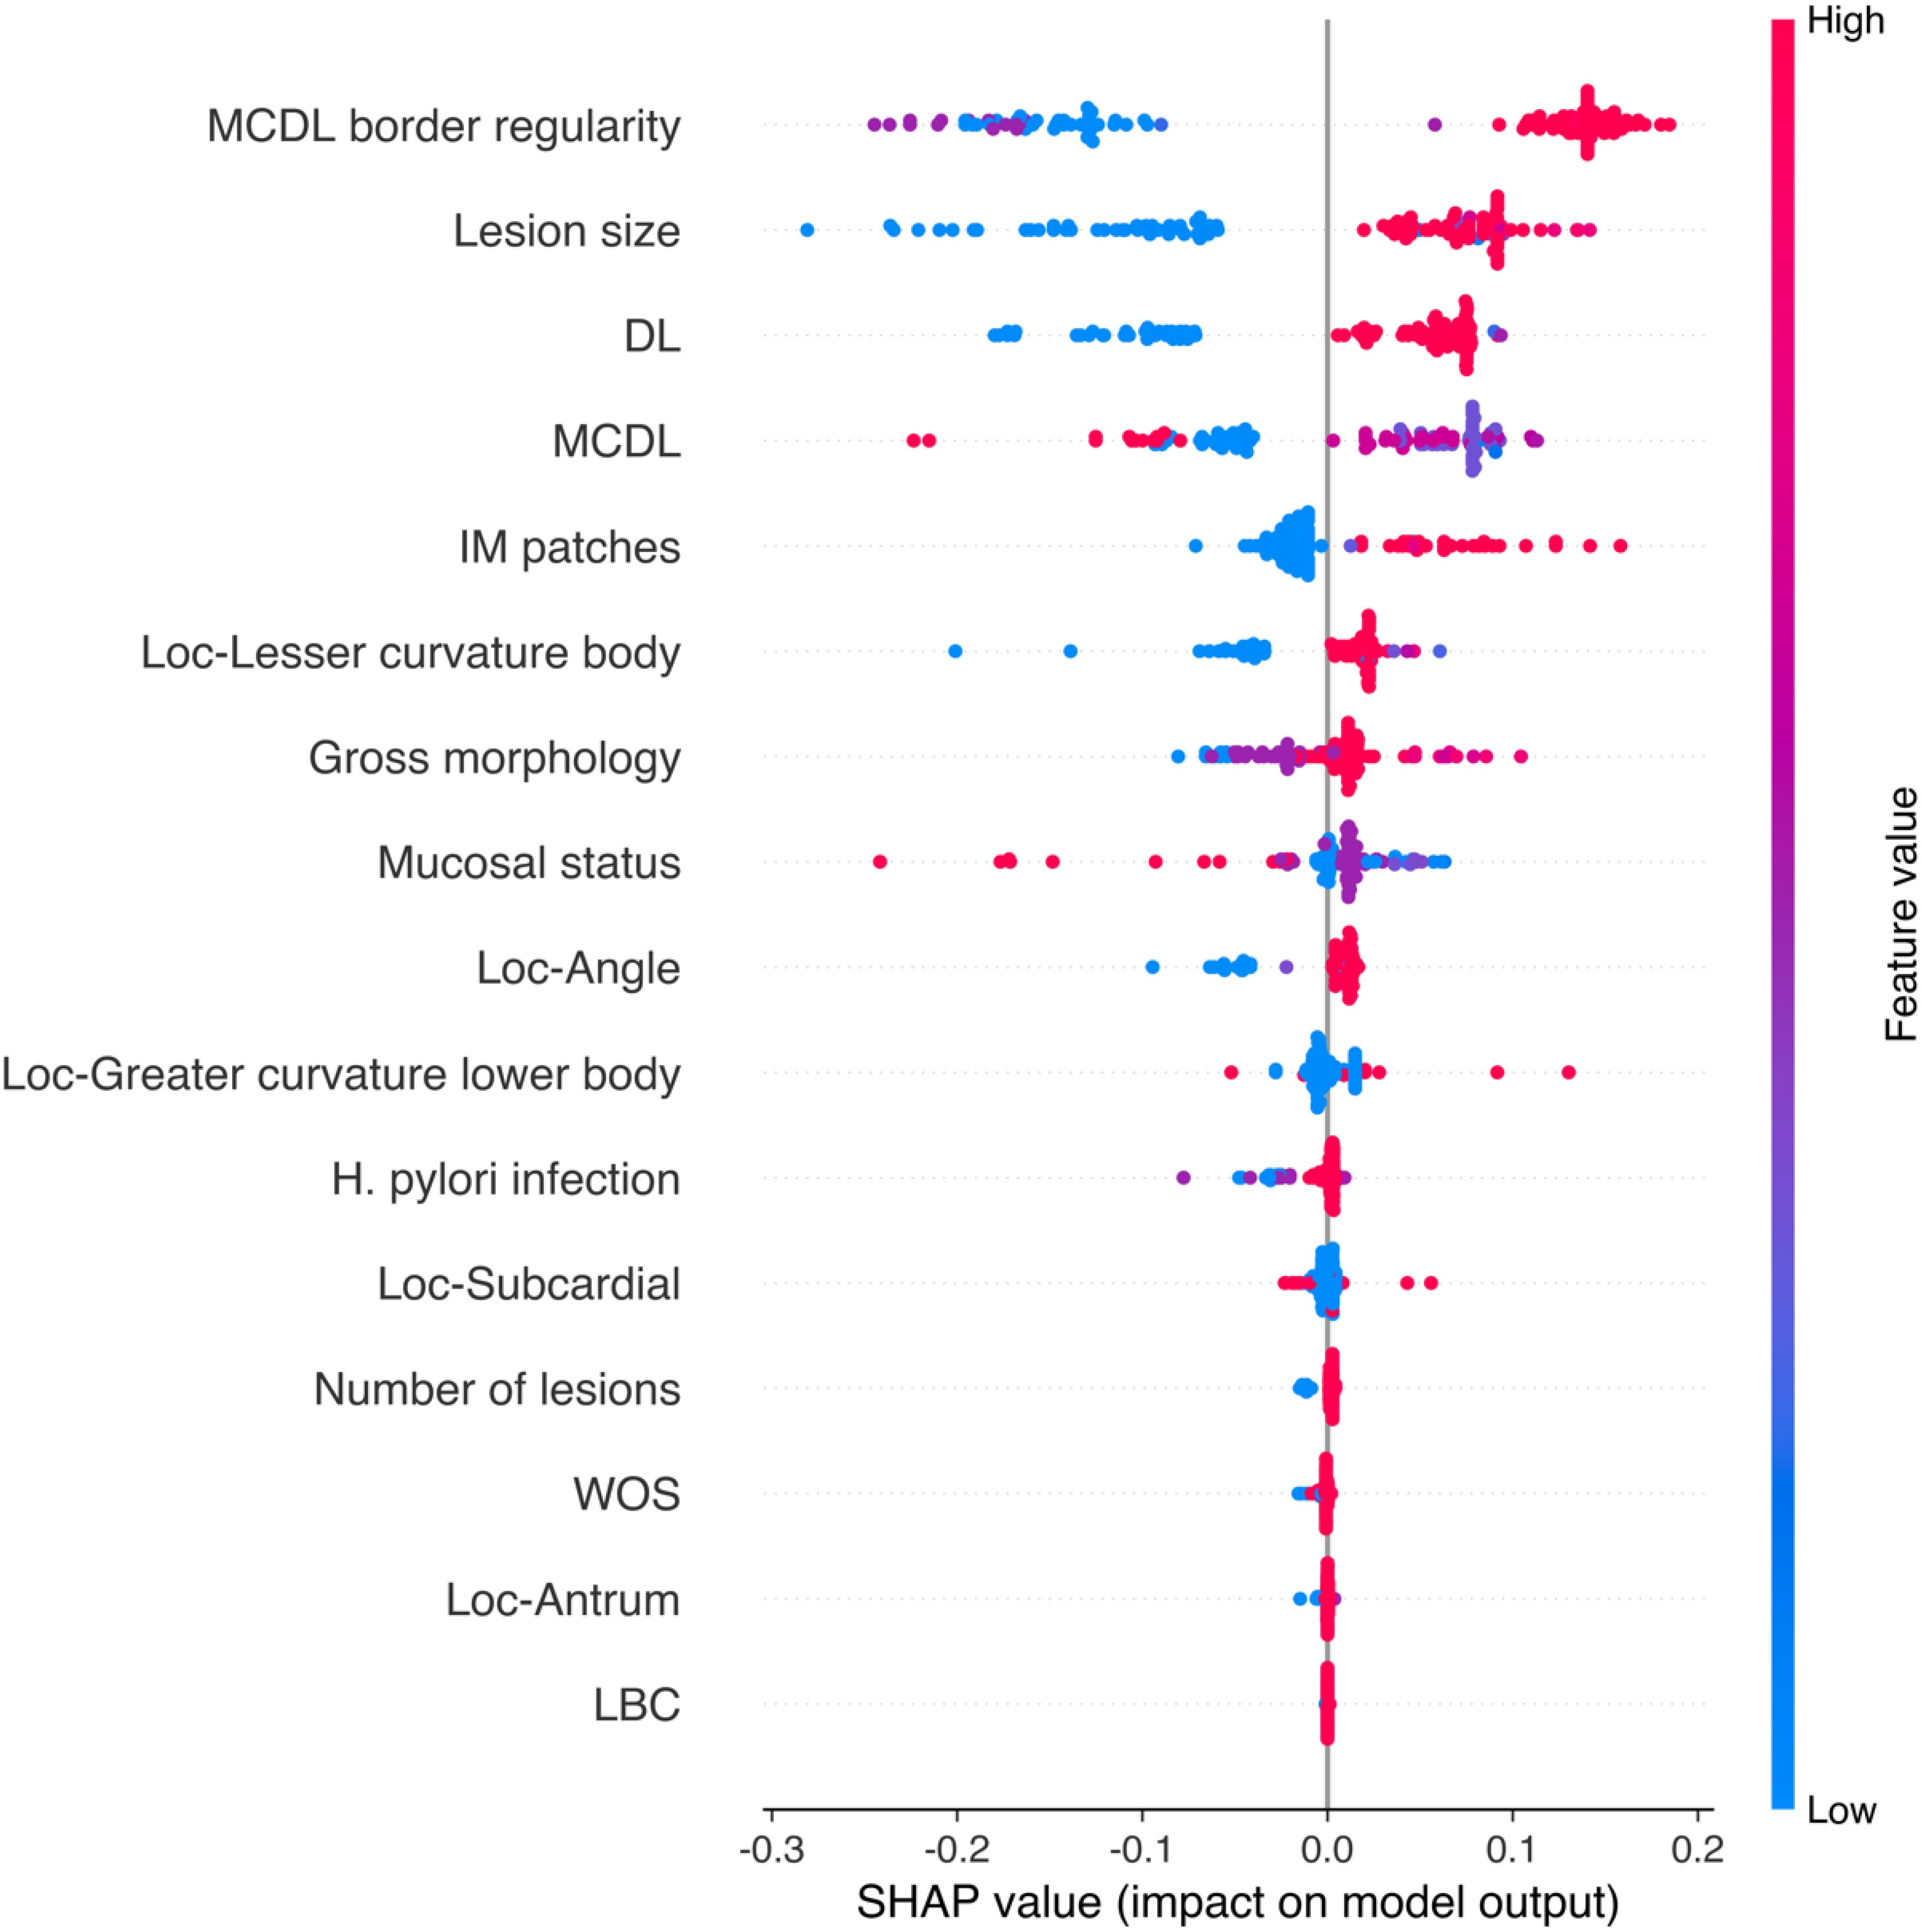
Figure 9. SHAP value scatter plot for the random forest OLGA staging diagnostic model.
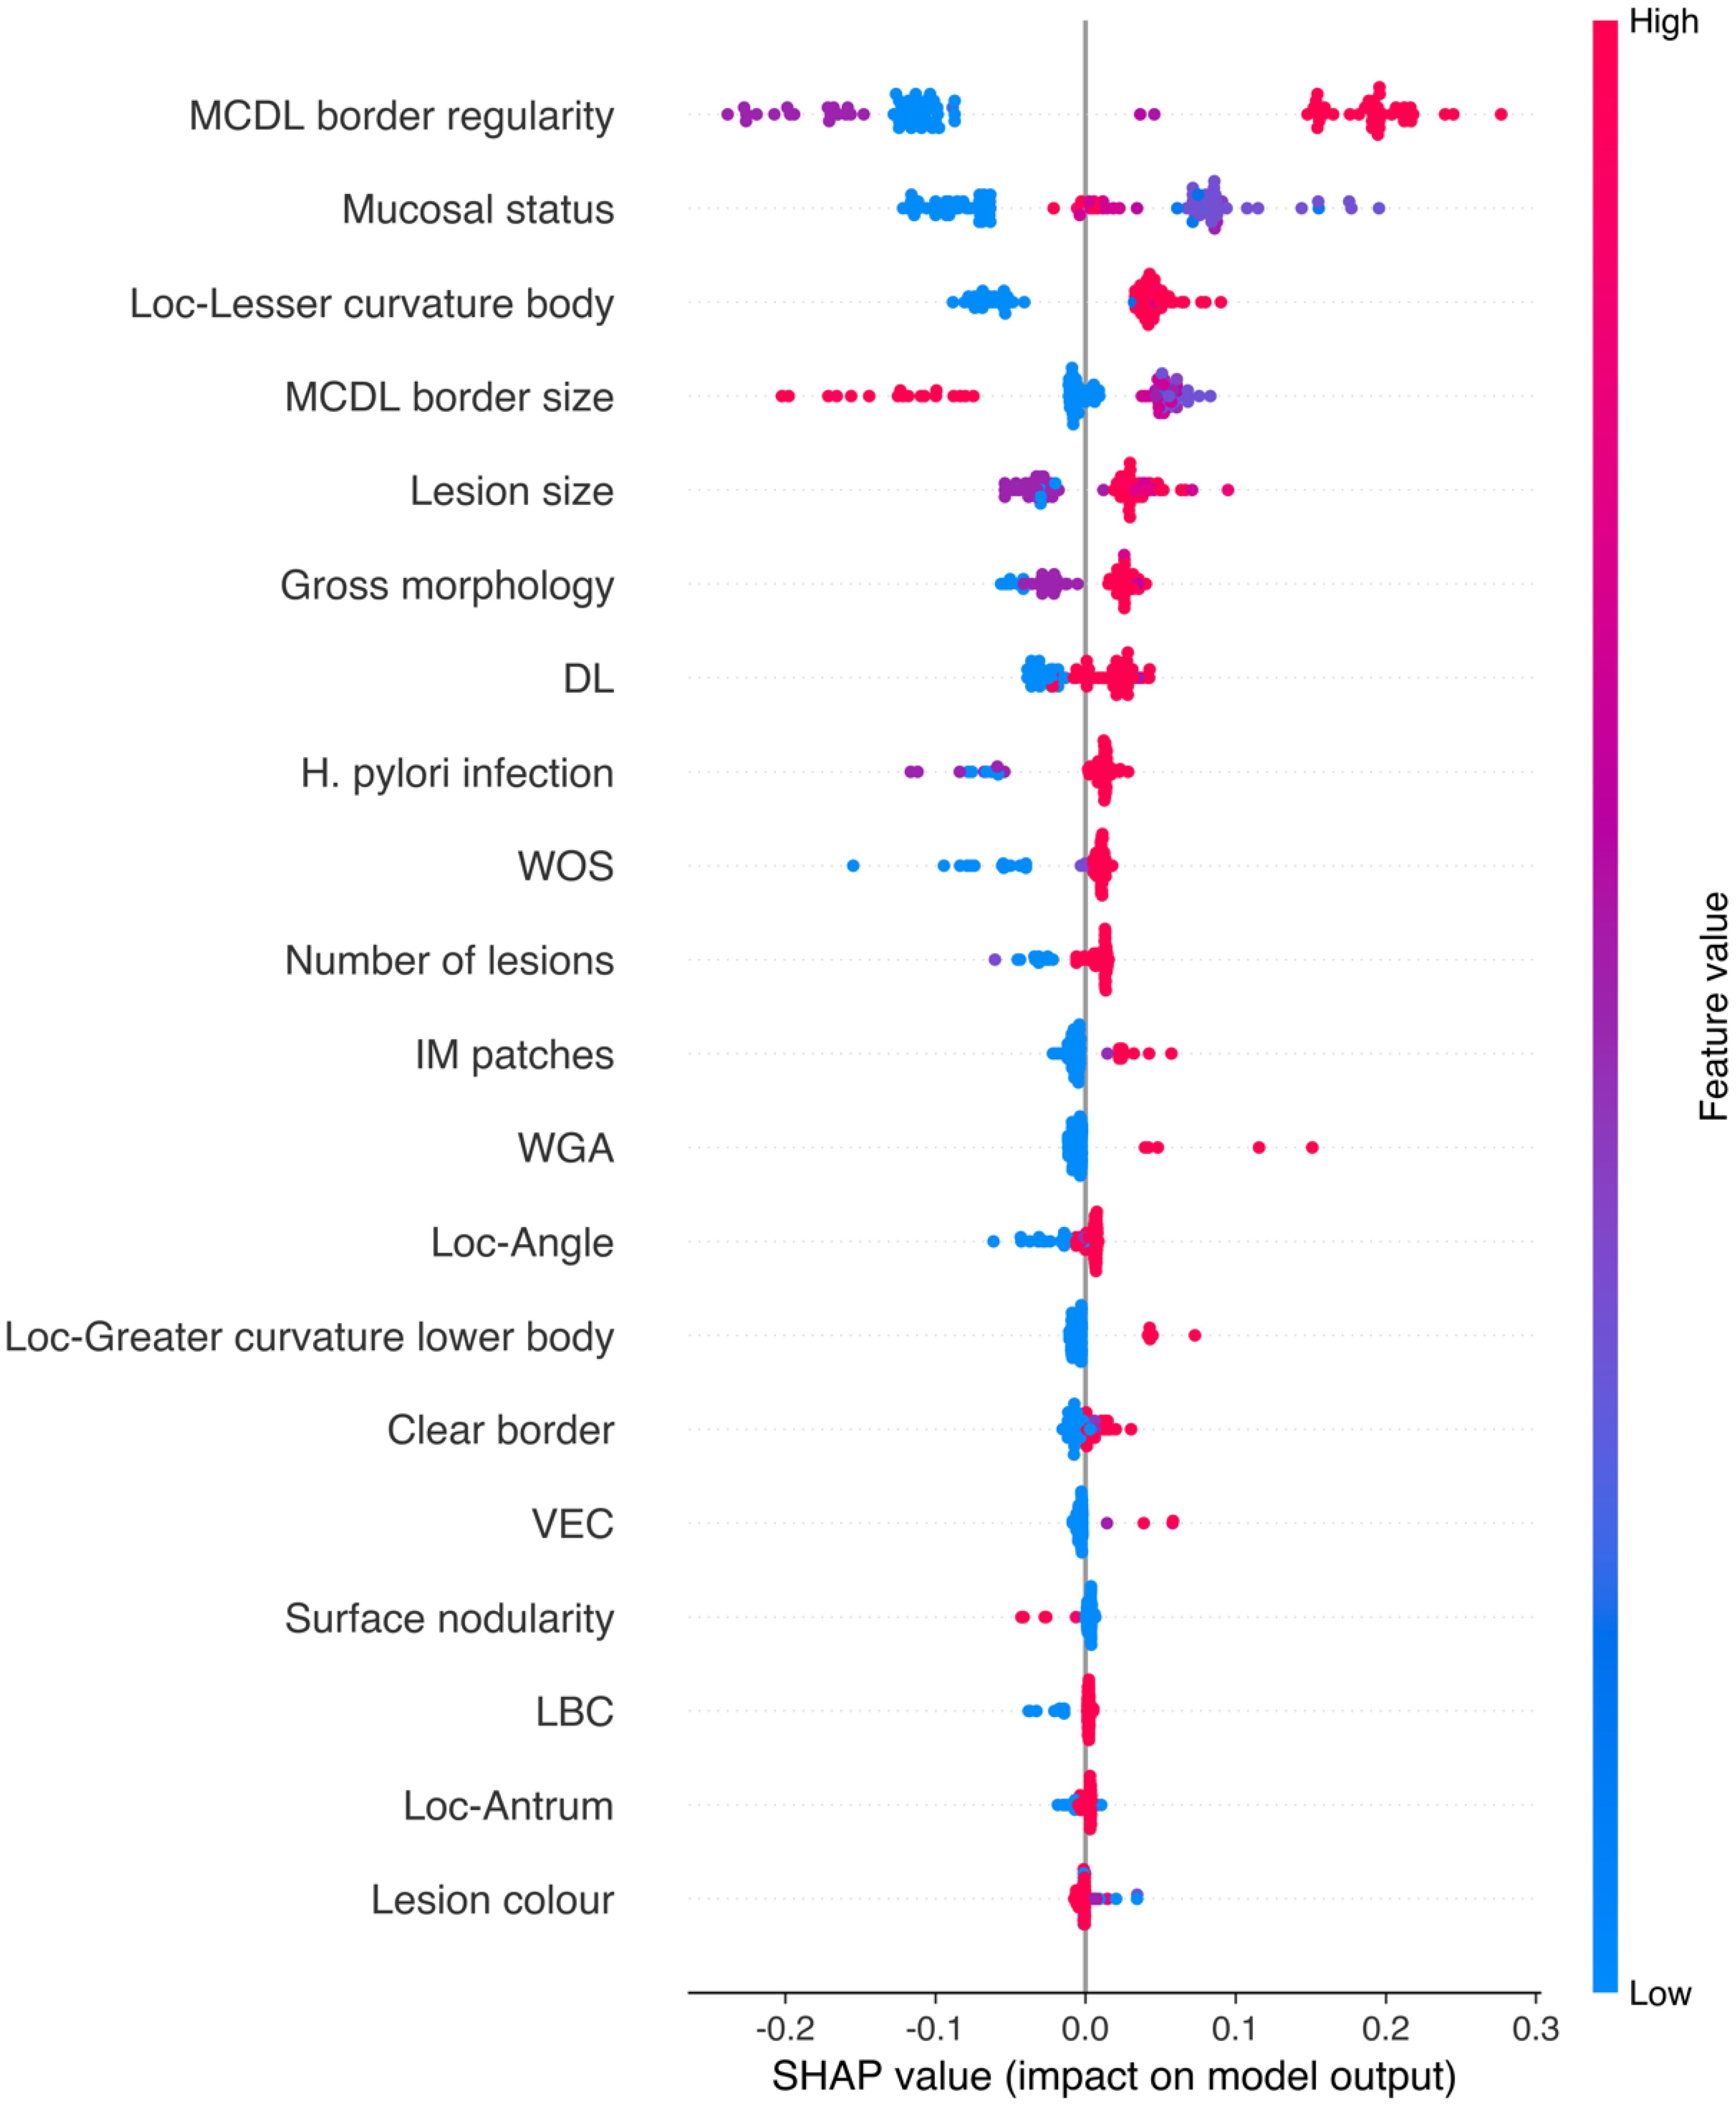
Figure 10. SHAP value scatter plot for the random forest OLGIM staging diagnostic model.
XGBoost algorithm was employed to construct diagnostic prediction models for OLGA and OLGIM staging. Following data standardisation, Synthetic Minority Over-sampling Technique (SMOTE) was applied to address class imbalance, ensuring comprehensive feature learning for both risk levels.
The XGBoost models achieved accuracy rates of 0.918 and 0.927 for OLGA and OLGIM staging, respectively; specificity of 0.885 and 0.896; sensitivity of 0.951 and 0.958; precision of 0.892 and 0.902; AUC values of 0.966 and 0.979; and F1 scores of 0.921 and 0.929. Detailed performance metrics for both staging diagnostic models are presented in Table 9, with ROC curves shown in Figure 11. The XGBoost models demonstrated robust predictive capability for both OLGA and OLGIM staging, effectively discriminating between low-risk and high-risk OLGA/OLGIM patients.
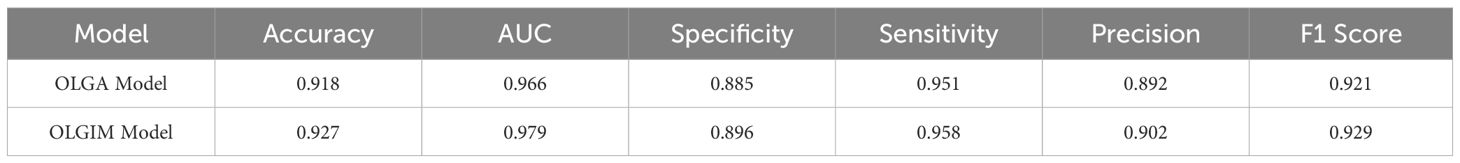
Table 9. Performance of XGBoost OLGA and OLGIM staging diagnostic models.
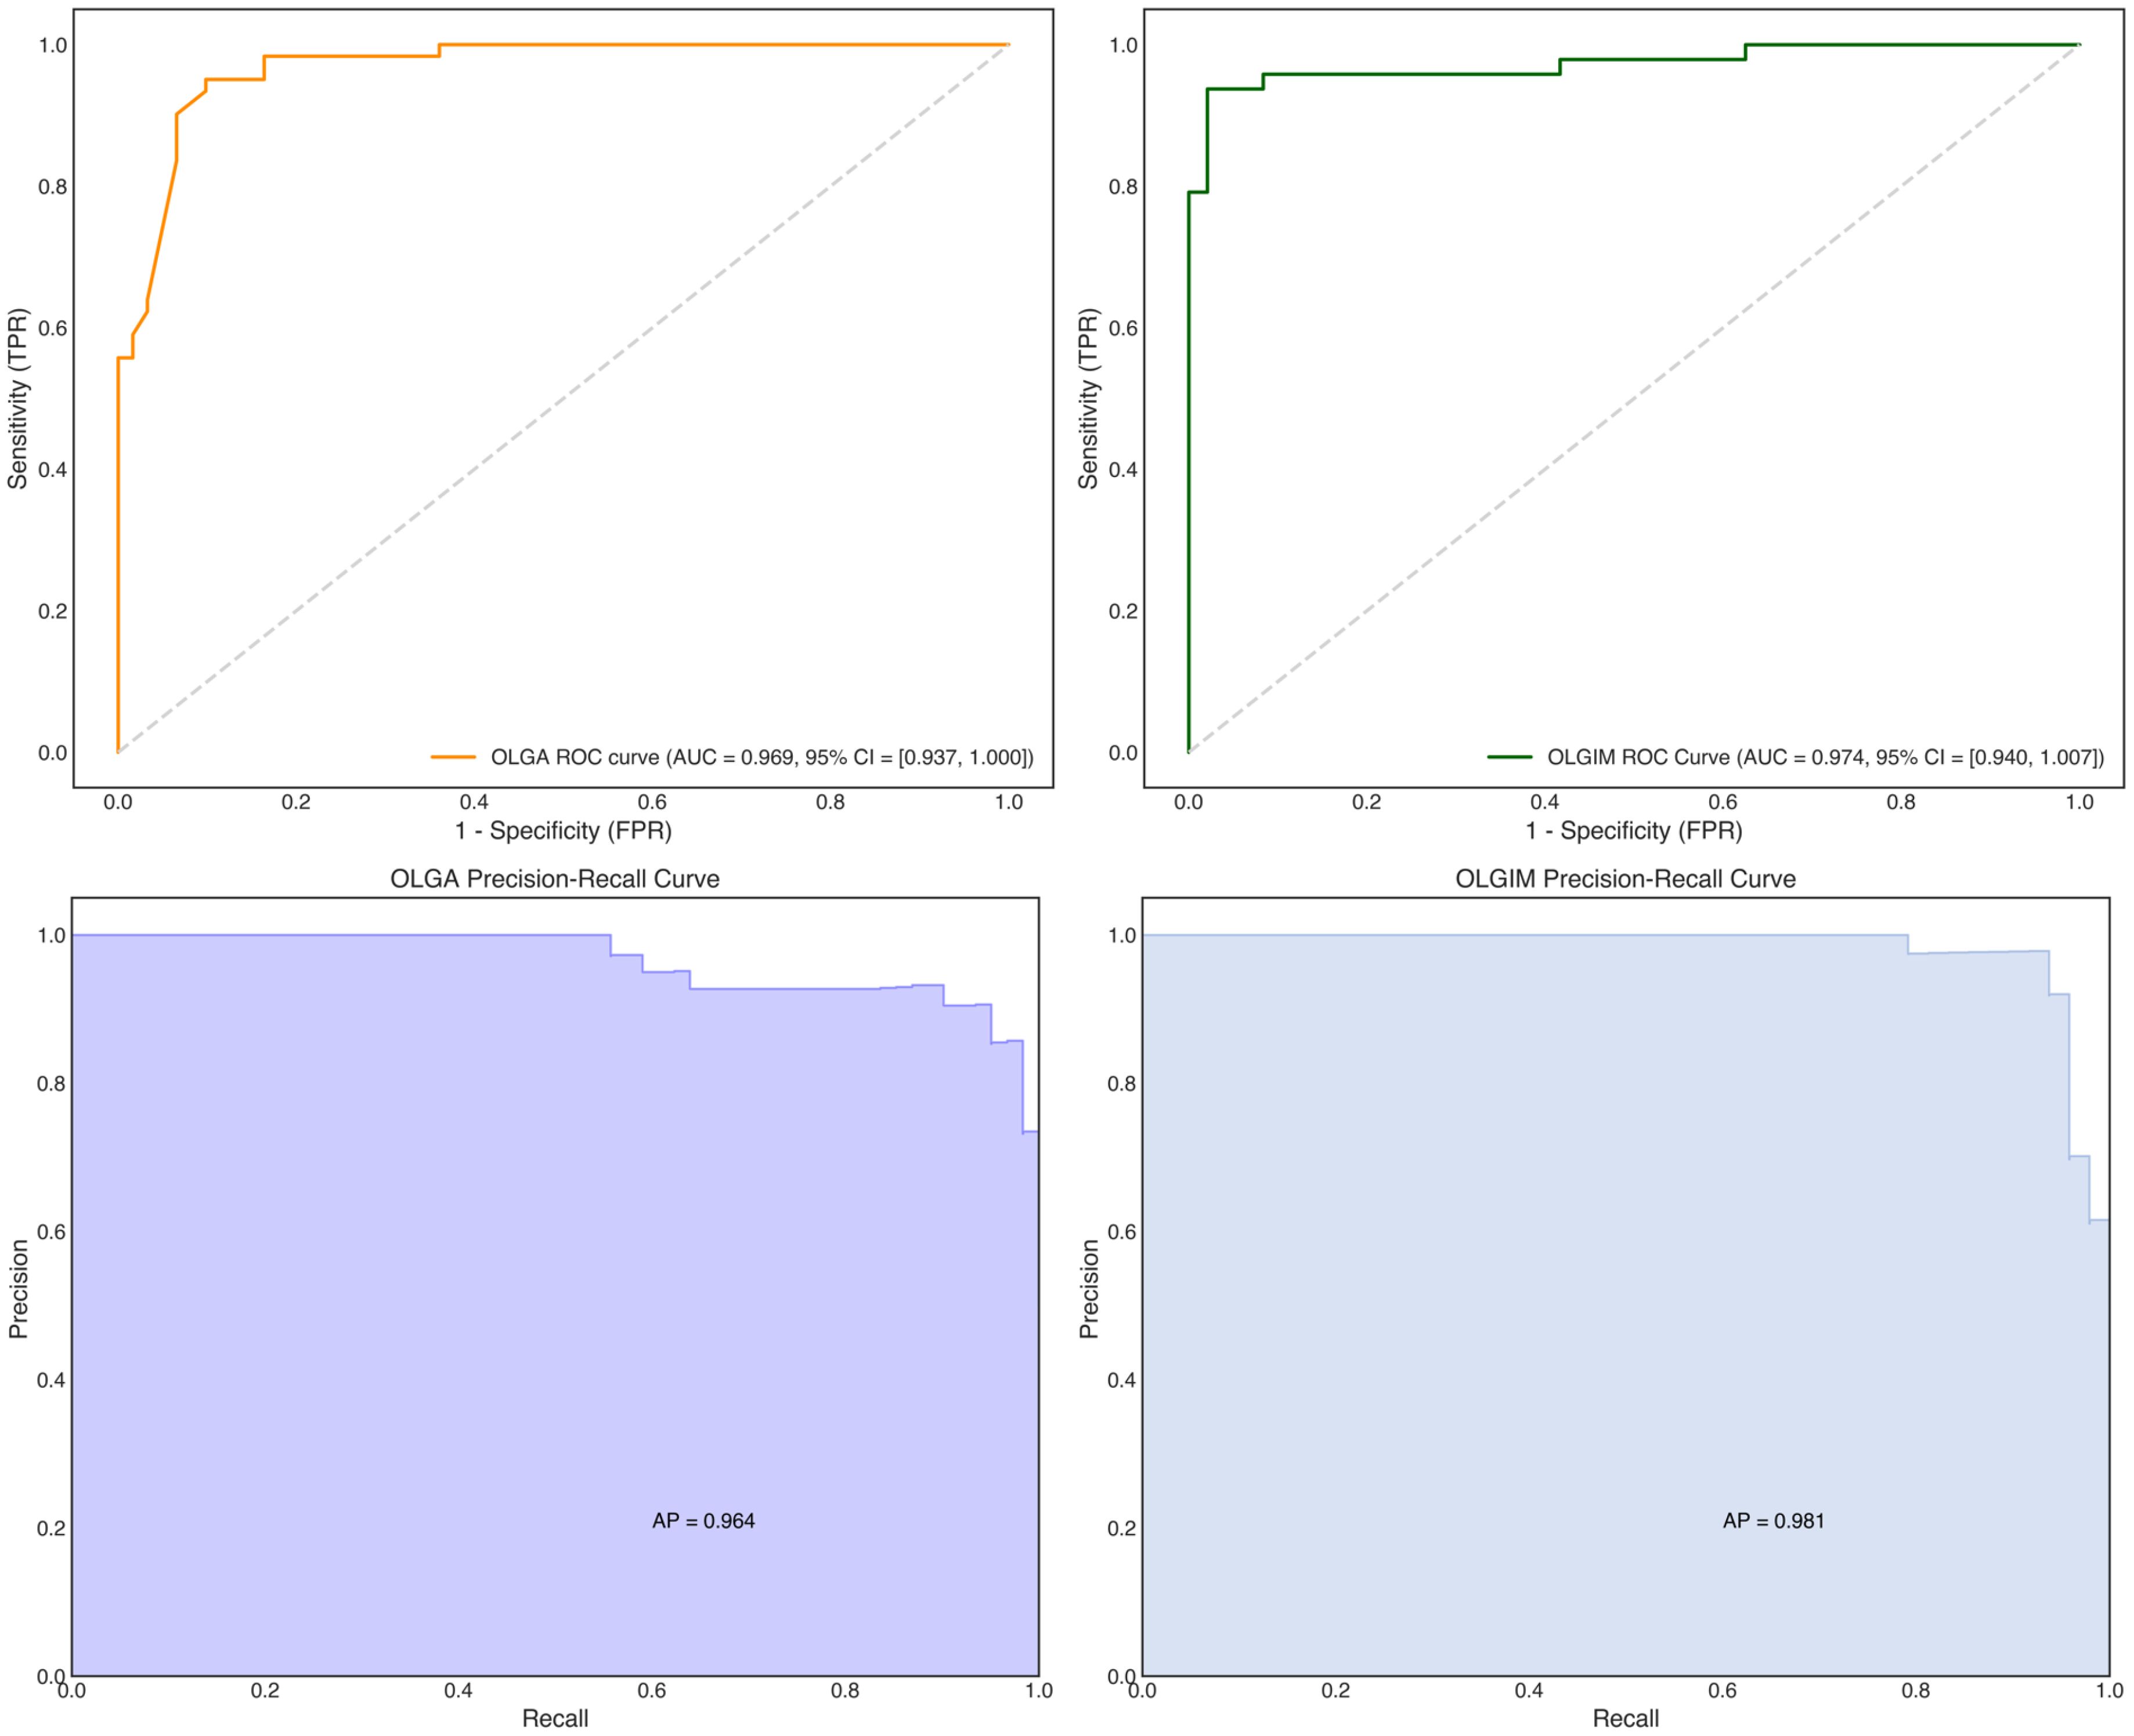
Figure 11. ROC and precision-recall curves for XGBoost OLGA and OLGIM staging diagnostic models.
Among the three models evaluated, XGBoost and Random Forest both demonstrated exceptional performance, with XGBoost exhibiting marginally superior metrics. As illustrated in Table 9, XGBoost achieved the highest accuracy (OLGA: 91.8%, OLGIM: 92.7%) and AUC values (OLGA: 0.966, OLGIM: 0.979). Random Forest also yielded excellent results, with accuracy (OLGA: 90.2%, OLGIM: 93.8%) and AUC values (OLGA: 0.958, OLGIM: 0.975) that were comparable to those of XGBoost. Given their high accuracy and AUC values, both XGBoost and Random Forest models show considerable promise for clinical application in risk stratification of precancerous gastric lesions. Whilst XGBoost demonstrates a slight advantage in performance metrics, the robust performance of Random Forest warrants acknowledgement. Therefore, based on a comprehensive evaluation of accuracy, AUC and overall robustness, we propose that both XGBoost and Random Forest models represent excellent candidates for real-world clinical implementation, with XGBoost potentially offering slight advantages due to its marginally superior performance.
To comprehensively evaluate clinical utility, we analysed both false positive (FP) and false negative (FN) outcomes across all models. In OLGA staging, the Bayesian model demonstrated notably high rates, with 48 false positives and 3 false negatives. Similarly, for OLGIM staging, the Bayesian model produced 49 false positives and 3 false negatives. The Random Forest model, however, exhibited markedly improved performance in OLGA staging, reducing false positives to 10 whilst maintaining only 2 false negatives. When applied to OLGIM staging, the Random Forest model yielded 3 false positives and 3 false negatives. The XGBoost model demonstrated promising results, with 7 false positives and 3 false negatives in OLGA staging, whilst in OLGIM staging, it produced 5 false positives and merely 2 false negatives. Notably, whilst the Random Forest model achieved optimal performance in OLGA staging with the lowest false negative count, the XGBoost model demonstrated superior overall balance across both staging systems, particularly in OLGIM staging where it combined minimal false negatives with relatively few false positives.
In the clinical management of precancerous gastric lesions, minimising false negatives is crucial, as failing to identify high-risk individuals requiring prompt intervention may result in delayed diagnosis and potential disease progression. Whilst less critical than false negatives, elevated false positive rates warrant consideration, as they may lead to unnecessary endoscopic procedures and biopsies in low-risk patients, thereby increasing healthcare expenditure and patient anxiety (26).
Table 9 details the performance metrics of the XGBoost models. Both OLGA and OLGIM models achieved high accuracy (~0.92 and ~0.93 respectively) and AUC values (~0.966 and ~0.979 respectively), with high sensitivity and specificity, demonstrating robust and slightly superior performance compared to Random Forest and Bayesian models for risk prediction using XGBoost.
The XGBoost models exhibited exceptional performance in identifying high-risk cases, yielding F1-scores of 0.921 (OLGA) and 0.929 (OLGIM). Figure 11 illustrates the corresponding Precision-Recall curves, providing detailed insights into the precision and recall dynamics for high-risk cohorts.
XGBoost algorithm was used to rank the importance of key predictive features in OLGA and OLGIM staging, with higher scores indicating greater diagnostic significance and contribution to predictive accuracy. Feature importance rankings and specific scores are shown in Supplementary Figure 3 and 4. These findings provide a basis for clinical focus on endoscopic features with higher numerical values in identifying high-risk precancerous gastric lesions.
SHAP scatter plots for the XGBoost models are presented in Figures 12 and 13. In both OLGA and OLGIM staging diagnostic models, MCDL border irregularity and lesion size demonstrated strong positive predictive effects, whilst MCDL border size showed negative predictive effects. These results indicate that irregular MCDL and lesions ≥1cm are risk factors for high-risk OLGA/OLGIM, whereas larger MCDL border size serves as a protective factor for high-risk OLGA/OLGIM patients.
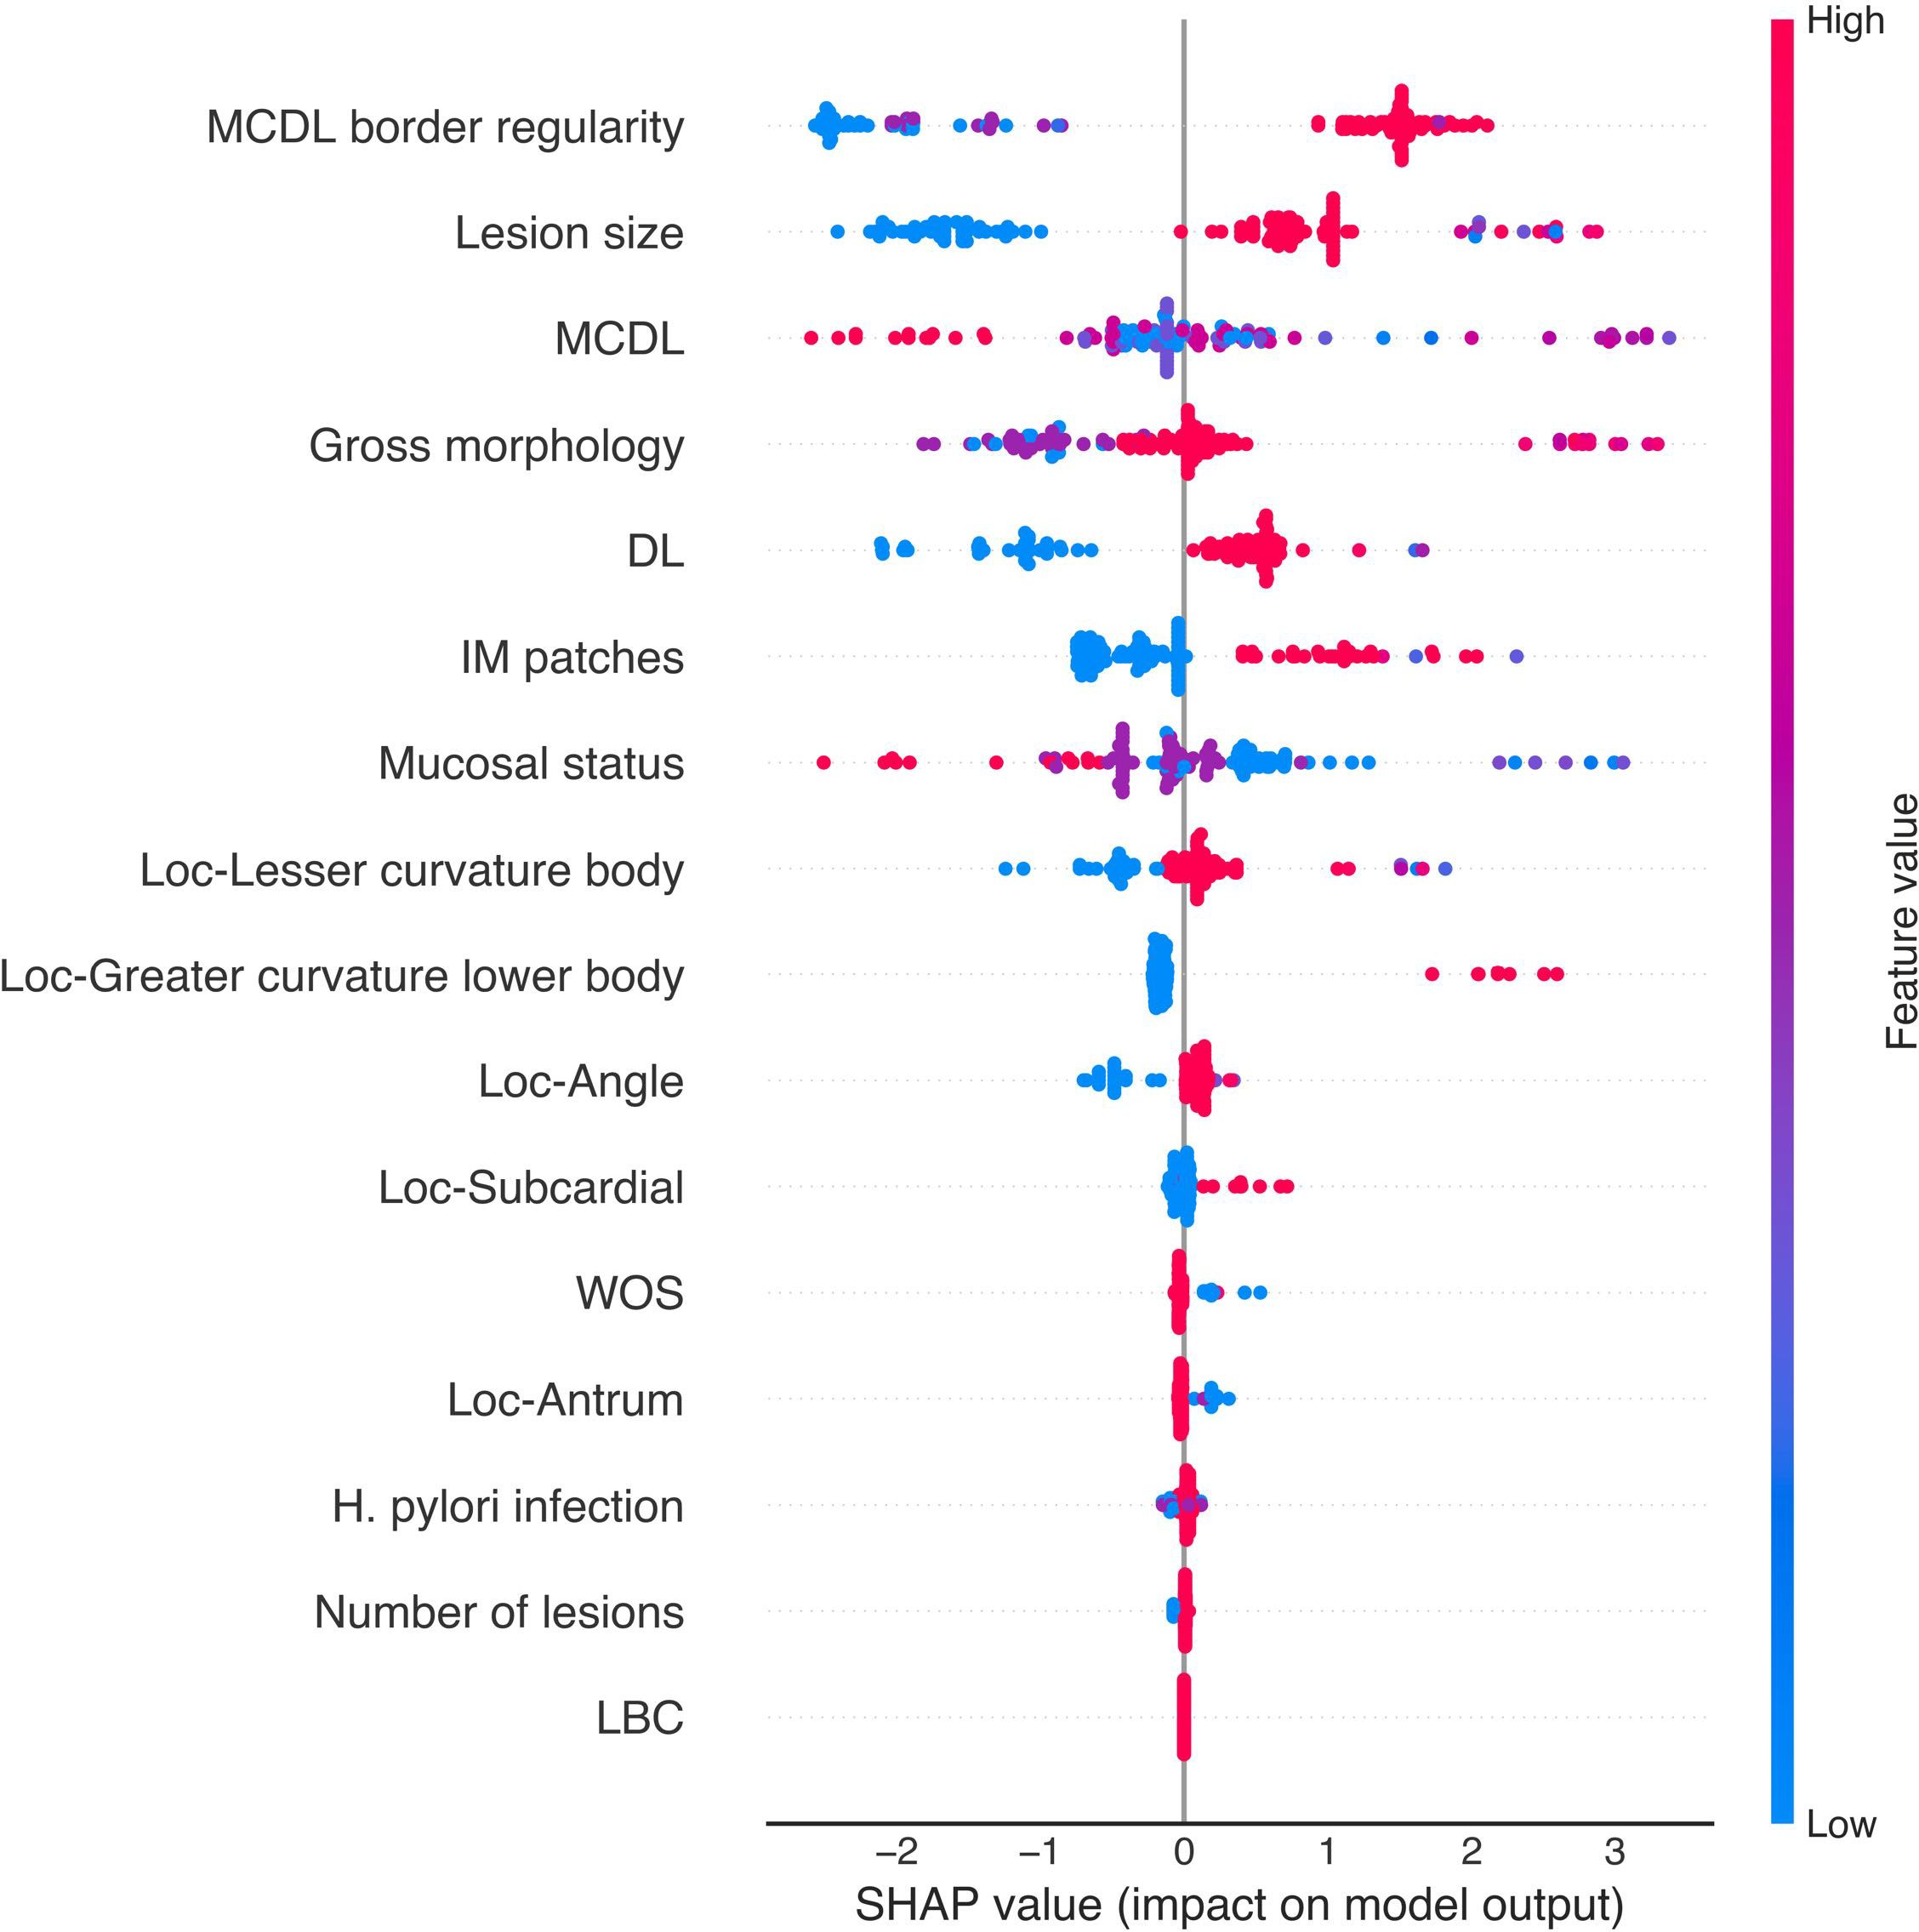
Figure 12. SHAP value scatter plot for the XGBoost OLGA staging diagnostic model.
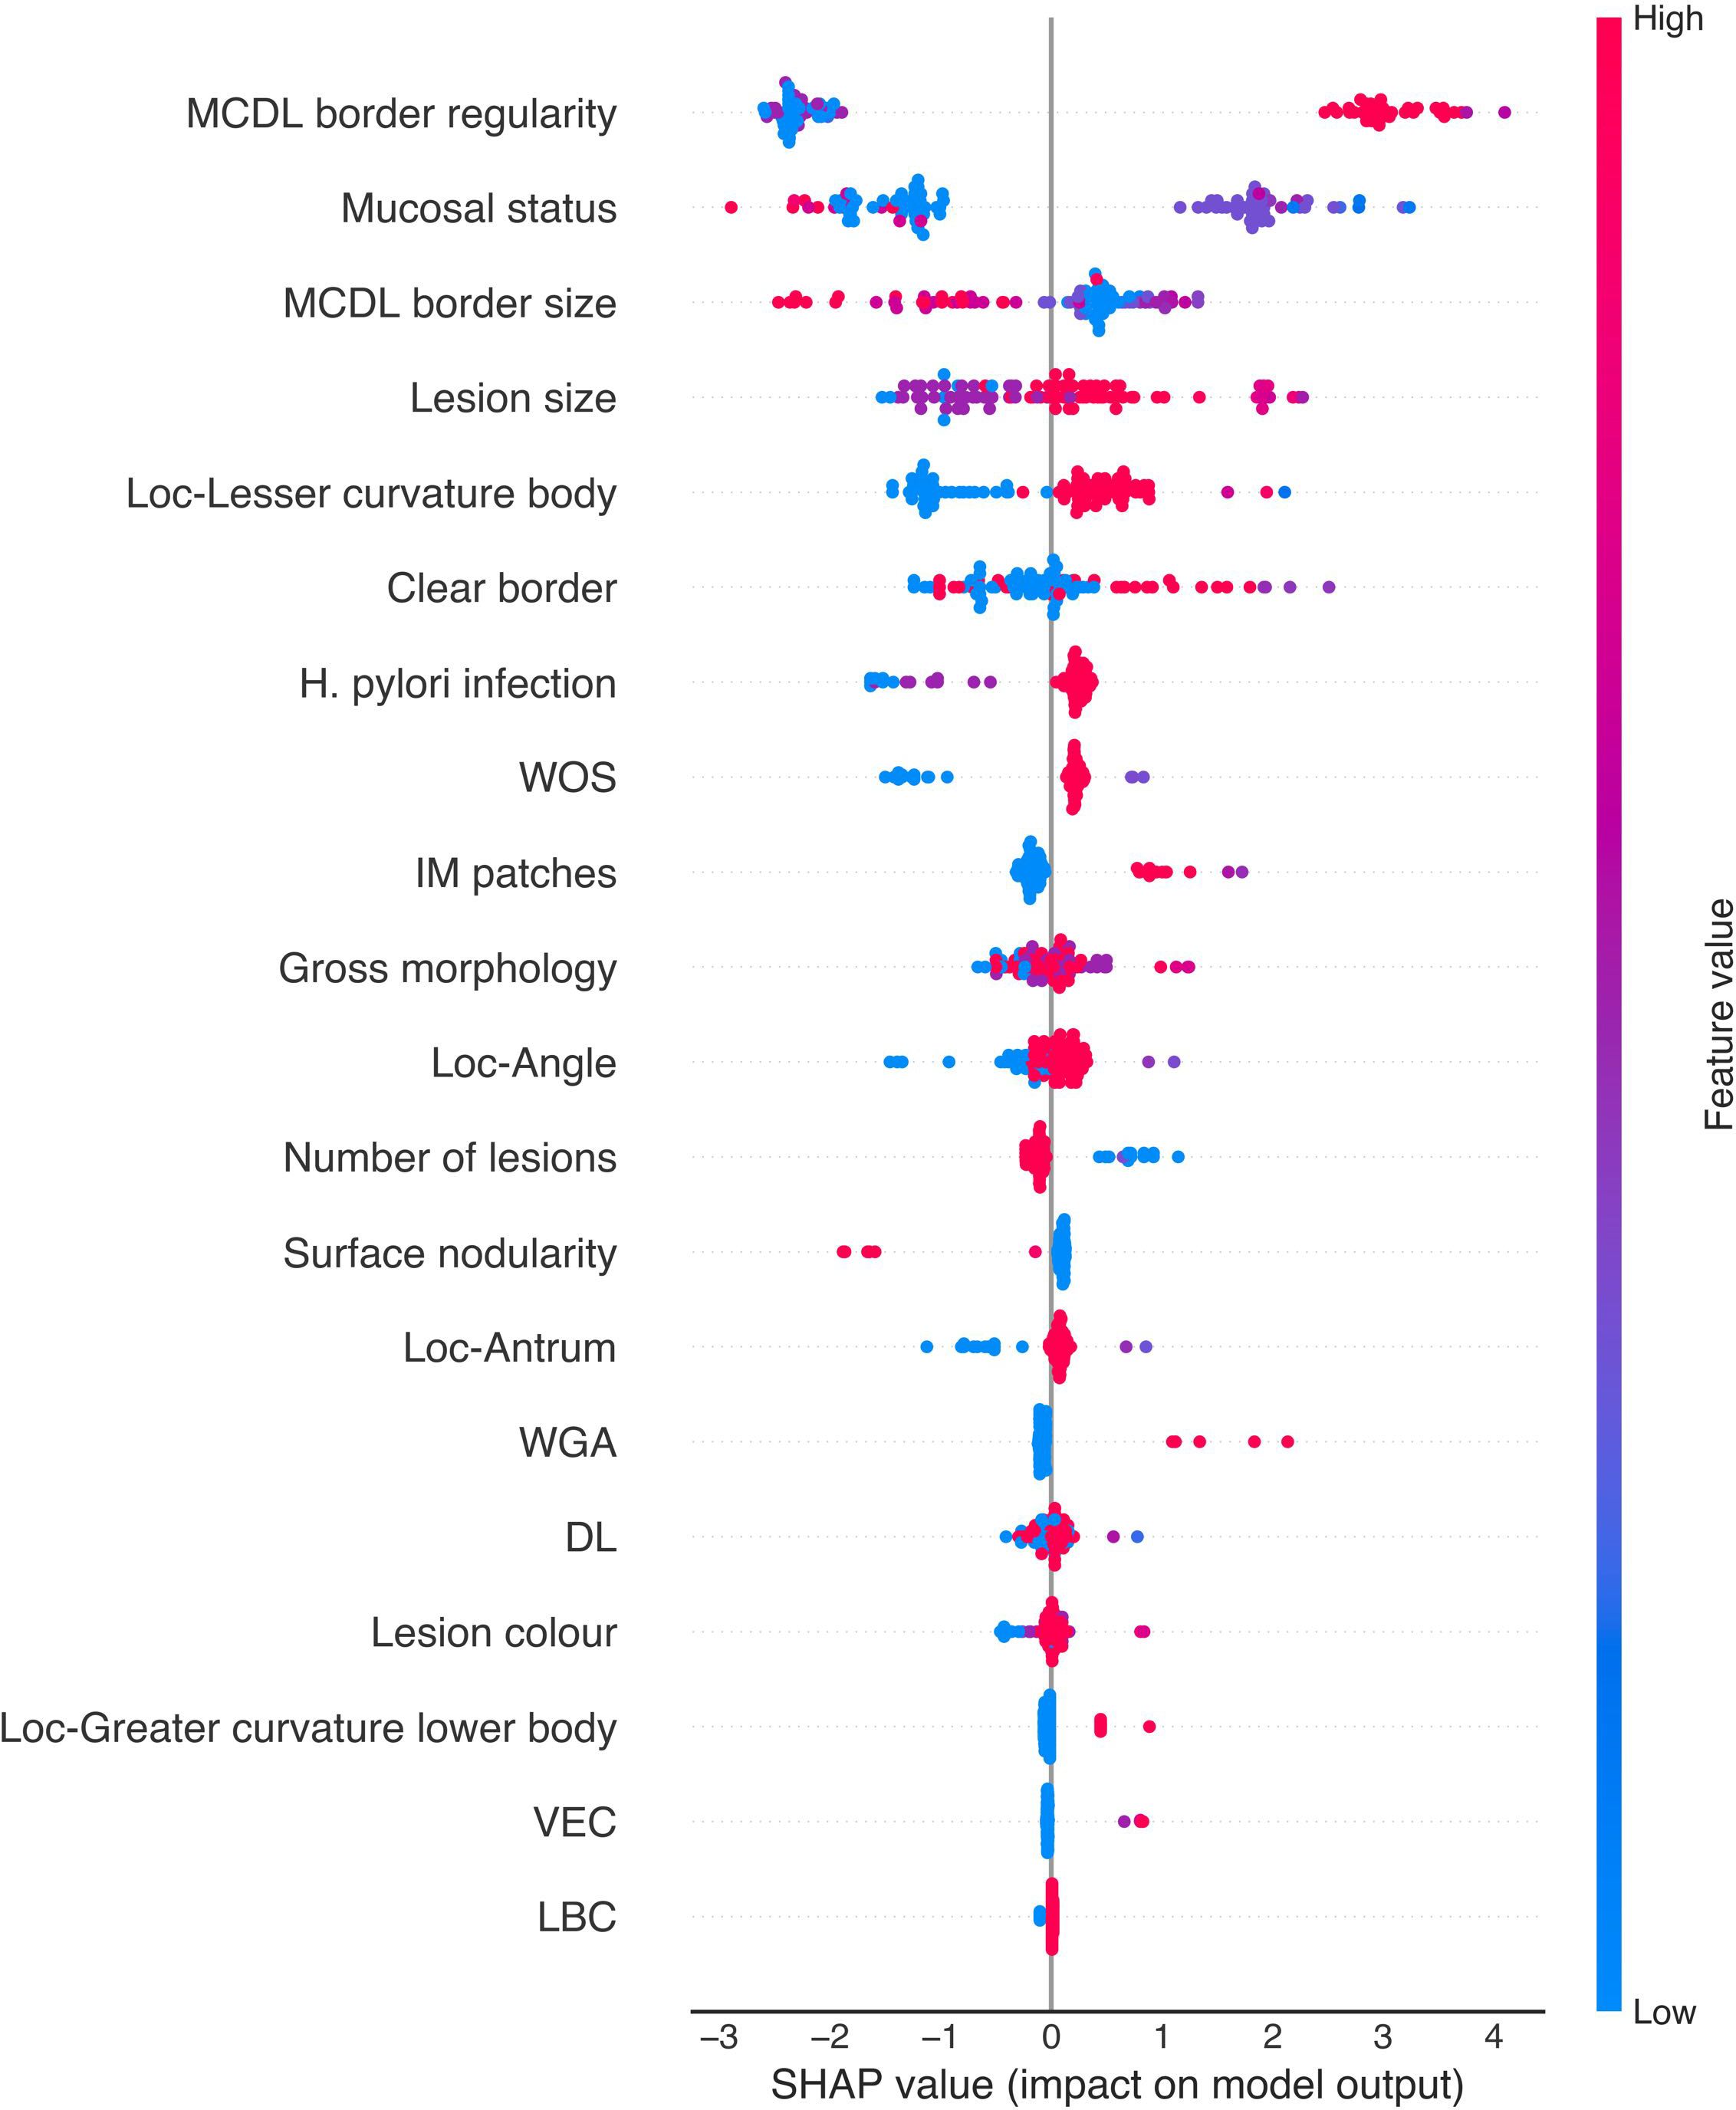
Figure 13. SHAP value scatter plot for the XGBoost OLGIM staging diagnostic model.
Chronic inflammation induced by H. pylori infection can damage cells and promote gastric carcinogenesis through abnormal immune cell activation and increased inflammatory cytokine levels, making it a representative aetiological factor for gastric cancer (27). The progression from chronic gastritis to gastric cancer follows Correa’s cascade (28), where persistent inflammation drives progression towards gastric cancer, with CAG, IM, and Dys carrying risks for malignant transformation. Therefore, early screening and risk assessment of patients with potential for gastric cancer development remains an urgent clinical challenge. The OLGA and OLGIM systems provide a basis for predicting gastric cancer risk associated with atrophic gastritis and intestinal metaplasia, guiding clinical surveillance. ME-NBI clearly visualises superficial mucosal and vascular patterns, with studies showing sensitivity of 88% and specificity of 96% in distinguishing cancerous from non-cancerous lesions (29). The combination of C-WLI and ME-NBI enhances gastric cancer detection rates, laying the foundation for “endoscopic pathology”.
In this study, we employed three models: the linear Bayesian stepwise discrimination analysis and two non-linear models (random forest and XGBoost), to construct OLGA and OLGIM staging prediction models based on C-WLI and ME-NBI endoscopic features. The comparative performance metrics of these models are summarised in Table 10.
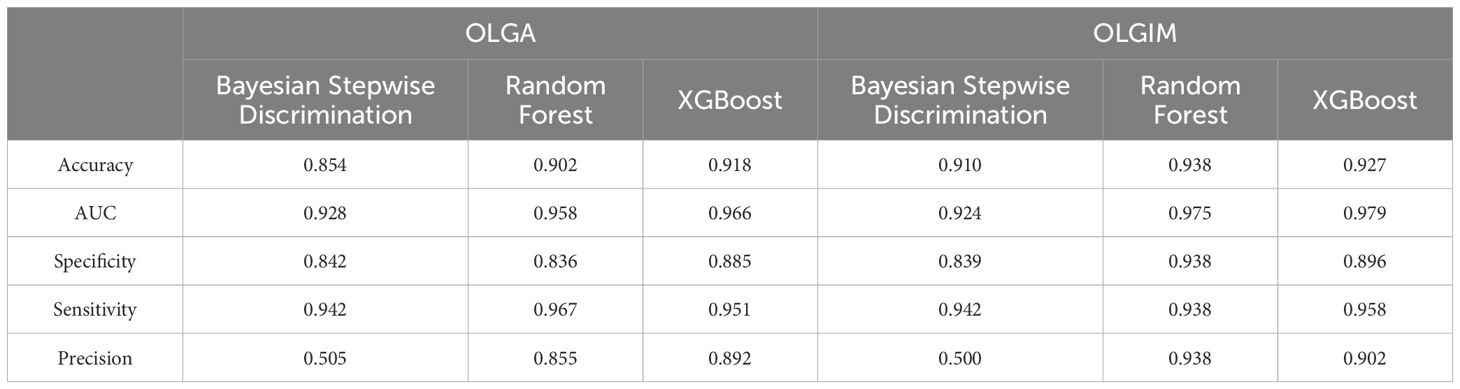
Table 10. Summary of specific performance of the three models.
In the Bayesian stepwise discrimination model, we employed stepwise variable selection to eliminate redundant variables, simplifying model structure and enhancing predictive accuracy, successfully constructing linear regression equations for OLGA and OLGIM staging (see Results section 3.5.1). This method’s advantage lies in producing intuitive linear regression equations with good interpretability. The Bayesian models demonstrated high predictive accuracy (0.854 and 0.910) and sensitivity (both 0.942) for OLGA and OLGIM staging. However, their relatively low precision (0.505 and 0.500) indicates that whilst the models effectively avoid false negatives, approximately half of low-risk patients were misclassified as high-risk, risking over-treatment. We attribute this to the complex diversity of C-WLI and ME-NBI endoscopic features and their potentially complex non-linear relationships with OLGA and OLGIM staging. Consequently, we employed random forest and XGBoost non-linear models for further analysis.
As shown in Table 10, the random forest algorithm achieved excellent results in OLGA and OLGIM staging prediction, with accuracy rates of 0.902 and 0.938, and sensitivity of 0.967 and 0.938, respectively. Precision improved significantly compared to the Bayesian model, reaching 0.855 and 0.938. These results further confirm the complex non-linear relationships between C-WLI and ME-NBI endoscopic features and OLGA/OLGIM staging. XGBoost, an emerging gradient boosting method, excels in handling complex non-linear relationships and data imbalance (30, 31). Its predictive performance for OLGA and OLGIM staging was comparable to the random forest model, achieving accuracy rates of 0.918 and 0.927, sensitivity of 0.951 and 0.958, and precision of 0.892 and 0.902, significantly outperforming the Bayesian model.
Overall, all three models demonstrated exceptionally high accuracy and sensitivity, but with notable differences in precision. Whilst all models effectively reduce the risk of missed diagnoses, random forest and XGBoost models show superior clinical utility by significantly reducing over-diagnosis risk compared to the Bayesian model. Each model offers unique advantages: Bayesian stepwise discrimination excels in model interpretability, random forest in feature selection, and XGBoost in capturing complex variable relationships. Together, these models provide reliable theoretical foundations for clinical application.
The primary clinical utility of our models resides in their application as a triage instrument during endoscopic evaluation. Whilst not designed to supplant histopathological examination for definitive OLGA/OLGIM staging, incorporation of these models into real-time endoscopic systems may assist clinicians by providing immediate risk stratification. This integration could facilitate targeted sampling of high-risk lesions, potentially enhancing diagnostic yield and procedural efficiency, whilst supporting contemporaneous clinical decision-making regarding patient management and surveillance protocols.
Our investigation encompasses several notable limitations. Principally, the single-centre nature of the study necessitates multi-centre validation to establish broader generalisability. Additionally, external validation utilising independent datasets is essential to further substantiate model robustness. Furthermore, real-time clinical evaluation is requisite to assess the practical applicability of these models during live endoscopic procedures.
Whilst the sample size (n=356) is relatively modest for complex machine learning models, particularly considering the inherent class imbalance in OLGA/OLGIM staging, it remains comparable to analogous investigations in AI-assisted endoscopic diagnosis (19, 20). We implemented SMOTE methodology to address this imbalance specifically, thereby augmenting the minority class (high-risk stages) effectively. The robust performance metrics of our models, notably the elevated sensitivity in detecting high-risk cases (exceeding 0.94 across all models), suggest that the sample size, in conjunction with SMOTE augmentation, proved sufficient for this exploratory investigation. Further validation through larger, multi-centre studies is scheduled for subsequent research.
The exclusion criteria (e.g., autoimmune gastritis, ulcers) may constrain the model’s generalisability. Whilst necessary for internal validity, these exclusions indicate that the model is primarily validated for patients without these comorbidities. Future research should evaluate the model’s performance in more diverse populations to enhance its clinical utility.
Another significant limitation warranting acknowledgement is this study’s dependence on histopathology as the reference standard for OLGA/OLGIM staging, which itself demonstrates considerable inter-observer variability. This inherent inconsistency in the reference standard introduces an element of uncertainty into our model development and validation, potentially influencing the absolute accuracy metrics. This limitation underscores the necessity for subsequent investigations to explore more objective diagnostic parameters or to quantify and address this variability explicitly in methodological approaches.
Notwithstanding these constraints, our models demonstrate considerable potential for clinical application. Integration into AI-enhanced endoscopy systems could facilitate real-time OLGA/OLGIM risk stratification, thereby augmenting gastroenterologists’ decision-making processes during procedures. However, it is imperative to emphasise that these models should serve as complementary tools rather than substitutes for clinical judgment.
Regarding clinical implementation, model selection warrants careful consideration of the balance between interpretability and performance metrics. The Bayesian model offers superior interpretability, albeit with reduced precision. Conversely, Random Forest and XGBoost algorithms deliver enhanced accuracy, with XGBoost demonstrating marginally superior performance in our investigation. Random Forest exhibits particular robustness in feature selection, whilst XGBoost demonstrates exceptional capability in processing complex datasets. Clinicians may opt for the Bayesian model when transparency is paramount, or select machine learning models when heightened accuracy is essential, contingent upon specific clinical contexts and priorities. Comprehensive validation studies remain necessary to inform optimal model selection and implementation strategies.
Risk factors for high-risk OLGA staging across the three models are shown in Table 11. Extensive gastric mucosal atrophy represents a crucial risk factor for intestinal-type gastric cancer (32). The OLGA staging system encompasses both the severity and extent of atrophy, making it suitable for evaluating atrophic gastritis (33). Kimura and Takemoto classified atrophy based on endoscopic atrophic border appearance into closed and open types. O-1 represents moderate atrophy, whilst O-2 and O-3 indicate severe atrophy; O-1 extends beyond the cardia, O-2 reaches the gastric fundus, and O-3 extends to the greater curvature of the lower gastric body (34). In our study, lesions in the subcardial region and greater curvature of the lower gastric body corresponded to moderate-severe atrophy distribution, thus being incorporated as influential factors in the high-risk OLGA diagnostic model. The severity and extent of IM similarly serve as crucial indicators for predicting gastric cancer risk. Research indicates that patients with concurrent H. pylori infection and IM face a 6.4-fold higher gastric cancer risk compared to those with H. pylori infection alone (3). Whilst IM diagnosis primarily relies on histological assessment, our study found that some patients exhibited flat or slightly elevated white patches under C-WLE (Figure 2A). ME-NBI examination of these white patches revealed characteristic LBC (Figure 2B). Given LBC’s close association with gastric cancer development and diagnosis, we incorporated intestinal metaplasia patches observed under C-WLE into the high-risk OLGA diagnostic model.
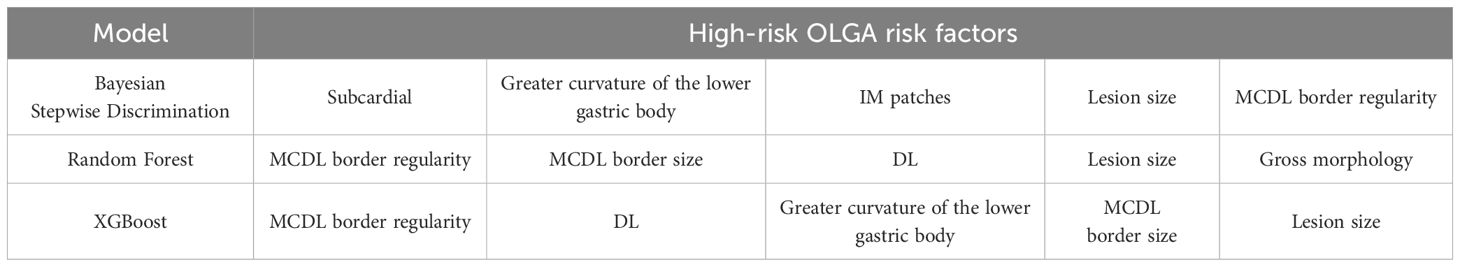
Table 11. Risk factors for high-risk OLGA.
The demarcation line (DL) manifests as a distinct boundary between lesional and non-lesional regions (35). Yao et al., in their characterisation of endoscopic features of gastric atrophy, provided detailed observations of microvascular and micro-glandular structural alterations under ME-NBI examination within the context of atrophic gastritis. These alterations culminate in the formation of demarcation lines, establishing DL as an endoscopic indicator of atrophy and thereby suggesting their intrinsic association. Multiple convex demarcation line (MCDL) represents a more refined manifestation of DL, presenting as multiple convex demarcation boundaries along the surrounding mucosal epithelial margin. Under ME-NBI examination, early gastric carcinoma exhibits distinct microvascular morphological characteristics compared to the surrounding non-neoplastic regions (typically atrophic gastritis). The microvascular alterations observed in atrophic gastritis form the fundamental basis for demarcation line formation, including MCDL. The regularity of these boundaries holds particular significance in determining the malignant potential of lesions. Studies have shown that MCDL border regularity demonstrates sensitivity, specificity, and precision (positive predictive value) of 38%, 91%, and 97%, respectively, for non-cancerous lesions (36). In our Bayesian discrimination analysis, MCDL border regularity was incorporated into the high-risk OLGA diagnostic model with a substantial variable coefficient of 5.696. This indicates that irregular MCDL borders correlate with higher malignant transformation risk, consistent with previous research findings. In random forest and XGBoost analyses, MCDL border size showed negative predictive value for gastric cancer risk. This finding aligns with previous studies suggesting MCDL border size as a predictor of non-cancerous lesions. Research proposes a threshold of two-thirds for MCDL border size in distinguishing non-cancerous from cancerous lesions, with MCDL border size ≥2/3 considered a protective factor (37), highly consistent with our findings.
Risk factors for high-risk OLGIM staging across the three models are shown in Table 12. The high-risk OLGIM diagnostic model considers lesions not only in the greater curvature of the lower gastric body but also specifically in the lesser curvature. Research indicates that IM occurring in the lesser curvature carries a higher risk of gastric cancer development (38), supporting our inclusion of lesser curvature IM as a predictive factor for high-risk OLGIM. VEC refers to characteristic vessels within epithelial circles surrounded by circular marginal crypt epithelium (Figure 2C). Studies suggest that the VEC pattern may characterise papillary adenocarcinoma, serving as an effective preoperative marker for high-grade malignancy (39). Our incorporation of VEC into the high-risk OLGIM diagnostic model confirms its value as an effective endoscopic predictor. WGA appears as small white globular structures beneath the gastric epithelium. Histopathologically, WGA represents dilated gland lumina containing eosinophilic material with necrotic epithelial fragments (40). A prospective study of WGA showed incidence rates of 21.4% and 2.5% in cancerous and non-cancerous lesions respectively (P<0.001), with accuracy, sensitivity, and specificity of 69.1%, 21.4%, and 97.5% for gastric cancer detection (41). Among our 365 patients, 14 (3.9%) exhibited WGA. In the Bayesian analysis high-risk OLGIM model equation, WGA’s coefficient of 2.888 confirms its significance as a predictive indicator.
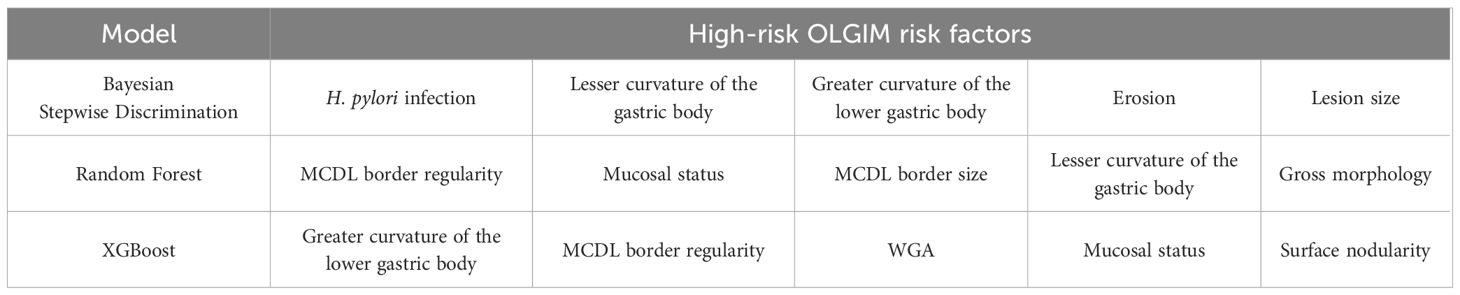
Table 12. Risk factors for high-risk OLGIM.
Our statistics show that among high-risk OLGIM patients, 96.6% exhibited past H. pylori infection status, and 76.7% showed map-like and patchy redness, typical manifestations of past H. pylori infection (21). Previous research indicates that map-like redness serves not only as an independent factor for high-risk OLGA/OLGIM staging (42) but also as an independent risk factor for gastric cancer development after H. pylori eradication (43). Based on these findings, we incorporated H. pylori infection status as a significant risk factor in the high-risk OLGIM diagnostic model.
Furthermore, to control for H. pylori infection as a potential confounder and remove its influence on the results, we included H. pylori infection status as an independent variable in all analytical models (Bayesian stepwise discrimination, Random Forest, and XGBoost). Through this methodological approach, we were able to adjust for the influence of H. pylori infection during statistical analyses, whether through calculating the independent effects of individual variables on OLGIM staging in multivariate regression models, or through capturing complex relationships and interactions among various features in machine learning models. This systematic adjustment enabled more precise evaluation of the independent associations between endoscopic features and OLGIM staging classifications.
In this study, we developed and validated diagnostic models for OLGA and OLGIM staging of precancerous gastric lesions using endoscopic features. Our findings demonstrate that machine learning approaches, particularly random forest and XGBoost algorithms, can effectively predict high-risk OLGA/OLGIM stages based on conventional white-light endoscopy and magnifying endoscopy with narrow-band imaging features. These models achieved high accuracy (>90%) and AUC values (>0.95), outperforming traditional Bayesian stepwise discrimination analysis.
Key endoscopic risk factors for high-risk OLGA/OLGIM stages included irregular multiple convex demarcation line borders, lesion size ≥1cm, and specific lesion locations such as the greater curvature of the lower gastric body. Additionally, features like white globe appearance and vessel within epithelial circle patterns emerged as significant predictors for high-risk OLGIM. The identification of these risk factors provides valuable insights into the endoscopic characteristics associated with advanced precancerous lesions.
These findings have important clinical implications, potentially enabling more accurate risk stratification of patients with precancerous gastric lesions using readily available endoscopic techniques. This could lead to more targeted surveillance strategies and earlier interventions for high-risk individuals, potentially improving the early detection and management of gastric cancer. The ability to predict OLGA/OLGIM stages based on endoscopic features may also reduce the need for extensive biopsy sampling in some cases, streamlining the diagnostic process.
However, our study has limitations that should be addressed in future research. Notably, this was a single-centre study with internal validation only. To establish the generalizability and robustness of these models, multi-centre studies with larger, diverse patient populations are needed. Additionally, prospective studies evaluating the clinical impact of implementing these models in real-world settings would be valuable.
In conclusion, our results suggest that machine learning-based analysis of endoscopic features can provide valuable diagnostic and prognostic information for precancerous gastric lesions. This approach may complement histopathological assessment and enhance risk prediction in clinical practice. By combining advanced imaging techniques with sophisticated analytical tools, we may be able to improve the accuracy and efficiency of gastric cancer risk assessment. Future research should focus on external validation, refinement of these models, and assessment of their impact on clinical outcomes to fully realize their potential in improving gastric cancer prevention and early detection strategies.
The original contributions presented in the study are included in the article/Supplementary Material. Further inquiries can be directed to the corresponding author.
The studies involving humans were approved by Ethics Committee, Dongzhimen Hospital, Beijing University of Chinese Medicine. The studies were conducted in accordance with the local legislation and institutional requirements. The ethics committee/institutional review board waived the requirement of written informed consent for participation from the participants or the participants’ legal guardians/next of kin because This is a retrospective study and does not involve clinically identifiable patient information, therefore patients are not required to sign an informed consent form.
JT: Conceptualization, Writing – original draft, Writing – review & editing. ZZ: Writing – original draft. LM: Writing – review & editing. LZ: Formal Analysis, Writing – review & editing. JW: Data curation, Investigation, Writing – review & editing. ZL: Conceptualization, Resources, Validation, Writing – review & editing.
The author(s) declare that financial support was received for the research and/or publication of this article. This study was supported by the National Natural Science Foundation of China (No. 82074187); Beijing Natural Science Foundation (No. 7232290); Clinical Research and Achievement Translation Capacity Improvement Pilot Project of Dongzhimen Hospital, Beijing University of Chinese Medicine (No. DZMG-MLZY-23009); Improvement Effect of Lactobacillus plantarum HCS03-001 on Gastric Discomfort Symptoms in Helicobacter pylori Infected Patients (No. HX-DZM-202269).
The authors declare that the research was conducted in the absence of any commercial or financial relationships that could be construed as a potential conflict of interest.
The author(s) declare that no Generative AI was used in the creation of this manuscript.
All claims expressed in this article are solely those of the authors and do not necessarily represent those of their affiliated organizations, or those of the publisher, the editors and the reviewers. Any product that may be evaluated in this article, or claim that may be made by its manufacturer, is not guaranteed or endorsed by the publisher.
The Supplementary Material for this article can be found online at: https://www.frontiersin.org/articles/10.3389/fonc.2025.1554523/full#supplementary-material
1. Thrift AP, Wenker TN, El-Serag HB. Global burden of gastric cancer: epidemiological trends, risk factors, screening and prevention. Nat Rev Clin Oncol. (2023) 20:338–49. doi: 10.1038/s41571-023-00747-0
2. Cancer IA for R on. Infection with Helicobacter pylori. In: IARC monographs on the Evaluation of Carcinogenic Risks to Humans, vol. 61. Lyon (FR) Schisto-somiasis, Liver Flukes and Helicobacter pylori (1994). p. 177–241.
3. Uemura N, Okamoto S, Yamamoto S, Matsumura N, Yamaguchi S, Yamakido M, et al. Helicobacter pylori infection and the development of gastric cancer. New Engl J Med. (2001) 345:784–9. doi: 10.1056/NEJMoa001999
4. Kuipers EJ, Peña AS, Festen HPM, Meuwissen SGM, Uyterlinde AM, Roosendaal R, et al. Long-term sequelae of Helicobacter pylori gastritis. Lancet. (1995) 345:1525–8. doi: 10.1016/S0140-6736(95)91084-0
5. Kaji K, Hashiba A, Uotani C, Yamaguchi Y, Ueno T, Ohno K, et al. Grading of atrophic gastritis is useful for risk stratification in endoscopic screening for gastric cancer. Off J Am Coll Gastroenterol | ACG. (2019) 114:71. doi: 10.1038/s41395-018-0259-5
6. Shichijo S, Hirata Y, Sakitani K, Yamamoto S, Serizawa T, Niikura R, et al. Distribution of intestinal metaplasia as a predictor of gastric cancer development. J Gastroenterol Hepatology. (2015) 30:1260–4. doi: 10.1111/jgh.2015.30.issue-8
7. Rugge M, Genta RM. Staging and grading of chronic gastritis. Hum Pathology. (2005) 36:228–33. doi: 10.1016/j.humpath.2004.12.008
8. Capelle LG, de Vries AC, Haringsma J, Ter Borg F, de Vries RA, Bruno MJ, et al. The staging of gastritis with the OLGA system by using intestinal metaplasia as an accurate alternative for atrophic gastritis. Gastrointestinal Endoscopy. (2010) 71:1150–8. doi: 10.1016/j.gie.2009.12.029
9. Yue H, Shan L, Bin L. The significance of OLGA and OLGIM staging systems in the risk assessment of gastric cancer: a systematic review and meta-analysis. Gastric Cancer. (2018) 21:579–87. doi: 10.1007/s10120-018-0812-3
10. Lee CK, Chung I, Lee S, Kim SP, Lee SH, Lee TH, et al. Is endoscopic forceps biopsy enough for a definitive diagnosis of gastric epithelial neoplasia? J Gastroenterol Hepatol. (2010) 25:1507–13. doi: 10.1111/j.1440-1746.2010.06367.x.
11. Takao M, Kakushima N, Takizawa K, Tanaka M, Yamaguchi Y, Matsubayashi H, et al. Discrepancies in histologic diagnoses of early gastric cancer between biopsy and endoscopic mucosal resection specimens. Gastric Cancer. (2012) 15:91–6. doi: 10.1007/s10120-011-0075-8
12. Lim H, Jung HY, Park YS, Na HK, Ahn JY, Choi JY, et al. Discrepancy between endoscopic forceps biopsy and endoscopic resection in gastric epithelial neoplasia. Surg Endosc. (2014) 28:1256–62. doi: 10.1007/s00464-013-3316-6
13. Kurumi H, Nonaka K, Ikebuchi Y, Yoshida A, Kawaguchi K, Yashima K, et al. Fundamentals, diagnostic capabilities, and perspective of narrow band imaging for early gastric cancer. J Clin Med. (2021) 10:2918. doi: 10.3390/jcm10132918
14. Gono K, Obi T, Yamaguchi M, Oyama N, Machida H, Sano Y, et al. Appearance of enhanced tissue features in narrow-band endoscopic imaging. JBO. (2004) 9:568–77. doi: 10.1117/1.1695563
15. Muto M, Yao K, Kaise M, Kato M, Uedo N, Yagi K, et al. Magnifying endoscopy simple diagnostic algorithm for early gastric cancer (MESDA-G). Digestive Endoscopy. (2016) 28:379–93. doi: 10.1111/den.12638
16. Inuyama M, Horiuchi Y, Yamamoto N, Yoshimizu S, Ishiyama A, Yoshio T, et al. Usefulness of magnifying endoscopy with narrow-band imaging for diagnosing mixed poorly differentiated gastric cancers. Digestion. (2021) 102:938–45. doi: 10.1159/000517970
17. Horiuchi Y, Hirasawa T, Ishizuka N, Tokura J, Ishioka M, Tokai Y, et al. Additive effect of evaluating microsurface and microvascular patterns using magnifying endoscopy with narrow-band imaging in gastric cancer: a post-hoc analysis of a single-center observational study. BMC Gastroenterol. (2022) 22:125. doi: 10.1186/s12876-022-02197-x
18. Liu L, Dong Z, Cheng J, Bu X, Qiu K, Yang C, et al. Diagnosis and segmentation effect of the ME-NBI-based deep learning model on gastric neoplasms in patients with suspected superficial lesions-a multicenter study. Front Oncol. (2023) 12:1075578. doi: 10.3389/fonc.2022.1075578
19. Hu H, Gong L, Dong D, Zhu L, Wang M, He J, et al. Identifying early gastric cancer under magnifying narrow-band images with deep learning: a multicenter study. Gastrointest Endosc. (2021) 93:1333–41. doi: 10.1016/j.gie.2020.11.014
20. Ueyama H, Kato Y, Akazawa Y, Yatagai N, Komori H, Takeda T, et al. Application of artificial intelligence using a convolutional neural network for diagnosis of early gastric cancer based on magnifying endoscopy with narrow-band imaging. J Gastroenterol Hepatol. (2021) 36:482–9. doi: 10.1111/jgh.15190
21. Kato M, Inoue K, Murakami K, Kamada T. Kyoto classification of gastritis. Tokyo, Japan: Nihon Medical Center. (2017).
22. Pimentel-Nunes P, Libânio D, Marcos-Pinto R, Areia M, Leja M, Esposito G, et al. Management of epithelial precancerous conditions and lesions in the stomach (MAPS II): European Society of Gastrointestinal Endoscopy (ESGE), European Helicobacter and Microbiota Study Group (EHMSG), European Society of Pathology (ESP), and Sociedade Portuguesa de Endoscopia Digestiva (SPED) guideline update 2019. Endoscopy. (2019) 51:365–88. doi: 10.1055/a-0859-1883
23. Fang J, Du Y, Liu W, Xiao Y, Chen W, Ren J. Chinese guidelines for the diagnosis and treatment of chronic gastritis (2022, shanghai). Chin J Gastroenterology. (2023) 28:149–80. doi: 10.3969/j.issn.1008-7125.2023.03.004
24. Murtagh F, Heck A. Multivariate data analysis Vol. 131. Dordrecht (Holland): Springer Science & Business Media (2012).
25. O’brien RM. A caution regarding rules of thumb for variance inflation factors. Qual Quant. (2007) 41:673–90. doi: 10.1007/s11135-006-9018-6
26. Horiuchi Y, Aoyama K, Tokai Y, Hirasawa T, Yoshimizu S, Ishiyama A, et al. Convolutional neural network for differentiating gastric cancer from gastritis using magnified endoscopy with narrow band imaging. Dig Dis Sci. (2020) 65:1355–63. doi: 10.1007/s10620-019-05862-6
27. Lim NR, Chung WC. Helicobacter pylori-associated chronic atrophic gastritis and progression of gastric carcinogenesis. Korean J Gastroenterology. (2023) 82:171–9. doi: 10.4166/kjg.2023.097
28. Correa P. Human gastric carcinogenesis: A multistep and multifactorial process—First american cancer society award lecture on cancer epidemiology and prevention. Cancer Res. (1992) 52:6735–40.
29. Zhou F, Wu L, Huang M, Jin Q, Qin Y, Chen J. The accuracy of magnifying narrow band imaging (ME-NBI) in distinguishing between cancerous and noncancerous gastric lesions: A meta-analysis. Medicine. (2018) 97:e9780. doi: 10.1097/MD.0000000000009780
30. Chen T, Guestrin C. XGBoost: A scalable tree boosting system. In: Proceedings of the 22nd ACM SIGKDD International Conference on Knowledge Discovery and Data Mining. ACM, San Francisco California USA (2016). p. 785–94. doi: 10.1145/2939672.2939785
31. Ogunleye A, Wang QG. XGBoost model for chronic kidney disease diagnosis. IEEE/ACM Trans Comput Biol Bioinf. (2019) 17:2131–40. doi: 10.1109/TCBB.8857
32. Isajevs S, Liepniece-Karele I, Janciauskas D, Moisejevs G, Putnins V, Funka K, et al. Gastritis staging: interobserver agreement by applying OLGA and OLGIM systems. Virchows Arch. (2014) 464:403–7. doi: 10.1007/s00428-014-1544-3
33. Rugge M, Pennelli G, Pilozzi E, Fassan M, Ingravallo G, Russo VM, et al. Gastritis: The histology report. Digestive Liver Disease. (2011) 43:S373–84. doi: 10.1016/S1590-8658(11)60593-8
34. Kishino M, Nakamura S, Shiratori K. Clinical and endoscopic features of undifferentiated gastric cancer in patients with severe atrophic gastritis. Internal Med. (2016) 55:857–62. doi: 10.2169/internalmedicine.55.4841
35. Yao K, Matsui T, Iwashita A. Clinical application of magnification endoscopy with NBI for diagnosis of early gastric cancer. Nihon Shokakibyo Gakkai Zasshi. (2007) 104:782–9. doi: 10.11405/nisshoshi.104.782
36. Doyama H, Nakanishi H, Yao K. Image-enhanced endoscopy and its corresponding histopathology in the stomach. Gut Liver. (2020) 15:329. doi: 10.5009/gnl19392
37. Kanesaka T, Uedo N, Yao K, Ezoe Y, Doyama H, Oda I, et al. Multiple convex demarcation line for prediction of benign depressed gastric lesions in magnifying narrow-band imaging. Endosc Int Open. (2018) 06:E145–55. doi: 10.1055/s-0043-121267
38. Kato I, Tominaga S, Ito Y, Kobayashi S, Yoshii Y, Matsuura A, et al. A prospective study of atrophic gastritis and stomach cancer risk. Japanese J Cancer Research : Gann. (1992) 83:1137. doi: 10.1111/j.1349-7006.1992.tb02736.x
39. Kanemitsu T, Yao K, Nagahama T, Fujiwara S, Takaki Y, Ono Y, et al. The vessels within epithelial circle (VEC) pattern as visualized by magnifying endoscopy with narrow-band imaging (ME-NBI) is a useful marker for the diagnosis of papillary adenocarcinoma: a case-controlled study. Gastric Cancer. (2014) 17:469–77. doi: 10.1007/s10120-013-0295-1
40. Doyama H, Yoshida N, Tsuyama S, Ota R, Takeda Y, Nakanishi H, et al. The “white globe appearance” (WGA): a novel marker for a correct diagnosis of early gastric cancer by magnifying endoscopy with narrow-band imaging (M-NBI). Endosc Int Open. (2015) 03:E120–4. doi: 10.1055/s-0034-1391026
41. Yoshida N, Doyama H, Nakanishi H, Tsuji K, Tominaga K, Matsunaga K, et al. White globe appearance is a novel specific endoscopic marker for gastric cancer: A prospective study. Digestive Endoscopy. (2016) 28:59–66. doi: 10.1111/den.v28.issue-1
42. Zhang Z, Chen Y, Cao Y, Ye W, Zhang X, Chen J, et al. A study of the correlation between map-like redness and the risk of gastric precancerous lesions. Chin J Clin. (2022) 50:1168–72. doi: 10.3969/j.issn.2095-8552.2020.10.010
Keywords: precancerous gastric lesions, prediction model, Bayesian, random forest, XGBoost
Citation: Tao J, Zhang Z, Meng L, Zhang L, Wang J and Li Z (2025) Risk prediction model for precancerous gastric lesions based on magnifying endoscopy combined with narrow-band imaging features. Front. Oncol. 15:1554523. doi: 10.3389/fonc.2025.1554523
Received: 02 January 2025; Accepted: 13 March 2025;
Published: 04 April 2025.
Edited by:
Endrit Shahini, National Institute of Gastroenterology S. de Bellis Research Hospital (IRCCS), ItalyReviewed by:
Ricky Indra Alfaray, Airlangga University, IndonesiaCopyright © 2025 Tao, Zhang, Meng, Zhang, Wang and Li. This is an open-access article distributed under the terms of the Creative Commons Attribution License (CC BY). The use, distribution or reproduction in other forums is permitted, provided the original author(s) and the copyright owner(s) are credited and that the original publication in this journal is cited, in accordance with accepted academic practice. No use, distribution or reproduction is permitted which does not comply with these terms.
*Correspondence: Zhihong Li, bHpoaHNtQDEyNi5jb20=
†These authors have contributed equally to this work
Disclaimer: All claims expressed in this article are solely those of the authors and do not necessarily represent those of their affiliated organizations, or those of the publisher, the editors and the reviewers. Any product that may be evaluated in this article or claim that may be made by its manufacturer is not guaranteed or endorsed by the publisher.
Research integrity at Frontiers
Learn more about the work of our research integrity team to safeguard the quality of each article we publish.