 Lu Li1†
 Xinhua Ye
 Yong Li
- 1Department of Ultrasound, The First Affiliated Hospital, Nanjing Medical University, Nanjing, China
- 2Institute of Food Safety and Nutrition, Jiangsu Academy of Agricultural Sciences, Nanjing, China
- 3Department of Radiology, The First Affiliated Hospital, Nanjing Medical University, Nanjing, China
Introduction: Diagnosing the types of malignant lymphoma could help determine the most suitable treatment, anticipate the probability of recurrence and guide long-term monitoring and follow-up care.
Methods: We evaluated the differences in benign, lymphoma and metastasis superficial lymph nodes using ultrasonography and tissue metabolomics.
Results: Our findings indicated that three ultrasonographic features, blood supply pattern, cortical echo, and cortex elasticity, hold potential in differentiating malignant lymph nodes from benign ones, and the shape and corticomedullary boundary emerged as significant indicators for distinguishing between metastatic and lymphoma groups. Metabolomics revealed the difference in metabolic profiles among lymph nodes. We observed significant increases in many amino acids, organic acids, lipids, and nucleosides in both lymphoma and metastasis groups, compared to the benign group. Specifically, the lymphoma group exhibited higher levels of nucleotides (inosine monophosphate and adenosine diphosphate) as well as glutamic acid, and the metastasis group was characterized by higher levels of carbohydrates, acylcarnitines, glycerophospholipids, and uric acid. Linear discriminant analysis coupled with these metabolites could be used for differentiating lymph nodes, achieving recognition rates ranging from 87.4% to 89.3%, outperforming ultrasonography (63.1% to 75.4%).
Discussion: Our findings could contribute to a better understanding of malignant lymph node development and provide novel targets for therapeutic interventions.
1 Introduction
Lymphadenopathy can result from a myriad of causes, encompassing infections, autoimmune diseases, neoplasms, hematological disorders, and more (1). Malignant lymph nodes include metastases and lymphoma (2). Diagnosing the specific type of malignant lymphoma could help determine the most appropriate treatment, anticipate the probability of recurrence and guide long-term monitoring and follow-up care (3). Various imaging techniques have been employed for the diagnosis of malignant lymph nodes, including computed tomography (CT), magnetic resonance imaging (MRI), positron emission tomography-computed tomography (PET-CT), and ultrasonography (US). Among these imaging techniques, ultrasonography stands out due to cost-effectiveness, operational ease, and ability to provide high-resolution information (4). Ultrasonography utilizes morphological criteria to discern benign from malignant lymph nodes (5–7). Malignancies often manifest as lymph nodes that exhibit enlarged size, heterogeneous internal structure, an absence of echogenic hilum, compromised capsule integrity, and a peripheral vascular pattern (6). However, certain malignant lymph nodes with typical morphology could be easily misdiagnosed in ultrasonographic examinations (8). Moreover, in cases of lymph node enlargement, it can be challenging to distinguish reactive hyperplasia from metastatic occurrences (9). Therefore, there is an urgent need to deeply understand the difference in the ultrasound characteristics of malignant lymph nodes with various pathological categories.
Metabolomics encompasses the high-throughput identification and quantification of small molecule metabolites, which are the end products of metabolism, in biological samples (10). Metabolomics has been utilized in human medicine and clinical research. In contrast to traditional imaging techniques, metabolomics is emerging as a powerful tool for comprehending disease mechanisms, discovering biomarkers, and advancing personalized medicine (11, 12). For instance, Schmidt et al. (13) demonstrated that acylcarnitine C18:1, citrulline, trans-4-hydroxyproline and three glycerophospholipids in blood may have associations with prostate cancer (13). Wang et al. (14) found that patients with Parkinson’s disease exhibited elevated levels of 3-methoxytyramine, N-acetyl-L-tyrosine, orotic acid, uric acid, vanillic acid, and xanthine in their urine (14). Shao et al. (29) found the higher levels of metabolic intermediates and the enrichment of genes involved in the tricarboxylic acid (TCA) cycle in prostate cancer tissues (15). However, reports remain limited concerning alterations in metabolic profiling of superficial lymph nodes across different pathologies.
In this study, benign, lymphoma, and metastatic lymph nodes were analyzed using ultrasonography and LC-QTOF/MS-based tissue metabolomics. Statistical analysis was applied to identify variations in ultrasound features and metabolites among the lymph node groups. The main objective of this study was I) to investigate the difference in metabolic and ultrasound characteristics among superficial lymph nodes with different pathological types and II) to compare the diagnostic efficiency of the two methods for discriminating superficial lymph nodes. Our findings could contribute to a better understanding of malignant lymph node development and offer potential biomarkers for diagnosing malignant lymph nodes.
2 Materials and methods
2.1 Patients and sampling
A total of 78 patients with superficial lymph node enlargement were enrolled at the first affiliated hospital of Nanjing medical university from February 2021 to June 2022. All patients underwent ultrasonography of lymph nodes. If the cause of lymphadenopathy could not be diagnosed, the patient would undergo an ultrasound-guided needle biopsy. The criteria for inclusion were patients assessed by the sonographer and clinician requiring ultrasound-guided needle biopsy. The exclusion criteria included: I) contraindications for a core needle biopsy, such as uncontrolled acute infection and apparent tendency to develop activity; II) incomplete pathological results (Routine pathological diagnosis was incomplete and immunohistochemical results were lacking); and III) borderline diseases, such as Castleman disease.
Lymph node tissue was biopsied with a 16G needle under ultrasound guidance and four specimens of tissue were obtained. Three specimens were used for pathological examination, and one was stored in a -80°C for metabolomic analysis. According to inclusion and exclusion criteria, 69 patients were up to the standard, and these samples were subjected to metabolomic analysis. According to immunohistochemical pathology, the lymph nodes were divided into benign (N=20), lymphoma (N=29), and metastasis (N=20) groups.
The ethics committee of the first affiliated hospital of Nanjing medical university has approved this study. The ethics committee of the First Affiliated Hospital of Nanjing Medical University has approved this study. Prior to participation, all patients signed an informed consent form, and investigators securely protected and analyzed all data.
2.2 Ultrasound features
Ultrasound examination and ultrasound-guided core needle biopsy were respectively performed by two doctors with ten years of experience in ultrasound diagnosis and interventional. Conventional ultrasound images were obtained by Philips Epiq 5 (L12-5, 5–12 MHz) and Super Sonic Imagine Aixplorer-1 (SL15-4, 4–15 MHz), and ultrasound-guided core needle biopsy using GE Logiq E9 (9L, 3–10 MHz). Ultrasound characteristics for each lymph nodes were collected: long diameter, short diameter, shape, vascular pattern, hilum, cortical thickness, cortical echo, cortex elasticity, corticomedullary boundary, ratio of short to long, calcification, elasticity, Adler grade of blood flow were recorded. The assignment of variables was shown in Table 1. The elastography was assessed using ChoiJJ’s 4-point method: 1 point for all lymph nodes being green or bluish, 2 points for scattered blue areas comprising less than 45% proportion, 3 points for blue areas larger than 45%, and 4 points for the blue area occupying the entire lymph node with or without a green border. Furthermore, 1~2, 3 and 4 points is soft, medium and hard, respectively.
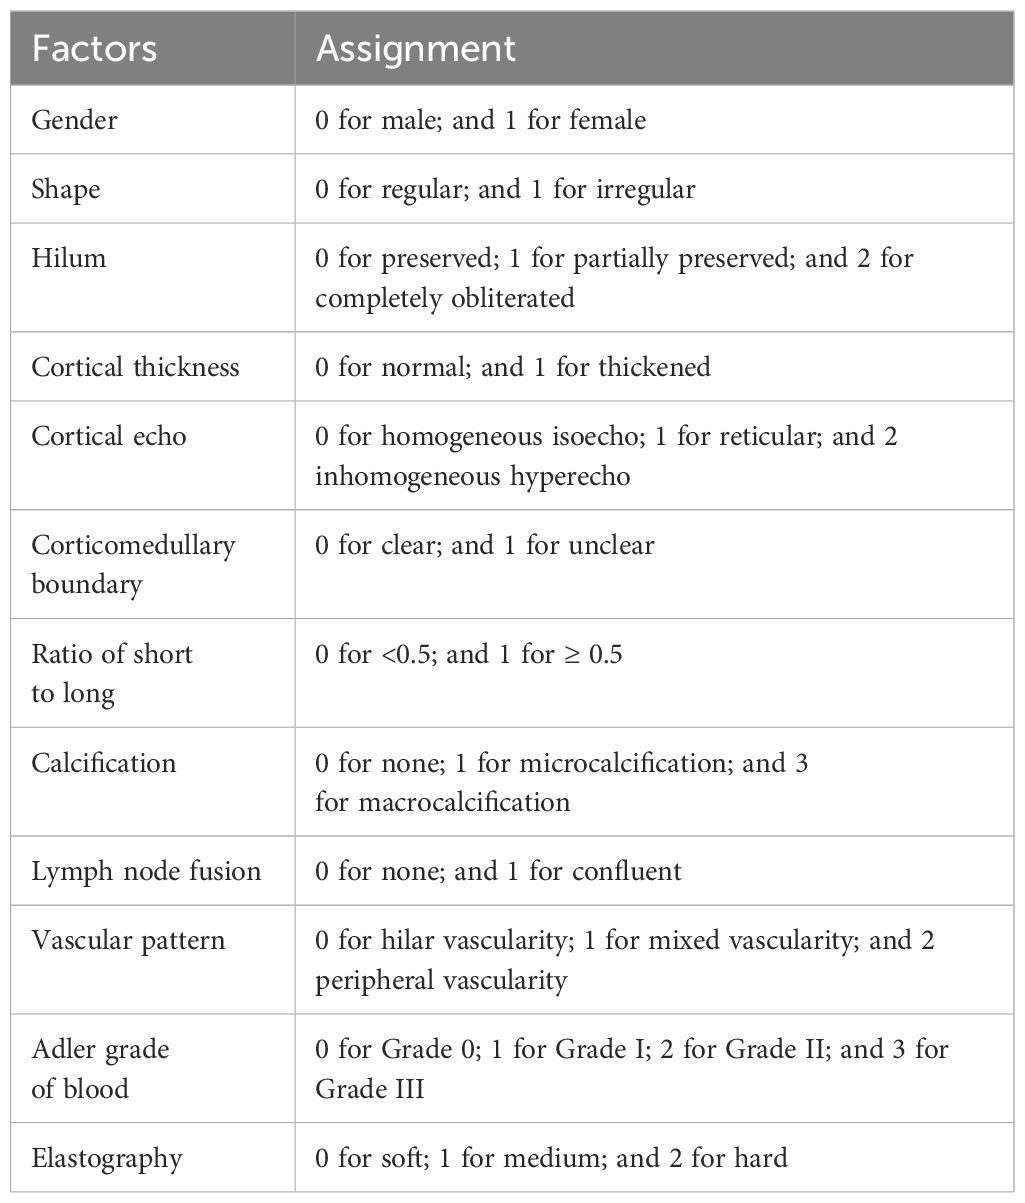
Table 1. Information on the variable assignment.
2.3 Metabolomic analysis
Each lymph node sample was extracted with 2-mL 80% methanol solution, rotated for 10 min and centrifuged at 8000×g for 20 min. The supernatant was filtered through a 0.22-µm membrane filter and analyzed using LC-QTOF/MS (TripleTOF 5600+, AB SCIEX). The MS instrument was equipped with an electrospray ionization source and each sample was detected by the mass spectrometry under positive and negative ionization modes. The full-scan mode (50-1000 m/z) based on information-dependent acquisition mode was applied. Mobile phase A in the positive and negative ionization modes were 0.1% formic acid/water and 5mM ammonium acetate, respectively and the mobile phase B in both two modes was acetonitrile. The gradient elution process of mobile phase B was at 1% (v/v) for 0-3 min, 1%-99% (v/v) for 3-21 min, 99% (v/v) for 21- 28 min, and 1% (v/v) for 28-34 min. The ion spray voltage and collision energy were 5500 V and 35 V, respectively, in the positive ionization mode and were −4500 V and -35 V, respectively, in the negative ionization mode. The nebulizer, curtain gas, and heater flow pressures were set to 50, 25, and 50 psi, respectively. Besides, a quality control (QC) sample was prepared by mixing each lymph node sample in equal volume (10 μL) was detected every 6 samples under the above condition.
The open source software MS-DIAL was used to analyze mass spectrometry data. The MS peaks were qualitatively analyzed by comparing the similarity of the first- and second-order mass spectrometry, and retention time in publicly available databases (including MassBank, GNPS, MetaboBASE, and LipidBlast) and some of them were further confirmed with standard chemicals (Supplementary Table S1). Principal component analysis (PCA) was used to analyze the differences of metabolic profiling among three groups. The PLS-DA model with VIP greater than 1 and t-test with P-value less than 0.05 were used to screen the metabolites with significant changes. The identified metabolites with significant change was applied for metabolic pathway analysis using by a web-based tool MetaboAnalysts based on the database Kyoto Encyclopedia of Genes and Genomes. Pearson’s correlation analysis analyzed the correlation of identified metabolites with ultrasound features and patient’s age and gender, with a significance level set at P < 0.05.
2.4 Discriminant model
Linear discriminant analysis was applied in conjunction with ultrasonography or tissue metabolomics to differentiate benign, lymphoma, and metastasis lymph nodes. For metabolomics, a random forest analysis was conducted to measure variable importance of metabolites for distinguishing the superficial lymph nodes. Within each group, 90% and 10% of samples were randomly allocated to training and prediction sets, respectively, utilizing the Monte Carlo cross-validation method. For mitigating the error from one single calculation, Monte Carlo simulation was run 100 times and the average diagnostic rate of each groups was calculated.
3 Results
3.1 Diagnostic efficacy of ultrasonographic features
For each superficial lymph nodes, the information of ultrasound sonographic characteristics and patients’ age and gender were collected. The result of t-test analysis revealed that there were significant differences in these indices between three groups. Three indices, age, vascular pattern and cortical echo, were significantly varied between lymphoma and benign groups (P < 0.05) (Figure 1). Nine indices, age, width, shape, vascular pattern, hilum, cortical echo, cortex elasticity, corticomedullary boundary and short long diameter were significantly changed between metastasis and benign groups (P < 0.05) (Figure 1). There were significant differences in six indices between lymphoma and metastasis groups, including age, cortex elasticity, shape, cortical echo, hilum and corticomedullary boundary (P < 0.05).
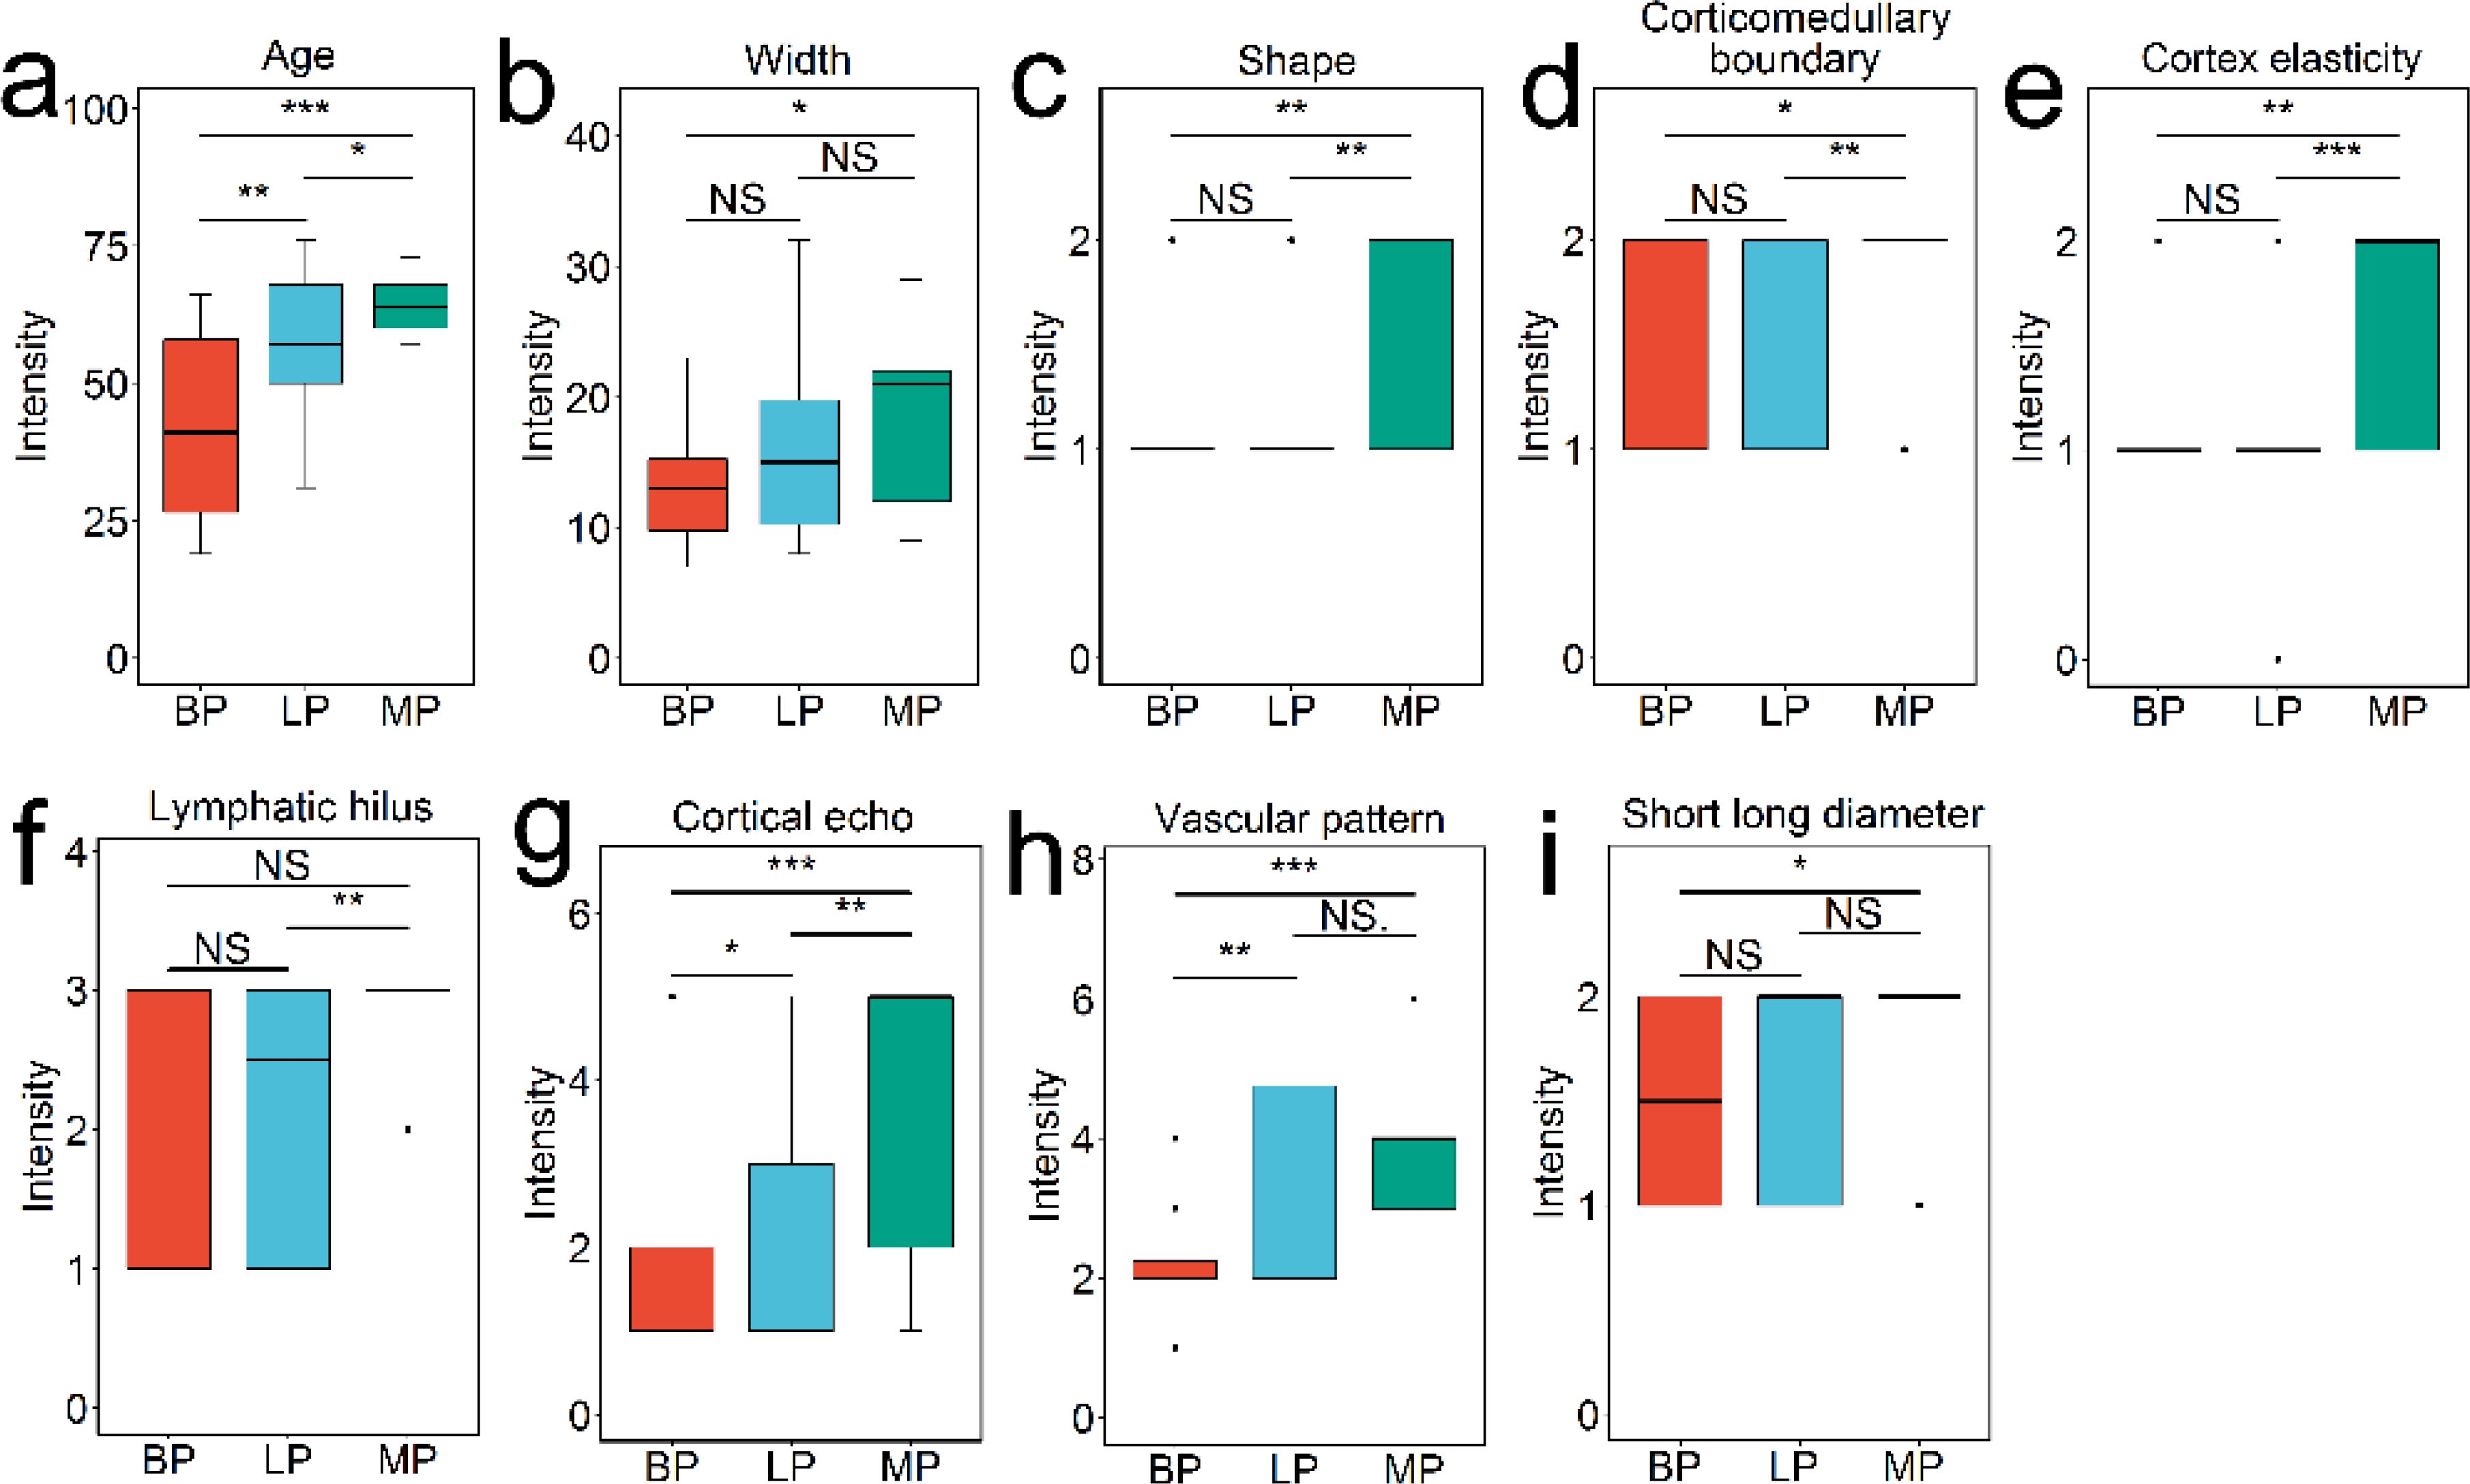
Figure 1. Patient and ultrasonography indices with significant difference among benign, lymphoma, and metastasis groups, analyzed using Student’s t-test. The features include age (A), width (B), shape (C), corticomedullary boundary (D), cortex elasticity (E), hilus (F), cortical echo (G), vascular pattern (H), and short long diameter (I). NS indicates no significance (P > 0.05); * indicates P < 0.05; ** indicates P < 0.01; *** indicates P < 0.001.
3.2 Metabolic profiling analysis
We conducted metabolic profiling of lymph node samples using LC-QTOF/MS analysis. The total ion chromatograms of a lymph node sample are shown in Supplementary Figures S1, S2. MS-DIAL software was utilized to analyze the data, resulting in the detection of 6754 peaks from the positive mode and 3474 peaks from the negative mode. Principal component analysis (PCA) was performed, showing that the first two principal components explained 46.07% of the total variance (Figure 2A). The PCA plot based on these components clearly displayed differences in the metabolic profiles among the three groups of lymph nodes (Figure 2A). Using PLS-DA with a VIP value > 1 and t-test with a P-value < 0.05, we identified a total of 174 metabolites with significant changes. These metabolites primarily belonged to categories such as amino acids, organic acids, nucleosides, lipids, sugars, and amines (Figure 2B; Supplementary Table S1). Notably, lipids were found to be the most abundant metabolites, including fatty acids, lysophospholipids (lysophosphatidylcholine (LPC) lysophosphatidylethanolamine (LPE), lysophosphatidylinositol (LPI), and lysophosphatidylglycerols (LPG)), glycerophospholipids (phosphatidylcholine (PC), phosphatidylethanolamine (PE), phosphatidylinositol (PI) and phosphatidylglycerol (PG)) and acylcarnitine (CAR). The heatmap plot of these metabolites with significant change was shown in Figure 3.
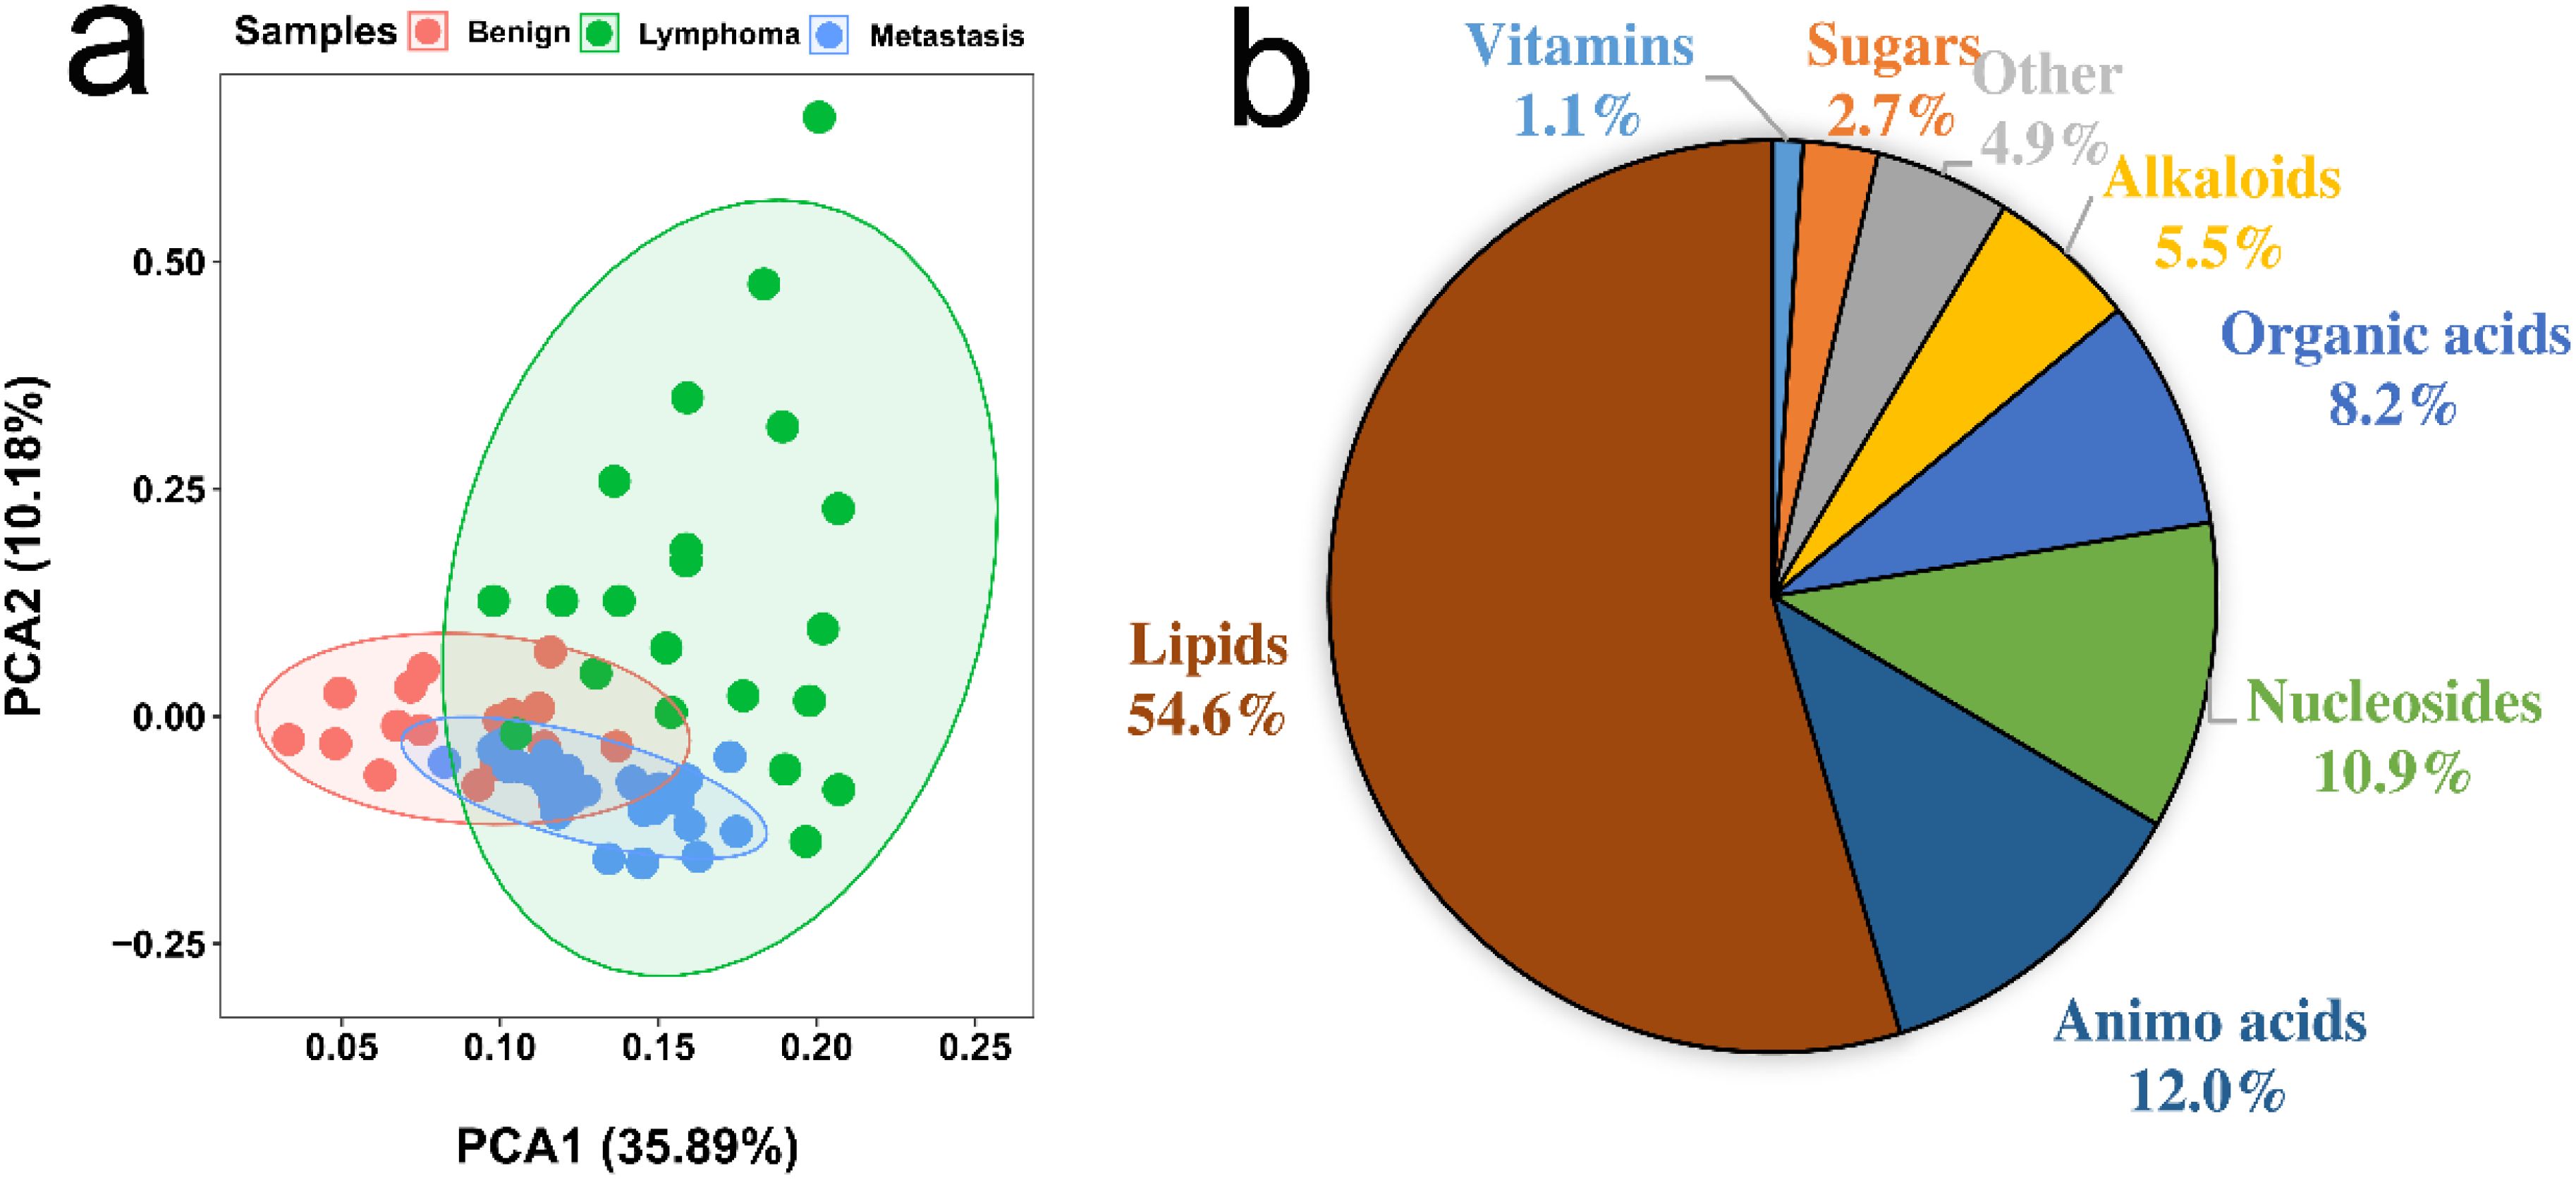
Figure 2. (A) PCA analysis of metabolic profiling of benign, lymphoma, and metastasis lymph nodes. (B) Proportion of identified metabolites that showed significant changes, determined by Student’s t-test (P < 0.05) and PLS-DA (VIP > 1).
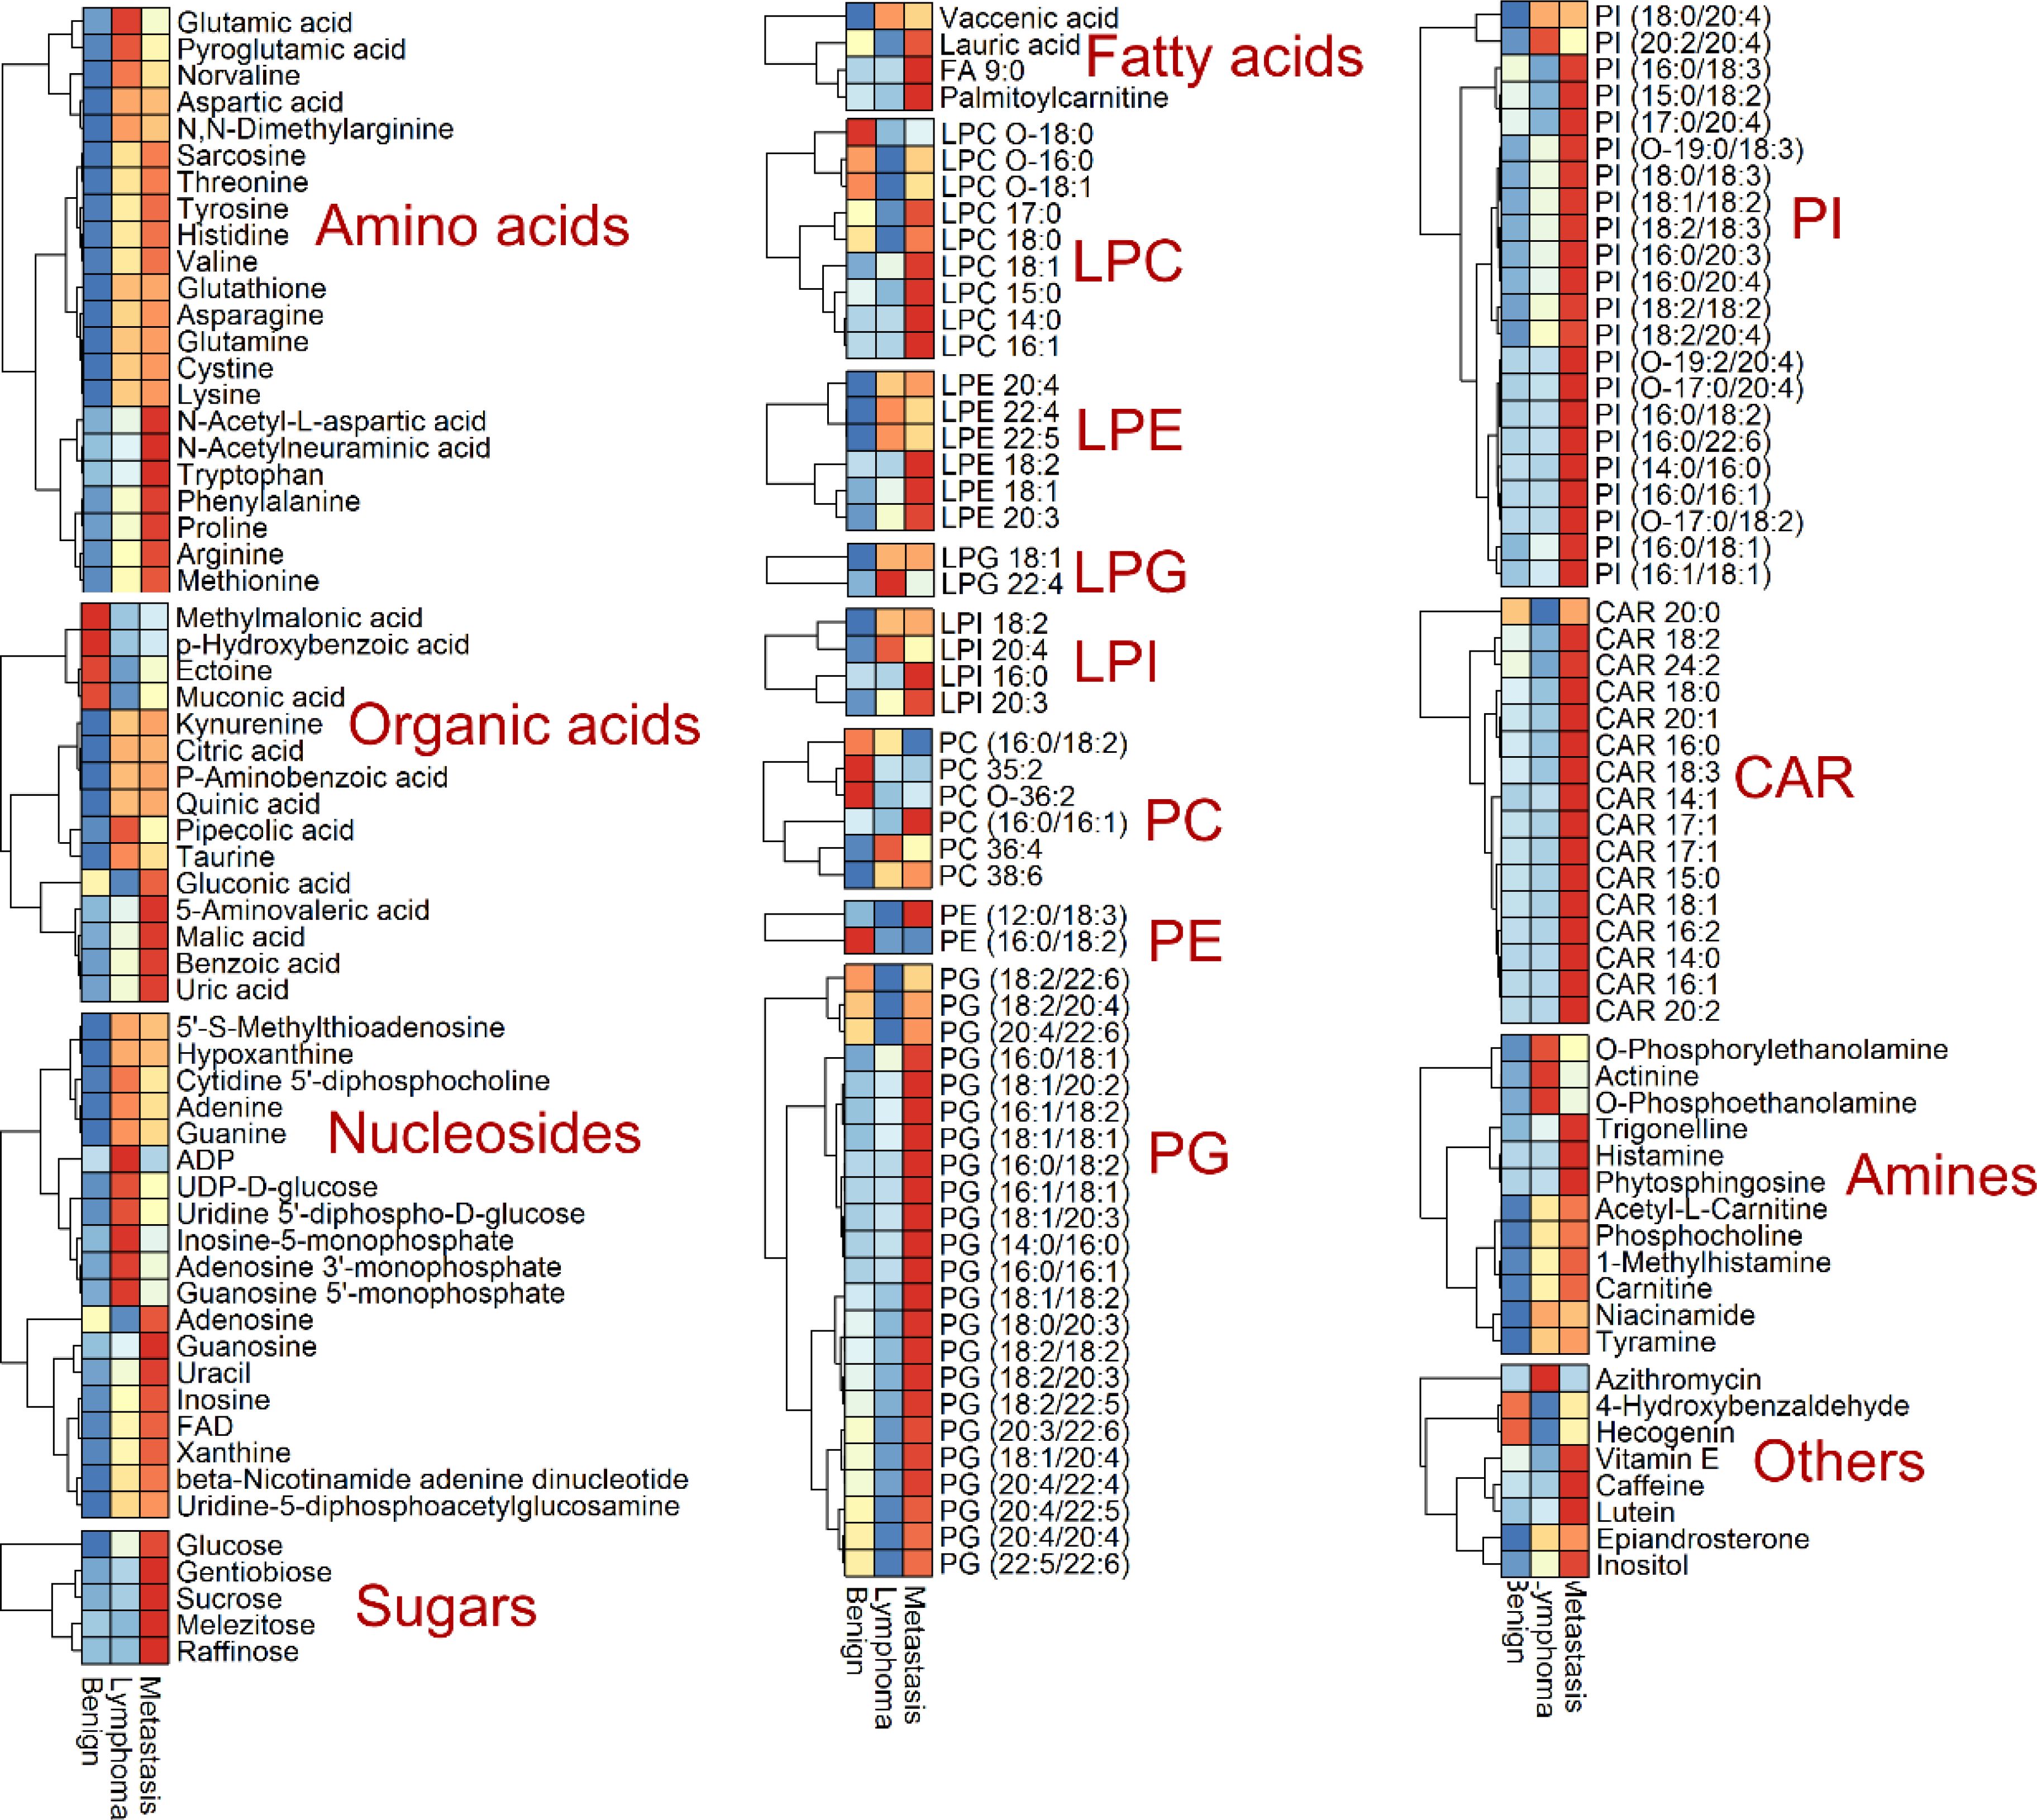
Figure 3. Heatmap analysis of identified metabolites with significant change, including amino acids, organic acids, nucleosides, sugars, lipids (fatty acids, lysophosphatidylcholine (LPC) lysophosphatidylethanolamine (LPE), lysophosphatidylinositol (LPI), lysophosphatidylglycerols (LPG), phosphatidylcholine (PC), phosphatidylethanolamine (PE), phosphatidylinositol (PI) and phosphatidylglycerol (PG) and acylcarnitine (CAR)), amines and others.
3.3 Differential metabolite analysis
In the lymphoma versus benign group, 66 metabolites were significantly upregulated, mainly amino acids, nucleosides and amines (Figure 4A). Phosphocholine, guanosine monophosphate, cytidine diphosphocholine, adenosine monophosphate and inosine monophosphate increased the most, with fold changes greater than 3.0. A total of 17 metabolites were significantly decreased, and CAR 20:0, LPC O-18:0, methylmalonic acid, LPC O-16:0, PE (16:0/18:2), LPC O-18:1, and CAR 18:0 had the largest decrease at 0.246~0.448 times.
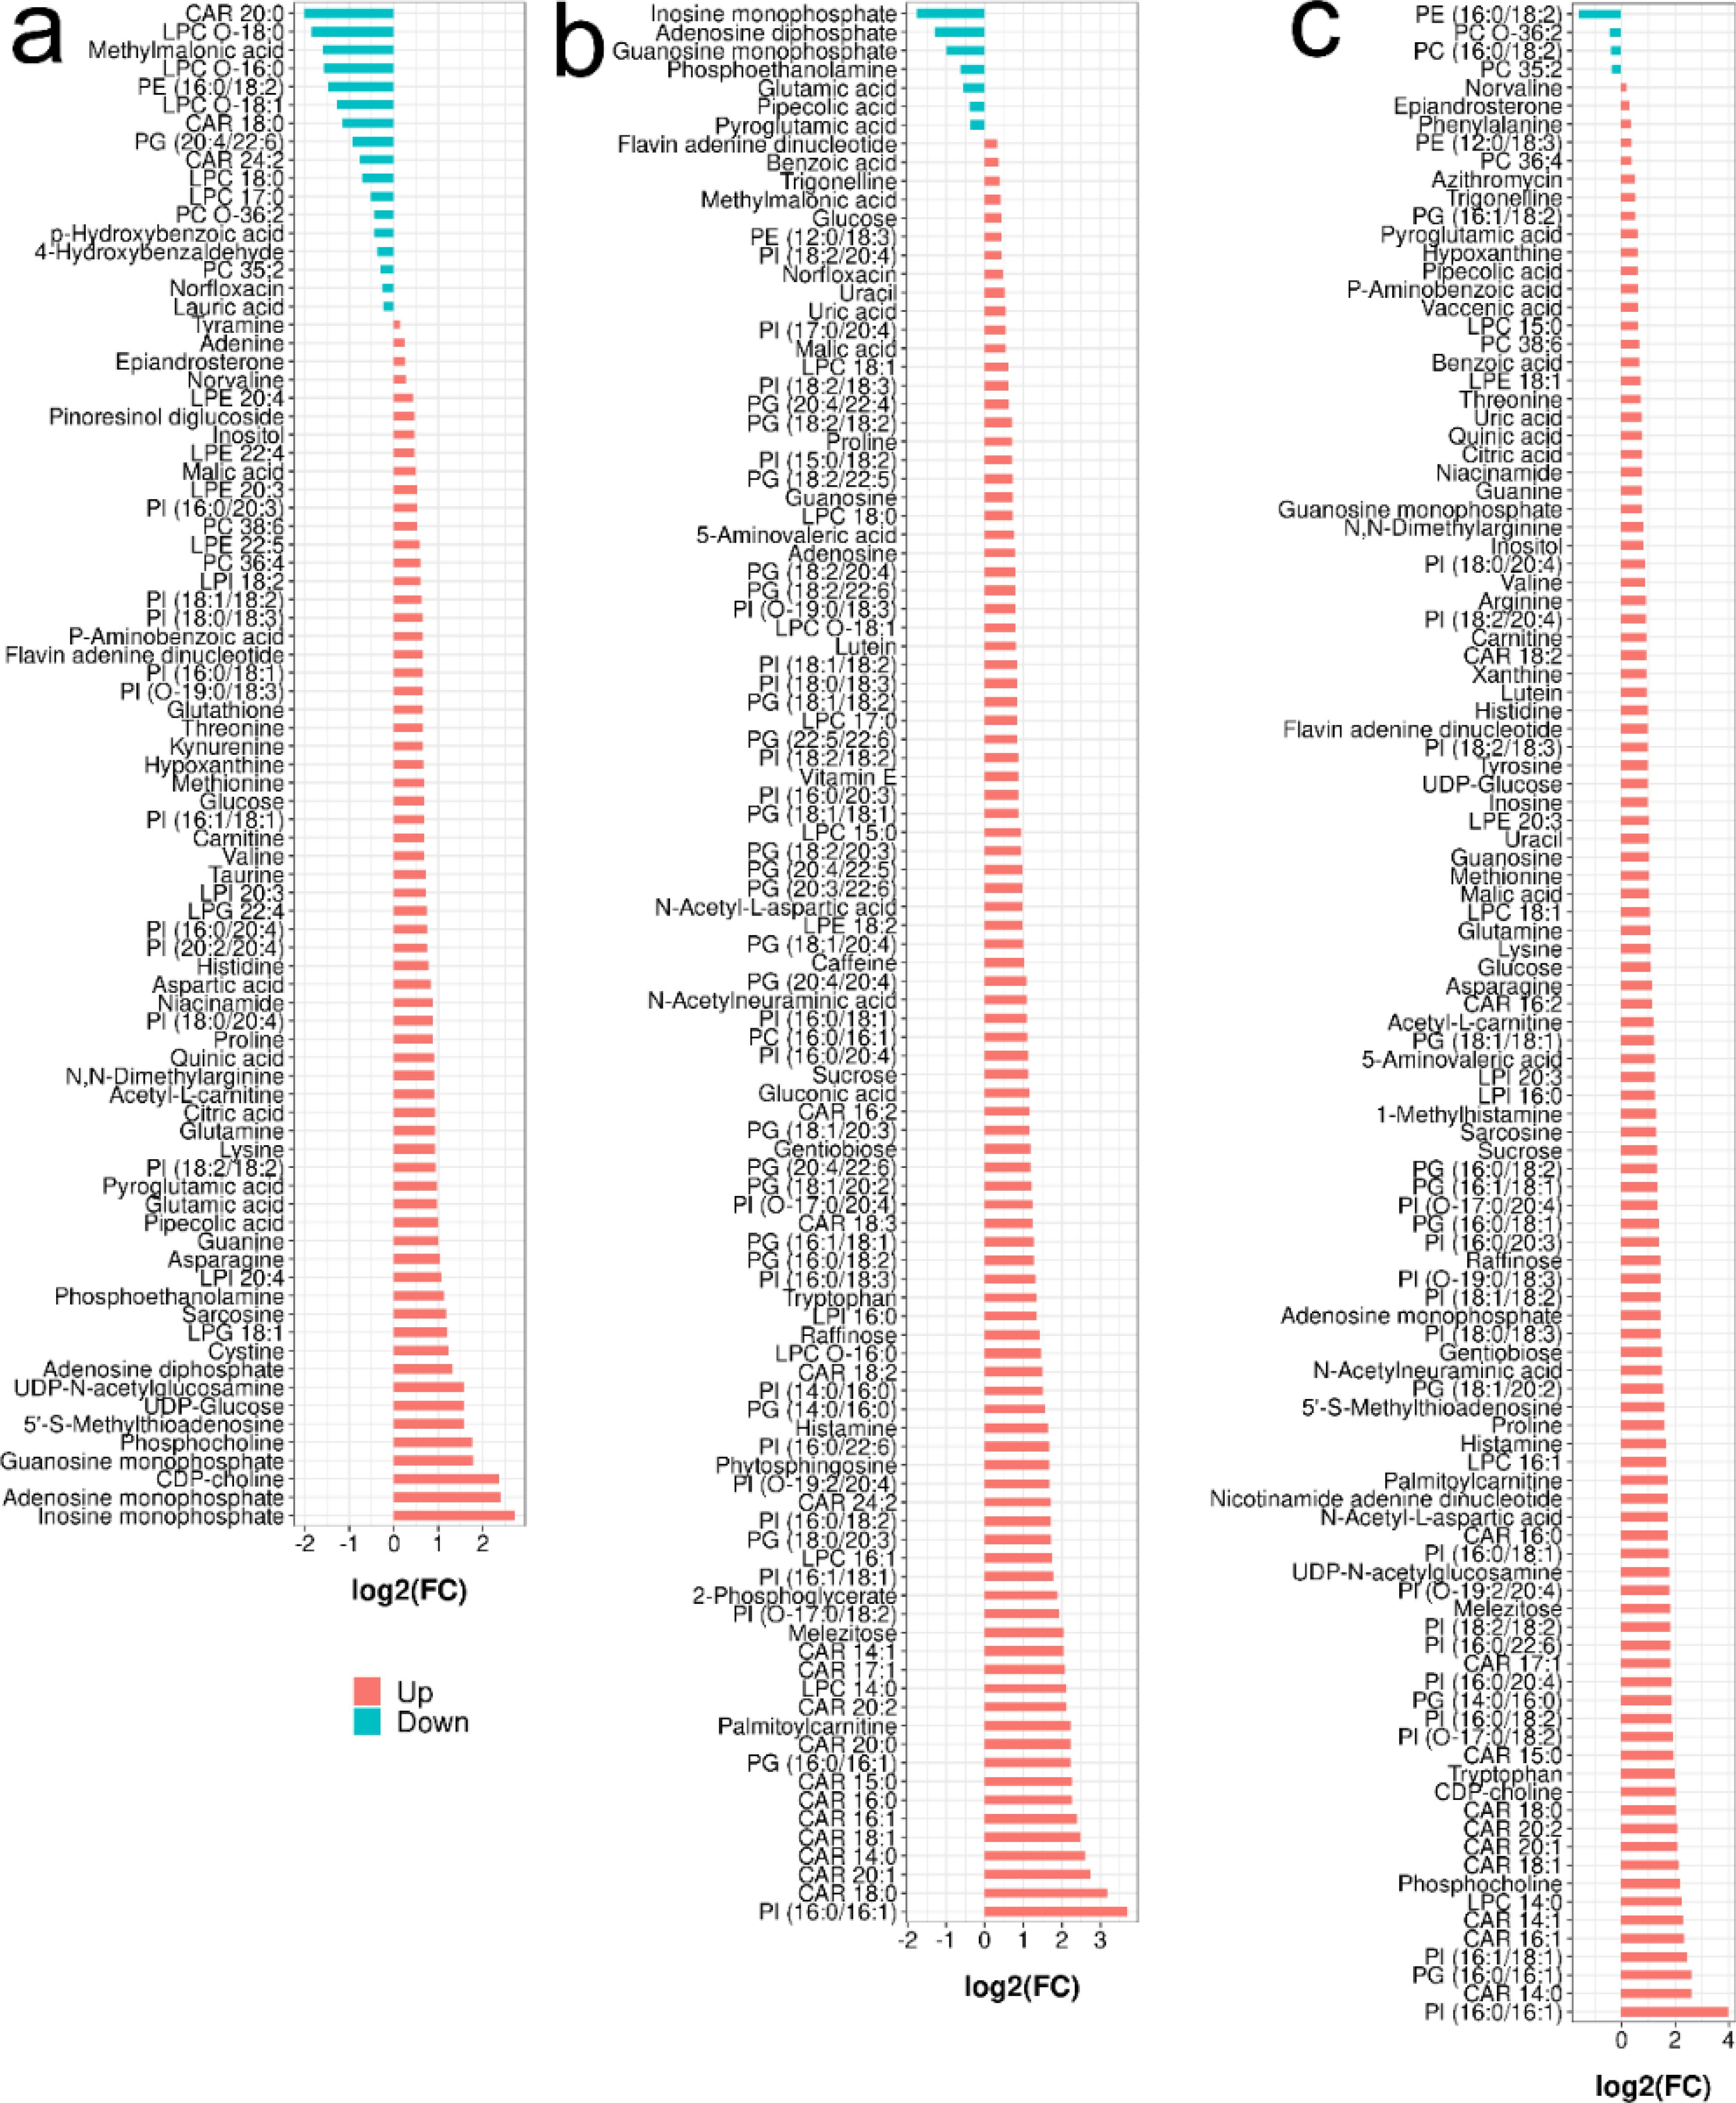
Figure 4. Barplot analysis of the identified metabolites with significant change in different comparison (Student’s t-test with P < 0.05, PLS-DA with VIP > 1): (A) for lymphoma versus benign, (B) for metastasis versus lymphoma and (C) for metastasis versus benign.
When comparing metastasis and lymphoma groups, 96 metabolites were significantly decreased, mainly including lipids and sugars (Figure 4B). Palmitoylcarnitine, CAR 16:0, CAR 20:0, CAR 15:0, CAR 16:1, CAR 18:1, CAR 14:0, CAR 20:1, CAR 18:0, PI (16:0/16:1) increased the most, by more than 5.0 times. Nine metabolites were significantly downregulated, mainly including inosine monophosphate, actinine, glutamic acid, phosphoethanolamine and pipecolic acid (ranging from 0.208- and 0.734-fold).
In metastasis versus benign groups, 102 metabolites were significantly upregulated, mainly including amino acids, nucleosides, sugars and lipids (Figure 4C). PI (16:0/16:1) had the largest increase at 17.35-fold, followed by CAR 14:0, PI (16:1/18:1), PG (16:0/16:1), CAR 16:1, CAR 14:1, LPC 14:0, phosphocholine, CAR 18:1, CAR 20:1, CAR 18:0, CAR 20:2 and tryptophan; only 4 metabolites were significantly downregulated.
3.4 Metabolic pathways analysis
Based on MetaboAnalyst and metabolites with significant changes, the enriched metabolic pathways in lymphoma versus benign, metastasis versus lymphoma, and metastasis versus benign groups are showed in Figures 5A–C, respectively. The metabolic pathways, including alanine, aspartate and glutamate metabolism, arginine and proline metabolism, histidine metabolism, glycerophospholipid metabolism, were commonly enriched in all comparisons. Besides, D-glutamine and D-glutamate metabolism, valine, leucine and isoleucine degradation, citrate cycle, phosphatidylinositol signaling system, glutathione metabolism, and glyoxylate and dicarboxylate metabolism were additionally enriched in benign versus lymphoma groups. Phenylalanine, tyrosine and tryptophan biosynthesis, ascorbate and aldarate metabolism and pyrimidine metabolism were additionally enriched in benign versus metastasis groups. Starch and sucrose metabolism and galactose metabolism were additionally enriched in lymphoma versus metastasis groups.
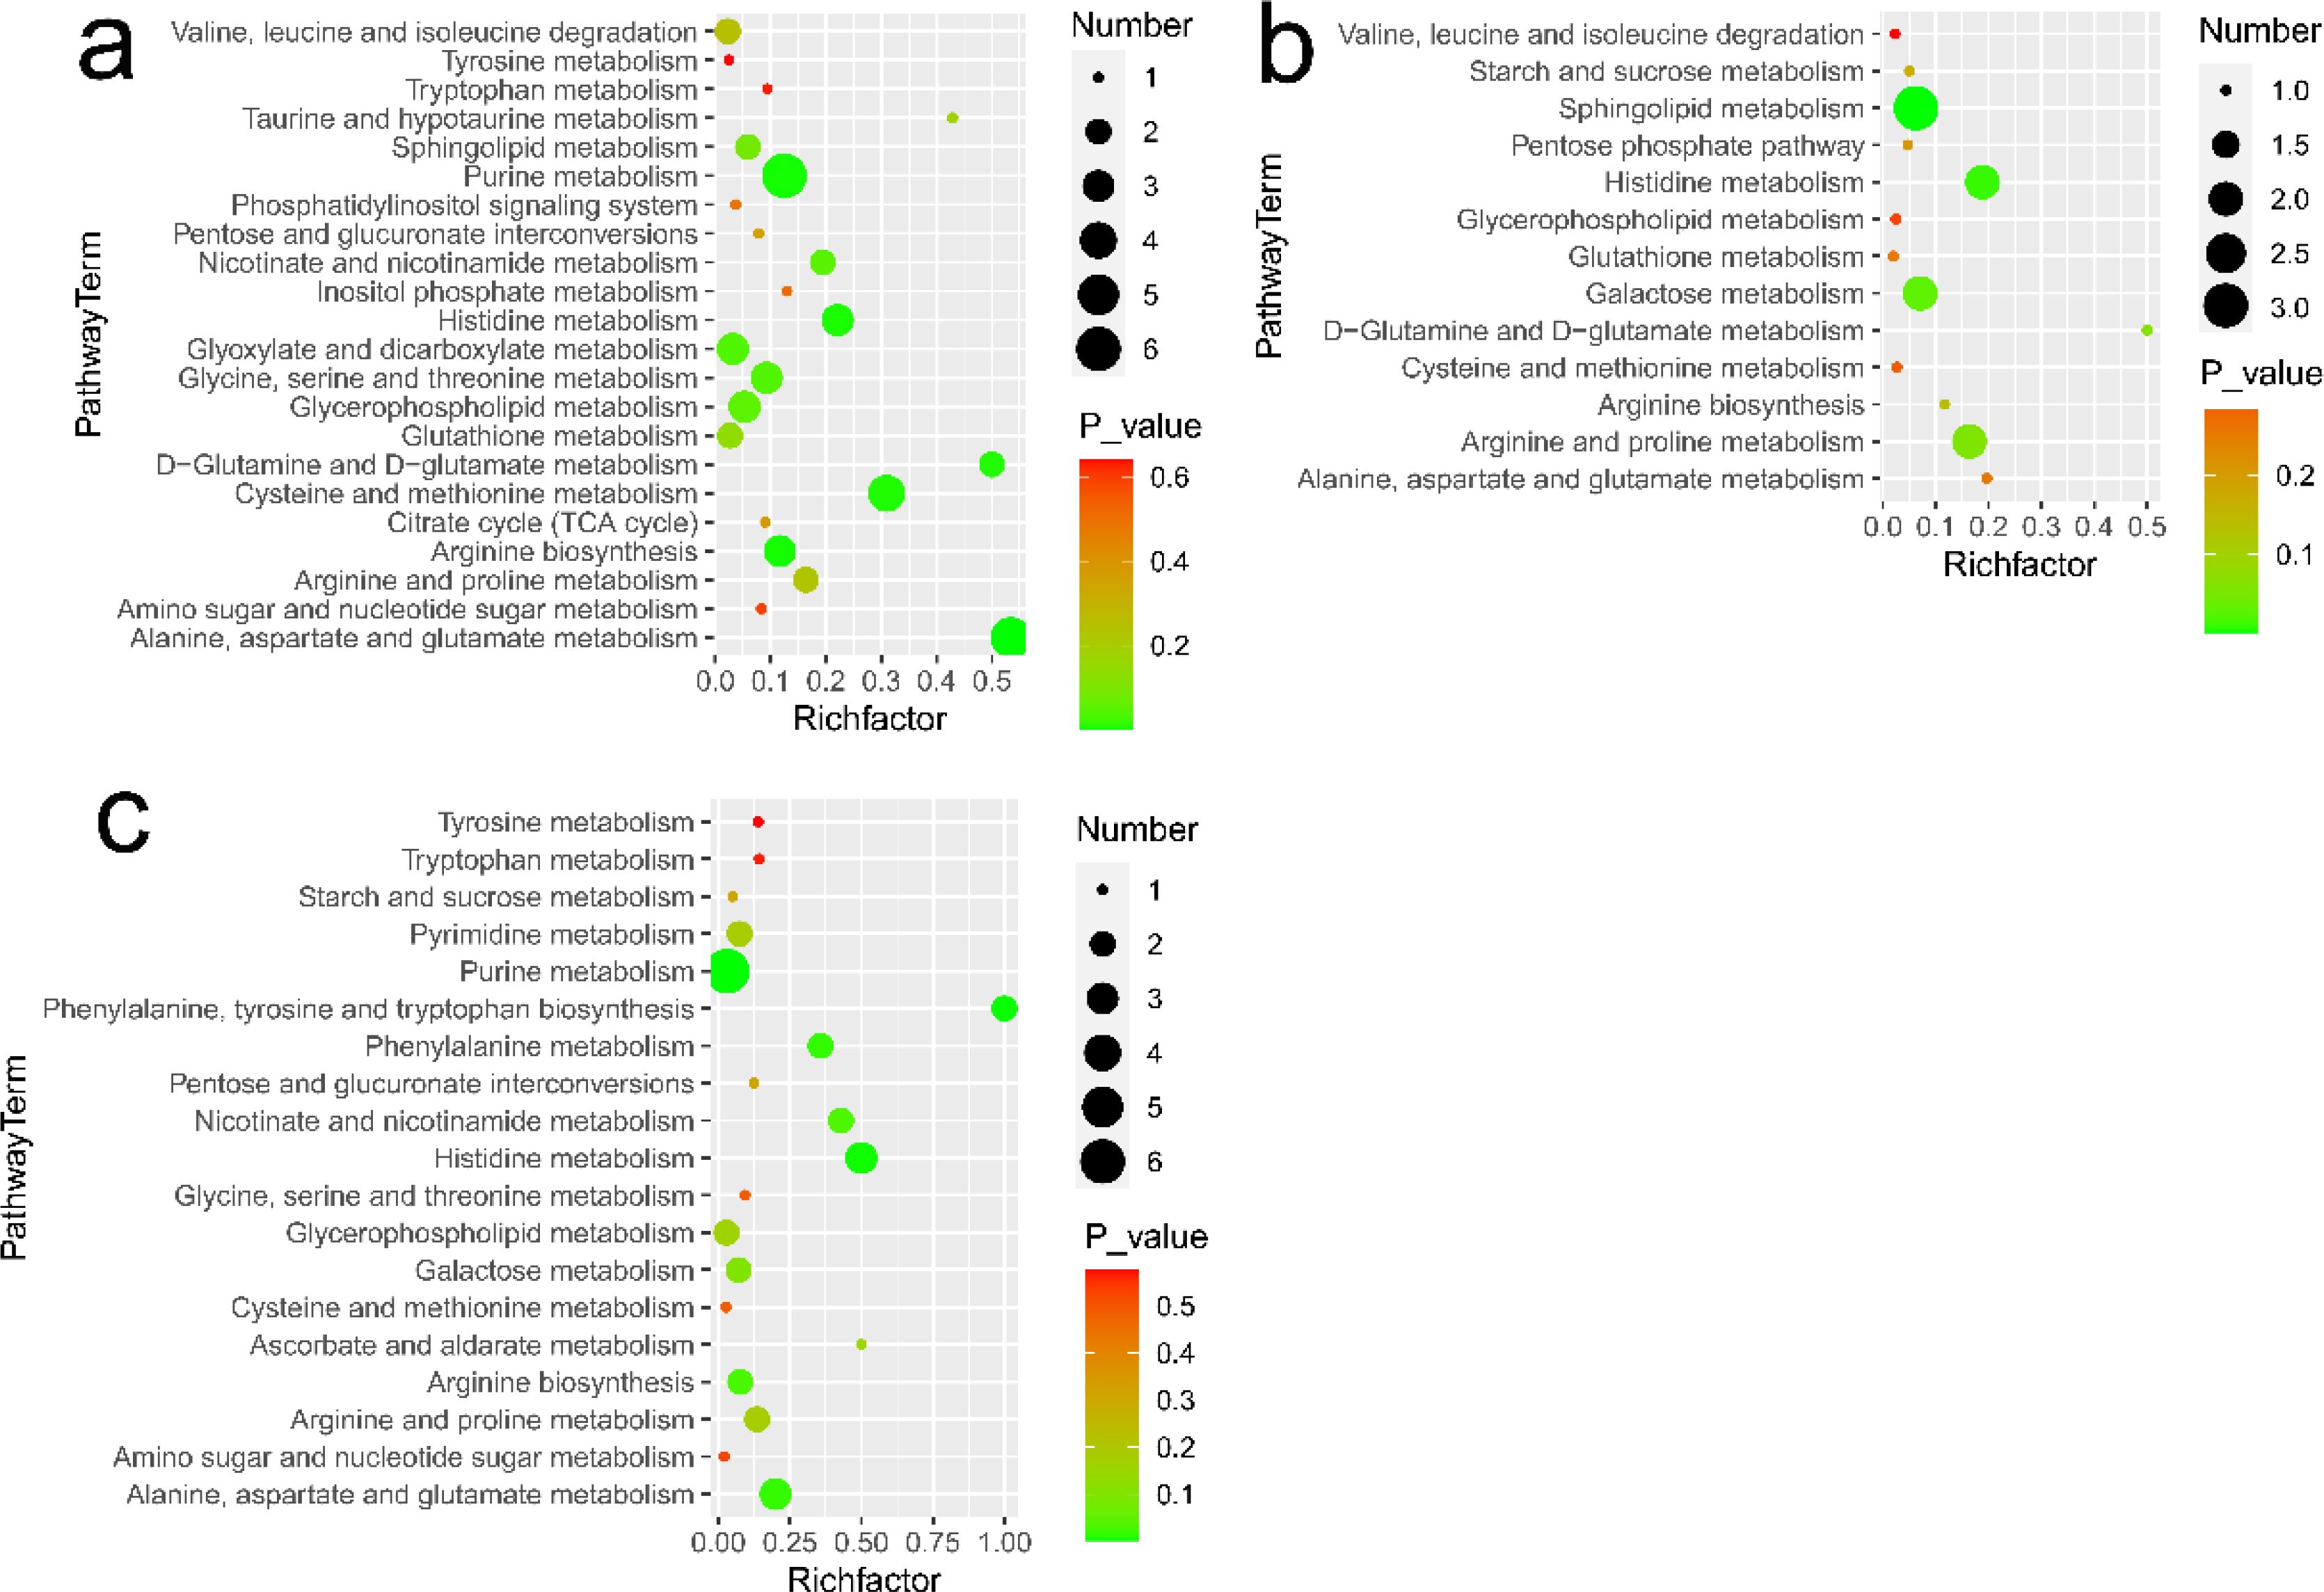
Figure 5. Metabolic pathways analysis in different comparisons: (A) for lymphoma versus benign groups, (B) for metastasis versus lymphoma groups, and (C) for metastasis versus benign groups. Number represents the number of metabolites matched from the data and P-value represents P value calculated from pathway analysis.
3.5 Linear discriminant analysis
Linear discriminant analysis coupled with ultrasonography indices or metabolites with significant difference was used to differentiate superficial lymph nodes. Two discriminant functions were developed, where the first one was used to differentiate benign groups from all samples, while the second one focused on distinguishing between lymphoma and metastasis groups. For ultrasonography, 77.1% of benign nodes, 66.7% of lymphoma nodes and 64.5% of metastasis nodes in the training set were correctly classified (Table 2). Lymphoma and metastasis nodes were commonly misclassified as one another, with 23.7% of lymphoma nodes incorrectly classified as metastasis and 31.5% of metastasis nodes misclassified as lymphoma. Overall, 68.6% of all nodes were accurately classified using linear discriminant analysis and ultrasonography.
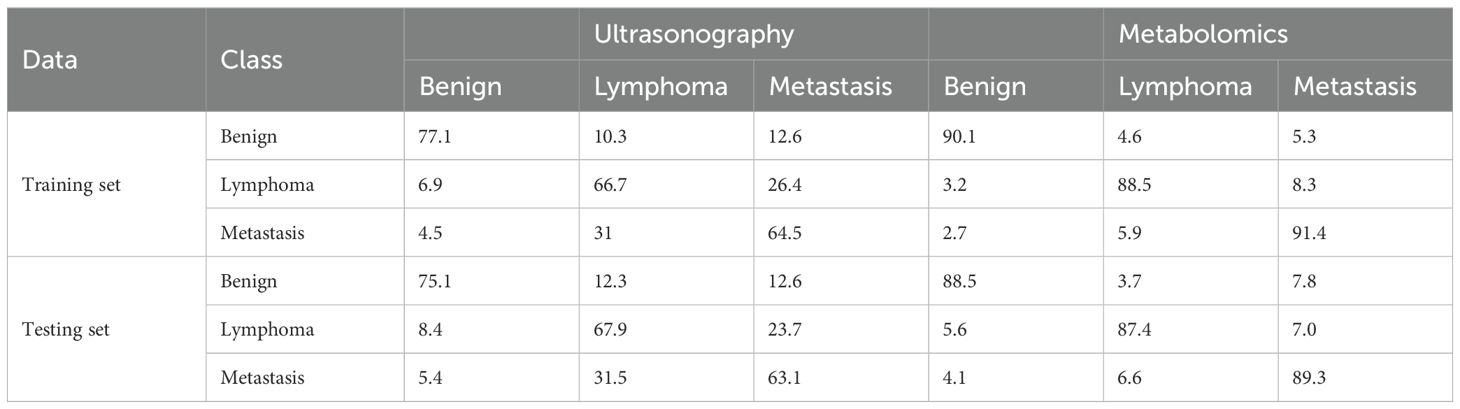
Table 2. Diagnostic rates of LDA with ultrasonography and metabolomics.
There existed many metabolites with significant difference among three groups. However, too many variables could negatively impact the performance of diagnostic models. Additionally, building model based on a great number of metabolites may hinder practical applications. Therefore, it is essential to select a subset of important metabolites for modeling. Random forest is a commonly used method for variable selection in metabolomics. The top 20 important metabolites for distinguishing superficial lymph nodes based on Mean Decrease Accuracy in Random forest (Figure 6). These include 5 amino acids (glutamic acid, glutamine, asparagine, lysine and pyroglutamic acid), 8 lipids [CAR 14:1, CAR 15:0, CAR 20:0, PC (16:0/16:1), PE (12:0/18:3), PI (16:0/16:1), PI (16:0/18:2) and PI (18:2/18:2)], 3 organic acids (methylmalonic acid, p-hydroxybenzoic acid and pipecolic acid), and 3 alkaloids (O-phosphoethanolamine, carnitine and phosphocholine). Linear discriminant analysis coupled with these 20 metabolites showed that 90.1% of benign nodes, 88.5% of lymphoma nodes and 91.4% of metastasis nodes in the training set were correctly classified. In the testing set, the diagnostic efficiency of metabolomics was acceptable, where 88.5% of benign nodes, 87.4% of lymphoma nodes and 89.3% of metastasis nodes in the training set were correctly classified. The diagnostic accuracy of superficial lymph nodes in the training set were comparable to that in testing set, suggesting that the models developed were robust and did not exhibit overfitting. Overall, 88.3% of all nodes were correctly classified using metabolomics, which was much higher than that of ultrasonography (68.6%).
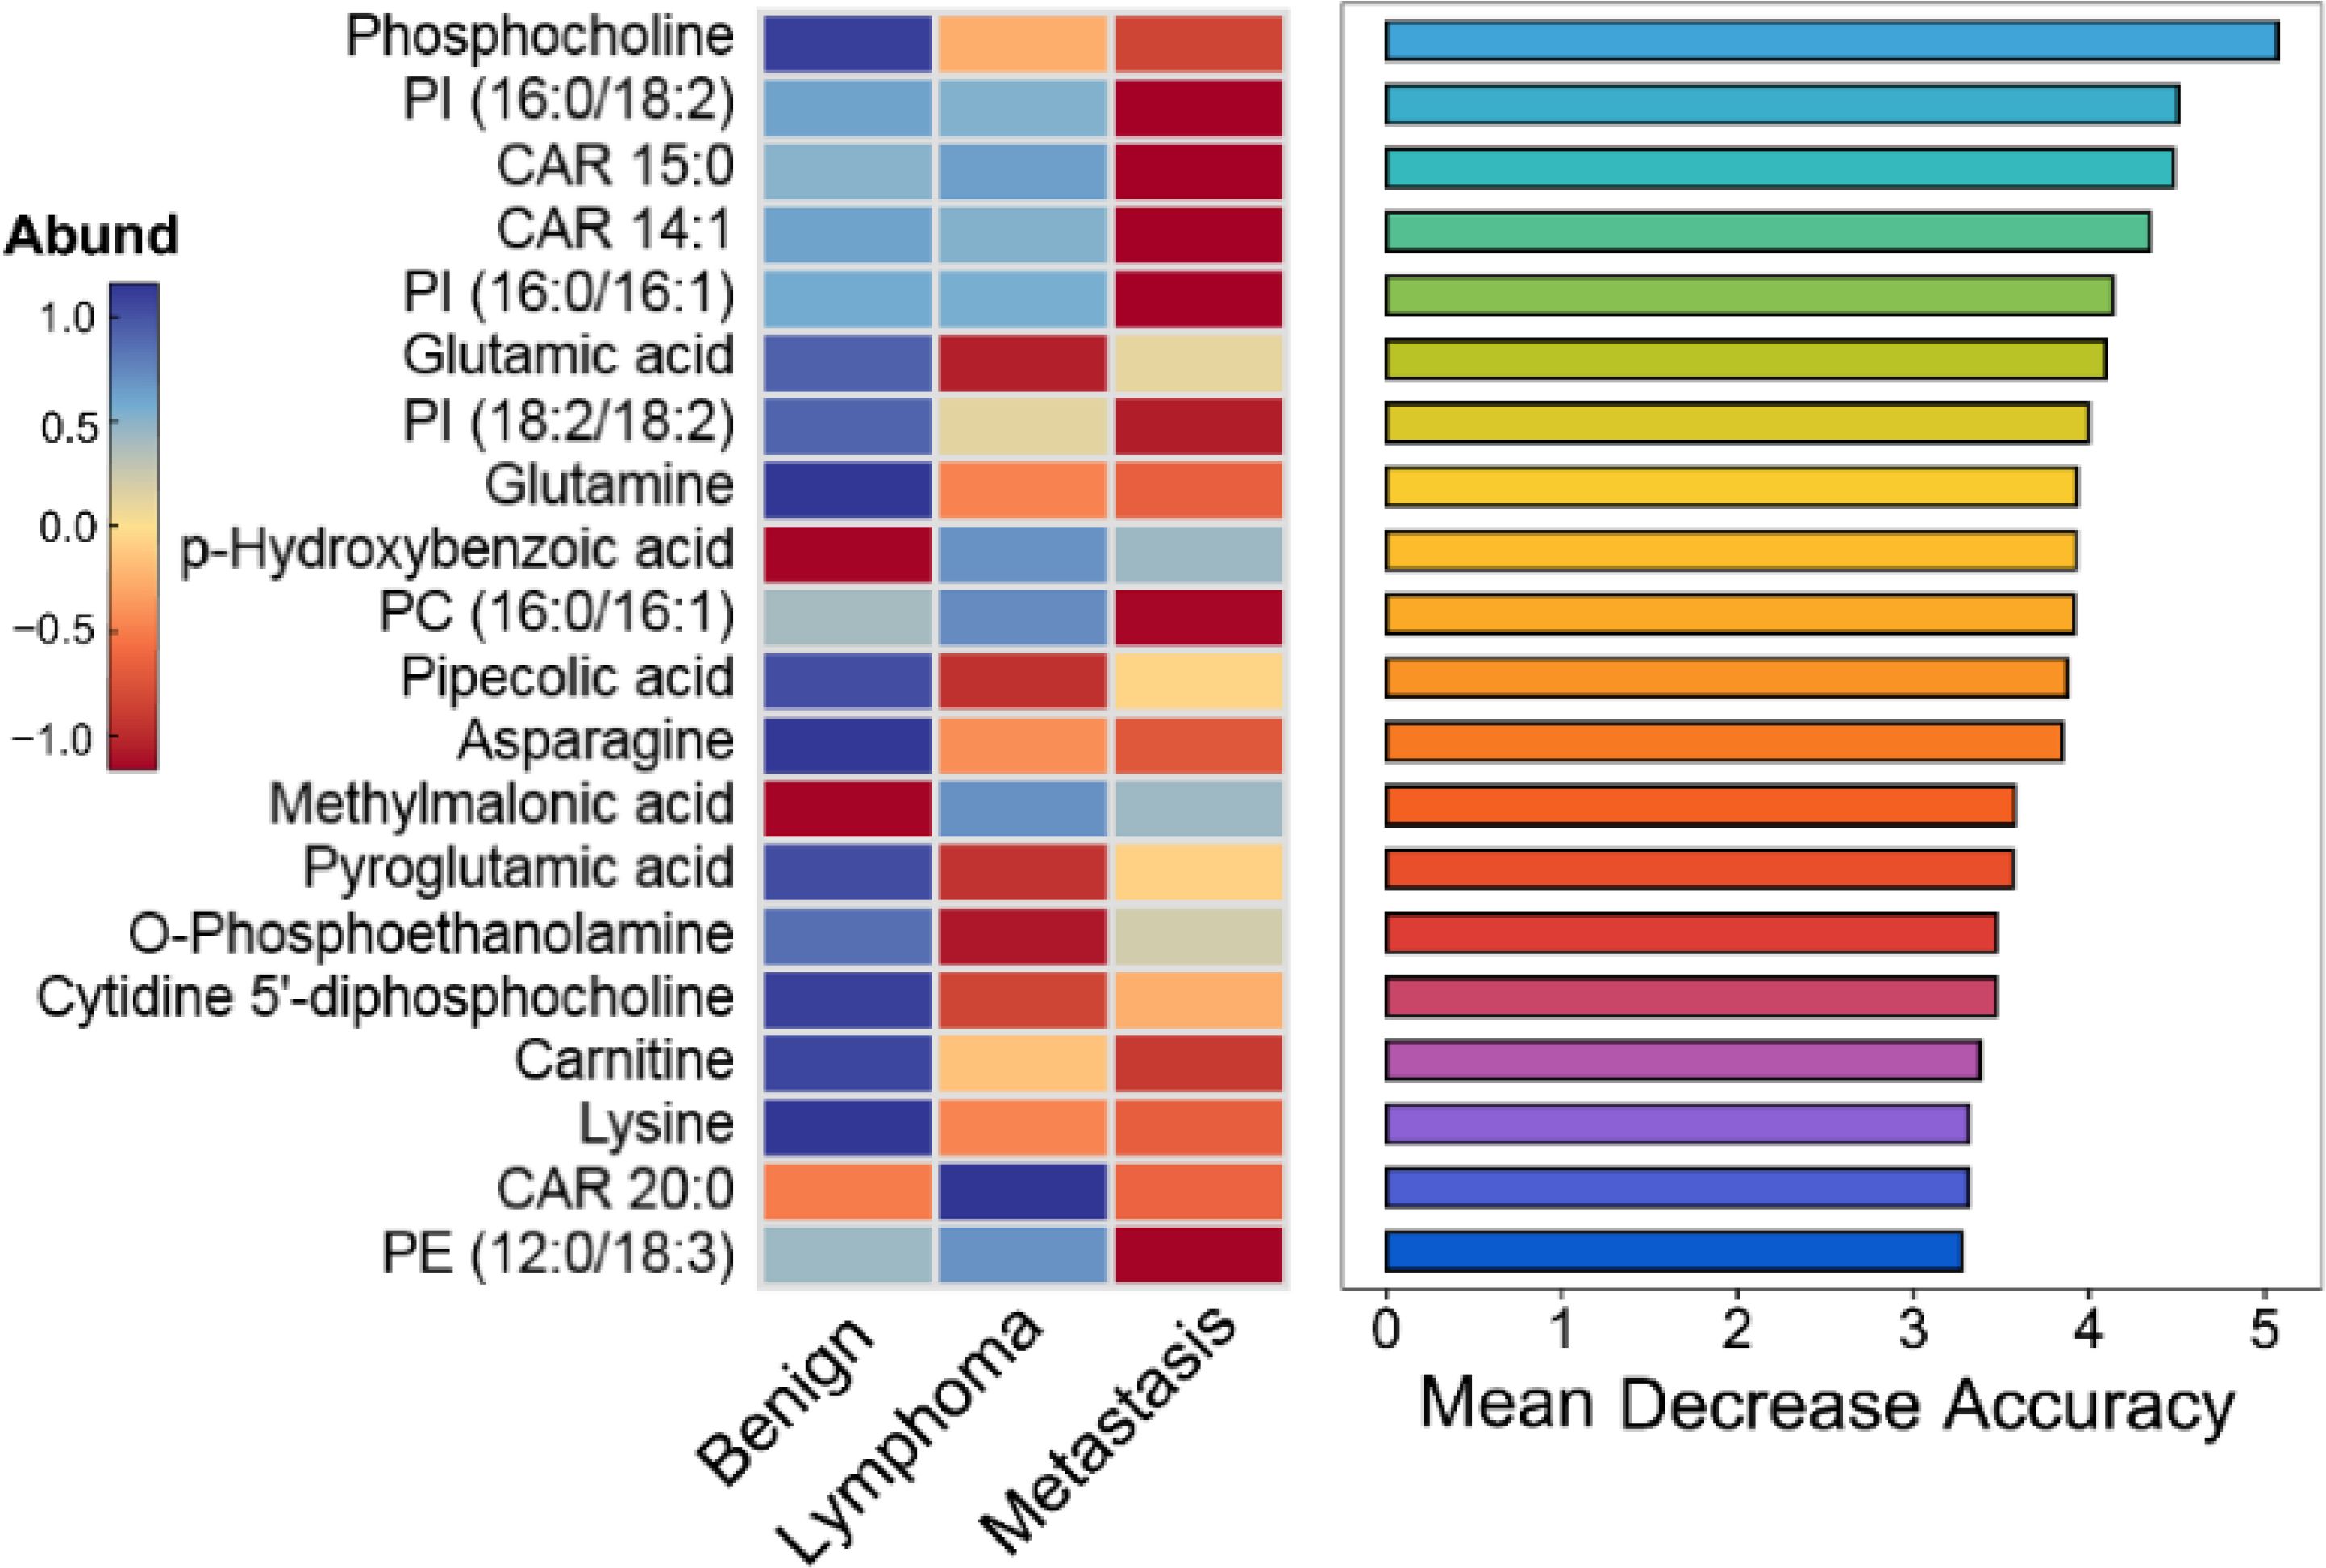
Figure 6. Top 20 important metabolites identified by the Mean Decrease Accuracy of random forest analysis for distinguishing different superficial lymph nodes.
3.6 Correlation analysis between ultrasound features and metabolites
Pearson’s coefficient was used to determine the correlations of identified metabolites with ultrasound features and patient indices (age and gender). To simplify interpretation, the P-value was limited to a low of 0.05. Our results showed that many metabolites were significantly correlated with patient indices and ultrasound features. 366 significant correlations were detected, of which 343 were positive and 23 were negative (Figure 7). There existed 25, 26, 27, 27, 36, 21, 47, 37, and 13, correlated with age, short diameter, shape, cortex elasticity, blood flow mode, hilus, cortical echo, corticomedullary boundary and calcification, respectively. Specifically, many CARs, such as CAR 16:0, CAR 16:1 and CAR 18:0, were positively correlated with short diameter, shape, cortex elasticity, blood flow mode, hilum, cortical echo and corticomedullary boundary. Many PIs, such as PI (16:0/18:2), PI (16:0/20:3), PI (16:0/22:6), PI (16:1/18:1) and PI (18:0/18:3), were positively correlated with blood flow mode and cortical echo. Eight PGs, such as PG (18:2/20:4), PG (18:2/20:3) and PG (20:4/22:4), were significantly positively with calcification. For carbohydrates, sucrose, gentiobiose and melezitose were positively correlated with shape and cortical echo, and glucose was positively correlated with corticomedullary boundary. Some amino acids, such as N-acetylneuraminic acid, tryptophan and valine, were positively correlated with cortical echo. Asparagine, trigonelline, proline, phosphocholine, sarcosine, UDP-N-acetylglucosamine were positively correlated with age (r > 0.3, P < 0.05).
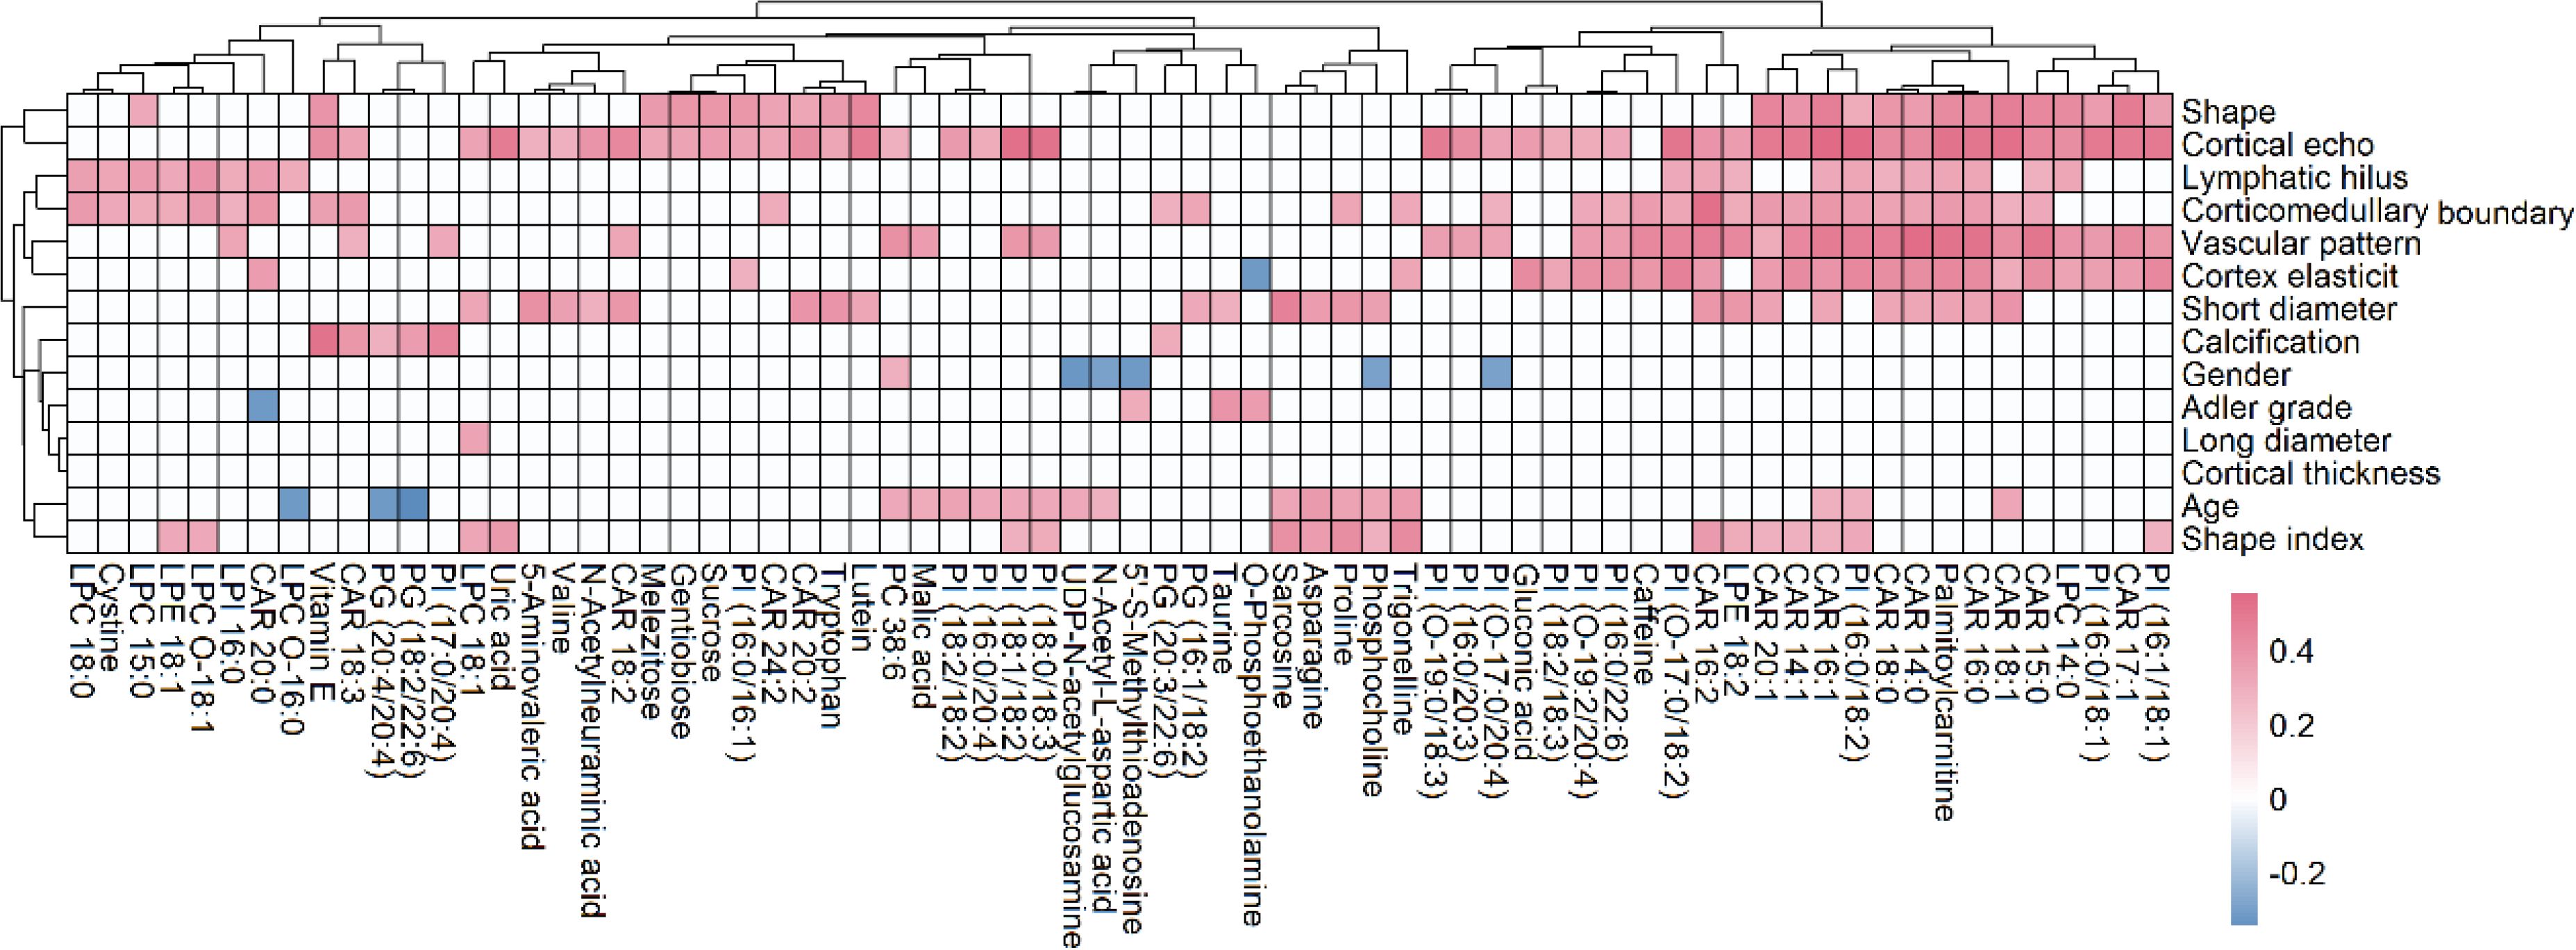
Figure 7. Correlation analysis of metabolites with ultrasound features and patient indices (age and gender), where the metabolites with more than 2 significant correlations were shown. The red and blue blocks represent significant positive and negative correlations (P < 0.05), respectively, and the white color indicates metabolites with no significant correlation (P > 0.05).
4 Discussion
Conventional ultrasound is considered to be the first choice for evaluating lymph node diseases due to its high resolution (5). Although different lymph node lesions have characteristic signs on ultrasound images, there are some overlapping images of different pathological types of lymph nodes. For example, both inflammatory and lymphatic cancers may be enlarged, spherical, and often irregularly outlined (6). Therefore, the pathological diagnosis of lymph nodes is still a challenging subject in ultrasound diagnosis (15). Our results showed that age, vascular pattern and cortical echo could be applied to distinguish malignant and benign lymph nodes and shape, cortex elasticity and corticomedullary boundary was important variance to distinguish metastasis and lymphoma groups. Our finding was in line with the result of Cui et al. (5). An echopoor in the lymph node cortex may indicate lymphoma, whereas a hyper echo in cortical may indicate metastasis lymph nodes. Peripheral or mixed vascularity mode suggested malignant lymph nodes, however, lymphoma lymph nodes could remain mixed vascularity or high flow hilar vascularity.
Metabolomics reveals differences in the metabolic profiles of the three groups of lymph node tissue (Figure 2A), which may indicate that cancer cells could change their metabolism for rapid proliferation and expansion. Amino acids are not only the building blocks of proteins, but also play a regulatory role in key metabolic cascades, gene expression and intercellular communication in human’s cells (16). Our results showed that compared to the benign group, the metastasis and lymphoma groups are characterized by higher levels of many amino acids, such as glutamine, asparagine, histidine, lysine, methionine, devaline, threonine, and valine. It has been reported that many amino acids can be absorbed into tumor tissues from non-cancer cells adjacent through cell surface transporters (17, 18). These increase amino acids could support cell growth and metabolism of malignant lymph nodes, not only aiding in protein biosynthesis, but also helping to maintain redox balance as an energy source in addition to glucose (16). For example, in malignant lymph nodes, glutamine could drive the citrate cycle to maintain mitochondrial ATP production and act as a carbon and nitrogen donor for purine biosynthesis (19). Methionine can affect the epigenetic state of cancer cells and promote the development of tumors (20). There is growing evidence that amino acid restriction can inhibit cancer cell growth and may improve the efficacy of chemotherapeutic agents (21). Glutamic acid and pyroglutamic acid increased significantly in the metastasis group, about twice as much as in the benign and lymphoma groups. Glutamic acid could be used as bioenergy substrate for cell growth (22, 23) and pyroglutamic acid, involved in the metabolism of glutathione, could produce glutamic acid via 5-oxproline enzyme (24). This finding suggested that the lymphoma group is more dependent on glutamate metabolism than the metastasis group. Other three amino acids, N-acetyl-L-aspartic acid, N-acetylneuraminic acid and tryptophan, were additionally accumulated in metastasis groups, compared to the other two groups, most of which have a prominent role in cancer growth and participates in the immunosuppressive effects (25, 26). The three amino acids could act potential biomarkers for diagnosis and therapy of metastasis superficial lymph nodes. Histamine, a biogenic amine synthesized from histidine, was significantly accumulated in metastasis groups, about 3 times as much as in the benign and lymphoma groups (27). This suggested that histamine might be involved in metastasis carcinogenesis. Our finding was in line with precious results that some human cancers such as ovarian, cervical, and endometrial cancers have high histamine levels compared to adjacent normal tissues (19). It has been reported that most malignant cell lines express their own histamine-synthesizing enzyme to enhance the level of endogenous histamine, which could be released into the space between cells (27). The above data indicated that histamine may be a crucial mediator in the development and progression of metastasis superficial lymph nodes and should be a good target for the cancer therapy.
Organic acids play key roles in many intracellular metabolic pathways, such as amino acid synthesis and metabolism, glycolytic metabolism, and cholesterol biosynthesis (28). Four organic acids, including malic acid, citric acid, pipecolic acid and P-aminobenzoic acid, were increased in both lymphoma and metastasis groups, compared to benign groups. Among them, malic acid and citric acid are intermediate metabolites in the citrate cycle, which can produce cell energy and precursors of biosynthetic pathways (29). Pipecolic acid is a minor metabolite of lysine catabolism (30). These findings suggest that both lymphoma and metastasis superficial lymph nodes lead to abnormal metabolism of lysine and citrate cycle, which may be a common biomarker for malignant lymph node therapy. Besides, uric acid, 5-aminovaleric acid and benzoic acid were additionally accumulated in metastasis groups, all of which have been reported as biomarker in cancer cells (31–34). In particular, uric acid is a degradation product of purines that was common chemical compound found in foods and drinks (35). When tumor cells occurred DNA-damaged, tumor cells also lead uric acid accumulation, due to its antioxidant function. However, as the uric acid levels increased, the risk of cancer might be raised (36, 37). Methylmalonic acid, a metabolic intermediate in the biosynthesis of succinic acid from propionic acid (38), were additionally decreased in lymphoma groups compared to the other groups, and could act as a potential biomarker for diagnosis lymphoma.
Carbohydrates are the main source of energy in most human diets (39). Our results showed that glucose levels in both the metastasis and lymphoma groups were significantly higher than those in the benign group, suggesting abnormal glucose metabolism in the malignant lymph nodes (40). The finding is consistent with previous reports that cancer cells need more glucose than normal cells (41). In general, cancer cells usually survive in low-oxygen environments because they overgrow and become dense (42). However, cancer cells are less efficient at breaking down sugars in a hypoxic state than in aerobic conditions, making them require more glucose to produce energy for survival and proliferation (43). Besides, other four carbohydrates, sucrose, gentiobiose, raffinose, and melezitose, were additionally accumulated in metastasis groups, compared to the other two groups, which could act as a potential biomarker for diagnosis of metastasis lymph nodes. Our finding was partly supported by precious studies that sucrose can be used to distinguish papillary thyroid cancer and multinodular goiter (44). Correlation analysis revealed that four carbohydrates may have effect on the shape of lymph nodes. Recent studies have proven that higher carbohydrate intake not only speeds up the absorption of carbohydrates by cancer cells, but also stimulates rapid cancer cell reproduction (39). These data suggest that the occurrence of metastasis cancer may be related to excessive carbohydrate intake.
Lipids are not only important components of cell membranes, but also participate in many biological functions such as energy storage and signaling (44, 45). Our results showed that 95 lipids showed significant changes among different kinds of lymph nodes, mainly including fatty acids, lysophospholipids, glycerophospholipids and acylcarnitines. Many lipids increased in metastasis and lymphoma groups compared to benign groups, which may be due to the increased uptake or synthesis of lipids in the cancer cell to meet the demand of the high nutrient and energy needs during cancer growth progression (46, 47). This suggested that both lymphoma and metastasis superficial lymph nodes had abnormal lipid metabolism. Besides, our result revealed that the metastasis group was characterized by higher levels of CAR, PI and PG. CAR facilitates the transportation of fatty acids into the mitochondria and higher levels of CAR may indicate an elevated level of lipid oversupply in the metastasis group (48). High levels of PG may indicate mitochondrial dysfunction and enhanced invasion ability of metastasis cells (49). Additionally, some metabolite related to glycerophospholipid metabolism was found, among which phosphocholine, CDP-choline, acetyl-L-Carnitine and carnitine were increased in both lymphoma and metastasis groups, compared to benign groups. Taken together, our results reveal differences of lipid synthesis and metabolism in different kinds of malignant lymph nodes and these lipids and their associated metabolites with significant change could be used as potential diagnostic and therapeutic targets. Correlation analysis also revealed that the levels of 8 PIs were significantly correlated with the calcification of lymph nodes. This finding was in line with precious studies that PI3K/AKT pathways phosphorylating PI is closely related to vascular calcification, osteogenesis and osteoclast formation (50). Besides, many CAR and PI were positively correlated with shape, blood flow mode, cortical echo and corticomedullary boundary and these relationships require further proof.
Nucleotide metabolism plays an important role in cancer progression (51). Our results showed that many nucleosides were increased in both lymphoma and metastasis groups compared to benign groups, including two purines (hypoxanthine and guanine) and four nucleotides (adenosine 3’-monophosphate, UDP-D-glucose, UDP-N-acetylglucosamine and flavin adenine dinucleotide). Most of them could be beneficial for rapid cancer cell proliferation (52–54). For example, both hypoxanthine and guanine can replenish the purine pool of proliferative cancer cells (55). UDP-N-acetylglucosamine is produced through the hexosamine biosynthesis pathway, which promotes rapid tumor growth (56). The increase of this metabolite may indicate activation of the hexosamine-biosynthetic pathway in malignant tissues (57). Besides, other three nucleotides, guanosine monophosphate, adenosine diphosphate and inosine monophosphate, were additionally accumulated in metastasis groups, compared to the other groups and inosine monophosphate has the greatest increase at more 3-folds. Inosine monophosphate plays a central role in purine metabolism in cells and acts as a precursor to the synthesis of adenosine monophosphate and guanosine monophosphate, suggesting that inosine monophosphate could act as potential biomarkers for diagnosis and therapy of lymphoma lymph nodes (58). Additionally, two metabolites (guanosine and uracil) were additionally increased at 2-folds in metastasis groups, compared to the other two groups. Guanosine shows the effect of inducing differentiation in cancer cells and uracil is one of the four nucleotide bases in RNA (59). The above data suggested that metastasis lymph nodes have effect of the pathway of guanosine and uracil metabolism.
Linear discriminant analysis showed that the correct diagnosis rate of metabolomics based on random forest for variable selection was much better than that of ultrasonography (63.1%~75.4%). Compared to ultrasound indices, metabolites were more accurate in determining the type of malignant lymph nodes. The finding suggests that metabolomics coupled with linear discriminant analysis could serve as an effective approach for lymph node diagnosis. Furthermore, metabolomics coupled with deep learning models for feature extraction and classification warrants further investigation. However, it is important to note that metabolomics requires tissue sampling, which indicates that the metabolomic approach cannot be used for real-time assessment of lymph nodes. In contrast, ultrasonography is a non-invasive technique, which could effectively monitor the status of lymph nodes in real time. The quantitative analysis of characteristic metabolites in lymph nodes could be developed based on non-destructive methods, such as spectroscopy and ultrasonography. Furthermore, incorporating key metabolites into the ultrasonography model may enhance the diagnostic accuracy in disease detection.
5 Conclusion
In the present study, we evaluated the differences in benign, lymphoma and metastasis superficial lymph nodes using ultrasonography and metabolomics. Via metabolomics, we observed significant increases in many amino acids, organic acids, lipids, and nucleosides in both the lymphoma and metastasis groups, compared to the benign group. Specifically, the lymphoma group exhibited higher levels of nucleotides (inosine monophosphate, guanosine monophosphate, and adenosine diphosphate) as well as glutamic acid and the metastasis group was characterized by higher levels of carbohydrates, acylcarnitines, glycerophospholipids, uric acid, and 5-aminovaleric acid. The correct diagnosis rate of these metabolites for differentiating superficial lymph nodes ranged from 87.4% to 89.3%, which is more effective than ultrasound indicators. This study is limited by its small sample size and the absence of an external validation set. Future research will focus on increasing the sample size and validating the clinical significance of the identified potential biomarkers. Additionally, we will investigate the metabolic changes occurring in lymph nodes throughout disease progression.
Data availability statement
The original contributions presented in the study are included in the article/Supplementary Material. Further inquiries can be directed to the corresponding authors.
Ethics statement
Approval of the research protocol by the ethics committee of the first affiliated hospital of Nanjing medical university (Approval number: 2022-SR-292). The studies were conducted in accordance with the local legislation and institutional requirements. The participants provided their written informed consent to participate in this study.
Author contributions
LL: Conceptualization, Investigation, Writing – original draft. XW: Software, Writing – original draft, Validation. HD: Writing – original draft, Software. WL: Writing – original draft, Investigation. YZ: Writing – original draft, Data curation. XY: Writing – original draft, Methodology. YL: Writing – review & editing, Writing – original draft. JW: Conceptualization, Methodology, Writing – review & editing.
Funding
The author(s) declare financial support was received for the research, authorship, and/or publication of this article. This research was financially supported by the National Natural Science Foundation of China (Grant NO. 32272583).
Conflict of interest
The authors declare that the research was conducted in the absence of any commercial or financial relationships that could be construed as a potential conflict of interest.
Generative AI statement
The author(s) declare that no Generative AI was used in the creation of this manuscript.
Publisher’s note
All claims expressed in this article are solely those of the authors and do not necessarily represent those of their affiliated organizations, or those of the publisher, the editors and the reviewers. Any product that may be evaluated in this article, or claim that may be made by its manufacturer, is not guaranteed or endorsed by the publisher.
Supplementary material
The Supplementary Material for this article can be found online at: https://www.frontiersin.org/articles/10.3389/fonc.2025.1510018/full#supplementary-material
References
1. Ahuja AT, Ying M, Ho SY, Antonio G, Lee YP, King AD, et al. Ultrasound of Malignant cervical lymph nodes. Cancer Imaging. (2008) 8:48–56. doi: 10.1102/1470-7330.2008.0006
2. Nakamura T, Sumi M. Nodal imaging in the neck: recent advances in US, CT and MR imaging of metastatic nodes. Eur Radiol. (2007) 17:1235–41. doi: 10.1007/s00330-006-0490-0
3. Sumi M, Ohki M, Nakamura T. Comparison of sonography and CT for differentiating benign from Malignant cervical lymph nodes in patients with squamous cell carcinoma of the head and neck. AJR Am J Roentgenol. (2001) 176:1019–24. doi: 10.2214/ajr.176.4.1761019
4. Fleischman GM, Thorp BD, Difurio M, Hackman TG. Accuracy of ultrasonography-guided fine-needle aspiration in detecting persistent nodal disease after chemoradiotherapy. JAMA Otolaryngol Head Neck Surg. (2016) 142:377–82. doi: 10.1001/jamaoto.2015.3934
5. Cui XW, Hocke M, Jenssen C, Ignee A, Klein S, Schreiber-Dietrich D, et al. Conventional ultrasound for lymph node evaluation, update 2013. Z Gastroenterol. (2014) 52:212–21. doi: 10.1055/s-0033-1356153
6. Białek EJ, Jakubowski W. Mistakes in ultrasound diagnosis of superficial lymph nodes. J Ultrason. (2017) 17:59–65. doi: 10.15557/JoU.2017.0008
7. Gupta A, Rahman K, Shahid M, Kumar A, Qaseem SM, Hassan SA, et al. Sonographic assessment of cervical lymphadenopathy: role of high-resolution and color Doppler imaging. Head Neck. (2011) 33:297–302. doi: 10.1002/hed.21448
8. Ito K, Yoshida K, Maruyama H, Mamou J, Yamaguchi T. Acoustic impedance analysis with high-frequency ultrasound for identification of fatty acid species in the liver. Ultrasound Med Biol. (2017) 43:700–11. doi: 10.1016/j.ultrasmedbio.2016.11.011
9. Fadhel MN, Berndl ES, Strohm EM, Kolios MC. High-frequency acoustic impedance imaging of cancer cells. Ultrasound Med Biol. (2015) 41:2700–13. doi: 10.1016/j.ultrasmedbio.2015.06.003
10. Schrimpe-Rutledge AC, Codreanu SG, Sherrod SD, McLean JA. Untargeted metabolomics strategies-challenges and emerging directions. J Am Soc Mass Spectrom. (2016) 27:1897–905. doi: 10.1007/s13361-016-1469-y
11. Bujak R, Struck-Lewicka W, Markuszewski MJ, Kaliszan R. Metabolomics for laboratory diagnostics. J Pharm BioMed Anal. (2015) 113:108–20. doi: 10.1016/j.jpba.2014.12.017
12. Jacob M, Lopata AL, Dasouki M, Abdel Rahman AM. Metabolomics toward personalized medicine. Mass Spectrom Rev. (2019) 38:221–38. doi: 10.1002/mas.21548
13. Schmidt JA, Fensom GK, Rinaldi S, Scalbert A, Appleby PN, Achaintre D, et al. Pre-diagnostic metabolite concentrations and prostate cancer risk in 1077 cases and 1077 matched controls in the European Prospective Investigation into Cancer and Nutrition. BMC Med. (2017) 15:122. doi: 10.1186/s12916-017-0885-6
14. Wang X, Hao X, Yan J, Xu J, Hu D, Ji F, et al. Urine biomarkers discovery by metabolomics and machine learning for Parkinson’s disease diagnoses. Chin Chem Lett. (2023) 34:108230. doi: 10.1016/j.cclet.2023.108230
15. Golder WA. Lymph node diagnosis in oncologic imaging: a dilemma still waiting to be solved. Onkologie. (2004) 27:194–9. doi: 10.1159/000076912
16. Lieu EL, Nguyen T, Rhyne S, Kim J. Amino acids in cancer. Exp Mol Med. (2020) 52:15–30. doi: 10.1038/s12276-020-0375-3
17. Dunphy MPS, Harding JJ, Venneti S, Zhang H, Burnazi EM, Bromberg J, et al. In vivo PET assay of tumor glutamine flux and metabolism: in-human trial of (18)F-(2S,4R)-4-fluoroglutamine. Radiology. (2018) 287:667–75. doi: 10.1148/radiol.2017162610
18. Fuchs BC, Bode BP. Amino acid transporters ASCT2 and LAT1 in cancer: partners in crime? Semin Cancer Biol. (2005) 15:254–66. doi: 10.1016/j.semcancer.2005.04.005
19. Li T, Le A. Glutamine metabolism in cancer. Adv Exp Med Biol. (2018) 1063:13–32. doi: 10.1007/978-3-030-65768-0_2
20. Wanders D, Hobson K, Ji X. Methionine restriction and cancer biology. Nutrients. (2020) 12:684. doi: 10.3390/nu12030684
21. Chaturvedi S, Hoffman RM, Bertino JR. Exploiting methionine restriction for cancer treatment. Biochem Pharmacol. (2018) 154:170–3. doi: 10.1016/j.bcp.2018.05.003
22. Jara CP, de Andrade Berti B, Mendes NF, Engel DF, Zanesco AM, Pereira de Souza GF, et al. Glutamic acid promotes hair growth in mice. Sci Rep. (2021) 11:15453. doi: 10.1038/s41598-021-94816-y
23. Gruenbaum BF, Merchant KS, Zlotnik A, Boyko M. Gut microbiome modulation of glutamate dynamics: Implications for brain health and neurotoxicity. Nutrients. (2024) 16:4405. doi: 10.3390/nu16244405
24. Turathum B, Gao EM, Yang F, Liu YB, Yang ZY, Liu CC, et al. Role of pyroglutamic acid in cumulus cells of women with polycystic ovary syndrome. J Assist Reprod Genet. (2022) 39:2737–46. doi: 10.1007/s10815-022-02647-1
25. O’Day EM, Idos GE, Hill C, Chen JW, Wagner G. Cytidine monophosphate N-acetylneuraminic acid synthetase enhances invasion of human triple-negative breast cancer cells. Onco Targets Ther. (2018) 11:6827–38. doi: 10.2147/ott.s177639
26. Wang F, Gu Z, Zhao X, Chen Z, Zhang Z, Sun S, et al. Metabolic characteristics of the various incision margins for breast cancer conservation surgery. Front Oncol. (2022) 12:959454. doi: 10.3389/fonc.2022.959454
27. Sarasola MP, Táquez Delgado MA, Nicoud MB, Medina VA. Histamine in cancer immunology and immunotherapy. Current status and new perspectives. Pharmacol Res Perspect. (2021) 9:e00778. doi: 10.1002/prp2.778
28. Burgess K, Creek D, Dewsbury P, Cook K, Barrett MP. Semi-targeted analysis of metabolites using capillary-flow ion chromatography coupled to high-resolution mass spectrometry. Rapid Commun Mass Spectrom. (2011) 25:3447–52. doi: 10.1002/rcm.v25.22
29. Shao Y, Ye G, Ren S, Piao HL, Zhao X, Lu X, et al. Metabolomics and transcriptomics profiles reveal the dysregulation of the tricarboxylic acid cycle and related mechanisms in prostate cancer. Int J Cancer. (2018) 143:396–407. doi: 10.1002/ijc.v143.2
30. Cao LL, Han Y, Wang Y, Pei L, Yue Z, Qin L, et al. Metabolic profiling identified a novel biomarker panel for metabolic syndrome-positive hepatocellular cancer. Front Endocrinol (Lausanne). (2021) 12:816748. doi: 10.3389/fendo.2021.816748
31. Feng Y, Fu M, Guan X, Wang C, Yuan F, Bai Y, et al. Uric acid mediated the association between BMI and postmenopausal breast cancer incidence: A bidirectional mendelian randomization analysis and prospective cohort study. Front Endocrinol (Lausanne). (2021) 12:742411. doi: 10.3389/fendo.2021.742411
32. Haikonen R, Kärkkäinen O, Koistinen V, Hanhineva K. Diet- and microbiota-related metabolite, 5-aminovaleric acid betaine (5-AVAB), in health and disease. Trends Endocrinol Metab. (2022) 33:463–80. doi: 10.1016/j.tem.2022.04.004
33. Bisht V, Nash K, Xu Y, Agarwal P, Bosch S, Gkoutos GV, et al. Integration of the microbiome, metabolome and transcriptomics data identified novel metabolic pathway regulation in colorectal cancer. Int J Mol Sci. (2021) 22:5763. doi: 10.3390/ijms22115763
34. Eroglu EC, Kucukgoz Gulec U, Vardar MA, Paydas S. GC-MS based metabolite fingerprinting of serous ovarian carcinoma and benign ovarian tumor. Eur J Mass Spectrom (Chichester). (2022) 28:12–24. doi: 10.1177/14690667221098520
35. Maiuolo J, Oppedisano F, Gratteri S, Muscoli C, Mollace V. Regulation of uric acid metabolism and excretion. Int J Cardiol. (2016) 213:8–14. doi: 10.1016/j.ijcard.2015.08.109
36. Huang CF, Huang JJ, Mi NN, Lin YY, He QS, Lu YW, et al. Associations between serum uric acid and hepatobiliary-pancreatic cancer: A cohort study. World J Gastroenterol. (2020) 26:7061–75. doi: 10.3748/wjg.v26.i44.7061
37. Wang J, Liu K, Xiao T, Liu P, Prinz RA, Xu X. Uric acid accumulation in DNA-damaged tumor cells induces NKG2D ligand expression and antitumor immunity by activating TGF-β-activated kinase 1. Oncoimmunology. (2022) 11:2016159. doi: 10.1080/2162402X.2021.2016159
38. Gomes AP, Ilter D, Low V, Endress JE, Fernández-García J, Rosenzweig A, et al. Age-induced accumulation of methylmalonic acid promotes tumour progression. Nature. (2020) 585:283–7. doi: 10.1038/s41586-020-2630-0
39. Fadaka A, Ajiboye B, Ojo O, Adewale O, Olayide I. Rosemary Emuowhochere, Biology of glucose metabolization in cancer cells. J Oncol Sci. (2017) 3:45–51. doi: 10.1016/j.jons.2017.06.002
40. Bose S, Le A. Glucose metabolism in cancer. Adv Exp Med Biol. (2018) 1063:3–12. doi: 10.1007/978-3-319-77736-8_1
41. Li Z, Zhang H. Reprogramming of glucose, fatty acid and amino acid metabolism for cancer progression. Cell Mol Life Sci. (2016) 73:377–92. doi: 10.1007/s00018-015-2070-4
42. Graham K, Unger E. Overcoming tumor hypoxia as a barrier to radiotherapy, chemotherapy and immunotherapy in cancer treatment. Int J Nanomed. (2018) 13:6049–58. doi: 10.2147/IJN.S140462
43. Vander Heiden MG, Cantley LC, Thompson CB. Understanding the Warburg effect: the metabolic requirements of cell proliferation. Science. (2009) 324:1029–33. doi: 10.1126/science.1160809
44. Coelho M, Raposo L, Goodfellow BJ, Atzori L, Jones J, Manadas B. The potential of metabolomics in the diagnosis of thyroid cancer. Int J Mol Sci. (2020) 21:5272. doi: 10.3390/ijms21155272
45. Martin-Perez M, Urdiroz-Urricelqui U, Bigas C, Benitah SA. The role of lipids in cancer progression and metastasis. Cell Metab. (2022) 34:1675–99. doi: 10.1016/j.cmet.2022.09.023
46. Maan M, Peters JM, Dutta M, Patterson AD. Lipid metabolism and lipophagy in cancer. Biochem Biophys Res Commun. (2018) 504:582–9. doi: 10.1016/j.bbrc.2018.02.097
47. Pakiet A, Kobiela J, Stepnowski P, Sledzinski T, Mika A. Changes in lipids composition and metabolism in colorectal cancer: a review. Lipids Health Dis. (2019) 18:29. doi: 10.1186/s12944-019-0977-8
48. Li S, Gao D, Jiang Y. Function, detection and alteration of acylcarnitine metabolism in hepatocellular carcinoma. Metabolites. (2019) 9:36. doi: 10.3390/metabo9020036
49. Mukherjee AG, Wanjari UR, Bradu P, Murali R, Kannampuzha S, Loganathan T, et al. The crosstalk of the human microbiome in breast and colon cancer: A metabolomics analysis. Crit Rev Oncol Hematol. (2022) 176:103757. doi: 10.1016/j.critrevonc.2022.103757
50. Chen X, Chen W, Aung ZM, Han W, Zhang Y, Chai G. LY3023414 inhibits both osteogenesis and osteoclastogenesis through the PI3K/Akt/GSK3 signalling pathway. Bone Joint Res. (2021) 10:237–49. doi: 10.1302/2046-3758.104.BJR-2020-0255.R2
51. Wu HL, Gong Y, Ji P, Xie YF, Jiang YZ, Liu GY. Targeting nucleotide metabolism: a promising approach to enhance cancer immunotherapy. J Hematol Oncol. (2022) 15:45. doi: 10.1186/s13045-022-01263-x
52. Bhanot H, Reddy MM, Nonami A, Weisberg EL, Bonal D, Kirschmeier PT, et al. Pathological glycogenesis through glycogen synthase 1 and suppression of excessive AMP kinase activity in myeloid leukemia cells. Leukemia. (2015) 29:1555–63. doi: 10.1038/leu.2015.46
53. Yin J, Ren W, Huang X, Deng J, Li T, Yin Y. Potential mechanisms connecting purine metabolism and cancer therapy. Front Immunol. (2018) 9:1697. doi: 10.3389/fimmu.2018.01697
54. Yegutkin GG, Boison D. ATP and adenosine metabolism in cancer: exploitation for therapeutic gain. Pharmacol Rev. (2022) 74:797–822. doi: 10.1124/pharmrev.121.000528
55. Galmarini CM, Mackey JR, Dumontet C. Nucleoside analogues and nucleobases in cancer treatment. Lancet Oncol. (2002) 3:415–24. doi: 10.1016/S1470-2045(02)00788-X
56. Lam C, Low JY, Tran PT, Wang H. The hexosamine biosynthetic pathway and cancer: Current knowledge and future therapeutic strategies. Cancer Lett. (2021) 503:11–8. doi: 10.1016/j.canlet.2021.01.010
57. Madama D, Martins R, Pires AS, Botelho MF, Alves MG, Abrantes AM, et al. Metabolomic profiling in lung cancer: A systematic review. Metabolites. (2021) 11:630. doi: 10.3390/metabo11090630
58. Cuny GD, Suebsuwong C, Ray SS. Inosine-5’-monophosphate dehydrogenase (IMPDH) inhibitors: a patent and scientific literature review (2002-2016). Expert Opin Ther Pat. (2017) 27:677–90. doi: 10.1080/13543776.2017.1280463
Keywords: lymph nodes, lymphoma, metastasis, ultrasonography, metabolomics
Citation: Li L, Wang X, Deng H, Lu W, Zhou Y, Ye X, Li Y and Wang J (2025) Discrimination of superficial lymph nodes using ultrasonography and tissue metabolomics coupled with machine learning. Front. Oncol. 15:1510018. doi: 10.3389/fonc.2025.1510018
Received: 12 October 2024; Accepted: 07 January 2025;
Published: 28 January 2025.
Edited by:
Manash K. Paul, Manipal Academy of Higher Education, IndiaReviewed by:
Gour Sundar Mitra Thakur, Dr B C Roy Engineering College, IndiaKousik Kesh, Washington University in St. Louis, United States
Copyright © 2025 Li, Wang, Deng, Lu, Zhou, Ye, Li and Wang. This is an open-access article distributed under the terms of the Creative Commons Attribution License (CC BY). The use, distribution or reproduction in other forums is permitted, provided the original author(s) and the copyright owner(s) are credited and that the original publication in this journal is cited, in accordance with accepted academic practice. No use, distribution or reproduction is permitted which does not comply with these terms.
*Correspondence: Yong Li, bGl5b25nXzIxM0AxNjMuY29t; Jie Wang, bmptdV93YW5namllQDEyNi5jb20=
†These authors share first authorship